J. Stat. Mech. - Purdue University
12
J. Stat. Mech. (2019) 104005 A new exponent in the equilibrium shape of crystal surfaces * Silvio R Dahmen 1,2 and Birgit Wehefritz-Kaufmann 3 1 Instituto de Fisica, Universidade Federal do Rio Grande do Sul, 91501-970 Porto Alegre, Brazil 2 Institut für Philosophie, Literatur-, Wissenschafts- und Technikgeschichte, Technische Universität Berlin, 10623 Berlin, Germany 3 Department of Mathematics and Physics and Astronomy, Purdue University, West Lafayette, IN 47906, United States of America E-mail: [email protected] Received 15 January 2019 Accepted for publication 23 May 2019 Published 9 October 2019 Online at stacks.iop.org/JSTAT/2019/104005 https://doi.org/10.1088/1742-5468/ab2ad2 Abstract. A new exponent characterizing the rounding of crystal facets is found by mapping a crystal surface onto the asymmetric six-vertex model (i.e. with external fields h and v) and using the Bethe ansatz to obtain appropriate expansions of the free energy close to criticality. Leading order exponents in δh, δv are determined along the whole phase boundary and in an arbitrary direction. A possible experimental verification of this result is discussed. Keywords: integrable spin chains and vertex models, surface eects © 2019 IOP Publishing Ltd and SISSA Medialab srl ournal of Statistical Mechanics: J Theory and Experiment * This paper is dedicated in fond remembrance of our PhD advisor Vladimir Rittenberg. 1742-5468/19/104005+12$33.00
Transcript of J. Stat. Mech. - Purdue University

J. Stat. M
ech. (2019) 104005
A new exponent in the equilibrium shape of crystal surfaces*
Silvio R Dahmen1,2 and Birgit Wehefritz-Kaufmann3
1 Instituto de Fisica, Universidade Federal do Rio Grande do Sul, 91501-970 Porto Alegre, Brazil
2 Institut für Philosophie, Literatur-, Wissenschafts- und Technikgeschichte, Technische Universität Berlin, 10623 Berlin, Germany
3 Department of Mathematics and Physics and Astronomy, Purdue University, West Lafayette, IN 47906, United States of America
E-mail: [email protected]
Received 15 January 2019Accepted for publication 23 May 2019 Published 9 October 2019
Online at stacks.iop.org/JSTAT/2019/104005https://doi.org/10.1088/1742-5468/ab2ad2
Abstract. A new exponent characterizing the rounding of crystal facets is found by mapping a crystal surface onto the asymmetric six-vertex model (i.e. with external fields h and v) and using the Bethe ansatz to obtain appropriate expansions of the free energy close to criticality. Leading order exponents in δh, δv are determined along the whole phase boundary and in an arbitrary direction. A possible experimental verification of this result is discussed.
Keywords: integrable spin chains and vertex models, surface eects
S R Dahmen and B Wehefritz-Kaufmann
A new exponent in the equilibrium shape of crystal surfaces
Printed in the UK
104005
JSMTC6
© 2019 IOP Publishing Ltd and SISSA Medialab srl
2019
19
J. Stat. Mech.
JSTAT
1742-5468
10.1088/1742-5468/ab2ad2
10
Journal of Statistical Mechanics: Theory and Experiment
© 2019 IOP Publishing Ltd and SISSA Medialab srl
ournal of Statistical Mechanics:J Theory and Experiment
IOP
* This paper is dedicated in fond remembrance of our PhD advisor Vladimir Rittenberg.
1742-5468/19/104005+12$33.00
A new exponent in the equilibrium shape of crystal surfaces
2https://doi.org/10.1088/1742-5468/ab2ad2
J. Stat. M
ech. (2019) 104005
Contents
1. Introduction 2
2. Thermodynamics of ECS 3
3. The free energy of the six-vertex model and ECS 4
Acknowledgments ................................................................................ 11
References 11
1. Introduction
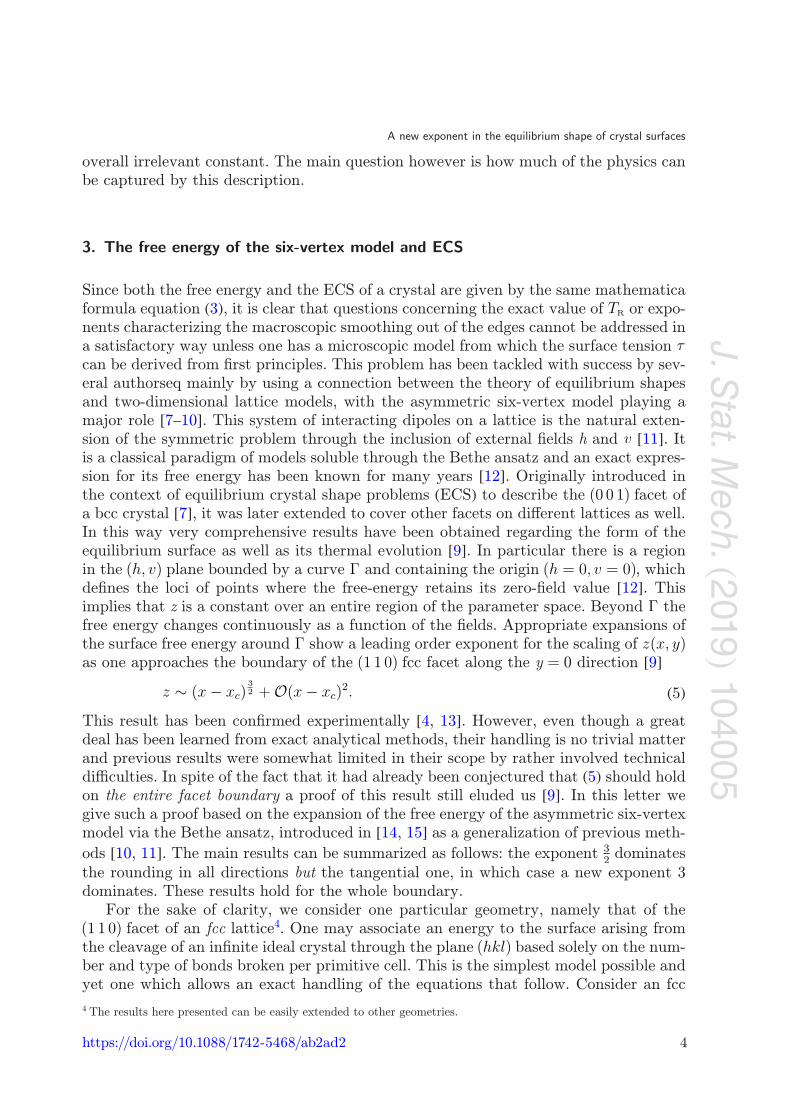
Crystals are believed to be entirely faceted at T = 0, i.e. be polyhedral. Research—both theoretical as well as experiments—on these so-called quantum crystals has increased at an accelerated pace in the last few years. This is due to a miriad of prospective applica-tions and experimental advances [1] which allows us to conduct experimental at those extreme temperatures. To name a few applications, quantum computing, high-pressure synthesis, nanoelectronics, and ferroelectrics whose Curie temperature is very close to absolute zero are among the most prominent ones [2, 3]. Moreover, since some of the most prototypical quantum crystals are rare-gases like He and Ne or molecular crystals as H2 or CH4, their availability make them particularly suited for experimental studies. As the temperature of a quantum crystal is raised, thermal fluctuations bring about a rounding of the edges where planes with dierent indices (hkl) meet. At the roughen-ing transition temperature TR the remaining planar portion of (hkl) disappears entirely and the face becomes rough. Dierent facets may have dierent TR’s. This smoothing that occurs at the edge where two facets meet can be visualized in a simple geometrical way [4]: near the edge there is a curving of the interface (see figure 1) which varies as
z(x) ∼ (x− xc)θ + higher-order terms (1)
where xc is the position of the edge and z measures height perpendicular to the facet. θ is the roughening exponent. Understanding how this rounding occurs is key to know-ing how crystals’ properties change and any questions concerning the exact value of TR or exponents characterizing the macroscopic smoothing out of the edges cannot be addressed in a satisfactory way unless one has a microscopic model from which these quantities can be derived from first principles. However, from thermodynamics one can show that if a solid is in thermal equilibrium with its surrounding fluid, the free energy F (T ) is given by the same equation (up to an overall constant) which defines the geometrical form of the crystal. The implication of this result is straightforward: if one is able from first principles to calculate explicitly F (T ) and find its singularities, one is directly determining the singularities of the crystal shape, as the equations are the same. In other words, the singularities of the surface free energy gives us directly the roughening exponent θ . Before we present the main content of this paper, which
A new exponent in the equilibrium shape of crystal surfaces
3https://doi.org/10.1088/1742-5468/ab2ad2
J. Stat. M
ech. (2019) 104005
applies to both quantum as well as classical crystals, we briefly discuss the thermody-namics of equilibrium crystal shapes (ECS) to better elucidate our results.
2. Thermodynamics of ECS
Along a first-order coexistence line the shape of a solid inclusion in equilibrium with its fluid is determined by the Gibbs–Curie constrained minimization condition: for a fixed volume V of the inclusion, the equilibrium surface Ω = z(x, y) is such as to minimize the surface free energy
F (T ) =
∫
Ω
τ(n,T )dΩ = minimum (2)
where the surface tension τ depends on the orientation of Ω, n = ∇z(x, y) and temper-ature T. To solve the constrained variational problem to determine z(x, y) one intro-duces a Lagrange multiplier 2ν
δ
∫[ f( p, q)− 2νz(x, y)]dxdy
= 0
p = ∂z∂x, q =
∂z∂y
are the slopes of the surface and f( p, q,T ) = τ( p, q,T )√1 + p2 + q2 is
the specific surface free energy projected onto the (x, y)-plane. The solution reads [5, 6]
νz = f(−νx,−νy) (3)where the Legendre transformed potential f is defined through [6]
f(ηx, ηy) = f( p, q)− pηx − qηy (4)
with ηx = ∂f∂p
, ηy =∂f∂q
the surface tilting fields conjugate to the slope variables p and q.
Thus the determination of f yields the equilibrium surface z(x, y) directly, up to some
edge
xcx
z
transition region
planar crystal facet
curved facet
Figure 1. The profile of the smooth edge of an ideal crystal facet in the transition region where it becomes rounded. Based on [4].
A new exponent in the equilibrium shape of crystal surfaces
4https://doi.org/10.1088/1742-5468/ab2ad2
J. Stat. M
ech. (2019) 104005
overall irrelevant constant. The main question however is how much of the physics can be captured by this description.
3. The free energy of the six-vertex model and ECS
Since both the free energy and the ECS of a crystal are given by the same mathematica formula equation (3), it is clear that questions concerning the exact value of TR or expo-nents characterizing the macroscopic smoothing out of the edges cannot be addressed in a satisfactory way unless one has a microscopic model from which the surface tension τ can be derived from first principles. This problem has been tackled with success by sev-eral authorseq mainly by using a connection between the theory of equilibrium shapes and two-dimensional lattice models, with the asymmetric six-vertex model playing a major role [7–10]. This system of interacting dipoles on a lattice is the natural exten-sion of the symmetric problem through the inclusion of external fields h and v [11]. It is a classical paradigm of models soluble through the Bethe ansatz and an exact expres-sion for its free energy has been known for many years [12]. Originally introduced in the context of equilibrium crystal shape problems (ECS) to describe the (0 0 1) facet of a bcc crystal [7], it was later extended to cover other facets on dierent lattices as well. In this way very comprehensive results have been obtained regarding the form of the equilibrium surface as well as its thermal evolution [9]. In particular there is a region in the (h, v) plane bounded by a curve Γ and containing the origin (h = 0, v = 0), which defines the loci of points where the free-energy retains its zero-field value [12]. This implies that z is a constant over an entire region of the parameter space. Beyond Γ the free energy changes continuously as a function of the fields. Appropriate expansions of the surface free energy around Γ show a leading order exponent for the scaling of z(x, y) as one approaches the boundary of the (1 1 0) fcc facet along the y = 0 direction [9]
z ∼ (x− xc)32 +O(x− xc)
2. (5)
This result has been confirmed experimentally [4, 13]. However, even though a great deal has been learned from exact analytical methods, their handling is no trivial matter and previous results were somewhat limited in their scope by rather involved technical diculties. In spite of the fact that it had already been conjectured that (5) should hold on the entire facet boundary a proof of this result still eluded us [9]. In this letter we give such a proof based on the expansion of the free energy of the asymmetric six-vertex model via the Bethe ansatz, introduced in [14, 15] as a generalization of previous meth-
ods [10, 11]. The main results can be summarized as follows: the exponent 32 dominates
the rounding in all directions but the tangential one, in which case a new exponent 3 dominates. These results hold for the whole boundary.
For the sake of clarity, we consider one particular geometry, namely that of the (1 1 0) facet of an fcc lattice4. One may associate an energy to the surface arising from the cleavage of an infinite ideal crystal through the plane (hkl) based solely on the num-ber and type of bonds broken per primitive cell. This is the simplest model possible and yet one which allows an exact handling of the equations that follow. Consider an fcc
4 The results here presented can be easily extended to other geometries.
A new exponent in the equilibrium shape of crystal surfaces
5https://doi.org/10.1088/1742-5468/ab2ad2
J. Stat. M
ech. (2019) 104005
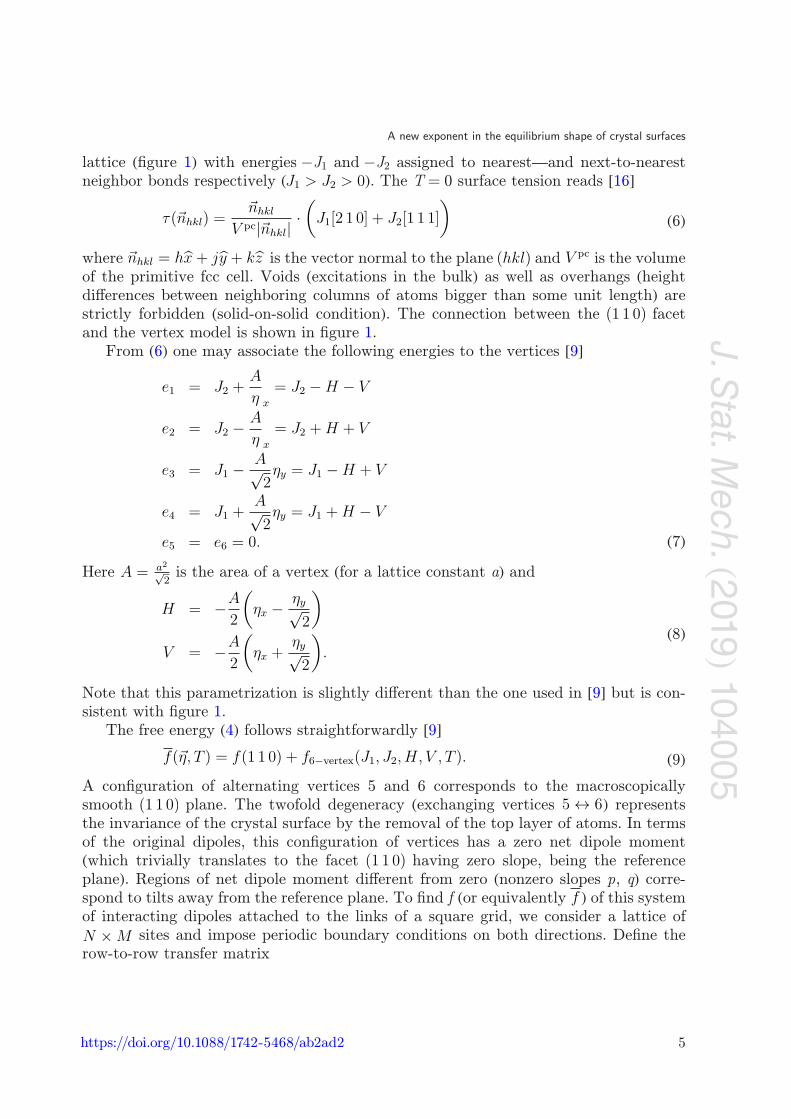
lattice (figure 1) with energies −J1 and −J2 assigned to nearest—and next-to-nearest neighbor bonds respectively (J1 > J2 > 0). The T = 0 surface tension reads [16]
τ(nhkl) =nhkl
V pc|nhkl|·(J1[2 1 0] + J2[1 1 1]
) (6)
where nhkl = hx+ jy + kz is the vector normal to the plane (hkl) and V pc is the volume of the primitive fcc cell. Voids (excitations in the bulk) as well as overhangs (height dierences between neighboring columns of atoms bigger than some unit length) are strictly forbidden (solid-on-solid condition). The connection between the (1 1 0) facet and the vertex model is shown in figure 1.
From (6) one may associate the following energies to the vertices [9]
e1 = J2 +A
η x
= J2 −H − V
e2 = J2 −A
η x
= J2 +H + V
e3 = J1 −A√2ηy = J1 −H + V
e4 = J1 +A√2ηy = J1 +H − V
e5 = e6 = 0.
(7)
Here A = a2√2 is the area of a vertex (for a lattice constant a) and
H = −A
2
(ηx −
ηy√2
)
V = −A
2
(ηx +
ηy√2
).
(8)
Note that this parametrization is slightly dierent than the one used in [9] but is con-sistent with figure 1.
The free energy (4) follows straightforwardly [9]
f(η,T ) = f(1 1 0) + f6−vertex(J1, J2,H,V ,T ). (9)A configuration of alternating vertices 5 and 6 corresponds to the macroscopically smooth (1 1 0) plane. The twofold degeneracy (exchanging vertices 5 ↔ 6) represents the invariance of the crystal surface by the removal of the top layer of atoms. In terms of the original dipoles, this configuration of vertices has a zero net dipole moment (which trivially translates to the facet (1 1 0) having zero slope, being the reference plane). Regions of net dipole moment dierent from zero (nonzero slopes p , q) corre-spond to tilts away from the reference plane. To find f (or equivalently f ) of this system of interacting dipoles attached to the links of a square grid, we consider a lattice of N ×M sites and impose periodic boundary conditions on both directions. Define the row-to-row transfer matrix
A new exponent in the equilibrium shape of crystal surfaces
6https://doi.org/10.1088/1742-5468/ab2ad2
J. Stat. M
ech. (2019) 104005
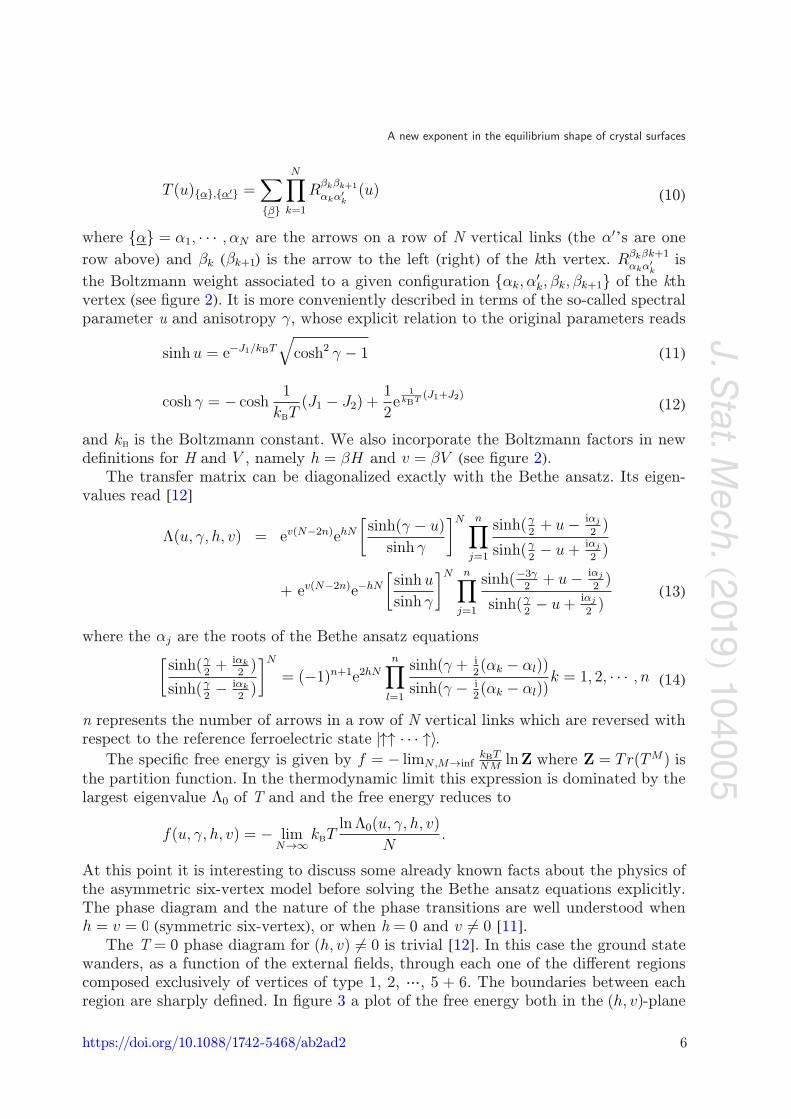
T (u)α,α′ =∑β
N∏k=1
Rβkβk+1
αkα′k
(u) (10)
where α = α1, · · · ,αN are the arrows on a row of N vertical links (the α′’s are one
row above) and βk (βk+1) is the arrow to the left (right) of the kth vertex. Rβkβk+1αkα
′k
is
the Boltzmann weight associated to a given configuration αk,α′k, βk, βk+1 of the kth
vertex (see figure 2). It is more conveniently described in terms of the so-called spectral parameter u and anisotropy γ, whose explicit relation to the original parameters reads
sinh u = e−J1/kBT
√cosh2 γ − 1 (11)
cosh γ = − cosh1
kBT(J1 − J2) +
1
2e
1kBT
(J1+J2) (12)
and kB is the Boltzmann constant. We also incorporate the Boltzmann factors in new definitions for H and V , namely h = βH and v = βV (see figure 2).
The transfer matrix can be diagonalized exactly with the Bethe ansatz. Its eigen-values read [12]
Λ(u, γ,h, v) = ev(N−2n)ehN[sinh(γ − u)
sinh γ
]N n∏j=1
sinh(γ2+ u− iαj
2)
sinh(γ2− u+
iαj
2)
+ ev(N−2n)e−hN
[sinh u
sinh γ
]N n∏j=1
sinh(−3γ2
+ u− iαj
2)
sinh(γ2− u+
iαj
2)
(13)
where the αj are the roots of the Bethe ansatz equations[sinh(γ
2+ iαk
2)
sinh(γ2− iαk
2)
]N= (−1)n+1e2hN
n∏l=1
sinh(γ + i2(αk − αl))
sinh(γ − i2(αk − αl))
k = 1, 2, · · · ,n (14)
n represents the number of arrows in a row of N vertical links which are reversed with respect to the reference ferroelectric state |↑↑ · · · ↑〉.
The specific free energy is given by f = − limN ,M→infkBTNM
lnZ where Z = Tr(TM) is the partition function. In the thermodynamic limit this expression is dominated by the largest eigenvalue Λ0 of T and and the free energy reduces to
f(u, γ,h, v) = − limN→∞
kBTln Λ0(u, γ,h, v)
N.
At this point it is interesting to discuss some already known facts about the physics of the asymmetric six-vertex model before solving the Bethe ansatz equations explicitly. The phase diagram and the nature of the phase transitions are well understood when h = v = 0 (symmetric six-vertex), or when h = 0 and v = 0 [11].
The T = 0 phase diagram for (h, v) = 0 is trivial [12]. In this case the ground state wanders, as a function of the external fields, through each one of the dierent regions composed exclusively of vertices of type 1, 2, ⋯, 5 + 6. The boundaries between each region are sharply defined. In figure 3 a plot of the free energy both in the (h, v)-plane
A new exponent in the equilibrium shape of crystal surfaces
7https://doi.org/10.1088/1742-5468/ab2ad2
J. Stat. M
ech. (2019) 104005
x
z
y
1 2
34
5
6
1
3
2
64
5
-
-
-
-
--
---
-
-
--
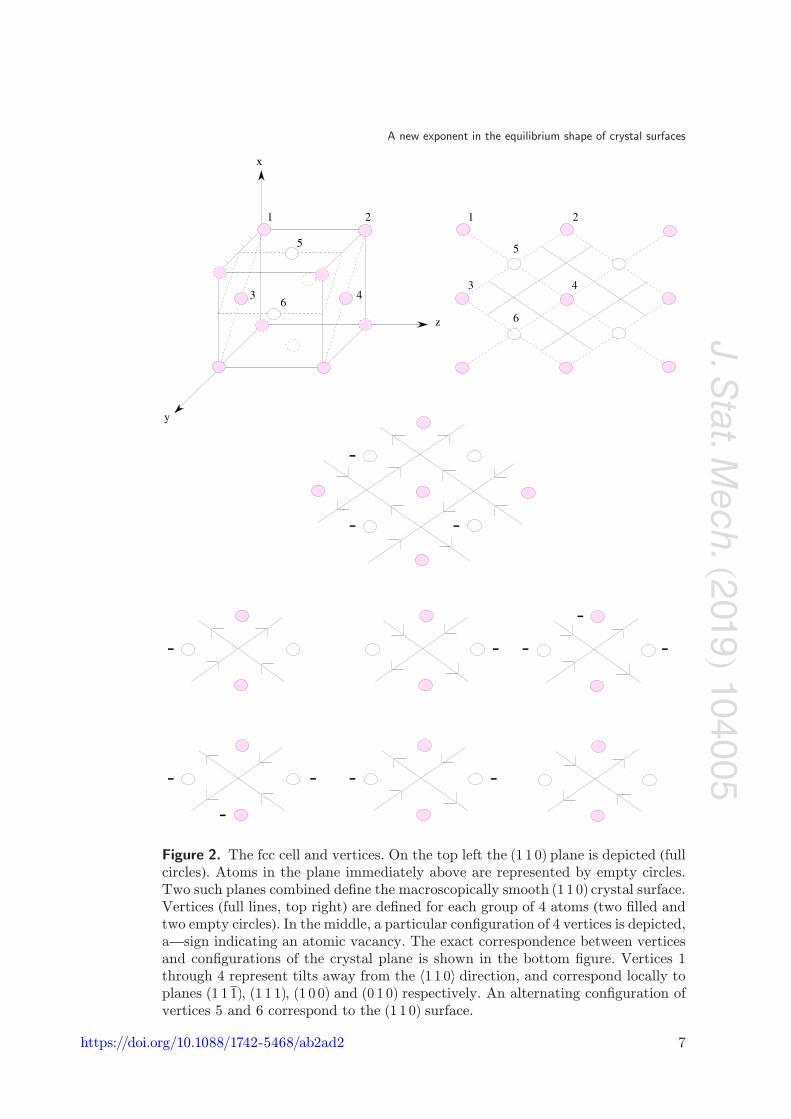
Figure 2. The fcc cell and vertices. On the top left the (1 1 0) plane is depicted (full circles). Atoms in the plane immediately above are represented by empty circles. Two such planes combined define the macroscopically smooth (1 1 0) crystal surface. Vertices (full lines, top right) are defined for each group of 4 atoms (two filled and two empty circles). In the middle, a particular configuration of 4 vertices is depicted, a—sign indicating an atomic vacancy. The exact correspondence between vertices and configurations of the crystal plane is shown in the bottom figure. Vertices 1 through 4 represent tilts away from the 〈1 1 0〉 direction, and correspond locally to planes (1 1 1), (1 1 1), (1 0 0) and (0 1 0) respectively. An alternating configuration of vertices 5 and 6 correspond to the (1 1 0) surface.
A new exponent in the equilibrium shape of crystal surfaces
8https://doi.org/10.1088/1742-5468/ab2ad2
J. Stat. M
ech. (2019) 104005
as well as in the (ηx, ηy)-plane are presented. The crystal facets to which each region corresponds are accordingly indicated [9].
As the temperature is raised, thermal excitations bring about a rounding of edges [7]. When T = 0 (γ finite) the free energy f(h, v) remains constant as function of the field (‘flat phase’) in a region of the (h, v) plane containing h = v = 0 and bounded by a curve Γ. Beyond this, the field is suciently strong to destroy the antiferroelectric order of the system, but not strong enough to impose ferroelectric order, and an incom-mensurate phase appears where the polarization (or surface slope), which is zero in the flat phase, changes continuously with the field. The spectrum of the transfer matrix is gapless with finite size corrections typical of the gaussian model [17]. The curve Γ has been investigated only at a few points [9, 11] and the nature of the phase transition was found to be of a Pokrovskii–Talapov type [18]. To study this curve in more detail, one has to solve the Bethe ansatz equations in their limiting form for arbitrary values of h, v and determine the free energy. This is a non trivial problem. A detailed exposition of the methods used to tackle (14) can be found in [10, 14, 15]. Here we point out only the main results which are of relevance to the questions addressed. Since the Boltzmann factor is inessential to the forecoming discussion, we drop it out of our analysis. The vertical polarization y is defined through
y = limN→∞
2Sz
N= lim
N→∞
(1− 2n
N
). (15)
Inside the boundary curve Γ in the (h, v)-plane the polarization is constant at its y = 0 value; the free energy does not depend on the field and is given by [12]
f(u, γ,h, v) = −2∞∑n=1
e−2γn
n cosh γnsinh(nu) sinhn(γ − u). (16)
The parametric equation (h(b), v(b)) of Γ is given by [10, 14]
h(b) = − b
2−
∞∑n=1
(−)nsinhnb
n coshnγ (17)
and
v(b) =γ
2− |γ − 2u− b|
2+
∞∑n=1
(−)n
n
sinh[n(γ − |γ − 2u− b|)]coshnγ
− γ b γ.
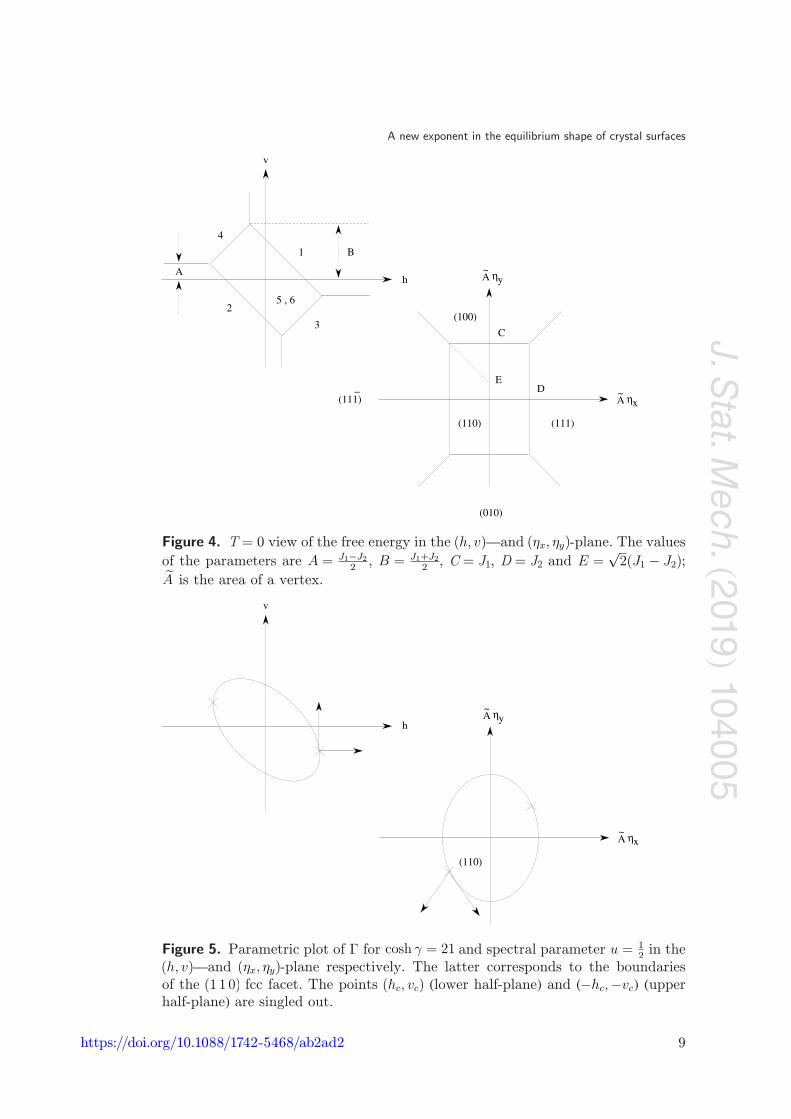
(18)These equations reproduce only half of the curve Γ. The other half can be recovered from the symmetry f(−h,−v) = f(h, v). Figure 4 depicts Γ in the (h, v)-plane along with the same plot in the (ηx, ηy)-plane (the latter being the boundaries of the (1 1 0)
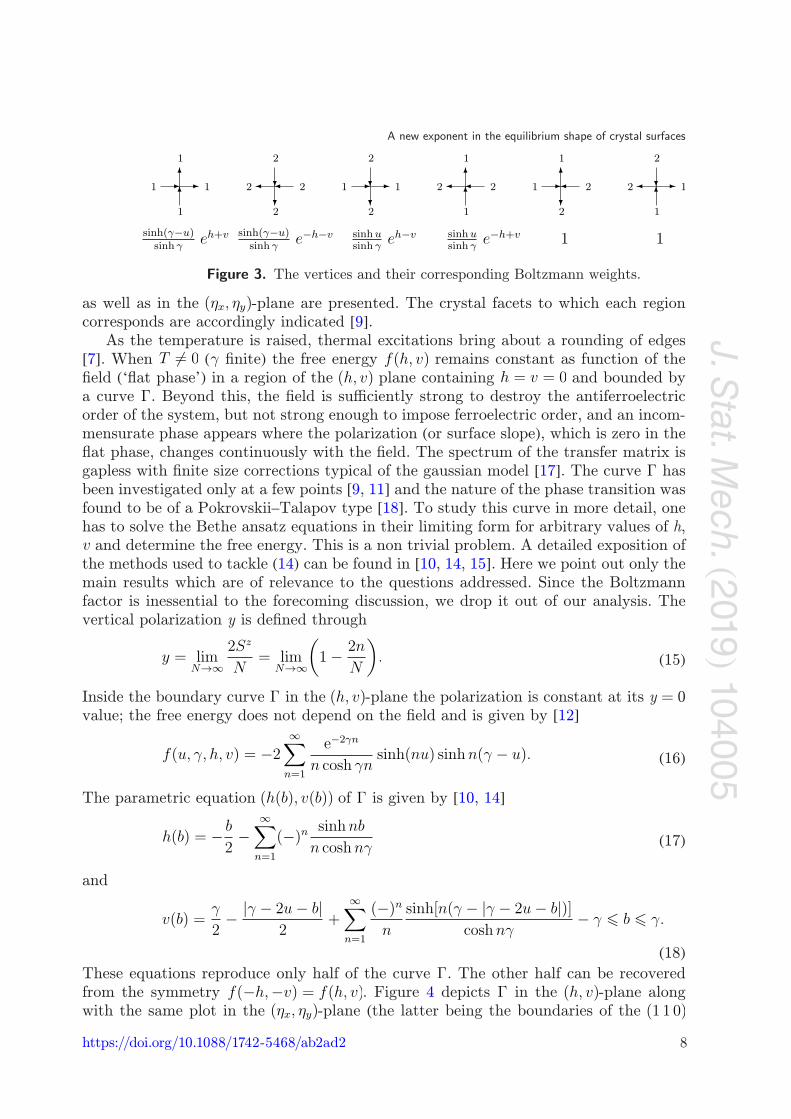
Figure 3. The vertices and their corresponding Boltzmann weights.
A new exponent in the equilibrium shape of crystal surfaces
9https://doi.org/10.1088/1742-5468/ab2ad2
J. Stat. M
ech. (2019) 104005
h
v
A
B1
2
3
4
5 , 6
ηxA~
ηyA~
C
DE
(110)
(100)
(010)
(111)
(111)_
Figure 4. T = 0 view of the free energy in the (h, v)—and (ηx, ηy)-plane. The values
of the parameters are A = J1−J22
, B = J1+J22
, C = J1, D = J2 and E =√2(J1 − J2);
A is the area of a vertex.
ηxA~
ηyA~
(110)
h
v
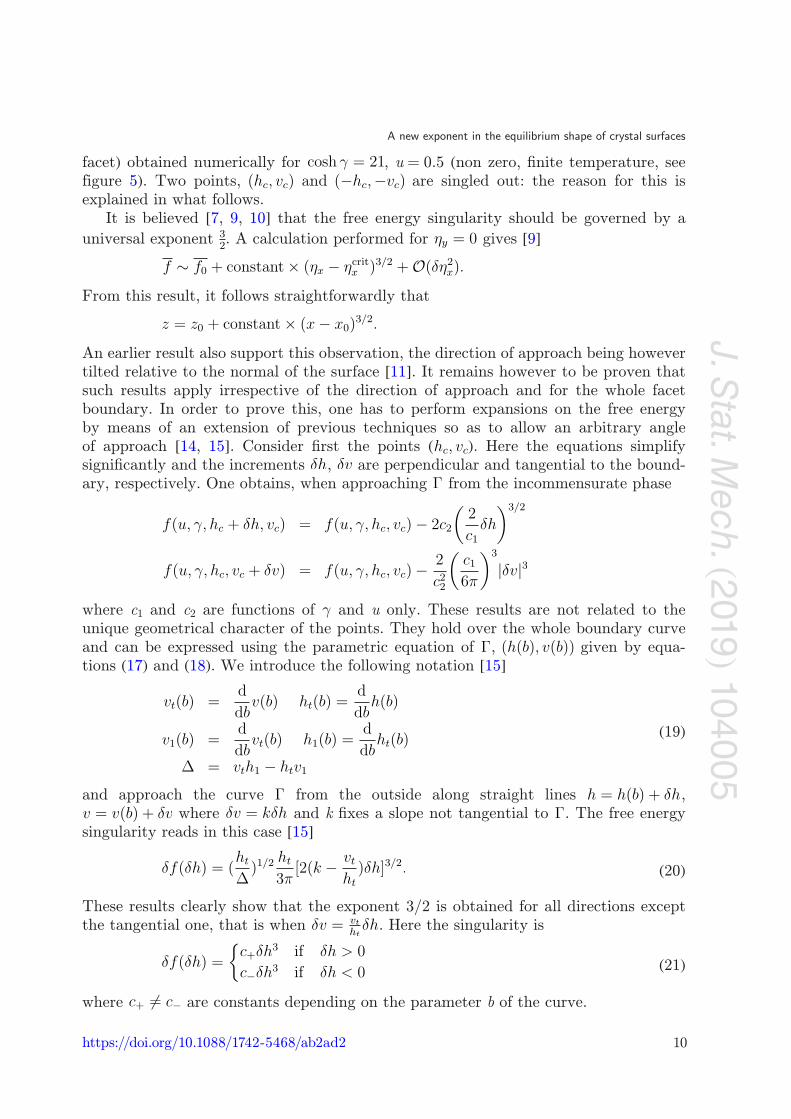
Figure 5. Parametric plot of Γ for cosh γ = 21 and spectral parameter u = 12 in the
(h, v)—and (ηx, ηy)-plane respectively. The latter corresponds to the boundaries of the (1 1 0) fcc facet. The points (hc, vc) (lower half-plane) and (−hc,−vc) (upper half-plane) are singled out.
A new exponent in the equilibrium shape of crystal surfaces
10https://doi.org/10.1088/1742-5468/ab2ad2
J. Stat. M
ech. (2019) 104005
facet) obtained numerically for cosh γ = 21, u = 0.5 (non zero, finite temperature, see figure 5). Two points, (hc, vc) and (−hc,−vc) are singled out: the reason for this is explained in what follows.
It is believed [7, 9, 10] that the free energy singularity should be governed by a
universal exponent 32. A calculation performed for ηy = 0 gives [9]
f ∼ f0 + constant× (ηx − ηcritx )3/2 +O(δη2x).
From this result, it follows straightforwardly that
z = z0 + constant× (x− x0)3/2.
An earlier result also support this observation, the direction of approach being however tilted relative to the normal of the surface [11]. It remains however to be proven that such results apply irrespective of the direction of approach and for the whole facet boundary. In order to prove this, one has to perform expansions on the free energy by means of an extension of previous techniques so as to allow an arbitrary angle of approach [14, 15]. Consider first the points (hc, vc). Here the equations simplify significantly and the increments δh, δv are perpendicular and tangential to the bound-ary, respectively. One obtains, when approaching Γ from the incommensurate phase
f(u, γ,hc + δh, vc) = f(u, γ,hc, vc)− 2c2
(2
c1δh
)3/2
f(u, γ,hc, vc + δv) = f(u, γ,hc, vc)−2
c22
(c16π
)3
|δv|3
where c1 and c2 are functions of γ and u only. These results are not related to the unique geometrical character of the points. They hold over the whole boundary curve and can be expressed using the parametric equation of Γ, (h(b), v(b)) given by equa-tions (17) and (18). We introduce the following notation [15]
vt(b) =d
dbv(b) ht(b) =
d
dbh(b)
v1(b) =d
dbvt(b) h1(b) =
d
dbht(b)
∆ = vth1 − htv1
(19)
and approach the curve Γ from the outside along straight lines h = h(b) + δh, v = v(b) + δv where δv = kδh and k fixes a slope not tangential to Γ. The free energy singularity reads in this case [15]
δf(δh) = (ht
∆)1/2
ht
3π[2(k − vt
ht
)δh]3/2. (20)
These results clearly show that the exponent 3/2 is obtained for all directions except the tangential one, that is when δv = vt
htδh. Here the singularity is
δf(δh) =
c+δh
3 if δh > 0
c−δh3 if δh < 0 (21)
where c+ = c− are constants depending on the parameter b of the curve.
A new exponent in the equilibrium shape of crystal surfaces
11https://doi.org/10.1088/1742-5468/ab2ad2
J. Stat. M
ech. (2019) 104005
The result of our long calculation is that one has two critical exponents θ1 = 3/2 corre-sponding to the rounding o of a crystal facet when the facet boundary is approached in all other directions except the tangential one and θ2 = 3 if the facet boundary is approached tangentially. Experiments on small Pb-crystals [4] which looked for θ1 have found θ1 = 1.60± 0.15 whereas experiments on large He4-crystals [13] have found θ1 = 1.55± 0.06 confirming the theoretical predictions. More recent results on Pb were presented in [19]. According to Babkin [20] and Henrich [21] measurements to put in evidence the second critical exponent θ2 are feasible. An open problem common to the measurements in both exponents is the eect of gravity. These eects have been dis-cussed in [22] and more extensively in the reviews [23–25].
Acknowledgments
The authors would like to thank G Albertini for the excellent collaboration which led us to this work. We would like to thank A Babkin and V Henrich for sharing their expertise on crystal surface experiments. SRD would like to thank the hospitality of the Technische Universität Berlin and the financial support of the Alexander-von-Humboldt Foundation, Germany. BWK would like to acknowledge the financial sup-port by the NSF under the Grant PHY-1255409.
References
[1] Sempere S, Serra A, Boronat J and Cazorla C 2018 Crystals 8 64–82 [2] Lukyanchuk I, Sharma P, Nakajima T, Okamura S, Scott J F and Gruverman A 2014 Nano Lett. 14 6931–5 [3] Scott J F 2018 Crystals 8 180–94 [4] Rottman C, Wortis M, Heyraud J C and Métois J-J 1984 Phys. Rev. Lett. 52 1009–12 [5] Landau L D and Lifshitz E M 1980 Statistical Physics (Oxford: Pergamon) [6] Andreev A F 1981 Sov. Phys.—JETP 53 1063 [7] van Beijeren H 1977 Phys. Rev. Lett. 38 993 [8] Rottman C and Wortis M 1984 Phys. Rep. 103 59 [9] Jayaprakash C, Saam W F and Teitel S 1983 Phys. Rev. Lett. 50 2017 Jayaprakash C and Saam W F 1984 Phys. Rev. B 7 3916 [10] Nolden I M 1992 J. Stat. Phys. 67 155 Shore J D and Bukman D J 1994 Phys. Rev. Lett. 72 604 Bukman D J and Shore J D 1995 J. Stat. Phys. 78 1277 [11] Lieb E H and Wu F Y 1972 Phase Transitions and Critical Phenomena vol 1, ed C Domb and M Green (New
York: Academic) [12] Yang C P 1967 Phys. Rev. Lett. 19 586 Sutherland B, Yang C N and Yang C P 1967 Phys. Rev. Lett. 19 588 Lieb E H 1967 Phys. Rev. 162 162 [13] Carmi Y, Lipson S G and Polturak E 1987 Phys. Rev. B 36 1894 [14] Albertini G, Dahmen S R and Wehefritz B 1997 Nucl. Phys. B 493 541 [15] Albertini G 1998 J. Stat. Phys. 90 853–71 [16] McKenzie J K, Moore A J W and Nicholas J F 1962 J. Phys. Chem. Solids 23 185–96 [17] Noh J D and Kim D 1995 Phys. Rev. E 53 3225 Noh J D and Kim D 1997 Phys. Rev. E 56 355 [18] Pokrovskii V L and Talapov A L 1980 Sov. Phys.—JETP 51 124 [19] Bonzel H P, Yu D K and Scheer M 2007 Appl. Phys. A 87 391 [20] Babkin A 1998 private communication [21] Henrich V 1998 private communication [22] Avron J E and Zia R K P 1988 Phys. Rev. B 37 6611
A new exponent in the equilibrium shape of crystal surfaces
12https://doi.org/10.1088/1742-5468/ab2ad2
J. Stat. M
ech. (2019) 104005
[23] Einstein T L 2015 Equilibrium shape of crystals Handbook of Crystal Growth, Fundamentals (Thermody-namics and Kinetics vol 1A) 2nd edn, ed T Nishinaga (Amsterdam: Elsevier) ch 5, pp 215–64
[24] Bonzel H P 2003 Phys. Rep. 385 1 [25] Sekerka R F 2004 Theory of crystal growth morphology Crystal Growth—from Fundamentals to Technol-
ogy ed G Müller et al (Amsterdam: Elsevier) pp 55–93