MAGISTERARBEIT - othes.univie.ac.atothes.univie.ac.at/32944/1/2014-05-12_1249886.pdf · Special...
69
MAGISTERARBEIT Titel der Magisterarbeit “Economic effectiveness of Public-Private Partnership (PPP) and PPP determinants in low and middle income countries” Verfasserin Lic. Agata Miliszkiewicz angestrebter akademischer Grad Magistra der Sozial- und Wirtschaftswissenschaften (Mag.rer.soc.oec.) Wien, 2014 Studienkennzahl It. Studienblatt: A 066 913 Studienrichtung lt. Studienblatt: Magisterstudium Volkswirtschaftslehre Betreuer Neil Foster-McGregor, BA, MSc, PhD
Transcript of MAGISTERARBEIT - othes.univie.ac.atothes.univie.ac.at/32944/1/2014-05-12_1249886.pdf · Special...
MAGISTERARBEIT
Titel der Magisterarbeit
“Economic effectiveness of Public-Private Partnership
(PPP) and PPP determinants in low and middle income
countries”
Verfasserin
Lic. Agata Miliszkiewicz
angestrebter akademischer Grad
Magistra der Sozial- und Wirtschaftswissenschaften (Mag.rer.soc.oec.)
Wien, 2014 Studienkennzahl It. Studienblatt: A 066 913 Studienrichtung lt. Studienblatt: Magisterstudium Volkswirtschaftslehre Betreuer Neil Foster-McGregor, BA, MSc, PhD


ACKNOWLEDGEMENTS
Firstly, I would like to express my deep gratitude to my supervisor
Professor Neil Foster-McGregor for his valuable suggestions and comments in
preparation of the thesis as well as for his good word and patience.
Special thanks to Adam Olszewski, who motivated me constantly and with
whom I could always discuss my ideas. Without his generous support throughout my
whole studies, this work would not have been possible.


5
CONTENTS
INTRODUCTION ...................................................................................................................... 7
1. About PPP .............................................................................................................................. 9
1.1. A review of PPP - definition ................................................................................................... 9
1.2. Statistics and overview of PPP in low and middle income countries in 1990-2012 ............. 10
2. Economic effectiveness of PPP......................................................................................... 21
2.1. Inclusive development and affordability ............................................................................... 23
2.2. Trust and cooperation ............................................................................................................ 24
2.3. Stability and predictability .................................................................................................... 25
2.4. Accountability and risk management .................................................................................... 26
3. Advantages of PPP and Cost -Benefit Analysis ............................................................... 28
3.1. On time and within budget .................................................................................................... 28
3.2. Division of tasks .................................................................................................................... 28
3.3. Additional investment ........................................................................................................... 30
3.4. Cost-Benefit Analysis and value for money in PPP .............................................................. 31
4. Existing Evidence - empirical studies concerning PPP .................................................... 34
5. Methodology ..................................................................................................................... 41
6. Dataset and analysis of variables ...................................................................................... 43
6.1. Dataset ................................................................................................................................... 43
6.2. Analysis of the variables ....................................................................................................... 44
7. The results ......................................................................................................................... 47
7.1. Estimations ............................................................................................................................ 47
7.2. Diagnostics ............................................................................................................................ 51
7.3. Fit of the model ..................................................................................................................... 52
7.4. Interpretation of the results and verification of the hypotheses ............................................. 54
CONCLUSIONS ...................................................................................................................... 57
REFERENCES ......................................................................................................................... 60
APPENDIX 1. A list of countries from the sample. ................................................................ 63
APPENDIX 2. A frequency table of number of PPP projects in the years 2000-2009 for the
countries from the sample (Appendix 1) .................................................................................. 65
APPENDIX 3. Zusammenfassung ........................................................................................... 66
APPENDIX 4. Abstract ............................................................................................................ 67
APPENDIX 5. Curriculum Vitae ............................................................................................. 68

6
7
INTRODUCTION
The theme of the present work is the economic effectiveness of public-private
partnerships and the factors that influence the development of this form of sector cooperation
in providing public services and satisfying public needs. Investment needs frequently exceed
available funds to fulfill them (Brzozowska 2006). That is why policymakers should choose
projects, which bring the greatest benefit to a society. One of the ways to provide public
goods could be through public-private partnerships, which, thanks to their advantages, may be
an attractive method of implementing public tasks. That is why public–private partnerships
are becoming increasingly popular in many countries (Geddes and Wagner 2013; Ribeiro and
Dantas 2006; Tang et al. 2010). One of the most important advantages of PPP is its potential
economic effectiveness, which means that the benefits of PPP for society are higher in
comparison with other methods of provision of public goods.
Since I wanted to write solely about public-private partnership and show that it can be
a good and desirable cooperation between sectors and to investigate its determinants, the work
is not going to be a comparative study. I have studied various articles and guidelines about
PPP and its potential economic effectiveness and the aim of the theoretical part of the work
was to summarize it and give an account of the present literature on the topic. Also an effort
has been made here to find an area, which has not yet been deeply explored and thus, at the
same time, is an intriguing field to study. There is little empirical research on the determinants
of PPP, thus the author’s interest in that matter. As PPP projects can be an effective way of
provision of public good it is crucial to study its determinants to further promote this form of
cooperation of public and private sector. Hence, there arise questions concerning the
determinants of PPP projects. That is why the objective of this research is then twofold.
Firstly to provide an up-to-date theoretical literature review concerning PPP projects, and

8
secondly, to find the factors that enhance the development of cooperation of public and
private partners in providing public goods.
The structure of the research is as follows. Sections 1-5 contain a theoretical
framework of PPP and the overview of the PPP statistics in the last two decades in low and
middle income countries. There have also been discussed such issues as the economic
effectiveness of PPP and the advantages of the partnership i.e. on time and within budget
investment, effective division of tasks and risk allocation. Also empirical studies on the
determinants of PPP are discussed in that part. Sections 6-9 contain an empirical study on
determining factors influencing PPP projects. An econometric model is presented concerning
the determinants of public-private partnerships in low and middle income countries, since the
data are only available for such countries in the World Bank's Private Participation Database.
Ordered Logistic Regression is used for this purpose. The empirical study shows that the
determinants of the number of PPP projects are the size of GDP per capita, the size of
population and inflation. The theoretical assumptions on the directions of the impact of these
variables on the number of PPP projects have been confirmed in the study.
9
1. About PPP
1.1. A review of PPP - definition
It is important to outline briefly what a Public-Private Partnership (PPP) is and why provision
of public goods in this way is attractive. PPP is a form of cooperation between the public and
private sector which aims at the provision of certain service (Brzozowska 2006). It defines a
relation in which the recourses of public and private parties are blended to meet certain
objectives, which are beneficial for both sectors (Witters et al. 2012). Such partnerships can
also be called a “best-of-both-worlds” as PPP constitutes an alternative to traditional
provision of public goods - by public sector and privatization (Engel et al. 2011). The service
provided by a PPP must satisfy a public need since a public entity is involved. Through PPP,
the public sector does not get rid of the control over a project but it transfers a range of tasks
to a private entity in order to increase the efficiency of the service. The possibility of
financing infrastructure projects with private funds is not only a way to save public resources
thus reducing government spending, but also has other advantages (Yescombe 2008). In
general PPP projects are carried out without delays and the costs do not exceed the planned
budget due to the private partner’s presence, which has experience and knowledge in such
tasks as well as capital, which enables the use of innovative solutions. The essence of the
efficiency of the delivery of services through PPP is the division of tasks and risks between
partners. Both the task and the risks present in the project should be controlled by the partner
who is better prepared to manage it (Jin and Zhang 2011). Combining the strengths of both
sectors leads to effective cooperation. The public partner has more knowledge when it comes
to define a service that should be provided. The public sector determines the scope and the
place of the service that will ensure the sustainable development of a region (Gajewska-
Jedwabny 2007). On the other hand, a private partner is more experienced in managing
difficult projects and ensures greater efficiency in the tasks. Effective co-operation brings
10
satisfaction to both partners. The public partner fulfills its obligations concerning the
provision of good quality services, while the private operator is paid for its delivery.
Implementation of tasks in the form of a PPP leads to value for money (VFM), which brings
the highest benefit to a society. This happens when the maximum benefits are achieved with
the PPP project, i.e. cost savings and high quality service, higher than if it had been delivered
in some other way (Brzozowska 2006). That is why a project characterized by value for
money is not the lowest cost option but takes into account the whole life benefits and
appropriate risk allocation between public and private partners (Ismail et al. 2011).
1.2. Statistics and overview of PPP in low and middle income countries in 1990-2012
It would be useful to mention some statistics on PPP which can be obtained from the
Private Partnership in Infrastructure Database which belongs to the World Bank Group, which
collects information on PPP projects in low and middle income countries. The database
provides various information on conducted PPP projects, which can be aggregated to the
project, country level or to provide regional statistics. To my mind, regional statistics will
serve the best overview of PPP throughout the world. The database gathers information on the
number of PPP projects and the amount of investment into it. First of all let us have a look at
the number of PPP projects over the period 1990-2012 in the regions: East Asia and Pacific,
Europe and Central Asia, Latin America and the Caribbean, Middle East and North Africa,
South Asia, Sub-Saharan Africa and afterwards we will focus on the investment into PPP
projects in these regions.
11
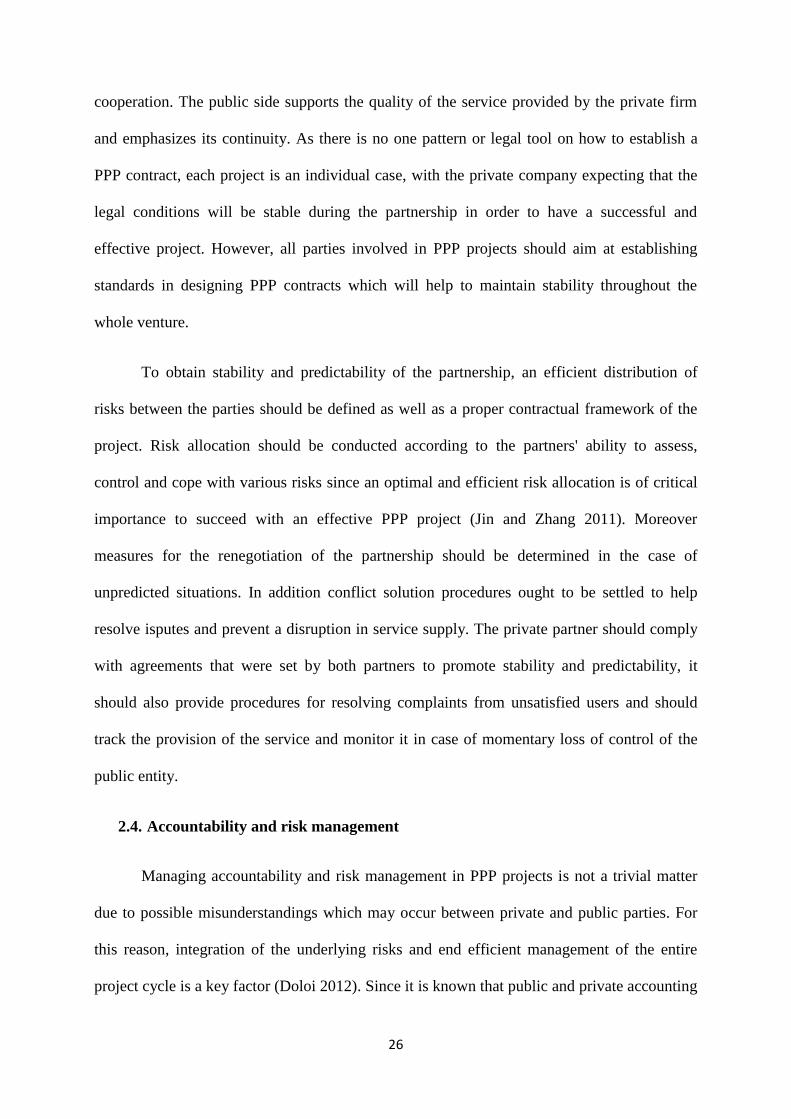
Figure 1.
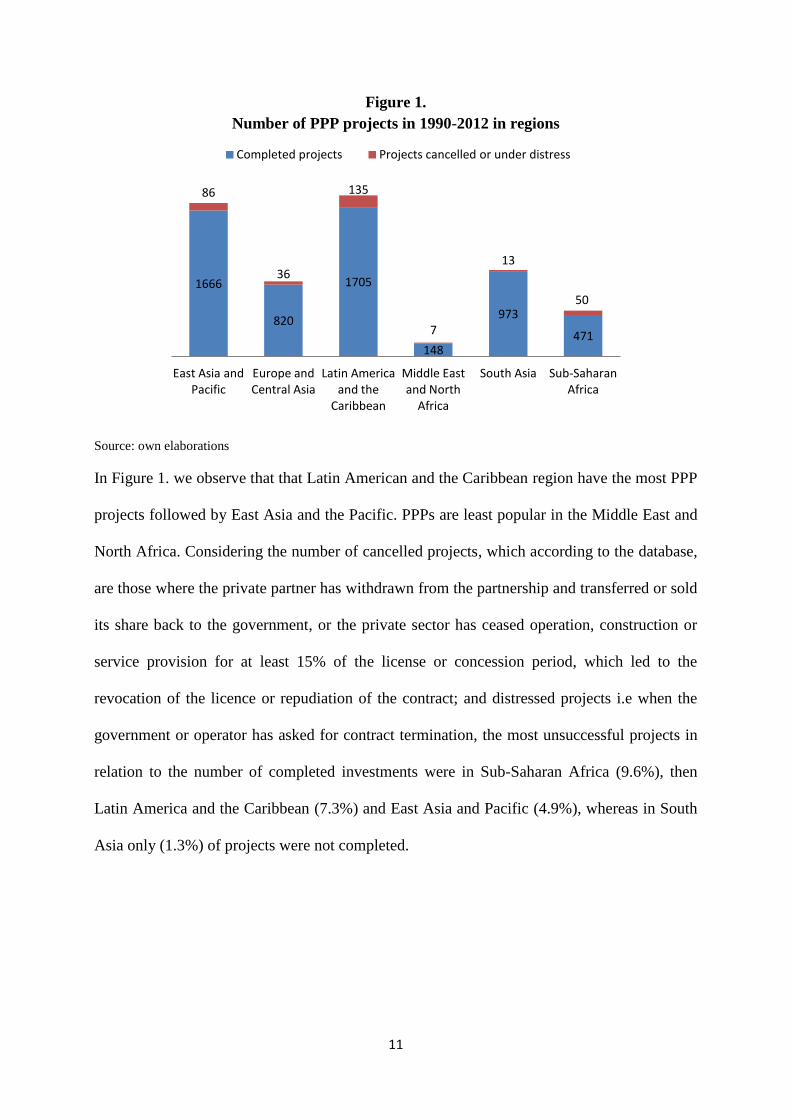
Number of PPP projects in 1990-2012 in regions
Source: own elaborations
In Figure 1. we observe that that Latin American and the Caribbean region have the most PPP
projects followed by East Asia and the Pacific. PPPs are least popular in the Middle East and
North Africa. Considering the number of cancelled projects, which according to the database,
are those where the private partner has withdrawn from the partnership and transferred or sold
its share back to the government, or the private sector has ceased operation, construction or
service provision for at least 15% of the license or concession period, which led to the
revocation of the licence or repudiation of the contract; and distressed projects i.e when the
government or operator has asked for contract termination, the most unsuccessful projects in
relation to the number of completed investments were in Sub-Saharan Africa (9.6%), then
Latin America and the Caribbean (7.3%) and East Asia and Pacific (4.9%), whereas in South
Asia only (1.3%) of projects were not completed.
1666
820
1705
148
973
471
86
36
135
7
13
50
East Asia and Pacific
Europe and Central Asia
Latin America and the
Caribbean
Middle East and North
Africa
South Asia Sub-Saharan Africa
Completed projects Projects cancelled or under distress
12
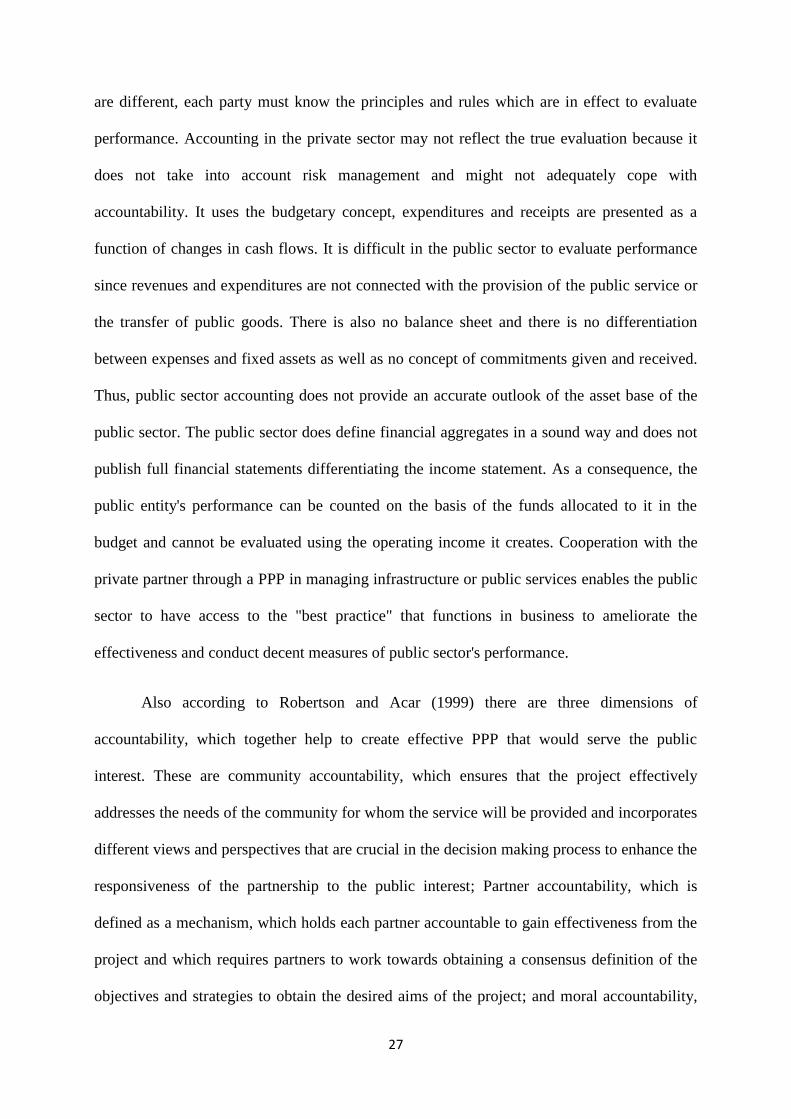
Figure 2.
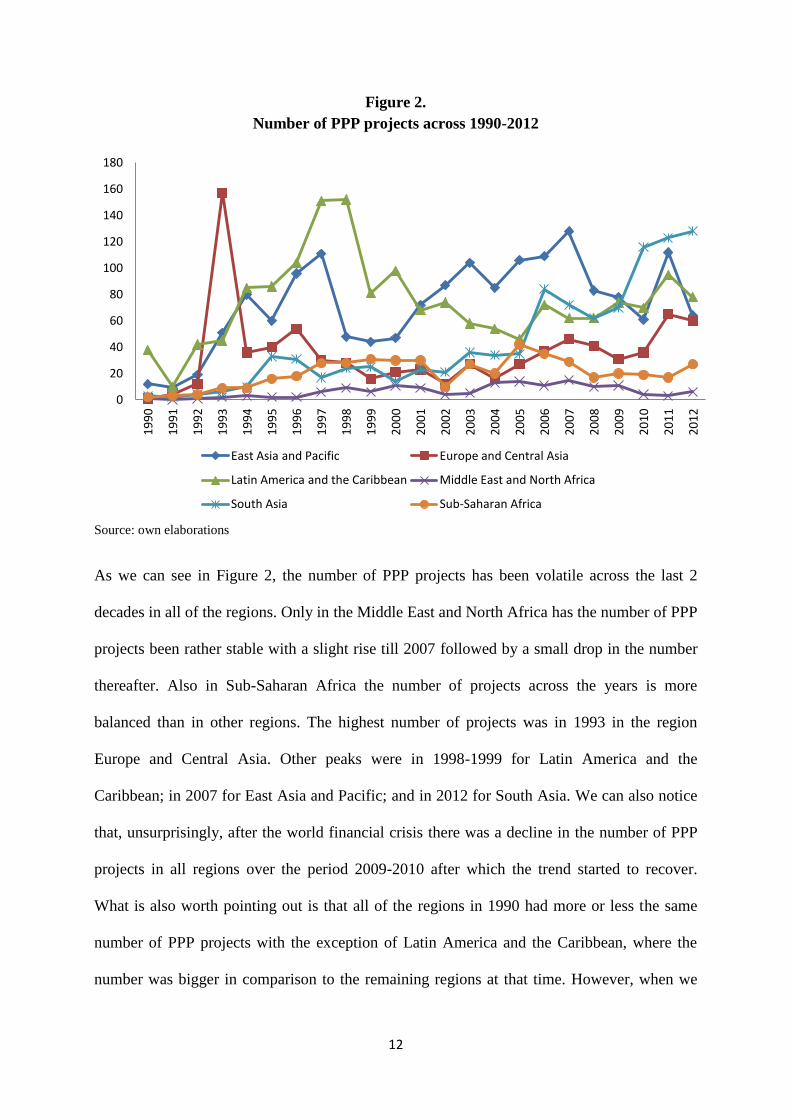
Number of PPP projects across 1990-2012
Source: own elaborations
As we can see in Figure 2, the number of PPP projects has been volatile across the last 2
decades in all of the regions. Only in the Middle East and North Africa has the number of PPP
projects been rather stable with a slight rise till 2007 followed by a small drop in the number
thereafter. Also in Sub-Saharan Africa the number of projects across the years is more
balanced than in other regions. The highest number of projects was in 1993 in the region
Europe and Central Asia. Other peaks were in 1998-1999 for Latin America and the
Caribbean; in 2007 for East Asia and Pacific; and in 2012 for South Asia. We can also notice
that, unsurprisingly, after the world financial crisis there was a decline in the number of PPP
projects in all regions over the period 2009-2010 after which the trend started to recover.
What is also worth pointing out is that all of the regions in 1990 had more or less the same
number of PPP projects with the exception of Latin America and the Caribbean, where the
number was bigger in comparison to the remaining regions at that time. However, when we
0
20
40
60
80
100
120
140
160
180 1
99
0
19
91
19
92
19
93
19
94
19
95
19
96
19
97
19
98
19
99
20
00
20
01
20
02
20
03
20
04
20
05
20
06
20
07
20
08
20
09
20
10
20
11
20
12
East Asia and Pacific Europe and Central Asia
Latin America and the Caribbean Middle East and North Africa
South Asia Sub-Saharan Africa
13
look at the most recent data for 2012 we can observe that the number for the regions is not at
the same level, which means that in certain parts of the globe, the cooperation between the
private and public sector is more popular than in other regions. In 2012 the most PPP projects
were in South Asia, Latin America and the Caribbean, East Asia and the Pacific, and Europe
and Central Asia the number is on a comparable level; whereas the least projects are in Sub-
Saharan Africa and the Middle East and North Africa.
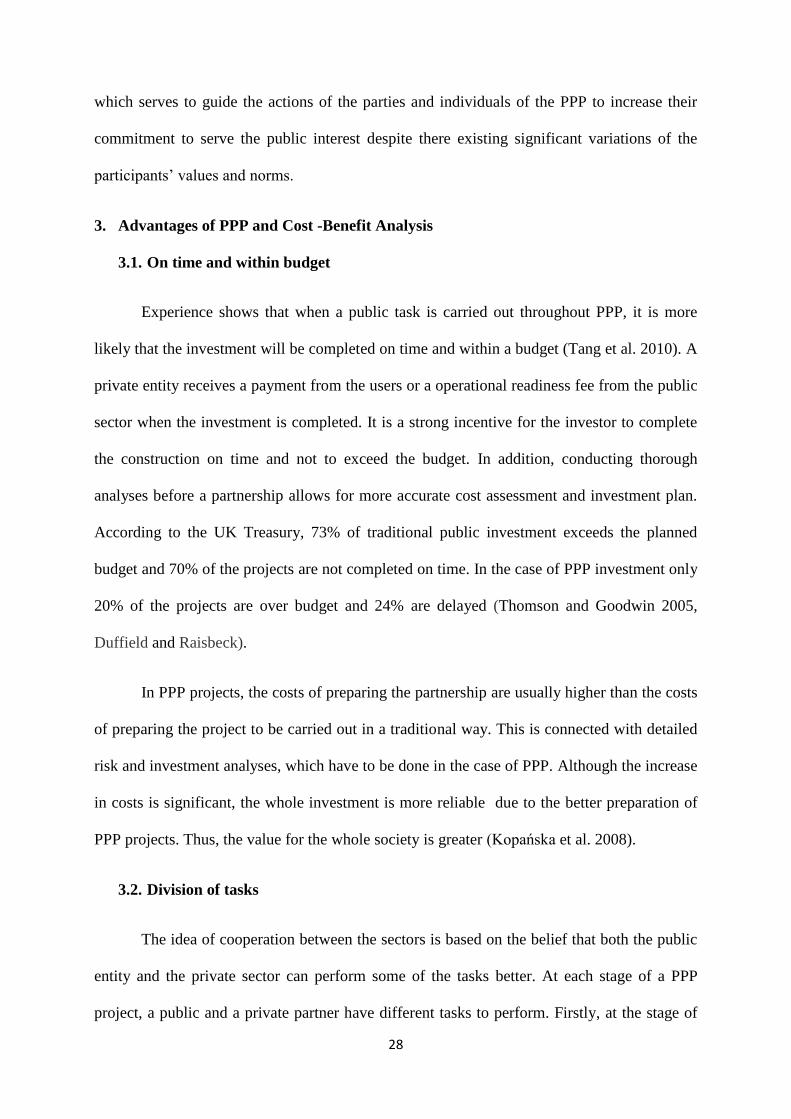
Figure 3.
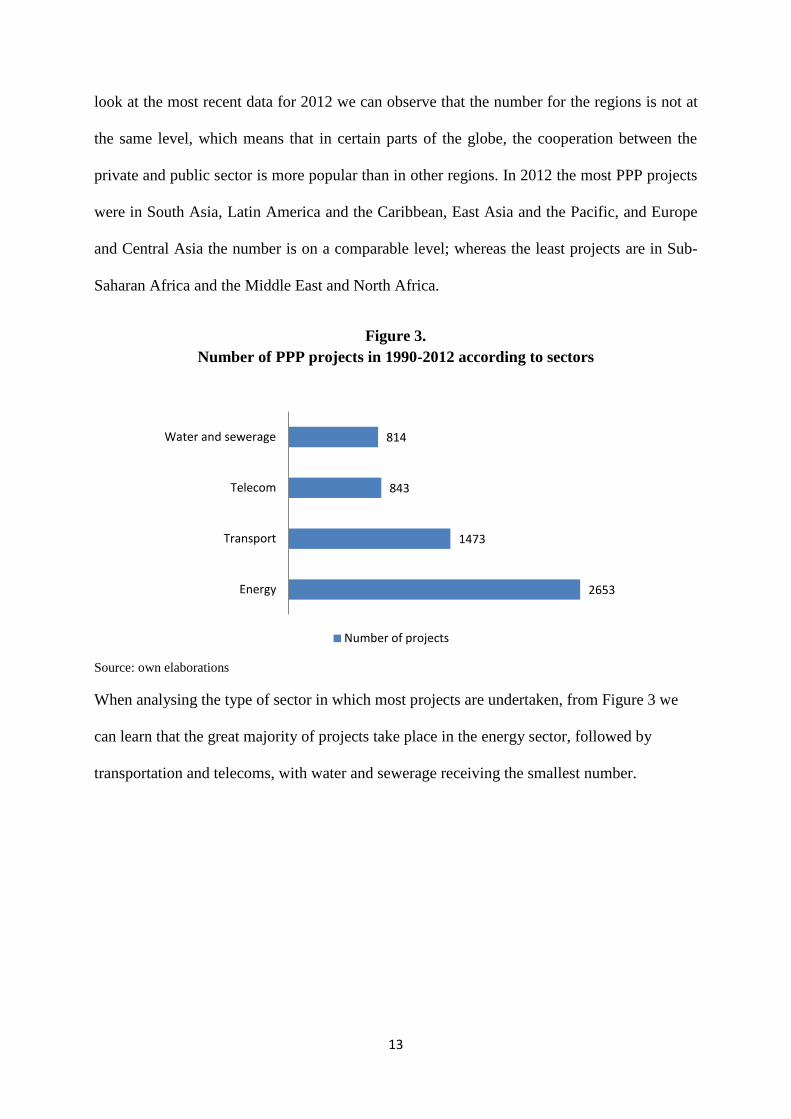
Number of PPP projects in 1990-2012 according to sectors
Source: own elaborations
When analysing the type of sector in which most projects are undertaken, from Figure 3 we
can learn that the great majority of projects take place in the energy sector, followed by
transportation and telecoms, with water and sewerage receiving the smallest number.
2653
1473
843
814
Energy
Transport
Telecom
Water and sewerage
Number of projects
14
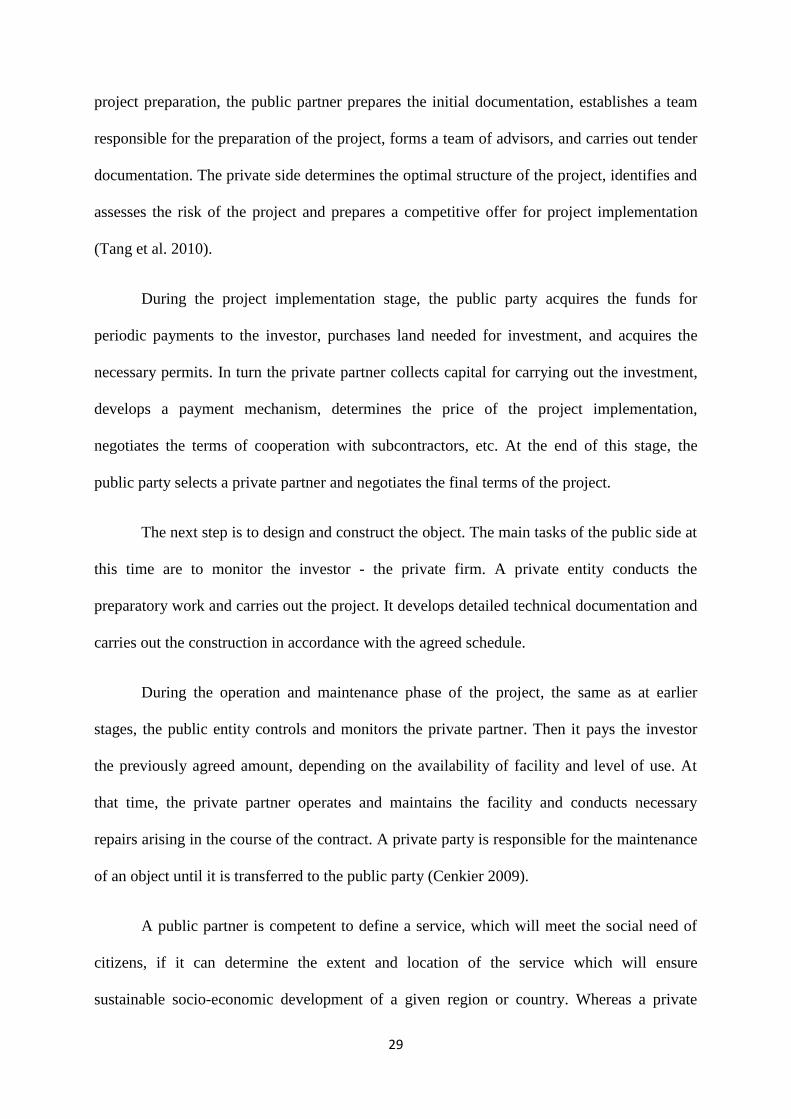
Figure 4.
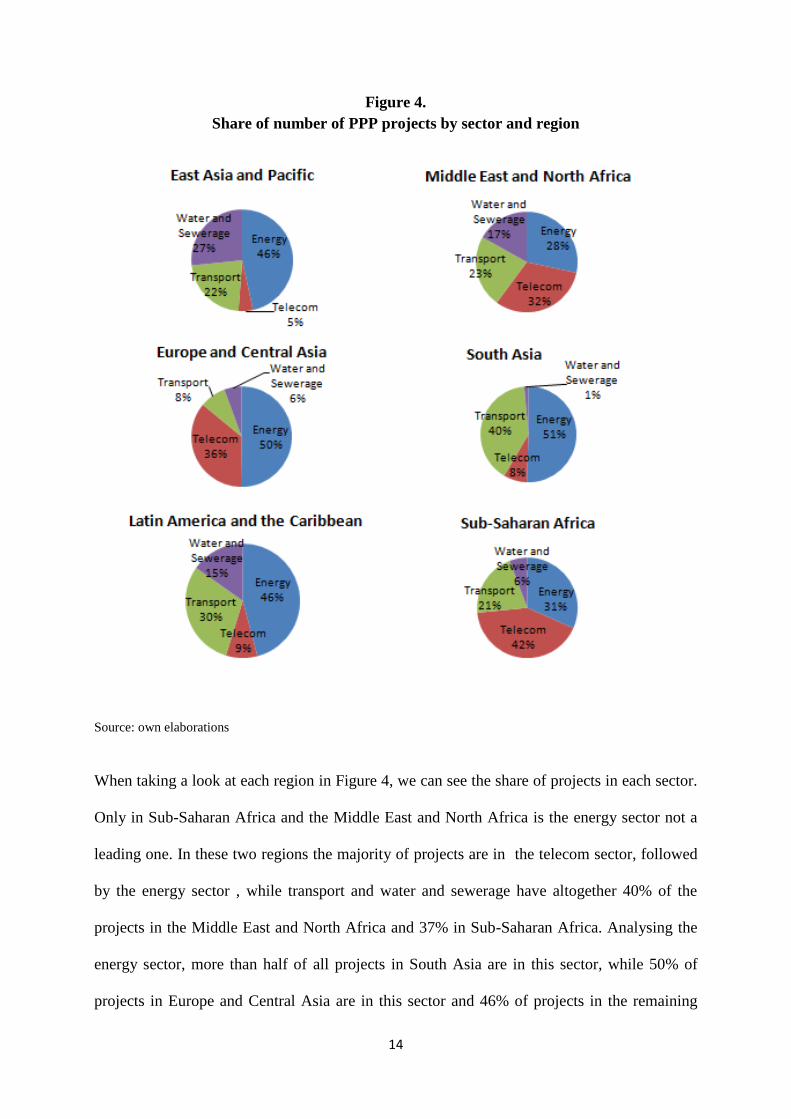
Share of number of PPP projects by sector and region
Source: own elaborations
When taking a look at each region in Figure 4, we can see the share of projects in each sector.
Only in Sub-Saharan Africa and the Middle East and North Africa is the energy sector not a
leading one. In these two regions the majority of projects are in the telecom sector, followed
by the energy sector , while transport and water and sewerage have altogether 40% of the
projects in the Middle East and North Africa and 37% in Sub-Saharan Africa. Analysing the
energy sector, more than half of all projects in South Asia are in this sector, while 50% of
projects in Europe and Central Asia are in this sector and 46% of projects in the remaining
15
two areas, East Asia and the Pacific and Latin America and the Caribbean. Telecoms is the
second most popular sector in Europe and Cental Asia, whereas it is of low importnce in East
Asia and Pacific where only 5% of projects are undertaken in this sector. Also water and
sewerage projects are of low importance in South Asia as only 1% projects are done in this
sector as well as in Europe and Central Asia where 6% of projects are of this kind.
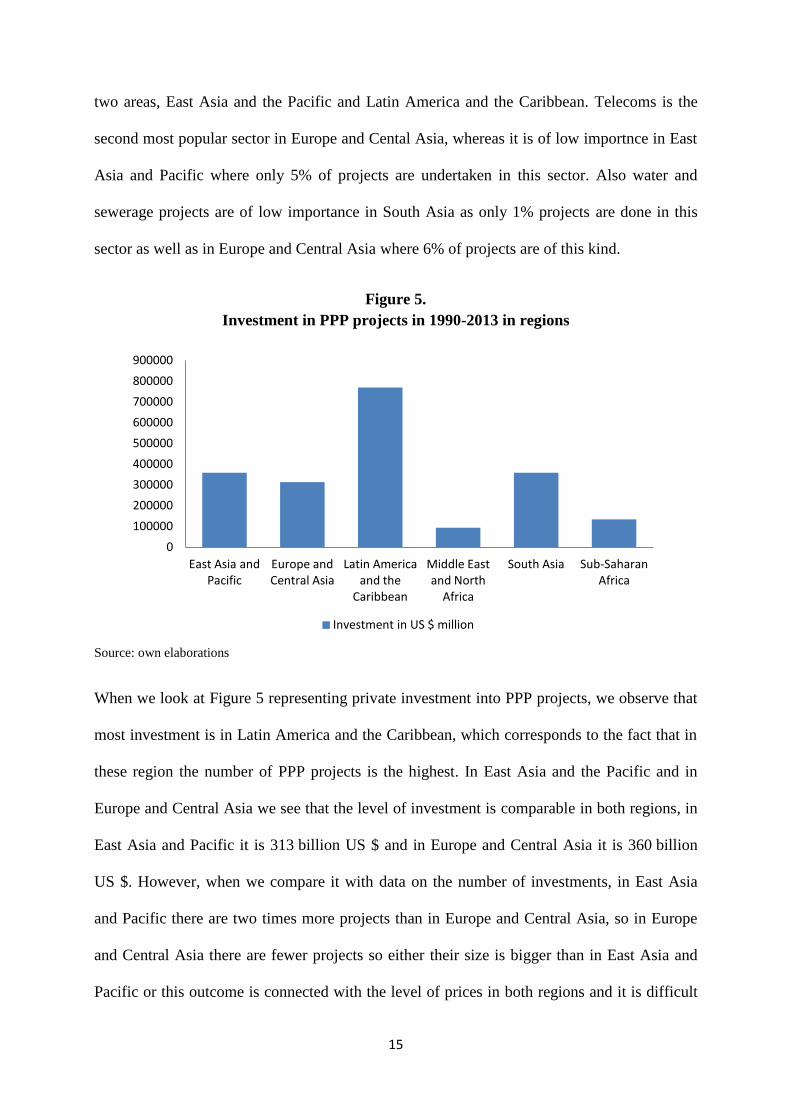
Figure 5.
Investment in PPP projects in 1990-2013 in regions
Source: own elaborations
When we look at Figure 5 representing private investment into PPP projects, we observe that
most investment is in Latin America and the Caribbean, which corresponds to the fact that in
these region the number of PPP projects is the highest. In East Asia and the Pacific and in
Europe and Central Asia we see that the level of investment is comparable in both regions, in
East Asia and Pacific it is 313 billion US $ and in Europe and Central Asia it is 360 billion
US $. However, when we compare it with data on the number of investments, in East Asia
and Pacific there are two times more projects than in Europe and Central Asia, so in Europe
and Central Asia there are fewer projects so either their size is bigger than in East Asia and
Pacific or this outcome is connected with the level of prices in both regions and it is difficult
0
100000
200000
300000
400000
500000
600000
700000
800000
900000
East Asia and Pacific
Europe and Central Asia
Latin America and the
Caribbean
Middle East and North
Africa
South Asia Sub-Saharan Africa
Investment in US $ million
16
to state much about the scope of the projects given these data only. Similarly, in East Asia and
the Pacific and in Latin America and the Caribbean the number of projects is comparable,
whereas the amount of investment in Latin America and the Caribbean is more than twice as
large as that in East Asia and the Pacific. The level of investment is roughly the same in East
Asia and the Pacific, Europe and Central Asia and South Asia. Whereas it is the smallest in
Middle East and North Africa and Sub-Saharan Africa.
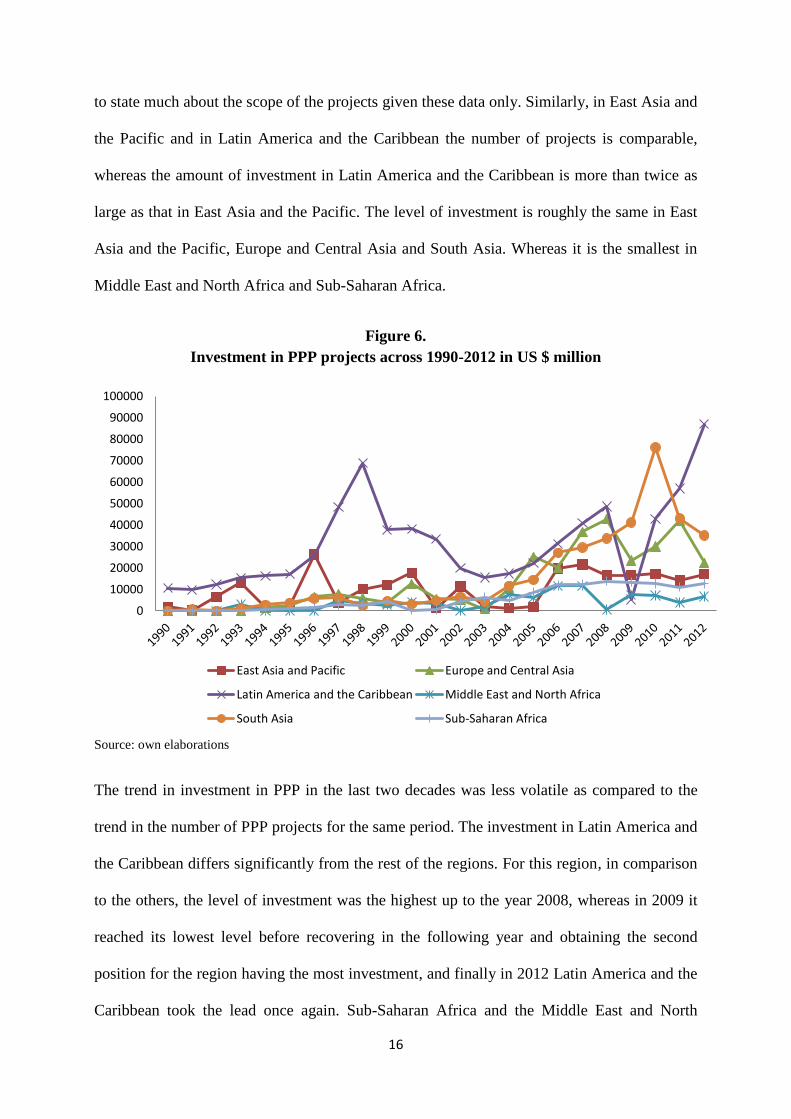
Figure 6.
Investment in PPP projects across 1990-2012 in US $ million
Source: own elaborations
The trend in investment in PPP in the last two decades was less volatile as compared to the
trend in the number of PPP projects for the same period. The investment in Latin America and
the Caribbean differs significantly from the rest of the regions. For this region, in comparison
to the others, the level of investment was the highest up to the year 2008, whereas in 2009 it
reached its lowest level before recovering in the following year and obtaining the second
position for the region having the most investment, and finally in 2012 Latin America and the
Caribbean took the lead once again. Sub-Saharan Africa and the Middle East and North
0
10000
20000
30000
40000
50000
60000
70000
80000
90000
100000
East Asia and Pacific Europe and Central Asia
Latin America and the Caribbean Middle East and North Africa
South Asia Sub-Saharan Africa

17
Africa had almost the same level and trend in investment in PPP projects, with one exception,
namely in the year 2008 in Middle East and North Africa there was a drop to almost no
investment whereas in Sub-Saharan Africa the size of investment did not change in the years
2006-2012. Also in South Asia and Europe and Central Asia the level of investment is similar,
especially in the years 1990-2008. In 2010 there is the greatest difference in investment in
PPP in both regions. The region East Asia and the Pacific had the most changing pattern of
invested resources in PPP projects. The level rose to the year 1993, before falling to rise again
in 1996, decreasing again before remaining stable from 1998 to 2000. The trend was then
volatile and since 2006 has remained at the same level.
Figure 7.
Investment in PPP projects in 1990-2012 according to sectors
Source: own elaborations
From figure 7 we learn that the sector which receives the most resources is the telecom sector,
which when it comes to the number of PPP projects was the second lowest, so we can say that
telecom projects require substantial expenditures. The second sector when analyzing the
amount of investment was the energy sector in which there was the greatest number of PPP
projects. The transportation sector receives the smallest amounts, while it had the second
largest number of PPP projects, so we may say that the transport projects do not on average
0 200000 400000 600000 800000 1000000
Telecom
Energy
Transport
Water and sewerage
Investment in US $ million
18
generate much expenditure when compared to other sectors. When analyzing the water and
sewerage sector, we can observe that the number of PPP projects into this sector is very
similar to the number of telecom projects, however the amount of investment is incomparably
smaller in the water and sewerage sector than in the telecoms sector.
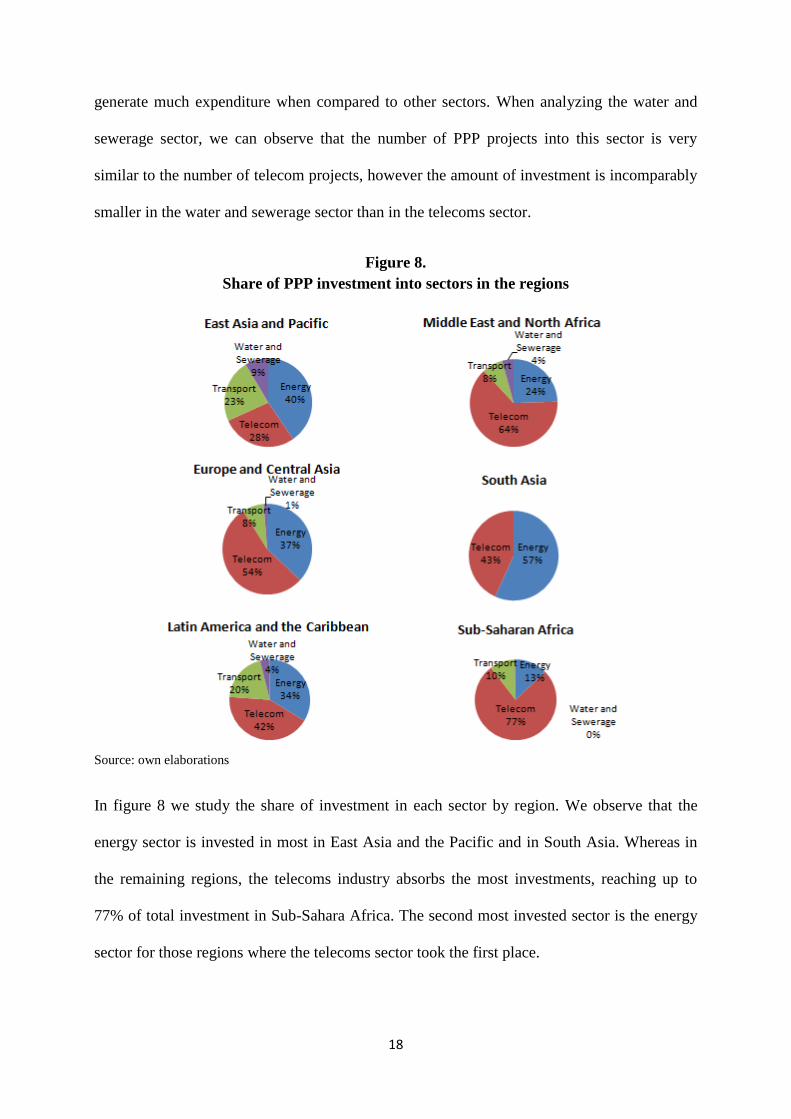
Figure 8.
Share of PPP investment into sectors in the regions
Source: own elaborations
In figure 8 we study the share of investment in each sector by region. We observe that the
energy sector is invested in most in East Asia and the Pacific and in South Asia. Whereas in
the remaining regions, the telecoms industry absorbs the most investments, reaching up to
77% of total investment in Sub-Sahara Africa. The second most invested sector is the energy
sector for those regions where the telecoms sector took the first place.

19
Figure 9.
Top 10 countries by PPP projects in 1990-2012
Source: own elaborations
Having a brief look at figure 9, we get to know the top 10 countries by PPP projects in the
years 1990-2012. As we can see, China takes the leading position with more than 1000 PPP
projects, which gives around 50 projects per year. In second position is a South Asian
country, India, though it has a lot fewer PPP projects. Third position goes to Brazil with
almost 650 projects. The remaining places in the top ten all have more than 100 projects and
these countries are Russiak, Argentina, Mexico, Colombia, Turkey, Chile and Philippines.
1064
725 643
337
214 204 140 138 134 123
Number of projects
20
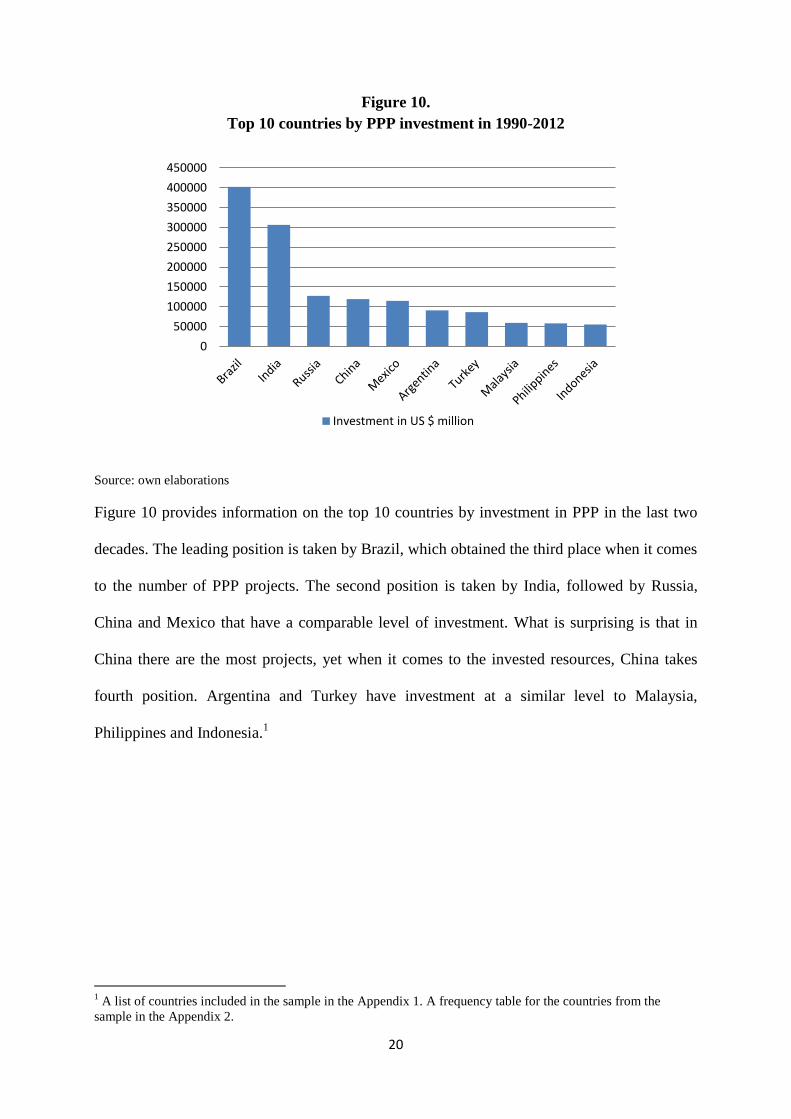
Figure 10.
Top 10 countries by PPP investment in 1990-2012
Source: own elaborations
Figure 10 provides information on the top 10 countries by investment in PPP in the last two
decades. The leading position is taken by Brazil, which obtained the third place when it comes
to the number of PPP projects. The second position is taken by India, followed by Russia,
China and Mexico that have a comparable level of investment. What is surprising is that in
China there are the most projects, yet when it comes to the invested resources, China takes
fourth position. Argentina and Turkey have investment at a similar level to Malaysia,
Philippines and Indonesia.1
1 A list of countries included in the sample in the Appendix 1. A frequency table for the countries from the
sample in the Appendix 2.
0
50000
100000
150000
200000
250000
300000
350000
400000
450000
Investment in US $ million
21
2. Economic effectiveness of PPP
One of the supposed advantages of PPP is its potential economic effectiveness, which
means that the benefits of PPP for society are higher in comparison with other methods of
provision of public goods. This means that the PPP project will be cheaper or of a higher
quality. This is possible thanks to the involvement of private entities into the project and the
greater effectiveness of PPP might be due to advantages of private ownership. The private
sector is guided by the principle of profit maximization and can make better use of the
resources in comparison with the public sector. In the case of the public sector, government
officials frequently lack incentives to reduce costs, improve the quality of services, introduce
innovation or increase effectiveness measures. In addition, the interests of government
officials do not have to be in line with the interests of society as a whole because as well as
other market participants, officials are trying to maximize their own utility. Their objective is
to be promoted, reelected, to enrich themselves or destroy political opponents (Kopańska et
al. 2008). Therefore the provision of public goods through private sector participation can
improve the efficiency of operations and contribute to a maximization of the utility of a
society.
Due to its public nature, the choice of the project and its implementation should be an
effective and fair allocation of resources and the project should successfully meet the public
need, meaning that the goal of the venture is achieved. Economic efficiency means that during
the evaluation of the profitability of the investment it is necessary to take into account its
benefits and costs from the perspective of society as a whole, the value of which is measured
in money. When the social benefits outweigh the social costs, the project is cost-effective.
Fair allocation of resources is when the benefits and costs of investment are divided among
the parties interested in using the service or the product. Thus, a fair allocation of resources
22
assumes a distribution of the benefits and participation in the costs of those who use the
public good (Kopańska et al 2008).
In the case of public goods investment it is rarely possible to observe the income due
to its public nature. Therefore, it is impossible to determine the effectiveness of investments
on the basis of revenues and costs. That is why when choosing an investment project, Cost-
Benefit Analysis (CBA) is conducted, which is an assessment of the effectiveness of the
results of the investment (Brzozowska 2006). Using this method in the selection process of
projects to undertake, different variants are compared with the existing situation and a project
is chosen which improves social welfare. Such projects, which bring the greatest value for the
public interest are referred to as having the best value for money, meaning they create the
highest social benefit (Kopańska 2008).
Another method of assessing the profitability of infrastructure investments is for
example evaluation of the process effectiveness, which is based on an administrative
monitoring of financial accounting systems, management and data archiving (Brzozowska
2006).
In the further parts of this section Cost-Benefit Analysis will be discussed in detail as
this method has the greatest economic justification in the selection process of public
investment. Also the concept of value for money is commonly used in the literature on PPP.
Both methods are used to assess the effectiveness of projects and to select a project for
implementation which will bring the greatest benefit to the whole society.
To create an effective PPP investment certain economic and project conditions have to
be met. Guidelines for successful and effective PPP cover such areas as inclusive
development and affordability, trust and cooperation, stability and predictability,
23
accountability and risk management as well as infrastructure financing optimization (Le
Bideau el al. 2006), which will discussed in more detail below.
2.1. Inclusive development and affordability
Effective PPP investment would engage in infrastructure projects which aim at
ameliorating living conditions and enabling people to access basic services indispensable for
life. Infrastructure decreases poverty across two dimensions, first of all, it enhances growth
and secondly it helps the poor to have an access to elementary services. That is why
infrastructure is a decisive factor for sustained economic growth and is needed for any sector
to operate. It is also an important production input as it delivers goods to markets, workers to
industry, facilitates trade and generally decreases transportation costs. Hence, involvement of
private partners in projects supporting inclusive development i.e. projects contributing to
development of poor communities from developing countries, is one of the aspects that
constitute an effective PPP.
PPP projects have the potential to improve the socio-economic situation of developing
countries while maintaining socially affordable charges. The role of the public party is to keep
the cost at a level acceptable to the final consumer. The public sector decides on the
objectives of the project and the extent to which the autonomy of private party should be
granted. Its responsibilities also include ensuring through an appropriate structure of the
partnership that the private company provides the service at a proper quality. Government
should also control and have an influence on the price setting process, so that the price policy
is consistent with government's policy and the service is affordable to the local community.
Besides, public entities should maintain favorable conditions for the private sector e.g.
launching supporting policy, carrying out institutional and judicial reforms that prevent
corruption and improve governance.
24
2.2. Trust and cooperation
To develop effective PPP, trust and cooperation between partners is necessary. Long
term contracts, of which PPP is clearly one, cannot function successfully without trust and
mutual assistance between partners. It is also important to remember that the parties are
partners and not opponents and that their collaboration throughout the duration of the
partnership, which may be 10-50 years, has to continue for the investment to achieve success.
Although PPP projects are usually long-term contracts, they should also be adaptable to
changing needs throughout the course of the partnership. To obtain a full optimization of the
project long-term arrangements are preferable, with such duration ranging from 10 to 50
years. Nevertheless shorter commitments, like 5 to 7 years, may also be efficient. For long-
term contracts it is important to plan the operational framework of the investment. It ought to
be predetermined what impact of the investment there would be on the service price over the
years as well as the service price increases should be moderated. Besides, a private partner
should obtain a decent return on the invested funds. Also the level of control of the PPP
venture has to be set up. Even though the reason a private party is invited into such projects is
that the private sector can better manage the project, there is the need for a high level of
control of the private company by the public entity due to the social context of the
partnership. The control is vital to ensure the required level of performance of the private
firm.
To obtain a partnership based on trust between public and private parties but also
among other participants such as staff, customers, suppliers etc., requires that certain
conditions concerning the partnership are met. First of all, there has to be a clear division of
tasks and roles between the partners. A stable regulatory environment is required, which
ensures that the rules would not change during the contract, and which has to be prepared with
great detail as inappropriate simplifications may jeopardize the success of the PPP project

25
(Marques and Berg 2010). What is also important is the transparency of procedures, decision
making process and transfer of information. Besides, the public party has to pay deep respect
to the autonomy it has given to the private company throughout the partnership. In addition,
performance evaluation criteria have to be set and obeyed and the contract should state the
procedure for solving possible problems and misunderstandings between partners. In general,
the more clearly the contract is prepared i.e. the objective of the project and performance
criteria are explicitly stated, the more trust is present between the partners. What is more, to
build trust with the stakeholders, all interested parties have to have access to information as
without the support of staff and customers in the decisions taken by the public authority,
effective and sustainable PPP investment is impossible. A relationship of common respect and
dialogue is a prerequisite for successful PPP.
2.3. Stability and predictability
In establishing PPP contracts certain prerequisites concerning stability and the
predictability of a country should be present to have an effective PPP contract. These are
stable macroeconomic conditions, the presence of local well-developed financial markets, the
availability of legal procedures and contract frameworks as well as effective measures against
corruption and illegal actions. However, before any formal PPP contract is signed,
transparency and legal security should be present to obtain confidence and prevent any
possibility of corruption (Marques and Berg 2010). That is why the public party's duties
include providing an efficient regulatory scheme to make the environment as predictable as
possible and to avoid changing the rules of the game. What is also important is that related
markets are open to competition between private companies and the private sector establishes
rules for access to the infrastructure. Also efficient and comprehensive terms and conditions
for procurement ought to be present to assure open access. To build a long term contract
between the private and public sector, both parties should concentrate on the stability of their
26
cooperation. The public side supports the quality of the service provided by the private firm
and emphasizes its continuity. As there is no one pattern or legal tool on how to establish a
PPP contract, each project is an individual case, with the private company expecting that the
legal conditions will be stable during the partnership in order to have a successful and
effective project. However, all parties involved in PPP projects should aim at establishing
standards in designing PPP contracts which will help to maintain stability throughout the
whole venture.
To obtain stability and predictability of the partnership, an efficient distribution of
risks between the parties should be defined as well as a proper contractual framework of the
project. Risk allocation should be conducted according to the partners' ability to assess,
control and cope with various risks since an optimal and efficient risk allocation is of critical
importance to succeed with an effective PPP project (Jin and Zhang 2011). Moreover
measures for the renegotiation of the partnership should be determined in the case of
unpredicted situations. In addition conflict solution procedures ought to be settled to help
resolve isputes and prevent a disruption in service supply. The private partner should comply
with agreements that were set by both partners to promote stability and predictability, it
should also provide procedures for resolving complaints from unsatisfied users and should
track the provision of the service and monitor it in case of momentary loss of control of the
public entity.
2.4. Accountability and risk management
Managing accountability and risk management in PPP projects is not a trivial matter
due to possible misunderstandings which may occur between private and public parties. For
this reason, integration of the underlying risks and end efficient management of the entire
project cycle is a key factor (Doloi 2012). Since it is known that public and private accounting
27
are different, each party must know the principles and rules which are in effect to evaluate
performance. Accounting in the private sector may not reflect the true evaluation because it
does not take into account risk management and might not adequately cope with
accountability. It uses the budgetary concept, expenditures and receipts are presented as a
function of changes in cash flows. It is difficult in the public sector to evaluate performance
since revenues and expenditures are not connected with the provision of the public service or
the transfer of public goods. There is also no balance sheet and there is no differentiation
between expenses and fixed assets as well as no concept of commitments given and received.
Thus, public sector accounting does not provide an accurate outlook of the asset base of the
public sector. The public sector does define financial aggregates in a sound way and does not
publish full financial statements differentiating the income statement. As a consequence, the
public entity's performance can be counted on the basis of the funds allocated to it in the
budget and cannot be evaluated using the operating income it creates. Cooperation with the
private partner through a PPP in managing infrastructure or public services enables the public
sector to have access to the "best practice" that functions in business to ameliorate the
effectiveness and conduct decent measures of public sector's performance.
Also according to Robertson and Acar (1999) there are three dimensions of
accountability, which together help to create effective PPP that would serve the public
interest. These are community accountability, which ensures that the project effectively
addresses the needs of the community for whom the service will be provided and incorporates
different views and perspectives that are crucial in the decision making process to enhance the
responsiveness of the partnership to the public interest; Partner accountability, which is
defined as a mechanism, which holds each partner accountable to gain effectiveness from the
project and which requires partners to work towards obtaining a consensus definition of the
objectives and strategies to obtain the desired aims of the project; and moral accountability,
28
which serves to guide the actions of the parties and individuals of the PPP to increase their
commitment to serve the public interest despite there existing significant variations of the
participants’ values and norms.
3. Advantages of PPP and Cost -Benefit Analysis
3.1. On time and within budget
Experience shows that when a public task is carried out throughout PPP, it is more
likely that the investment will be completed on time and within a budget (Tang et al. 2010). A
private entity receives a payment from the users or a operational readiness fee from the public
sector when the investment is completed. It is a strong incentive for the investor to complete
the construction on time and not to exceed the budget. In addition, conducting thorough
analyses before a partnership allows for more accurate cost assessment and investment plan.
According to the UK Treasury, 73% of traditional public investment exceeds the planned
budget and 70% of the projects are not completed on time. In the case of PPP investment only
20% of the projects are over budget and 24% are delayed (Thomson and Goodwin 2005,
Duffield and Raisbeck).
In PPP projects, the costs of preparing the partnership are usually higher than the costs
of preparing the project to be carried out in a traditional way. This is connected with detailed
risk and investment analyses, which have to be done in the case of PPP. Although the increase
in costs is significant, the whole investment is more reliable due to the better preparation of
PPP projects. Thus, the value for the whole society is greater (Kopańska et al. 2008).
3.2. Division of tasks
The idea of cooperation between the sectors is based on the belief that both the public
entity and the private sector can perform some of the tasks better. At each stage of a PPP
project, a public and a private partner have different tasks to perform. Firstly, at the stage of
29
project preparation, the public partner prepares the initial documentation, establishes a team
responsible for the preparation of the project, forms a team of advisors, and carries out tender
documentation. The private side determines the optimal structure of the project, identifies and
assesses the risk of the project and prepares a competitive offer for project implementation
(Tang et al. 2010).
During the project implementation stage, the public party acquires the funds for
periodic payments to the investor, purchases land needed for investment, and acquires the
necessary permits. In turn the private partner collects capital for carrying out the investment,
develops a payment mechanism, determines the price of the project implementation,
negotiates the terms of cooperation with subcontractors, etc. At the end of this stage, the
public party selects a private partner and negotiates the final terms of the project.
The next step is to design and construct the object. The main tasks of the public side at
this time are to monitor the investor - the private firm. A private entity conducts the
preparatory work and carries out the project. It develops detailed technical documentation and
carries out the construction in accordance with the agreed schedule.
During the operation and maintenance phase of the project, the same as at earlier
stages, the public entity controls and monitors the private partner. Then it pays the investor
the previously agreed amount, depending on the availability of facility and level of use. At
that time, the private partner operates and maintains the facility and conducts necessary
repairs arising in the course of the contract. A private party is responsible for the maintenance
of an object until it is transferred to the public party (Cenkier 2009).
A public partner is competent to define a service, which will meet the social need of
citizens, if it can determine the extent and location of the service which will ensure
sustainable socio-economic development of a given region or country. Whereas a private
30
partner is more experienced in managing challenging projects and has more practice in
collaboration with stakeholders and partners. The private investor, who usually operates in a
turbulent environment can quickly adapt to changing conditions and adjust its business to the
new environment. It is also more prepared for management of the facility during the life cycle
(Gajewska-Jedwabny 2007).
By combining the competencies of both sectors, project efficiency increases in
comparison with a traditional way of providing public services. In addition, both parties
benefit from the cooperation: the state provides a service of a good quality and at a reasonable
cost and the private party receives a fair return on the invested capital.
3.3. Additional investment
An important benefit of PPP is that it enables additional investments which might not
have been made but for PPP. State budget constraints often do not allow extended investment
in infrastructure, which is why PPP is frequently an alternative form of carrying out a project,
which otherwise would have to be postponed.
Although from the macroeconomic point of view, a rise in public investment leads to a
decrease of private investment and the total investment remains at the same level, there is no
evidence that PPP projects crowd out private investment, except in the construction industry,
where such a situation may occur. Moreover, this feature of PPP makes it attractive from the
political point of view as PPP projects can reduce government spending on infrastructure
investment since the private sector may cover the costs of investment (Yescombe 2008). It is
also believed that the move towards private participation in infrastructure does not substitute
private sector capacity for public private capacity, rather it promotes new forms of public
sector capacity to be designed and implemented in order to face and overcome different
challenges that infrastructure encounters (Jooste et al. 2011).

31
3.4. Cost-Benefit Analysis and value for money in PPP
It seems obvious that not every project can be carried out in the PPP form. In order to
benefit from intersectoral cooperation, the projects should be characterized by certain
features. First of all, it is important that the assets involved in the project are easy to evaluate
in the subsequent years of the project. A fair estimate of their value will be needed to carry
out financial analysis of the project, so that the project is financially transparent and would
not raise concerns for a society, who can understand the PPP as privatization. Also PPP
projects have to be large and of high value due to the considerable costs associated with legal
preparation for PPP as well as its long-term nature. In the case of smaller projects a series of
risk and profitability analyzes, preparation of legal formalities and other procedures necessary
for the implementation of the PPP could increase significantly the cost of investment, which
in turn might lead to project ineffectiveness. In addition, on the market there should operate a
sufficient number of companies, which have experience in this type of projects so that the
chosen investor is the most competitive one (Kopańska et al. 2008).
PPP is often used in the transportation sector, the health service, water and sewerage
systems, etc. Frequently the transportation industry is the first in which PPP projects are
implemented in a given country. Then a private party provides an integrated service, so in the
case of the transportation industry this could include: building infrastructure components such
as roads, bridges, viaducts; providing means of transportation, e.g. buses; and providing other
facilities such as parking lots or waiting areas. As a result, the private partner becomes a
comprehensive supplier of transport infrastructure. The scope of the application of PPP into
transportation is not limited to road infrastructure as PPP may also be implemented in water,
rail and air transport. In health care the activities ascribed to a private party might include the
construction of hospitals, clinics; the provision of non-clinical services such as cleaning,
washing, catering, the purchase and maintenance of equipment, or pharmaceutical services. In
32
the water and sewerage sector a private party might be contracted to construct or renovate
existing sewerage treatment, sewerage or water systems and to operate the facility. Other
areas in which PPP might be carried out could include waste management, sports and leisure
facilities etc. (Gajewska-Jedwabny 2007).
In addition, PPP projects would be an effective way of providing social services,
provided that the quality of the built assets by the private party has a negative impact on the
cost of the service in the future. Then the private entity that is responsible for the construction,
operation and long-term service delivery is motivated to build a facility of sufficient quality.
A private entity which maximizes the revenue would provide an object of satisfactory quality,
which in the future will reduce the maintenance and renovation costs (Kopańska et al. 2008).
It is worth mentioning those cases when PPP would not be an optimal way of carrying
out a public task. Firstly, if the quality of the constructed assets does not affect the cost of
providing services, in other words, regardless of whether the investor builds a facility of high
or low quality, the cost of the service will be unchanged. Then a private investor does not
have an incentive to construct an object of high quality, so PPP will not be the optimal
solution if the public sector cares about the quality of the delivered facility (Kopańska et al.
2008). Secondly, there exist sectors where operation should remain in the hands of the public
sector e.g. the armed forces due to security reasons. However, private companies can provide
various services to the military services such as catering or accommodation (Yescombe 2008).
In order to obtain an effective PPP investment, the aggregate benefits should be
greater than the aggregate social costs. The social benefits may include the construction of a
public facility, an increase in the investment attractiveness of a region, the development of
local workforce skills by training programs, increased tax revenues or the development of
local capital markets (Brzozowska 2006).

33
There might be distinguished four steps in conducting analysis of social costs and
benefits, so-called cost-benefit analysis (CBA) (Brzozowska 2006).
1. Identification of factors which affect society in a positive and negative way in relation to
the planned infrastructure investment.
2. Valuation of the costs and benefits expressed in monetary terms.
3. Choice of the discount rate in order to calculate the present value of the investment and
other calculations.
4. Selection of the project which generates the highest surplus of total benefits over total
costs.
The first step is to identify the benefits and the costs to society, which include, for
example, services of a higher quality or better access to services and in the case of costs may
include higher charges. The next step is to measure the benefits and costs. To do this it is
necessary to determine consumer's surplus coming from the completed investment. If the
project aims at reducing maintenance costs of a facility for example, then consumer's surplus
will be captured in lower costs and will be measured by the decline in the price of the service.
In the analysis indirect i.e. external costs and benefits should not be ignored, which together
with direct costs and benefits constitute social costs and benefits.
It is worth mentioning that in the analysis of the costs and benefits of public
investments we deal with the valuation of non-market goods and intangible assets. That is
why apart from determining the direct value of the benefit, it is also possible to evaluate it on
the basis of intermediate market value or refer to social values. In the case where it is
impossible to estimate the benefit, the effectiveness of the project can be determined on the
basis of cost analysis. This method of effectiveness calculation is called the minimum cost
34
method. Then among projects with similar operating parameters, there should be selected the
one which has the lowest total investment and operating costs.
The next step is the selection of the discount rate. This is a crucial choice since with a
too high discount rate a profitable investment might be rejected whereas a too low discount
rate can affect the overall rate of investment and the project might be ineffective. Among
many variants of the project, there is selected one which ensures the greatest net benefit, so
the investment should be carried out when there is achieved a surplus of total benefits over
total cost.
4. Existing Evidence - empirical studies concerning PPP
The concept of PPP is a relatively new form of cooperation between sectors and thus
there is little empirical research on the determinants of PPP projects. Probably the first study
concerning PPP was conducted in 2006 by the International Monetary Fund (Hammami et al.
2006). In this paper the researchers investigated the factors which influence the number of
PPP projects and the quantity of private investment in infrastructure in low and middle
income countries. In the study 7 regressions were estimated, which attempted to explain the
following issues: the determinants of the number of PPP projects in aggregate infrastructure
and in particular sectors i.e. energy, telecommunications, transportation, and the water sector.
In addition, the factors affecting the size of private investment as well as the share of private
sector participation in the implementation of PPP projects were investigated. The dependent
variables were: the number of PPP, private investment in PPP as well as the index of
involvement of the private sector in the PPP investment in particular countries in the years
1990-2003. The observations were taken from the database ‘Private Participation in
Infrastructure’ (PPI), which collects information on the involvement of the private sector in
infrastructure in 137 low and middle income countries. The authors studied the determinants

35
of PPP by focussing on 7 areas, namely: the state of public finances, political conditions,
market conditions, macroeconomic conditions, preparation of institutions, legal system and
previous experience in carrying out PPP projects.
The authors argue that the implementation of a PPP project in many countries is the
only possibility of the realization of the investment due to budgetary constraints. (Hammami
et al. 2006, Brzozowska 2006, Mausen and Krumm 2011) At this point, the PPP project can
bridge the gap between society's expectations concerning the state of infrastructure and the
financial resources of the government. (Davies and Eustice 2005). That is why a country
which has budget deficits and is struggling with debt will be more willing to participate in a
PPP (Shediac and Najjar 2008). In addition, the theory shows that countries with external
sources of income, coming from exports of natural resources undergo economic crises more
smoothly and are less motivated to open up to the market. Rentier countries having income
from abroad can ease the fiscal shock in that way, thus they are less determined to liberalize
the economy and open up to private investors. Therefore, in these countries there will be
fewer PPP projects PPP (Hammami et al. 2006). In the literature one can also find that
political conditions affect the development and implementation of PPP projects. Countries
with market economies will be more open to the involvement of private capital in
infrastructure projects. Countries not having a market economy will be more closed to
collaboration with the private sector and therefore in these countries there will be fewer PPP
projects (Yescombe 2008). In Hammami et al. the variables testing this hypothesis were the
number of opposition parties and the ruling party orientation (left-wing, centrist, right-wing).
Governments of countries where the diversification of citizens in terms of culture, linguistics
or religion is significant, they must respect the diversity of their citizens and will try to satisfy
their heterogeneous needs, including those related to infrastructure. So, the more ethnically
diverse a country the greater the need for infrastructure investment, which will lead to a larger
36
number of projects PPP (Hammami et al. 2006). The above mentioned conditions (a level of
indebtedness of a country, diversity of citizens, political attitudes) may stimulate or
discourage public entities from engaging in PPP projects.
It is also worth pointing out the factors that incline a private company to invest in PPP
projects. Private entities joining a partnership in many cases are obliged to commit to long-
term cooperation, which is subject to various kinds of risk. Therefore, a very important factor
for PPP projects will be the economic situation a country (Brzozowska 2006). Countries with
stable macroeconomic conditions attract investors. Stable and predictable policy, low inflation
as well as stable exchange rates reduce the risk of failure of the project and encourage
investors to PPP projects (Hammami et al. 2006, Moszorno 2010). Investing in infrastructure
requires a significant amount of effort and the payback period of investment is long. That is
why the size of demand and the size of the population is important for the introduction of PPP
projects. Hence, a factor that encourages the private sector to engage in PPP projects is a large
market. The bigger the population and the greater the size of aggregate demand, the smaller
the risk of failure of an investment and of achieving a lower than expected rate of return by
the private investor. The higher the value of the GDP, the greater the rate of return for the
investor (Hammami et al. 2006). Furthermore, cooperation between public and private entities
is carried out through detail legal agreements, and therefore, an important role in the
formation of PPP projects is played by legal and government institutions. Corrupt civil
servants undermine investor confidence in the state and increase the risk of failure of the
investment. So, if the level of compliance with law is high, then the law is more efficient and
investors demonstrate greater willingness to cooperate with the public sector, because they
anticipate that their rights will be respected. On the other hand, a complicated and lengthy
process of the formation of PPP projects, which requires the preparation of comprehensive
documentation, discourages private entities to join PPP projects (Davies and Eustice 2005,
37
Hammami et al. 2006). Therefore, in countries where bureaucracy is too developed there will
be fewer PPP projects. At the same time, countries having experience in conducting PPP will
better attract investors to the formation of partnerships than countries in which this form of
cooperation is not established (Gajewska-Jedwabny 2007). Hammani et. al. (2006) used the
following variables to verify the research hypotheses concerning the determinants of the
number and size of private investment in PPP: the budget deficit, debt levels, ethnic diversity
(ethnic fractionalization), population size, the size of the real GDP, an index of corruption,
information on legal systems, earlier commitment and experience in PPP, export of fuels, and
inflation. Other explanatory variables were: the number of opposition parties and the ruling
party orientation (left-wing - negative impact, centrist - neutral, rightist - a positive impact on
the number of PPP projects). The researchers obtained the following results: the largest
impact on the number of PPP projects was from population and the size of GDP, which
affected the formation of PPP in a positive way. Inflation also proved to have negative impact
on the implementation of PPP projects. These factors were the most important. In addition,
theoretical considerations about the determinants of PPPs have been empirically supported in
the following areas: the state of public finances (public debt, the negative impact), the
strength of institutions (control of corruption, the positive impact), the legal system (the
indicator of legal terms, a positive effect), and previous experience in carrying out PPP
projects (positive impact). The political environment of a country was found to not affect the
number of PPP projects (number of opposition parties, the orientation of the ruling party, the
ethnic differentiation of the index were not statistically significant). The size of private
investment in PPP projects is affected by the same variables as the number of PPP projects. In
addition, the size of investment is affected by the variable 'number of opposition parties',
which has a positive impact when explaining the number of PPP projects this variable was not
statistically significant. This enables us to assume that the size of investments, not the number

38
of PPP projects, will be affected by the political conditions of the country. The study also
tested whether the country's geographic location affects the number of projects and
investments in PPP. All regions except the region of Europe and Central Asia are less
susceptible to a number of PPP investment in the region compared to the baseline, which was
Latin America and Caribbean (Hammami at al. 2006). It has has been shown by Davies and
Eustice (2005) that although in the non-European markets fewer PPP projects are conducted,
when it comes to the level of investment, it is similar to Europe.
Another paper addressing the issue of the determinants of PPP is the work by Reside
and Mendoza (2010). In this paper the researchers study the factors affecting the successful
formation of PPP projects in East Asia in the years 1984-2009. One of the reason for carrying
out the study was the fact that there are in this region a significant proportion of PPP projects,
in comparison with other areas, that were not completed due to the withdrawal of a private
partner. The authors conclude that the successful implementation of PPP is affected by a
stable macroeconomic situation; the level of GDP per capita; openness of the market, open
markets better attract foreign capital; the structure of property rights - the greater the part of
assets of PPP investment is in the hands of a private entity, the more likely the success of the
partnership. When it comes to country's political system, a presidential system carries a
significantly higher probability of success of a PPP project. Also the existence of profit
regulation of the private firm promotes the success of PPP project (Reside and Mendoza
2010).
Sharma (2012) analyses the determinants of PPP in infrastructure in developing
countries. He investigates the factors influencing PPP in panel estimations on 22 countries in
the years 1990-2008 and runs two regressions to account for the number of PPP projects and
total investment under PPP arrangements. It is the first attempt to investigate PPP
determinants exclusively for developing countries, which is also the main aspect in which it
39
differs from Hammami et al. (2006). In the research the author checks whether such factors as
the government's resources constraint, stable macroeconomic conditions, size of the market,
country risk, political environment or regulatory and effectiveness environment influence PPP
in developing countries. The results prove that macroeconomic stability, the size of markets
and regulatory environments are important determinants of the number PPP projects in
developing countries. Government effectiveness is also significant and it turns out to have a
negative impact, so if the public sector is effective, private firms are less motivated to engage
in PPP projects. The remaining factors did not turn out to have a significant impact. In
determining the factors for total investment, the results are similar, macroeconomic
conditions, the size of the market and regulatory environment prove to be important. That is
why the results suggest that developing countries with a stabilized macroeconomic situation,
substantial market size and good regulation with reliable institutions attract more investment
into PPP. A stable and predictable economic situation limits the risks of investment, which
otherwise might be high due to long-term arrangements which PPP involves. In determining
factors for the number of PPP, the results are in line with Hammami et al. (2006), who also
found a role for economic stability and market size. Yet the outcomes are different when it
comes to investment into PPP. Sharma's (2012) study implies that market size plays a role
whereas Hammami et al. (2006) did not find any relation in this matter. In addition,
governance proved to be a considerably significant determinant whereas in the Hammami et
al. (2006) study it turned out to have a marginal importance in accounting for PPP investment.
The difference in results might be caused by the use of different country samples for both
studies, Sharma focused on only 22 developing countries, whereas Hammami et al. (2006)
worked on all countries from PPI World Bank's database.
Public-Private Partnership or Private Finance Initiative, as was used primarily in UK,
as a form of provision of public goods was introduced in Great Britain for the first time on a
40
large-scale (Gajewska-Jedwabny 2007, Doloi 2012). The potential benefits coming from PPP
meant that other countries have begun to follow Great Britain in implementing PPP projects.
Since PPP may be an economically effective form of cooperation between sectors, which
may be used to improve social welfare, it is important to investigate the factors which affect
the number of PPP projects in different countries (Kopańska et al. 2008). Knowing the
determinants of PPP could contribute to the development and implementation of this
attractive form of providing public goods from the point of view of efficiency.
As PPP projects can be an attractive option when compared with a standard way of
provision of public goods i.e. only by the public sector, it is worth understand what influences
the implementation of PPP. In my research I would like to find out what impacts the number
of PPP projects in low and middle income countries. The structure of the research part is as
follows. First of all, the hypotheses that I make are summarized, which are stated on the basis
of the theoretical considerations discussed above. Then the methodology of the research is
described. In the next parts, the reader can learn about the data set used in the study and the
analysis of the variables. Then the estimation is discussed, where the variables in the model,
diagnostics, measures of model fit as well as partial effects are all discussed. Further I provide
an interpretation of the results, and a verification of the hypotheses as well as conclusions.
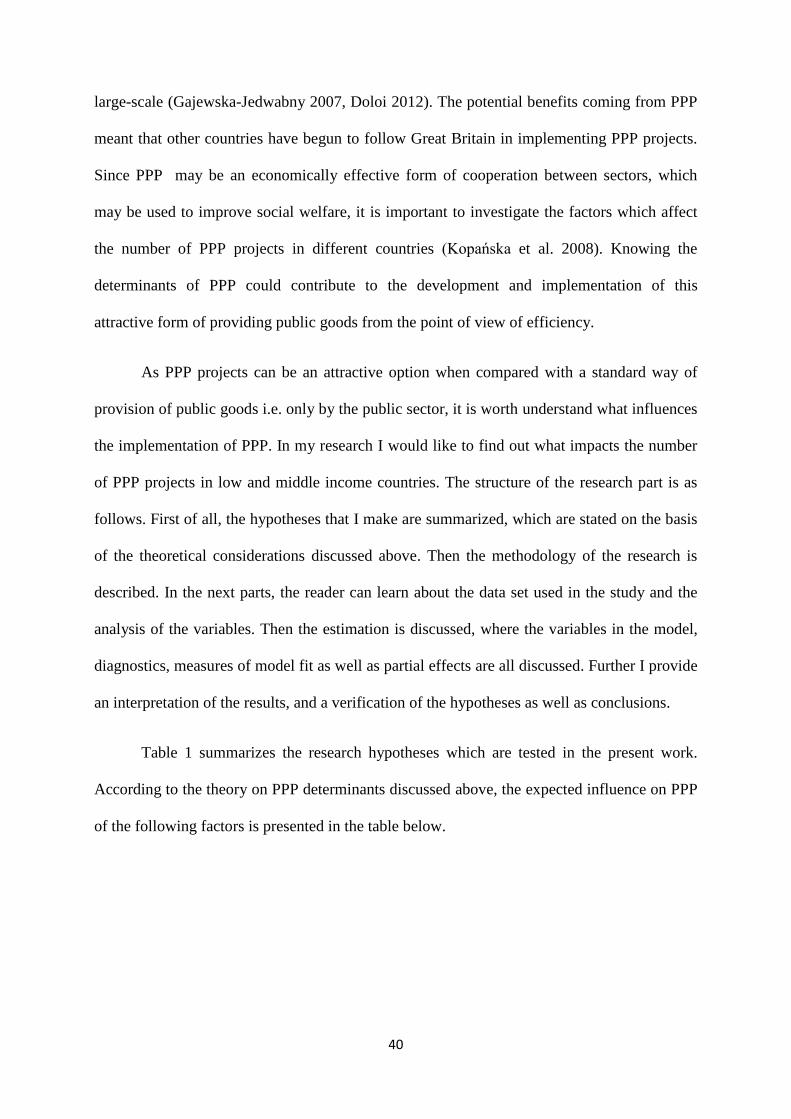
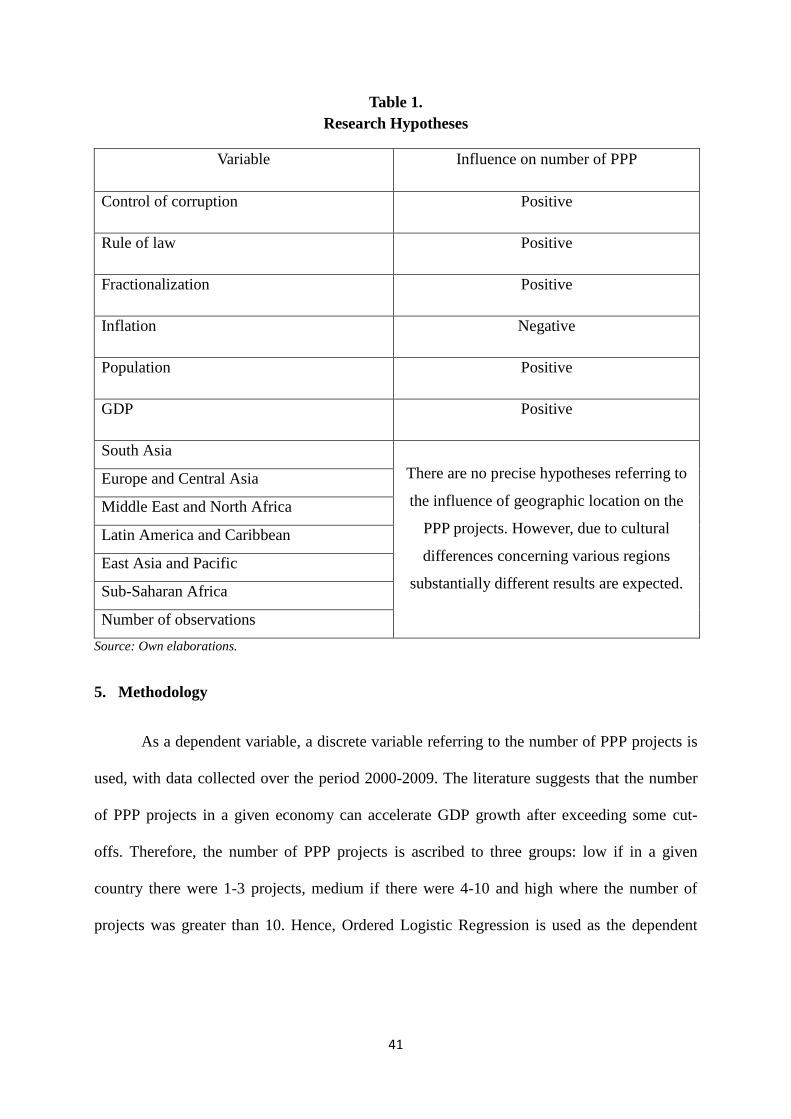
Table 1 summarizes the research hypotheses which are tested in the present work.
According to the theory on PPP determinants discussed above, the expected influence on PPP
of the following factors is presented in the table below.
41
Table 1.
Research Hypotheses
Variable Influence on number of PPP
Control of corruption Positive
Rule of law Positive
Fractionalization Positive
Inflation Negative
Population Positive
GDP Positive
South Asia
There are no precise hypotheses referring to
the influence of geographic location on the
PPP projects. However, due to cultural
differences concerning various regions
substantially different results are expected.
Europe and Central Asia
Middle East and North Africa
Latin America and Caribbean
East Asia and Pacific
Sub-Saharan Africa
Number of observations
Source: Own elaborations.
5. Methodology
As a dependent variable, a discrete variable referring to the number of PPP projects is
used, with data collected over the period 2000-2009. The literature suggests that the number
of PPP projects in a given economy can accelerate GDP growth after exceeding some cut-
offs. Therefore, the number of PPP projects is ascribed to three groups: low if in a given
country there were 1-3 projects, medium if there were 4-10 and high where the number of
projects was greater than 10. Hence, Ordered Logistic Regression is used as the dependent
42
variable takes three values 1, 2 and 3 accordingly to the described groups.2 Additionally, the
variable has been analysed according to the number of observations in each group.
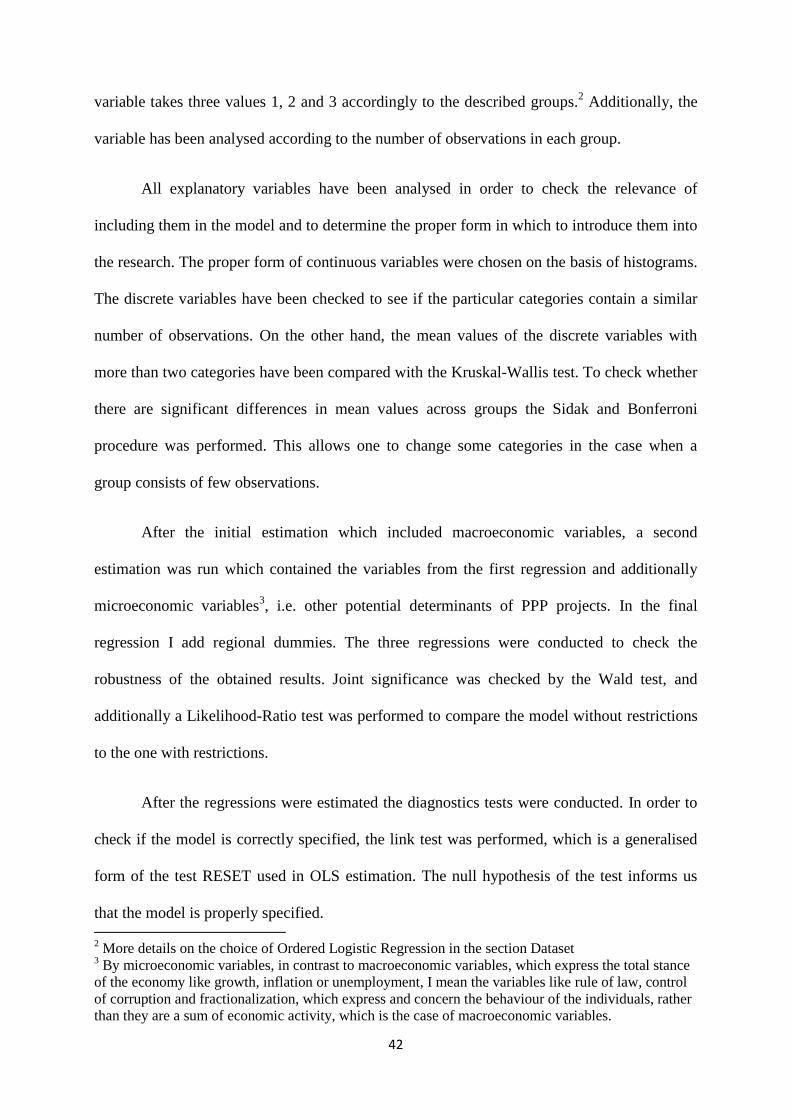
All explanatory variables have been analysed in order to check the relevance of
including them in the model and to determine the proper form in which to introduce them into
the research. The proper form of continuous variables were chosen on the basis of histograms.
The discrete variables have been checked to see if the particular categories contain a similar
number of observations. On the other hand, the mean values of the discrete variables with
more than two categories have been compared with the Kruskal-Wallis test. To check whether
there are significant differences in mean values across groups the Sidak and Bonferroni
procedure was performed. This allows one to change some categories in the case when a
group consists of few observations.
After the initial estimation which included macroeconomic variables, a second
estimation was run which contained the variables from the first regression and additionally
microeconomic variables3, i.e. other potential determinants of PPP projects. In the final
regression I add regional dummies. The three regressions were conducted to check the
robustness of the obtained results. Joint significance was checked by the Wald test, and
additionally a Likelihood-Ratio test was performed to compare the model without restrictions
to the one with restrictions.
After the regressions were estimated the diagnostics tests were conducted. In order to
check if the model is correctly specified, the link test was performed, which is a generalised
form of the test RESET used in OLS estimation. The null hypothesis of the test informs us
that the model is properly specified. 2 More details on the choice of Ordered Logistic Regression in the section Dataset
3 By microeconomic variables, in contrast to macroeconomic variables, which express the total stance
of the economy like growth, inflation or unemployment, I mean the variables like rule of law, control
of corruption and fractionalization, which express and concern the behaviour of the individuals, rather
than they are a sum of economic activity, which is the case of macroeconomic variables.
43
As the ordered logistic regression is used, it is also necessary to check if the
proportional odds assumption is satisfied so if the relationship between each pair of outcome
groups is the same. To do that the Brant procedure and a likelihood-ratio test of the
proportionality of odds across the response categories is carried out. In the case when the
proportional odds assumption is violated the model should be estimated by generalised
ordered logistic method.
The above described methodology has been used to determine factors that influence
the likelihood that the number of PPP projects in a given country would be low, medium or
high. On the basis of the literature, the proper functional form for the variables included in the
model was chosen, the data set has been analysed and the diagnostics conducted. In the next
section I provide a description of the data.
6. Dataset and analysis of variables
6.1. Dataset
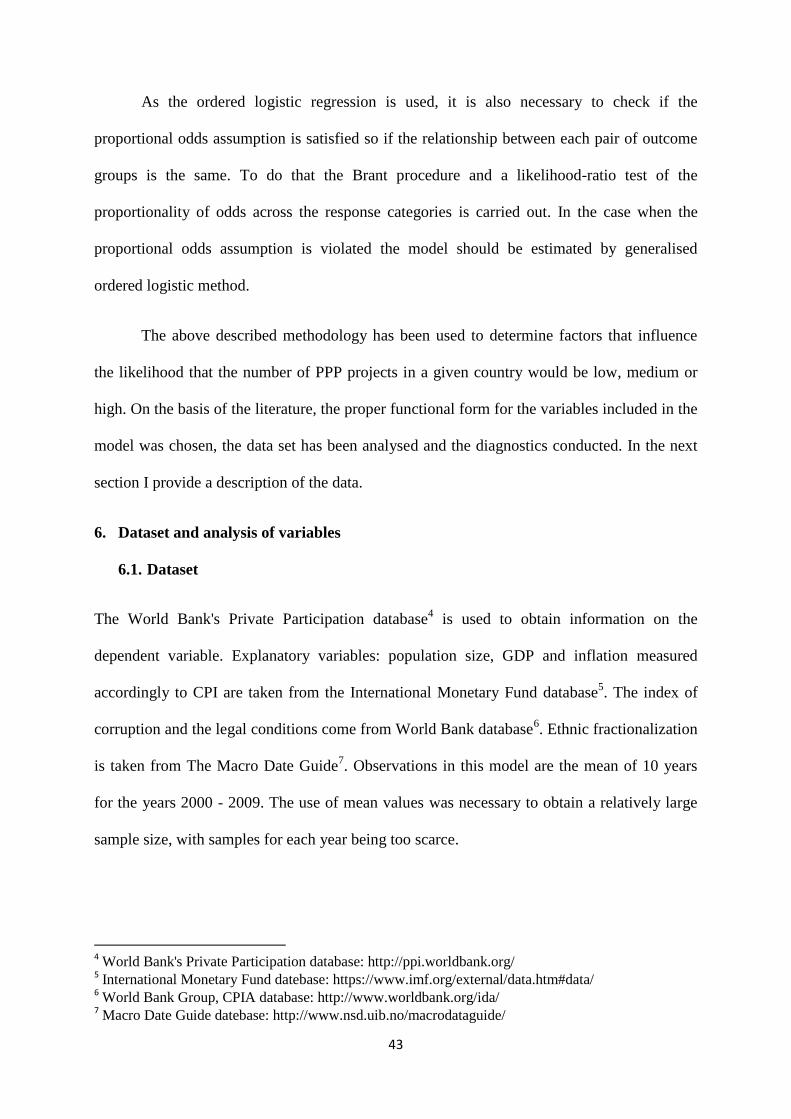
The World Bank's Private Participation database4 is used to obtain information on the
dependent variable. Explanatory variables: population size, GDP and inflation measured
accordingly to CPI are taken from the International Monetary Fund database5. The index of
corruption and the legal conditions come from World Bank database6. Ethnic fractionalization
is taken from The Macro Date Guide7. Observations in this model are the mean of 10 years
for the years 2000 - 2009. The use of mean values was necessary to obtain a relatively large
sample size, with samples for each year being too scarce.
4 World Bank's Private Participation database: http://ppi.worldbank.org/ 5 International Monetary Fund datebase: https://www.imf.org/external/data.htm#data/ 6 World Bank Group, CPIA database: http://www.worldbank.org/ida/ 7 Macro Date Guide datebase: http://www.nsd.uib.no/macrodataguide/
44
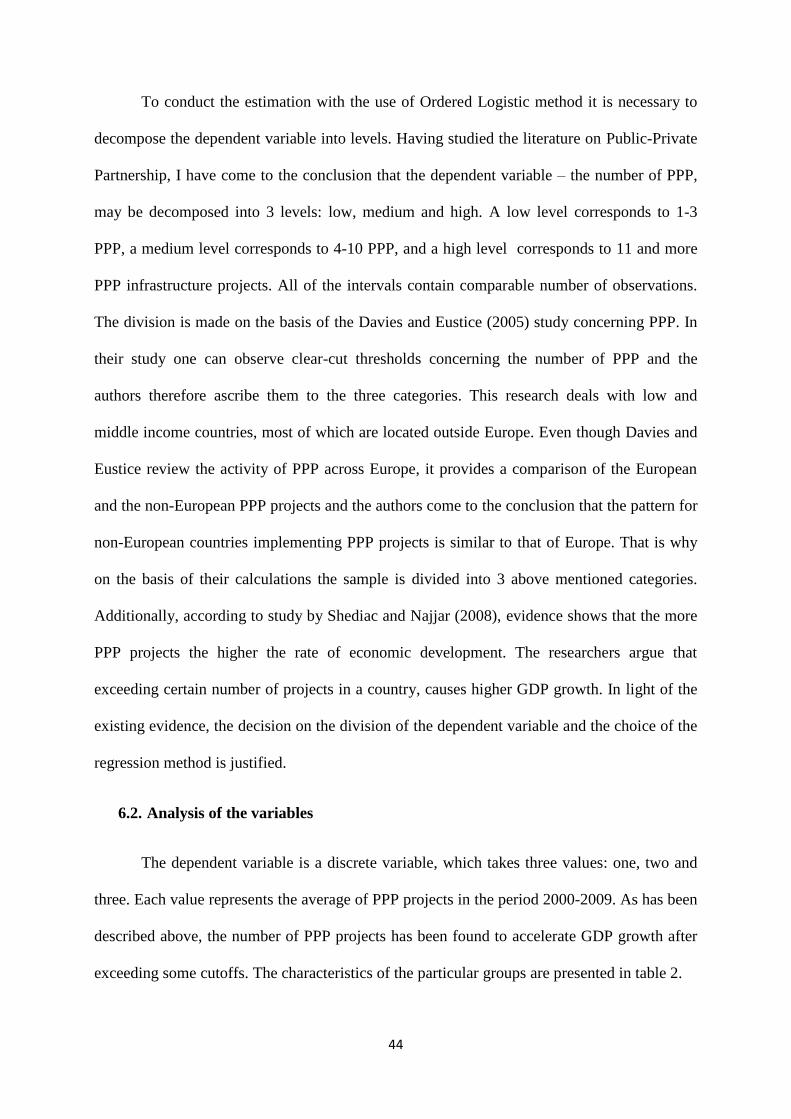
To conduct the estimation with the use of Ordered Logistic method it is necessary to
decompose the dependent variable into levels. Having studied the literature on Public-Private
Partnership, I have come to the conclusion that the dependent variable – the number of PPP,
may be decomposed into 3 levels: low, medium and high. A low level corresponds to 1-3
PPP, a medium level corresponds to 4-10 PPP, and a high level corresponds to 11 and more
PPP infrastructure projects. All of the intervals contain comparable number of observations.
The division is made on the basis of the Davies and Eustice (2005) study concerning PPP. In
their study one can observe clear-cut thresholds concerning the number of PPP and the
authors therefore ascribe them to the three categories. This research deals with low and
middle income countries, most of which are located outside Europe. Even though Davies and
Eustice review the activity of PPP across Europe, it provides a comparison of the European
and the non-European PPP projects and the authors come to the conclusion that the pattern for
non-European countries implementing PPP projects is similar to that of Europe. That is why
on the basis of their calculations the sample is divided into 3 above mentioned categories.
Additionally, according to study by Shediac and Najjar (2008), evidence shows that the more
PPP projects the higher the rate of economic development. The researchers argue that
exceeding certain number of projects in a country, causes higher GDP growth. In light of the
existing evidence, the decision on the division of the dependent variable and the choice of the
regression method is justified.
6.2. Analysis of the variables
The dependent variable is a discrete variable, which takes three values: one, two and
three. Each value represents the average of PPP projects in the period 2000-2009. As has been
described above, the number of PPP projects has been found to accelerate GDP growth after
exceeding some cutoffs. The characteristics of the particular groups are presented in table 2.

45
0.2
.4.6
.8
De
nsity
-2 -1 0 1 2control_of_coruption
0.2
.4.6
.8
De
nsity
-2 -1 0 1rule_of_law
Table 2.
Number of PPP projects ascribed two three groups
Number of the PPP projects Number of countries Percentage of sample
0 - 3 (low) (1) 44 36.97%
3-10 (medium) (2) 44 44%
10 and more (high) (3) 31 26.05%
Source: own elaborations
As can be noticed, the sample is balanced as each group comprises a similar number of
observations.
The independent variables in the model are mostly continuous. The proper forms of
these variables were determined on the basis of analyses of histograms. The variables: control
of corruption (Figure 11.) and rule of law (Figure 12.) are used in levels as they take negative
values. The variables fractionalization (Figure 13.) and inflation (Figure 14.) do not take
negative values, however they are also used also in levels.
Figure 11. Figure 12.
The histogram of the control of corruption The histogram of rule of law
Source: own elaborations Source: own elaborations
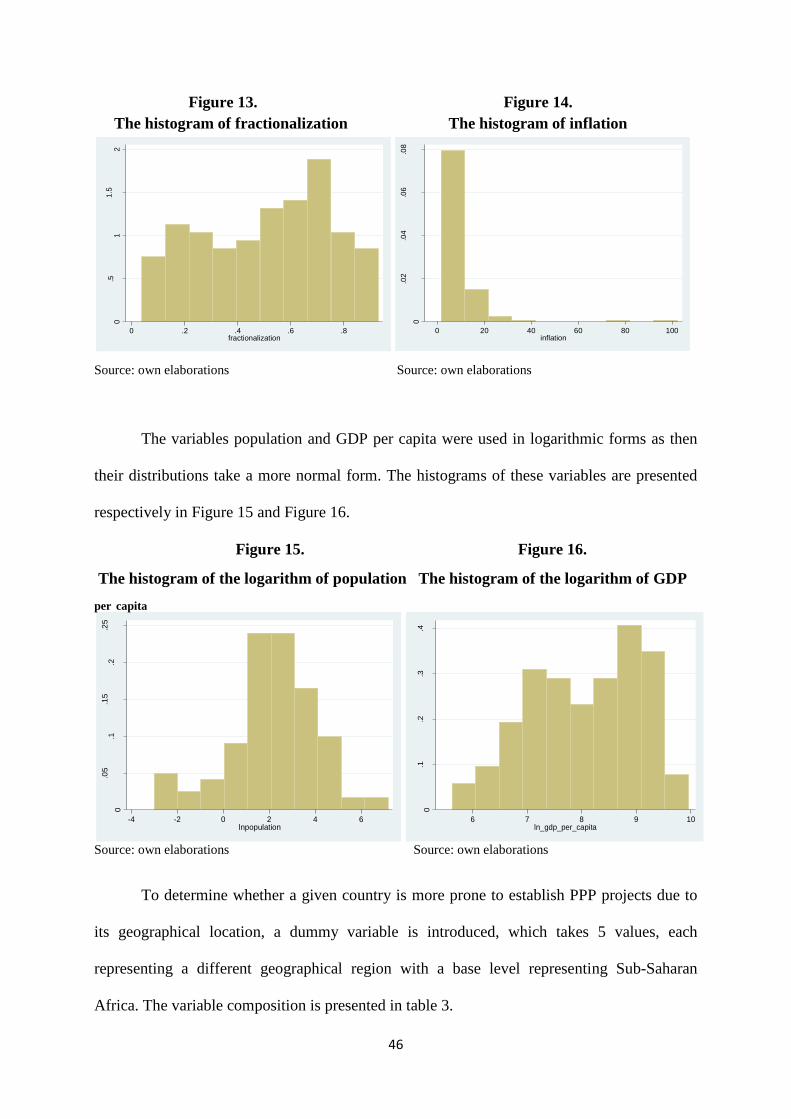
46
0
.05
.1.1
5.2
.25
De
nsity
-4 -2 0 2 4 6lnpopulation
0.1
.2.3
.4
De
nsity
6 7 8 9 10ln_gdp_per_capita
0.5
11.5
2
De
nsity
0 .2 .4 .6 .8fractionalization
0
.02
.04
.06
.08
De
nsity
0 20 40 60 80 100inflation
Figure 13. Figure 14.
The histogram of fractionalization The histogram of inflation
Source: own elaborations Source: own elaborations
The variables population and GDP per capita were used in logarithmic forms as then
their distributions take a more normal form. The histograms of these variables are presented
respectively in Figure 15 and Figure 16.
Figure 15. Figure 16.
The histogram of the logarithm of population The histogram of the logarithm of GDP
per capita
Source: own elaborations Source: own elaborations
To determine whether a given country is more prone to establish PPP projects due to
its geographical location, a dummy variable is introduced, which takes 5 values, each
representing a different geographical region with a base level representing Sub-Saharan
Africa. The variable composition is presented in table 3.
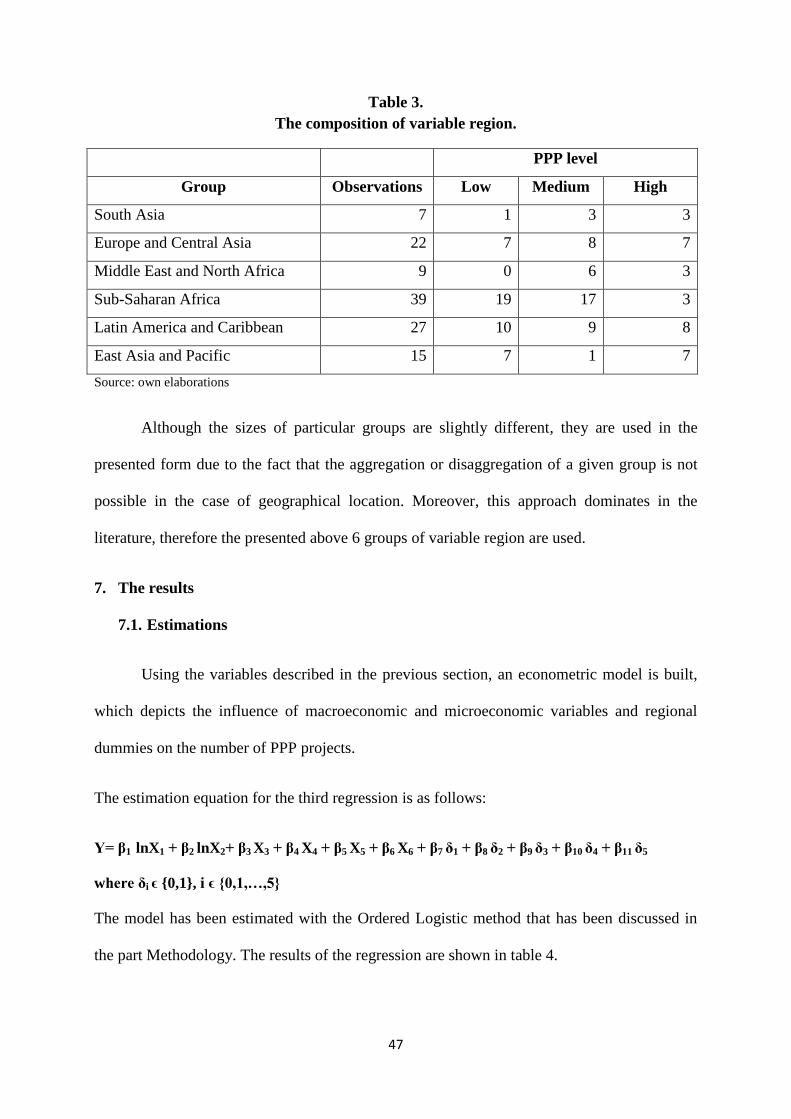
47
Table 3.
The composition of variable region.
PPP level
Group Observations Low Medium High
South Asia 7 1 3 3
Europe and Central Asia 22 7 8 7
Middle East and North Africa 9 0 6 3
Sub-Saharan Africa 39 19 17 3
Latin America and Caribbean 27 10 9 8
East Asia and Pacific 15 7 1 7
Source: own elaborations
Although the sizes of particular groups are slightly different, they are used in the
presented form due to the fact that the aggregation or disaggregation of a given group is not
possible in the case of geographical location. Moreover, this approach dominates in the
literature, therefore the presented above 6 groups of variable region are used.
7. The results
7.1. Estimations
Using the variables described in the previous section, an econometric model is built,
which depicts the influence of macroeconomic and microeconomic variables and regional
dummies on the number of PPP projects.
The estimation equation for the third regression is as follows:
Y= β1 lnX1 + β2 lnX2+ β3 X3 + β4 X4 + β5 X5 + β6 X6 + β7 δ1 + β8 δ2 + β9 δ3 + β10 δ4 + β11 δ5
where δi ϵ {0,1}, i ϵ {0,1,…,5}
The model has been estimated with the Ordered Logistic method that has been discussed in
the part Methodology. The results of the regression are shown in table 4.
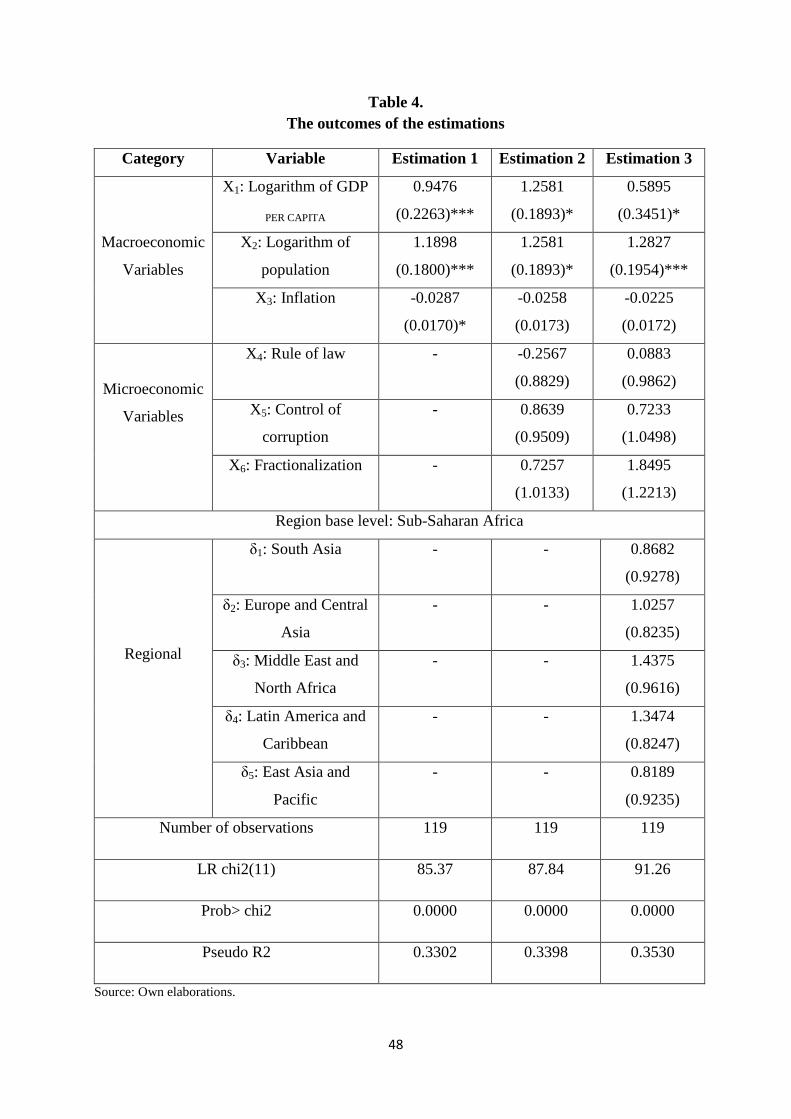
48
Table 4.
The outcomes of the estimations
Category Variable Estimation 1 Estimation 2 Estimation 3
Macroeconomic
Variables
X1: Logarithm of GDP
PER CAPITA
0.9476
(0.2263)***
1.2581
(0.1893)*
0.5895
(0.3451)*
X2: Logarithm of
population
1.1898
(0.1800)***
1.2581
(0.1893)*
1.2827
(0.1954)***
X3: Inflation -0.0287
(0.0170)*
-0.0258
(0.0173)
-0.0225
(0.0172)
Microeconomic
Variables
X4: Rule of law - -0.2567
(0.8829)
0.0883
(0.9862)
X5: Control of
corruption
- 0.8639
(0.9509)
0.7233
(1.0498)
X6: Fractionalization - 0.7257
(1.0133)
1.8495
(1.2213)
Region base level: Sub-Saharan Africa
Regional
δ1: South Asia - - 0.8682
(0.9278)
δ2: Europe and Central
Asia
- - 1.0257
(0.8235)
δ3: Middle East and
North Africa
- - 1.4375
(0.9616)
δ4: Latin America and
Caribbean
- - 1.3474
(0.8247)
δ5: East Asia and
Pacific
- - 0.8189
(0.9235)
Number of observations 119 119 119
LR chi2(11) 85.37 87.84 91.26
Prob> chi2 0.0000 0.0000 0.0000
Pseudo R2 0.3302 0.3398 0.3530
Source: Own elaborations.
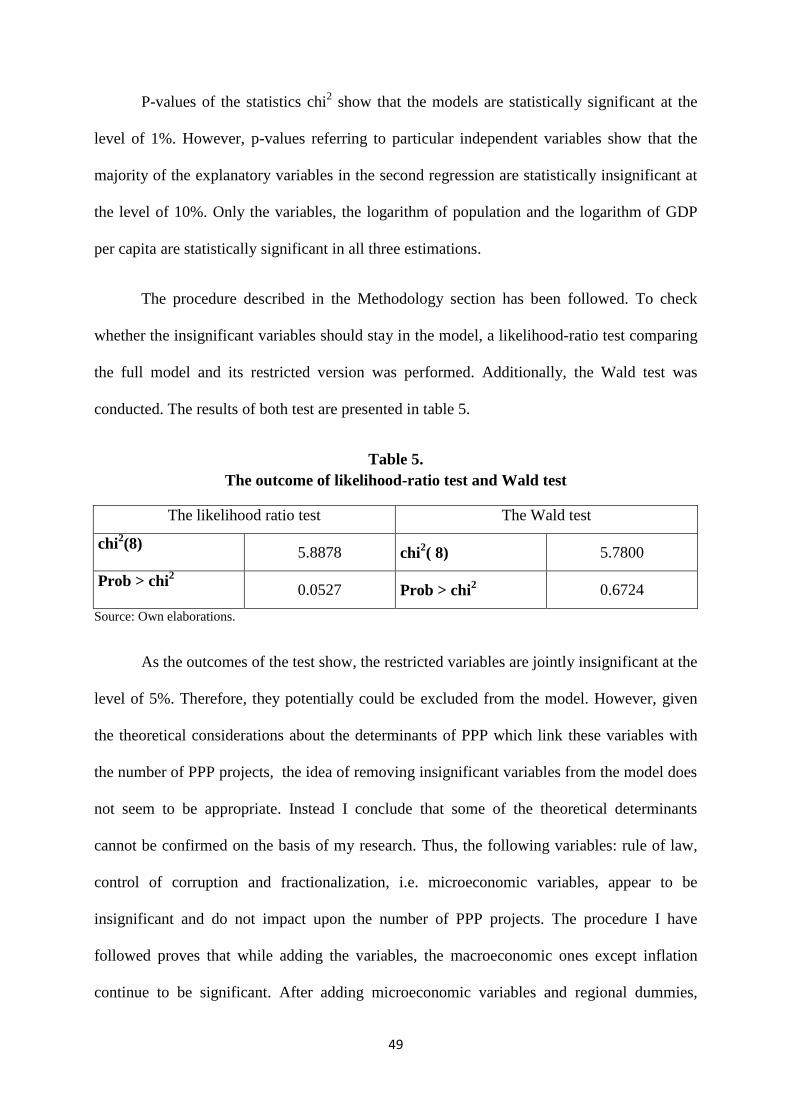
49
P-values of the statistics chi2 show that the models are statistically significant at the
level of 1%. However, p-values referring to particular independent variables show that the
majority of the explanatory variables in the second regression are statistically insignificant at
the level of 10%. Only the variables, the logarithm of population and the logarithm of GDP
per capita are statistically significant in all three estimations.
The procedure described in the Methodology section has been followed. To check
whether the insignificant variables should stay in the model, a likelihood-ratio test comparing
the full model and its restricted version was performed. Additionally, the Wald test was
conducted. The results of both test are presented in table 5.
Table 5.
The outcome of likelihood-ratio test and Wald test
The likelihood ratio test The Wald test
chi2(8)
5.8878 chi2( 8) 5.7800
Prob > chi2
0.0527 Prob > chi
2 0.6724
Source: Own elaborations.
As the outcomes of the test show, the restricted variables are jointly insignificant at the
level of 5%. Therefore, they potentially could be excluded from the model. However, given
the theoretical considerations about the determinants of PPP which link these variables with
the number of PPP projects, the idea of removing insignificant variables from the model does
not seem to be appropriate. Instead I conclude that some of the theoretical determinants
cannot be confirmed on the basis of my research. Thus, the following variables: rule of law,
control of corruption and fractionalization, i.e. microeconomic variables, appear to be
insignificant and do not impact upon the number of PPP projects. The procedure I have
followed proves that while adding the variables, the macroeconomic ones except inflation
continue to be significant. After adding microeconomic variables and regional dummies,
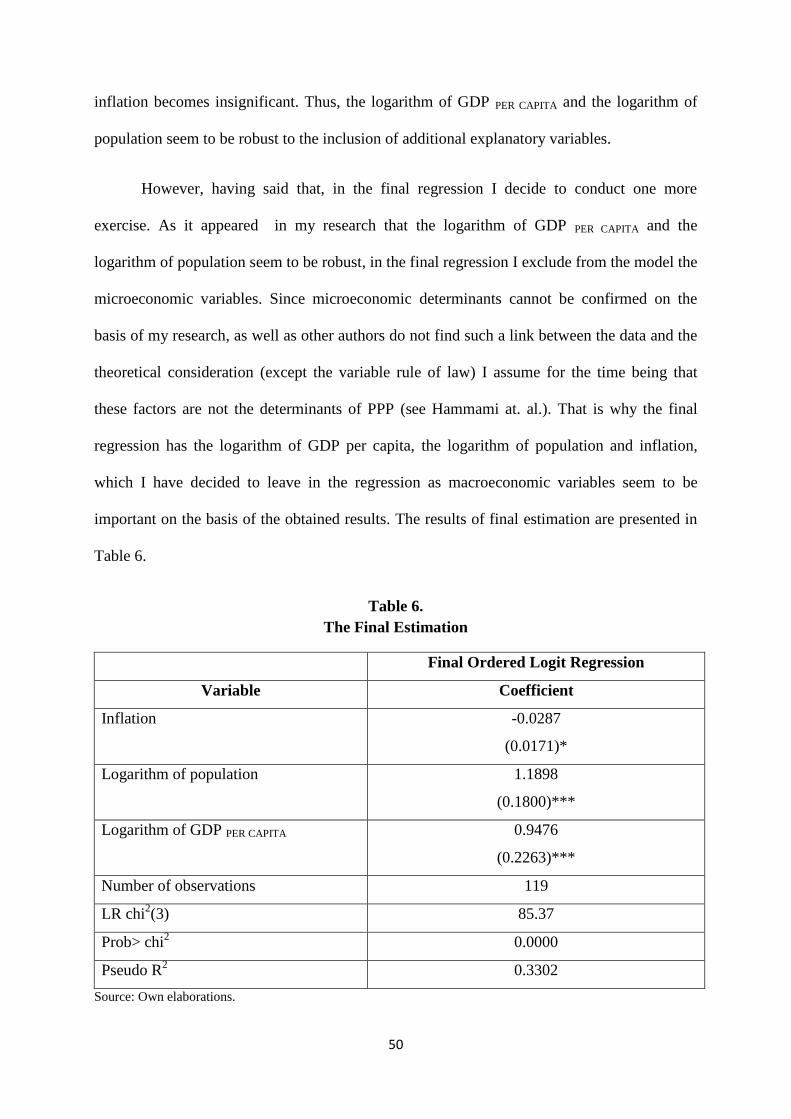
50
inflation becomes insignificant. Thus, the logarithm of GDP PER CAPITA and the logarithm of
population seem to be robust to the inclusion of additional explanatory variables.
However, having said that, in the final regression I decide to conduct one more
exercise. As it appeared in my research that the logarithm of GDP PER CAPITA and the
logarithm of population seem to be robust, in the final regression I exclude from the model the
microeconomic variables. Since microeconomic determinants cannot be confirmed on the
basis of my research, as well as other authors do not find such a link between the data and the
theoretical consideration (except the variable rule of law) I assume for the time being that
these factors are not the determinants of PPP (see Hammami at. al.). That is why the final
regression has the logarithm of GDP per capita, the logarithm of population and inflation,
which I have decided to leave in the regression as macroeconomic variables seem to be
important on the basis of the obtained results. The results of final estimation are presented in
Table 6.
Table 6.
The Final Estimation
Final Ordered Logit Regression
Variable Coefficient
Inflation -0.0287
(0.0171)*
Logarithm of population 1.1898
(0.1800)***
Logarithm of GDP PER CAPITA 0.9476
(0.2263)***
Number of observations 119
LR chi2(3) 85.37
Prob> chi2 0.0000
Pseudo R2 0.3302
Source: Own elaborations.
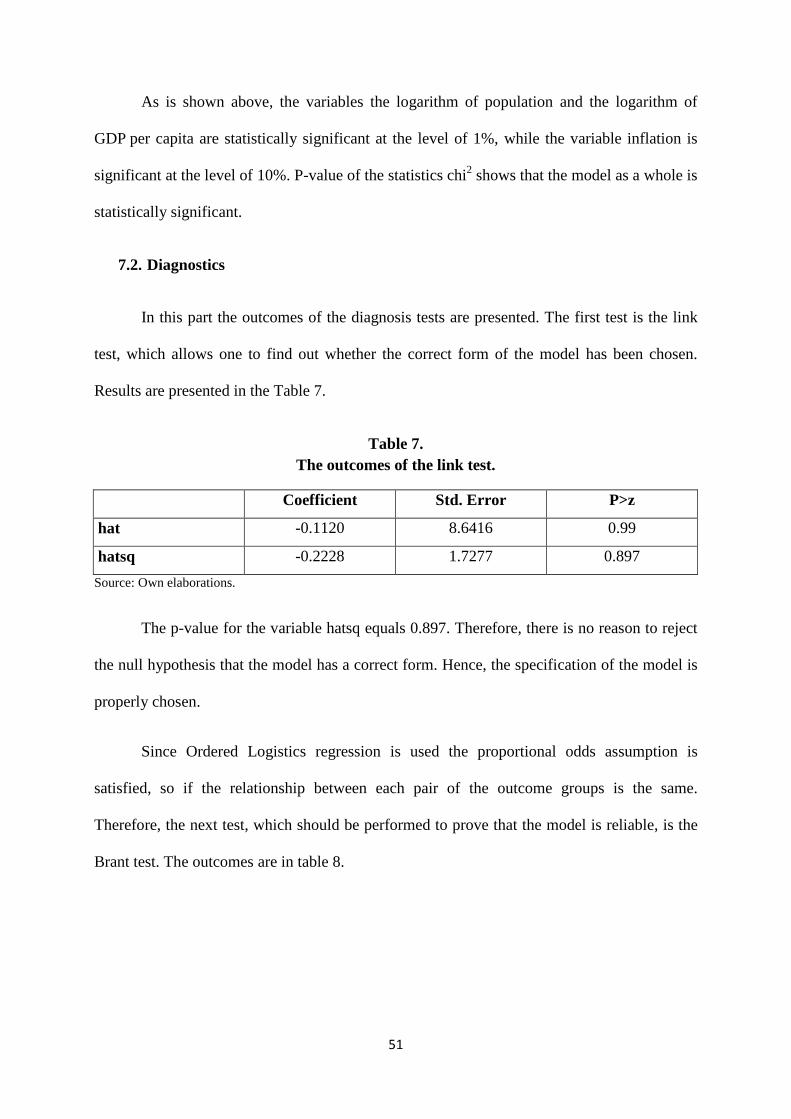
51
As is shown above, the variables the logarithm of population and the logarithm of
GDP per capita are statistically significant at the level of 1%, while the variable inflation is
significant at the level of 10%. P-value of the statistics chi2 shows that the model as a whole is
statistically significant.
7.2. Diagnostics
In this part the outcomes of the diagnosis tests are presented. The first test is the link
test, which allows one to find out whether the correct form of the model has been chosen.
Results are presented in the Table 7.
Table 7.
The outcomes of the link test.
Coefficient Std. Error P>z
hat -0.1120 8.6416 0.99
hatsq -0.2228 1.7277 0.897
Source: Own elaborations.
The p-value for the variable hatsq equals 0.897. Therefore, there is no reason to reject
the null hypothesis that the model has a correct form. Hence, the specification of the model is
properly chosen.
Since Ordered Logistics regression is used the proportional odds assumption is
satisfied, so if the relationship between each pair of the outcome groups is the same.
Therefore, the next test, which should be performed to prove that the model is reliable, is the
Brant test. The outcomes are in table 8.
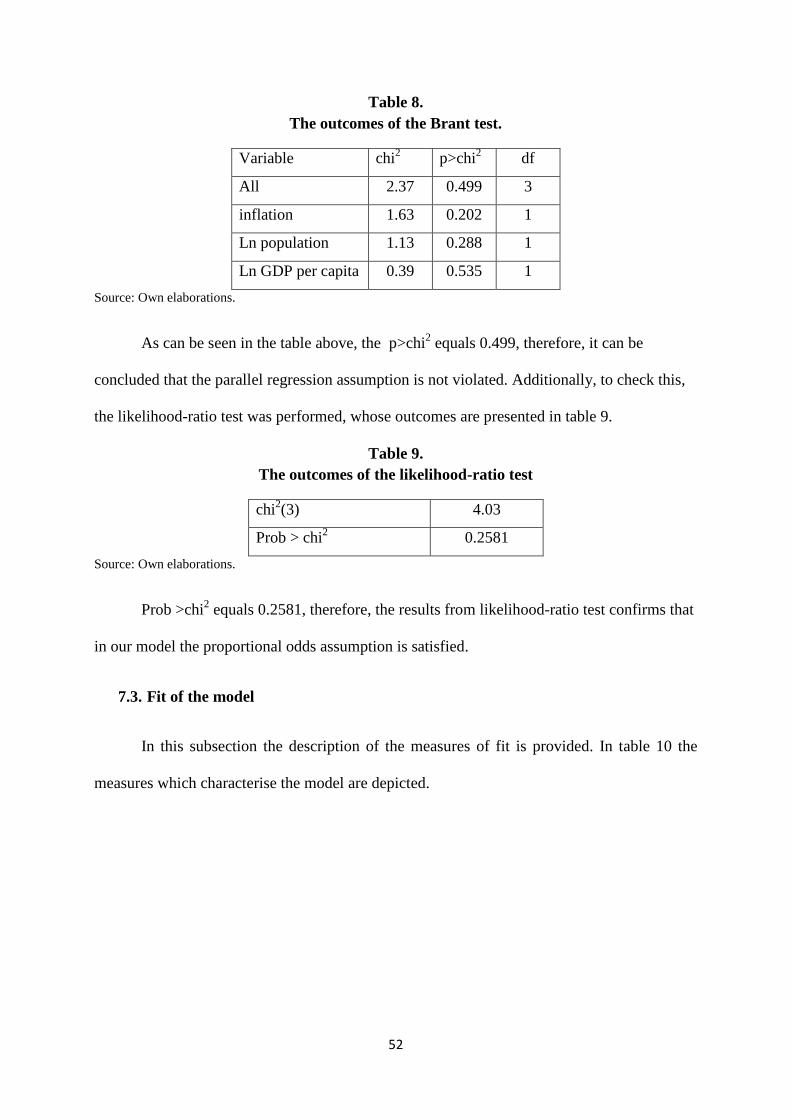
52
Table 8.
The outcomes of the Brant test.
Variable chi2 p>chi
2 df
All 2.37 0.499 3
inflation 1.63 0.202 1
Ln population 1.13 0.288 1
Ln GDP per capita 0.39 0.535 1
Source: Own elaborations.
As can be seen in the table above, the p>chi2 equals 0.499, therefore, it can be
concluded that the parallel regression assumption is not violated. Additionally, to check this,
the likelihood-ratio test was performed, whose outcomes are presented in table 9.
Table 9.
The outcomes of the likelihood-ratio test
chi2(3) 4.03
Prob > chi2 0.2581
Source: Own elaborations.
Prob >chi2 equals 0.2581, therefore, the results from likelihood-ratio test confirms that
in our model the proportional odds assumption is satisfied.
7.3. Fit of the model
In this subsection the description of the measures of fit is provided. In table 10 the
measures which characterise the model are depicted.
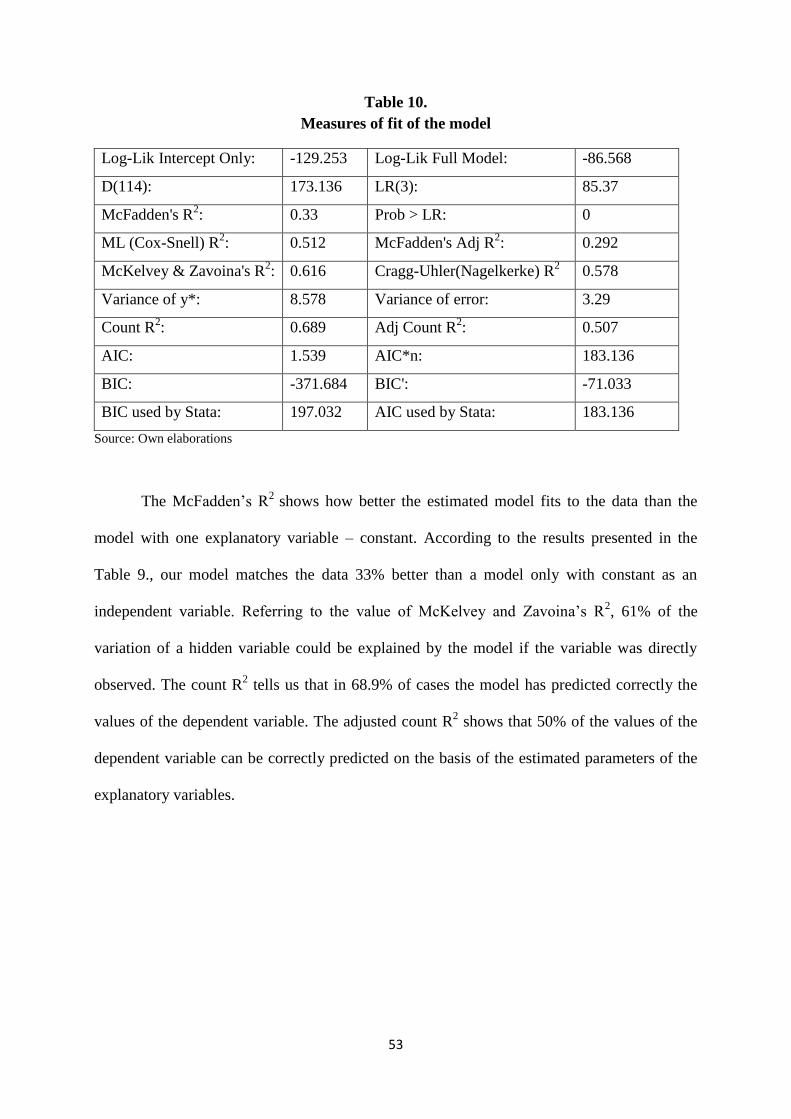
53
Table 10.
Measures of fit of the model
Log-Lik Intercept Only: -129.253 Log-Lik Full Model: -86.568
D(114): 173.136 LR(3): 85.37
McFadden's R2: 0.33 Prob > LR: 0
ML (Cox-Snell) R2: 0.512 McFadden's Adj R
2: 0.292
McKelvey & Zavoina's R2: 0.616 Cragg-Uhler(Nagelkerke) R
2 0.578
Variance of y*: 8.578 Variance of error: 3.29
Count R2: 0.689 Adj Count R
2: 0.507
AIC: 1.539 AIC*n: 183.136
BIC: -371.684 BIC': -71.033
BIC used by Stata: 197.032 AIC used by Stata: 183.136
Source: Own elaborations
The McFadden’s R2
shows how better the estimated model fits to the data than the
model with one explanatory variable – constant. According to the results presented in the
Table 9., our model matches the data 33% better than a model only with constant as an
independent variable. Referring to the value of McKelvey and Zavoina’s R2, 61% of the
variation of a hidden variable could be explained by the model if the variable was directly
observed. The count R2 tells us that in 68.9% of cases the model has predicted correctly the
values of the dependent variable. The adjusted count R2 shows that 50% of the values of the
dependent variable can be correctly predicted on the basis of the estimated parameters of the
explanatory variables.
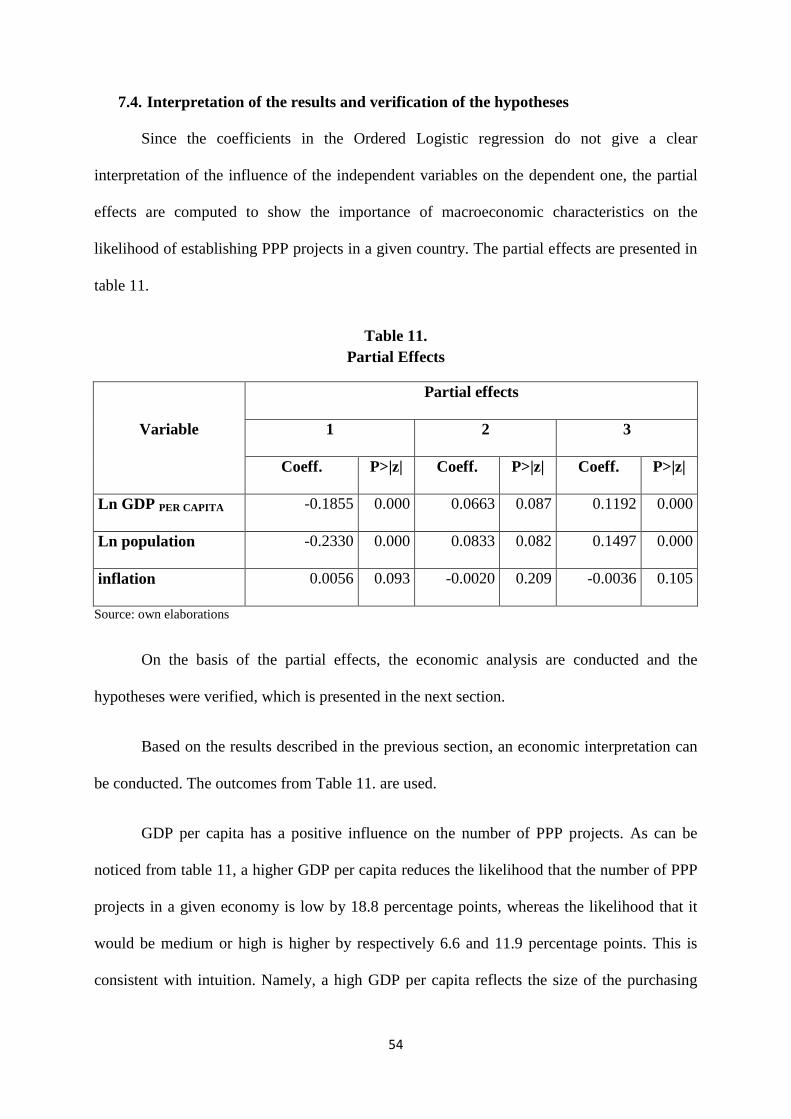
54
7.4. Interpretation of the results and verification of the hypotheses
Since the coefficients in the Ordered Logistic regression do not give a clear
interpretation of the influence of the independent variables on the dependent one, the partial
effects are computed to show the importance of macroeconomic characteristics on the
likelihood of establishing PPP projects in a given country. The partial effects are presented in
table 11.
Table 11.
Partial Effects
Variable
Partial effects
1 2 3
Coeff. P>|z| Coeff. P>|z| Coeff. P>|z|
Ln GDP PER CAPITA -0.1855 0.000 0.0663 0.087 0.1192 0.000
Ln population -0.2330 0.000 0.0833 0.082 0.1497 0.000
inflation 0.0056 0.093 -0.0020 0.209 -0.0036 0.105
Source: own elaborations
On the basis of the partial effects, the economic analysis are conducted and the
hypotheses were verified, which is presented in the next section.
Based on the results described in the previous section, an economic interpretation can
be conducted. The outcomes from Table 11. are used.
GDP per capita has a positive influence on the number of PPP projects. As can be
noticed from table 11, a higher GDP per capita reduces the likelihood that the number of PPP
projects in a given economy is low by 18.8 percentage points, whereas the likelihood that it
would be medium or high is higher by respectively 6.6 and 11.9 percentage points. This is
consistent with intuition. Namely, a high GDP per capita reflects the size of the purchasing
55
power of the population, hence, the size of an economy. Therefore, private companies would
be more prone to invest in PPP in such a country, because they face a large and profitable
market. Moreover, a higher level of GDP per capita determines the level of development.
More mature economies indicate higher demand for new infrastructure investments, which
additionally encourages the private sector, furthermore, the government system is better
organised, which increases the government’s incentive to cooperate.
Population size affects the number of PPP projects in a similar way to GDP per capita.
The larger the population the higher the likelihood of a medium and high number of launched
PPP projects. In particular, with a larger population the likelihood of establishing medium and
higher number of PPP projects is respectively higher by 8.32 and 14.9 percentage points.
Whereas the likelihood that the number of PPP projects is low is lower by 23.3 percentage
points when population is higher by 1 percentage point. The reason for these results is similar
to the case of GDP per capita. The size of the population reflects the size of the market.
Moreover, a larger population increases the demand for infrastructure investments. These
factors both increase private companies incentives to be involved in PPP projects.
Considering inflation, it can be noticed that the higher the inflation rate the higher the
likelihood of a low number of PPP projects in a given country. What is interesting is that
inflation does not affect the likelihood of medium level of PPP projects. The p-value (0.105)
suggests that inflation does not impact on the likelihood of a high level of PPP projects at
conventional levels. However, at the 11% significance level it would be significant, and in
what follows this assumption will be followed. Namely, inflation decreases the likelihood of
high PPP projects by 0.003 per cent. These finding are consistent with our hypothesis.
Namely, inflation reflects the risk of an increase in costs, and therefore decreases private
sector incentives to invest in a given economy especially through PPP. In turn, low inflation
increase the likelihood that number of PPP projects will be high as it determines low risk.

56
As the other variables in the model are statistically insignificant, it can be concluded
that the rule of law and corruption do not influence the likelihood of introducing PPP projects
in a given economy. Similarly, ethnic diversification does not affect the incentive to create
PPP cooperation. Finally as was proven by our research the likelihood of establishing PPP
projects do not vary over regions.
57
CONCLUSIONS
The empirical study shows that the determinants of the number of PPP projects are the
size of GDP per capita, the size of population and inflation. The theoretical assumptions on
the directions of the impact of these variables on the number of PPP projects have been
confirmed in the study. As the theory shows, the impact of GDP per capita on PPP projects is
positive. The study confirms that countries with higher GDP per capita will carry out more
PPP projects. This is directly related to the fact that GDP per capita represents the value of the
economy per capita. Higher GDP per capita minimizes the chance of a failure of an
investment as it corresponds to higher demand, which is a key factor ensuring that a private
company obtains a certain rate of return on investment. Private entities invest in order to
obtain profits and that is why higher GDP per capita in a given country is an incentive for a
private firm to invest, hence GDP per capita is a crucial determinant of the number of PPP
projects.
It has also been confirmed empirically that population size positively affects the
number of PPP projects. The larger the market the more willing the private company is to
participate in the partnership. The same as with GDP per capita, a big market reduces the risk
of a failure of a PPP project.
The last variable that has proved to be significant in the model is inflation, the
direction of which is consistent with economic theory. The lower the inflation rate the greater
the macroeconomic stability of the country. PPP investments are generally large projects, for
example sewerage treatment plants, which often require the use of inputs or capital coming
from abroad. The stability of prices and exchange rates is then very important, because lower
rates of inflation means a lower risk of failure of the project.

58
The results of my study are very similar to the conclusions that come from the article
by Hammami et al. (2006), on which this research has been based. Namely, according to the
researchers the major determinant of the PPP projects are market factors - a large market and
the purchasing power of citizens. In my study, population size and GDP per capita also
appeared to be significant and their direction is in line with the theory. Moreover, it has not
been confirmed empirically that the influence of ethnic divesification on the number of PPP
projects, as described in the theory, is reflected in reality. The variable ethnic diversification,
the same as in Hammami et al. (2006) study, has remained insignificant in the model.
Although the ratio of legal conditions in our study is insignificant, in the quoted article, it was
a variable that positively influenced the number of PPP. Also the variable regions in our study
is not significant, while in the study by Hammami et al. (2006) all regions except Europe and
Central Asia are less sensitive to the number of PPP projects compared to the base region,
which was Latin America and Caribbean.
The differences in the outcomes may result from the estimation method and the
approach to the study. Also the sample was taken from different times so on the number of
PPP could have impact other factors not captured in study and which could not be controlled.
Moreover, in the research I have not taken into account the recent financial crisis, which
might also have influenced the number of PPP as the investing conditions deteriorated
significantly during that time. Although there exists strong theory supporting the influence of
legal conditions, lack of corruption environment as well as country ethnic diversification on
the number of PPP projects, there has been few empirical evidence supporting the theory.
Hence here is the possible area of future research to find out the empirical links between the
data and the theory. Also studying the determinants of PPP in advanced economies could be
intriguing, however, due to the lack of date, such exercise may not have been possible for the
59
time being as in the PPI database the statistics are gathered for low and middle income
countries.
LIST OF TABLES AND FIGURES
Table 1. Summary of the research hypothesis
Table 2. Number of PPP projects ascribed two three groups
Table 3. The composition of variable region
Table 4. The initial estimation
Table 5. The outcome of likelihood-ratio test and Wald test
Table 6. The Final Estimation
Table 7. The outcomes of the link test
Table 8. The outcomes of the Brant test
Table 9. The outcomes of the likelihood-ratio test
Table 10. Measures of fit of the model
Table 11. Partial Effects
Figure 1. Number of PPP projects in 1990-2012 in regions
Figure 2. Number of PPP projects across 1990-2012
Figure 3 Number of PPP projects in 1990-2012 according to sectors
Figure 4. Share of number of PPP projects into sectors in the regions
Figure 5. Investment in PPP projects in 1990-2013 in regions
Figure 6. Investment in PPP projects across 1990-2012 in US $ million
Figure 7. Investment in PPP projects in 1990-2012 according to sectors
Figure 8. Share of PPP investment into sectors in the regions
Figure 9. Top 10 countries by PPP projects in 1990-2012
60
Figure 10. Top 10 countries by PPP investment in 1990-2012
Figure 11. The histogram of the control of corruption
Figure 12. The histogram of rule of law
Figure 13. The histogram of fractionalization
Figure 14. The histogram of inflation
Figure 15. The histogram of the logarithm of population
Figure 16. The histogram of the logarithm of GDP per capita
REFERENCES
Brzozowska K., 2006. Partnerstwo publiczno-prywatne, przesłanki, możliwości, bariery,
CeDeWu, Warszawa.
Cenkier A., 2009. Partnerstwo publiczno-prywatne jako metoda wykonywania zadań
publicznych, Szkoła Główna Handlowa, Warszawa.
Davies P., K. Eustice, 2005. Delivering the PPP promise, a Review of PPP Issue and Activity,
PricewaterhouseCoopers' Publication.
Doloi H., 2012. Understanding Impacts of Time and Cost Related Construction Risks on
Operational Performance of PPP Projects, International Journal of Strategic Property
Management, Volume 16(3): 316-337.
Duffield C., Raisbeck P., Allen Consulting Group. Performance of PPPs and Traditional
Procurement in Australia, Infrastructure Partnerships Australia.
Engel E., Fischer R., Galetovic A., 2011. Public-Private Partnerships to Revamp U.S.
Infrastructure, The Hamilton Project, Brookings.
Gajewska-Jedwabny A., 2007. Partnerstwo publiczno-prywatne, C.H Beck, Warszawa.
Hammami M., J. F. Ruhashyankiko, E. B. Yehoue. 2006. Determinants of Public-Private
Partnership in Infrastructure, Working Paper 99, International Monetary Fund,
Washington.
61
Ismail K., R. Takim., A. H. Nawawi, 2011. The evaluation criteria of Value for Money
(VFM) of Public Private Partnership (PPP) bids, International Conference on
Intelligent Building and Management Proc .of CSIT vol.5, IACSIT Press, Singapore.
Jin X. H., G. Zhang, 2011. Modelling optimal risk allocation in PPP projects using artificial
neural networks, International Journal of Project Management 29, 591–603.
Jooste S. F., R. Levitt, D. Scott, 2011. Beyond ‘one size fits all’: how local conditions shape
PPP-enabling field development, Engineering Project Organization Journal, 1:1, 11-
25.
Kopańska A., A. Bartczak, J. Siwińska-Gorzelak, 2008. Partnerstwo publiczno-prywatne,
podmioty prywatne w realizacji zadań publicznych sektora wodno-kanalizacyjnego,
CeDeWu, Wrszawa.
Le Bideau J., Shields B., Findlay Ch., Wilhelmy M., Pedrosa E., 2006. Meeting the Region's
Infrastructure Needs, lines for Effective Public Private Partnerships. Pacific Economic
Cooperation Council, Singapore.
Marques R., C., S. V., Berg 2010. Public-Private Partnership Contracts: A Tale of Two Cities
with Different Contractual Arrangements, Centre of Urban and Regional Systems,
Technical University of Lisbon, Public Utility Research Center, University of Florida.
Mause K., T. Krumm 2011. Public–Private Partnershipping as a Tool of Government:
Exploring its Determinants Across German States, German Politics, 20:4, 527-544.
Moszoro M., 2010. Partnerstwo publiczno-prywatne w sferze użyteczności publicznej,
Wolters Kluwer, Kraków.
Reside R. E., A.M. Mendoza. 2010. Determinants of Outcomes of Public-Private Partnerships
(PPP) in Infrastructure in Asia, Discussion Paper, University of the Philippines,
Diliman.
Ribeiro, K., Dantas, A. 2006. Private-public partnership initiatives around the world:
Learning from the experience, IPENZ Transportation Conference 2006, Queenstown,
Zealand.
62
Robertson P., J., M. Acar, 1999. Concentrated Hopes, Diffused Responsibilities:
Accountability in Public-Private Partnerships, School of Policy, Planning, and
Development, University of Southern California, Los Angeles.
Sharma Ch. 2011. Determinants of PPP in infrastructure in developing economies,
Department of Economics, National Institute of Financial Management (NIFM),
Faridabad, India.
Shediac R., M. R. Najjar, 2008. Public-Private Partnership a New Catalyst for Economic
Growth, Booz & Company.
Tang L., Q. Shen, E. W.L. Cheng, 2010. A review of studies on Public–Private Partnership
projects in the construction industry, International Journal of Project Management 28,
683–694.
Thomson C., Goodwin J., 2005. Evaluation of PPP projects Financed by the EIB, Evaluation
Report, European Investment Bank.
Witters L., Marom R., , Steinert K., 2012. The Role of Public-Private Partnerships in Driving
Innovation.
Yescombe E. R., 2008. Partnerstwo publiczno-prywatne, zasady wdrażania i finansowania,
Wolters Kluwer, Kraków.
Geddes R. R., Wagner B. L., 2013. Why do U.S. states adopt public–private partnership
enabling legislation?, Journal of Urban Economics, vol. 78, pp. 30-41.

63
APPENDIX 1. A list of countries from the sample.
Afghanistan Georgia
Albania Ghana
Algeria Grenada
Angola Guatemala
Antigua and Barbuda Guinea
Argentina Guinea-Bissau
Armenia Guyana, CR
Azerbaijan Haiti
Bangladesh Honduras
Belarus India
Belize Indonesia
Benin Iran, Islamic Rep.
Bhutan Iraq
Bolivia Jamaica
Bosnia and Herzegovina Jordan
Brazil Kazakhstan
Bulgaria Kenya
Burkina Faso Korea, Dem. Rep.
Burundi Kosovo
Cambodia Kyrgyz Republic
Cameroon Lao PDR
Cape Verde Lebanon
Central African Republic Lesotho
Chad Liberia
Chile Lithuania
China Macedonia, FYR
Colombia Madagascar
Comoros Malawi
Congo, Dem. Rep. Malaysia
Congo, Rep. Maldives
Costa Rica Mali
Côte d'Ivoire Mauritania
Cuba Mauritius
Djibouti Mexico
Dominica Micronesia, Fed. Sts.
Dominican Republic Moldova
Ecuador Mongolia
Egypt, Arab Rep. Montenegro
El Salvador Morocco
Eritrea Mozambique
Ethiopia Myanmar
Fiji Namibia
Gabon Nepal
Gambia, The Nicaragua
Niger
Nigeria

64
Pakistan
Panama
Papua New Guinea
Peru
Philippines
Romania
Russian Federation
Rwanda
Senegal
Serbia
Seychelles
Sierra Leone
Somalia
South Africa
Sri Lanka
St. Lucia
St. Vincent and the Grenadines
Sudan
Suriname
Syrian Arab Republic
Tajikistan
Tanzania
Thailand
Timor-Leste
Togo
Tonga
Tunisia
Turkey
Uganda
Ukraine
Uruguay
Uzbekistan
Vanuatu
Venezuela, RB
Vietnam
West Bank and Gaza
Yemen, Rep.
Zambia

65
APPENDIX 2. A frequency table of number of PPP projects in the years 2000-2009 for the
countries from the sample (Appendix 1)
"X" - Number
of PPP projects
Number of countries with "X" PPP
projects
1 16
2 23
3 10
4 11
5 10
6 9
7 6
8 4
9 3
10 3
11 1
12 3
14 1
15 1
16 2
18 1
19 1
21 1
22 1
25 1
26 1
28 1
30 1
32 1
33 1
34 2
36 1
38 1
39 1
42 1
46 1
48 1
50 1
51 1
63 1
69 1
313 1
320 1
667 1

66
APPENDIX 3. Zusammenfassung
Eine der Arten der Bereitstellung von öffentlichen Gütern kann durch öffentlich-private
Partnerschaften (ÖPP) durchgeführt werden, die dank ihrer Vorteile eine attraktive Methode
bei der Realisierung öffentlicher Aufgaben darstellen könnte. Auf Grund dessen werden
öffentlich-private Partnerschaften in vielen Ländern immer beliebter. Einer der wichtigsten
Vorteile von ÖPP ist ihre potenzielle wirtschaftliche Wirksamkeit. Das bedeutet, dass im
Vergleich mit anderen Methoden der Bereitstellung von öffentlichen Gütern, der Nutzen von
ÖPP für die Gesellschaft höher ist. Diese Arbeit beinhaltet, neben der theoretischen
Überlegungen und der Literaturübersicht zur öffentlich-privaten Partnerschaft, eine
empirische Studie über Determinanten von öffentlich-privaten Partnerschaften in Ländern mit
niedrigem und mittlerem Einkommen, da nur für solche Länder Daten in der Privaten
Beteiligungsdatenbank der Weltbank (World Bank's Private Participation Database)
gesammelt sind. Für diesen Zweck wird die geordnete logistische Regression verwendet. Die
empirische Forschung zeigt, dass die Determinanten der Anzahl der ÖPP-Projekte die Größe
des BIP pro Kopf, die Größe der Bevölkerung und die Inflation sind. Die theoretischen
Voraussetzungen für die Richtung der Auswirkung dieser Variablen auf die Anzahl der ÖPP-
Projekte wurden in dieser Studie bestätigt.
67
APPENDIX 4. Abstract
One of the ways of provision of public goods can be done through public-private partnerships
(PPP), which, thanks to their advantages, may be an attractive method of implementing public
tasks. That is why public–private partnerships are becoming increasingly popular in many
countries. One of the most important advantages of PPP is its potential economic
effectiveness, which means that the benefits of PPP for society are higher in comparison with
other methods of provision of public goods. This work apart from theoretical consideration
and literature review on public-private partnership contains an empirical study concerning
determinants of public-private partnerships in low and middle income countries as there only
for such countries the data is collected in the World Bank's Private Participation Database.
Ordered Logistic Regression is used for this purpose. The empirical study shows that the
determinants of the number of PPP projects are the size of GDP per capita, the size of
population and the inflation. The theoretical assumptions on the directions of the impact of
these variables on the number of PPP projects have been confirmed in this study.

68
APPENDIX 5. Curriculum Vitae
Agata Miliszkiewicz
EDUCATION
Academic year 2012/2013 University of Vienna, Austria
International Economics, Master's Studies, full-time
September-December 2011 International Exchange Program
Institute of Management Technology, Ghaziabad, India
2011-2013 University of Warsaw
Faculty of Economic Sciences
International Economics, Master's Studies, full-time
2011-2014 University of Warsaw
Faculty of Modern Languages
Institute of English Studies
English Language and Literature
Master's Studies, full-time
2008-2011 University of Warsaw
Faculty of Economic Sciences
Faculty of Management
Interdisciplinary Economic-Management Studies Bachelor's Studies, full-time
2007-2010 University of Warsaw
Faculty of Modern Languages
Institute of English Studies
English Language and Literature Bachelor's Studies, full-time
ACHIEVEMENTS
Academic year 2012/2013 Scholarship of the Central European Exchange Program for
University Studies (CEEPUS) granted by the Austrian Agency for
International Cooperation in Education and Research
Academic year 2011/2012 Scholarship for the academic accomplishments granted by the
Rector of the University of Warsaw
WORK EXPERIENCE
October 2013-March 2014 Internship in KPMG in General Audit
(Industrial Markets)
July-August 2013
2012, 2011, 2010
Miliszkiewicz Company
Work at the family operated company in the field of metal processing.
Tasks: client search, customer service, designing marketing materials
etc.
69
September 2010 Internship at the Polish Ministry of Finance at the European Union
Department
Assisting the preparations for Polish Presidency of the EU Council
LANGUAGES
Polish-native, English-fluent, Spanish-B1 level
SKILLS
Computer skills: Word, Excel, Power Point, Econometric package Stata
INTERESTS
Travelling, swimming, skiing
STRENGTHS
Communicative and analytical skills, resourcefulness, responsibility,
ability to learn fast