Bayerns Meteorite, der Chiemgau Impakt und das Bayer. Landesamt für Umwelt (LfU)
Upload
sheila-wadeCategory
view
214download
0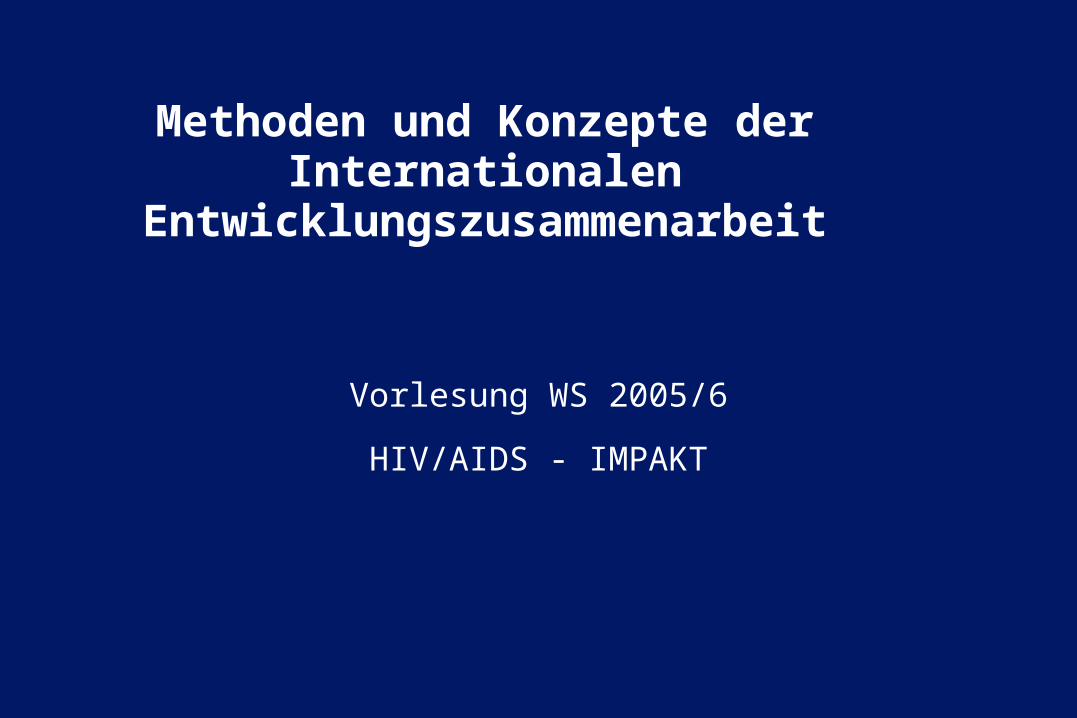
Methoden und Konzepte der Internationalen
Entwicklungszusammenarbeit
Vorlesung WS 2005/6
HIV/AIDS - IMPAKT
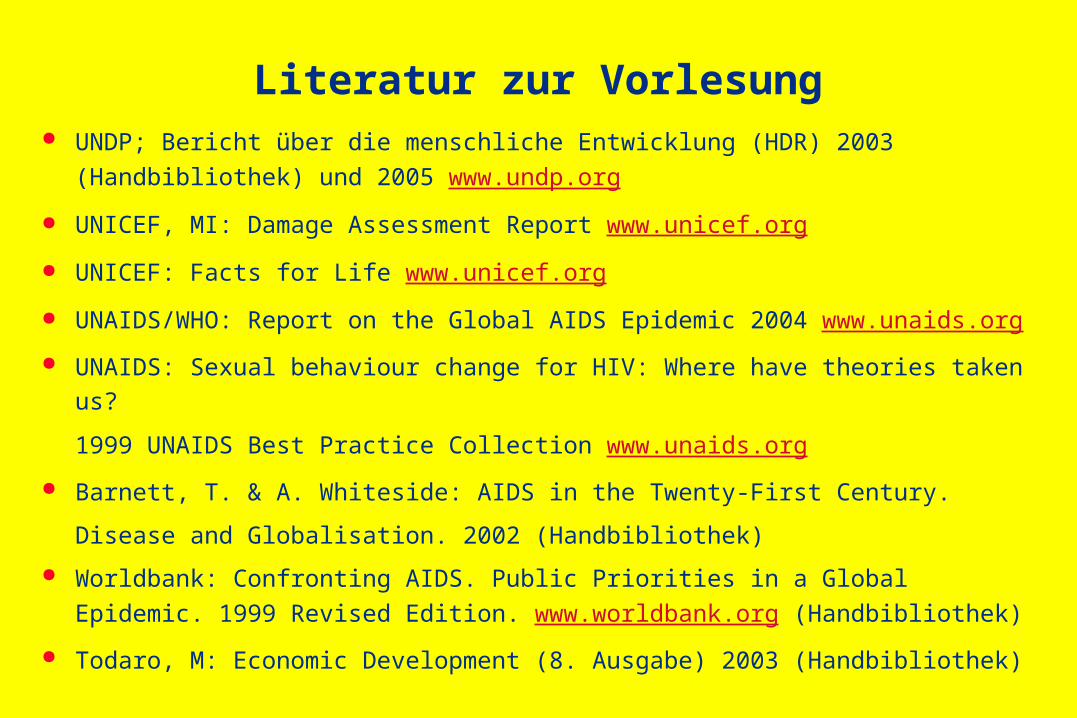
Literatur zur Vorlesung UNDP; Bericht über die menschliche Entwicklung (HDR) 2003 (Handbibliothek)
und 2005 www.undp.org
UNICEF, MI: Damage Assessment Report www.unicef.org
UNICEF: Facts for Life www.unicef.org
UNAIDS/WHO: Report on the Global AIDS Epidemic 2004 www.unaids.org
UNAIDS: Sexual behaviour change for HIV: Where have theories taken us?
1999 UNAIDS Best Practice Collection www.unaids.org
Barnett, T. & A. Whiteside: AIDS in the Twenty-First Century.
Disease and Globalisation. 2002 (Handbibliothek)
Worldbank: Confronting AIDS. Public Priorities in a Global Epidemic. 1999
Revised Edition. www.worldbank.org (Handbibliothek)
Todaro, M: Economic Development (8. Ausgabe) 2003 (Handbibliothek)
Auswirkungen von HIV/AIDS
Auf die Menschliche Entwicklung
1. Lebenserwartung
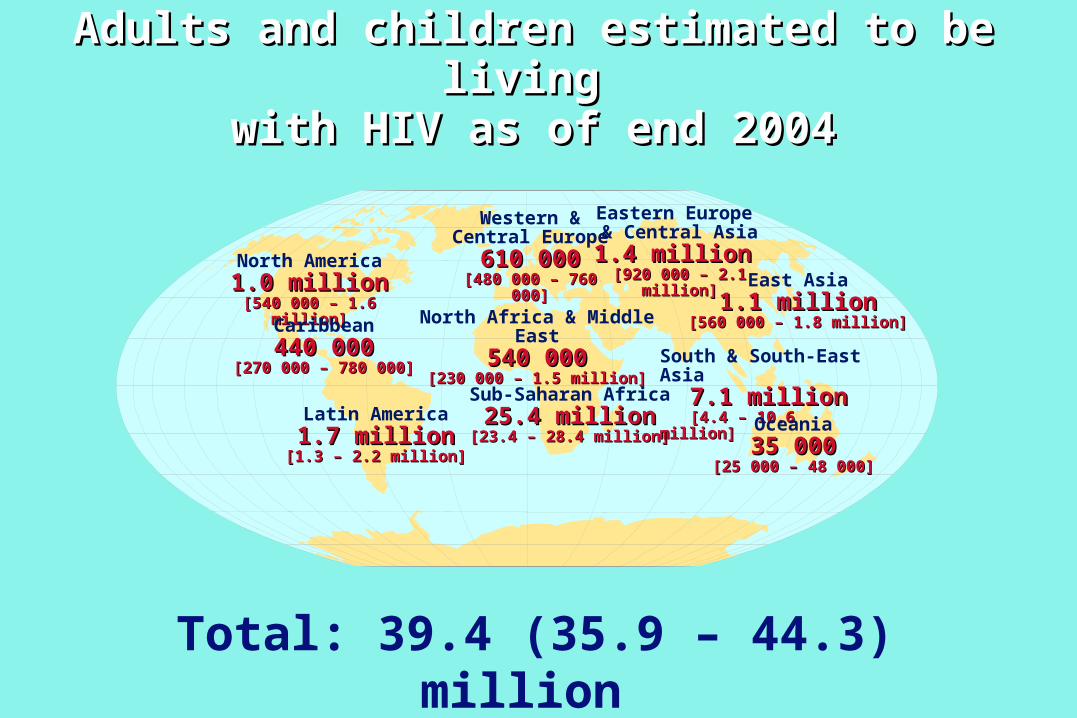
Adults and children estimated to be living Adults and children estimated to be living with HIV as of end 2004with HIV as of end 2004
Total: 39.4 (35.9 – 44.3) million
Western & Central Europe
610 000610 000[480 000 – 760 000][480 000 – 760 000]
North Africa & Middle East540 000540 000
[230 000 – 1.5 million][230 000 – 1.5 million]
Sub-Saharan Africa25.4 million25.4 million
[23.4 – 28.4 million][23.4 – 28.4 million]
Eastern Europe & Central Asia1.4 million 1.4 million
[920 000 – 2.1 million][920 000 – 2.1 million]
South & South-East Asia7.1 million7.1 million[4.4 – 10.6 million][4.4 – 10.6 million]
Oceania35 00035 000
[25 000 – 48 000][25 000 – 48 000]
North America1.0 million1.0 million
[540 000 – 1.6 million][540 000 – 1.6 million]
Caribbean440 000440 000
[270 000 – 780 000][270 000 – 780 000]
Latin America1.7 million1.7 million
[1.3 – 2.2 million][1.3 – 2.2 million]
East Asia1.1 million1.1 million
[560 000 – 1.8 million][560 000 – 1.8 million]
00002-E-5 – 1 December 2003
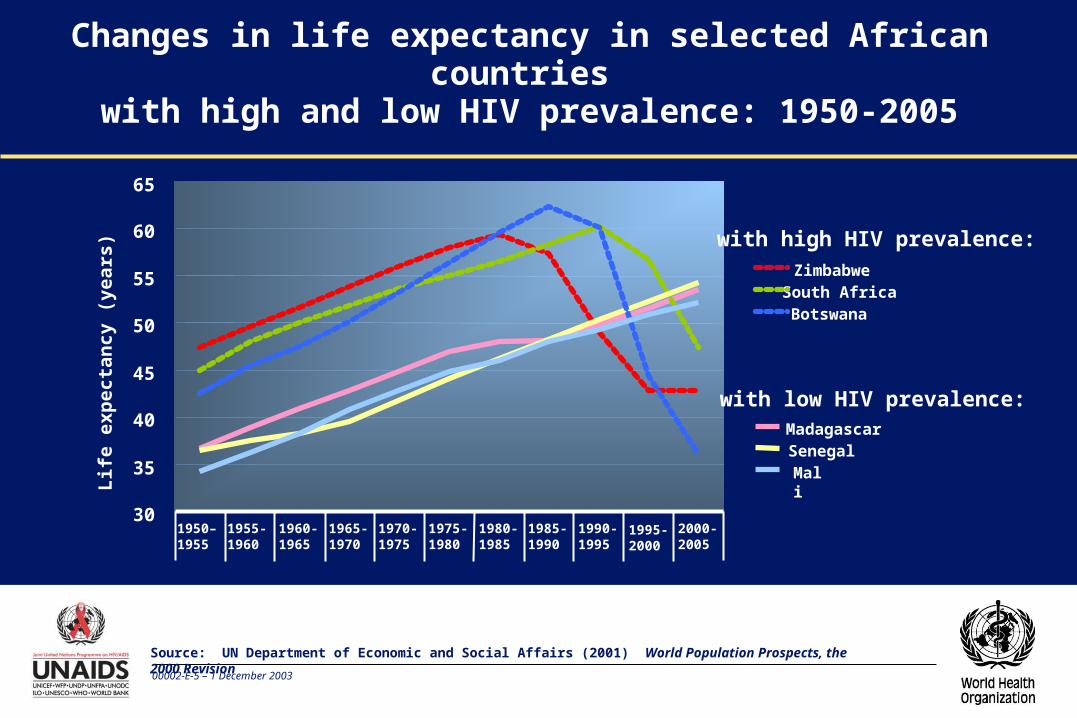
Changes in life expectancy in selected African countries
with high and low HIV prevalence: 1950-2005
with high HIV prevalence:ZimbabweSouth AfricaBotswana
with low HIV prevalence:MadagascarSenegalMali
Source: UN Department of Economic and Social Affairs (2001) World Population Prospects, the 2000 Revision
30
35
40
45
50
55
60
65
Lif
e e
xp
ecta
ncy (
years
)
1950– 1955
1955- 1960
1960-1965
1965-1970
1970-1975
1975-1980
1980-1985
1985-1990
1990-1995
1995-2000
2000-2005
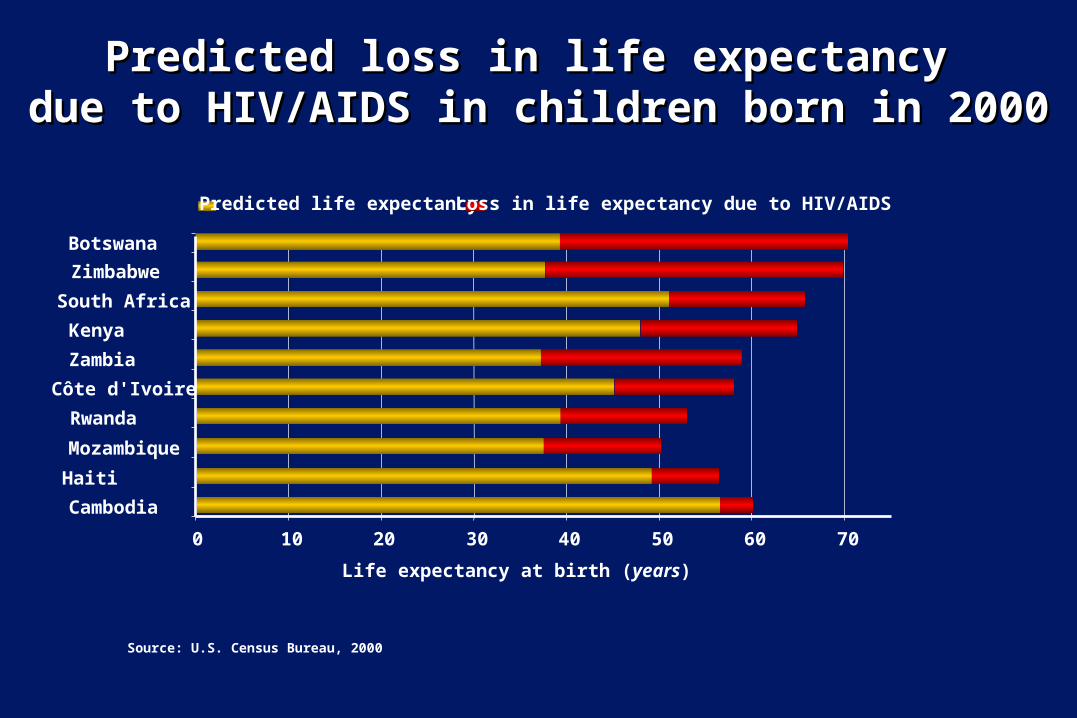
0 10 20 30 40 50 60 70
Cambodia
Haiti
Mozambique
Rwanda
Côte d'Ivoire
Zambia
Kenya
South Africa
Zimbabwe
Botswana
Life expectancy at birth (years)
Predicted life expectancy Loss in life expectancy due to HIV/AIDS
Predicted loss in life expectancy Predicted loss in life expectancy due to HIV/AIDS in children born in 2000due to HIV/AIDS in children born in 2000
Source: U.S. Census Bureau, 2000
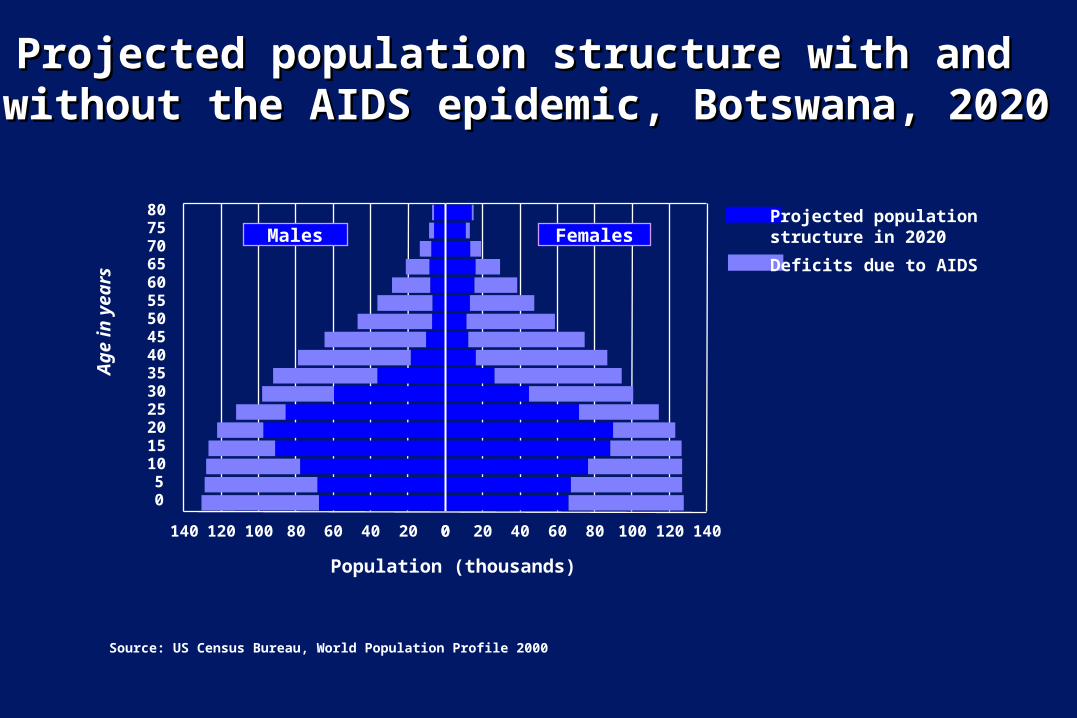
Projected population structure with and Projected population structure with and without the AIDS epidemic, Botswana, 2020without the AIDS epidemic, Botswana, 2020
80757065605550454035302520151050
020406080100120140 0 20 40 60 80 100 120 140
Males Females
Deficits due to AIDS
Projected population structure in 2020
Population (thousands)
Ag
e in
yea
rs
Source: US Census Bureau, World Population Profile 2000
Auswirkungen von HIV/AIDS
Auf die Menschliche Entwicklung
- verschiedene Ebenen
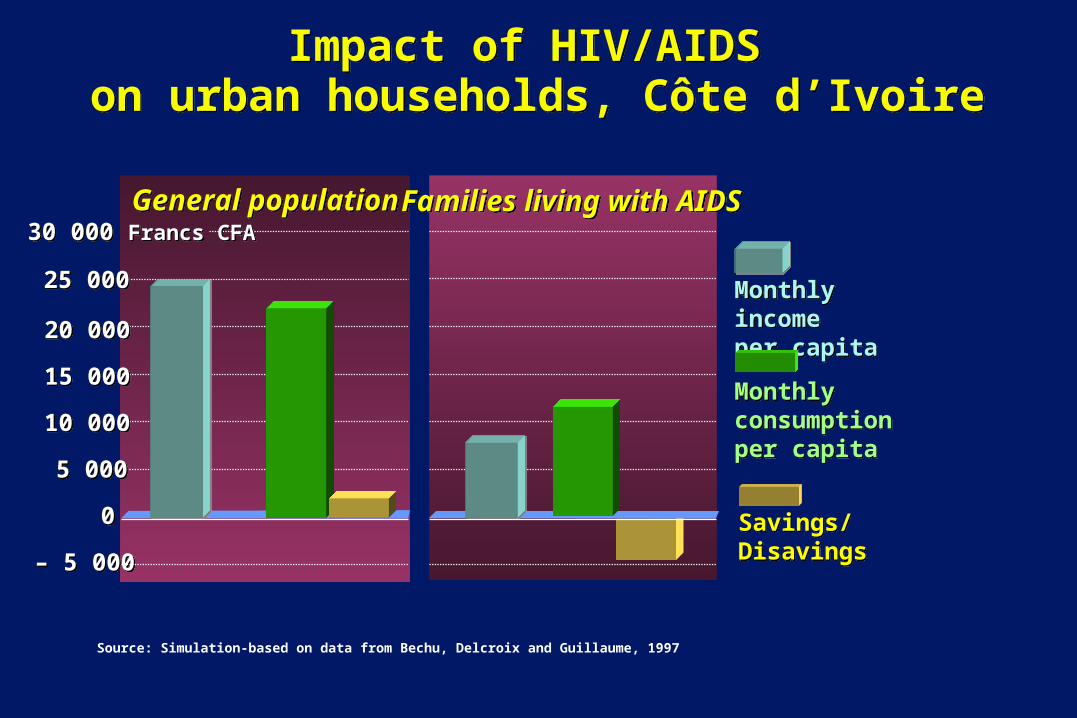
Impact of HIV/AIDS on urban households, Côte d’Ivoire
Impact of HIV/AIDS on urban households, Côte d’Ivoire
General populationGeneral population Families living with AIDSFamilies living with AIDS
Monthly income per capitaMonthly income per capita
Monthly consumptionper capita
Monthly consumptionper capita
00
5 0005 000
10 00010 000
15 00015 000
20 00020 000
25 00025 000
– 5 000– 5 000
30 000 Francs CFA30 000 Francs CFA
Savings/DisavingsSavings/Disavings
Source: Simulation-based on data from Bechu, Delcroix and Guillaume, 1997
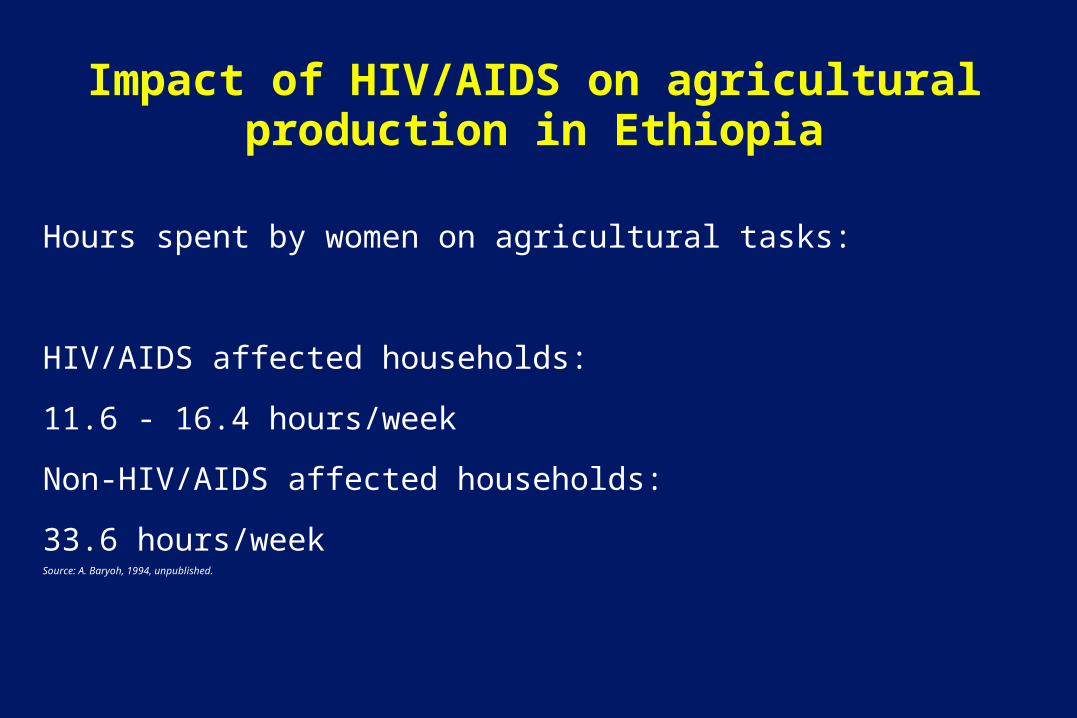
Impact of HIV/AIDS on agricultural production in Ethiopia
Hours spent by women on agricultural tasks:
HIV/AIDS affected households:
11.6 - 16.4 hours/week
Non-HIV/AIDS affected households:
33.6 hours/weekSource: A. Baryoh, 1994, unpublished.
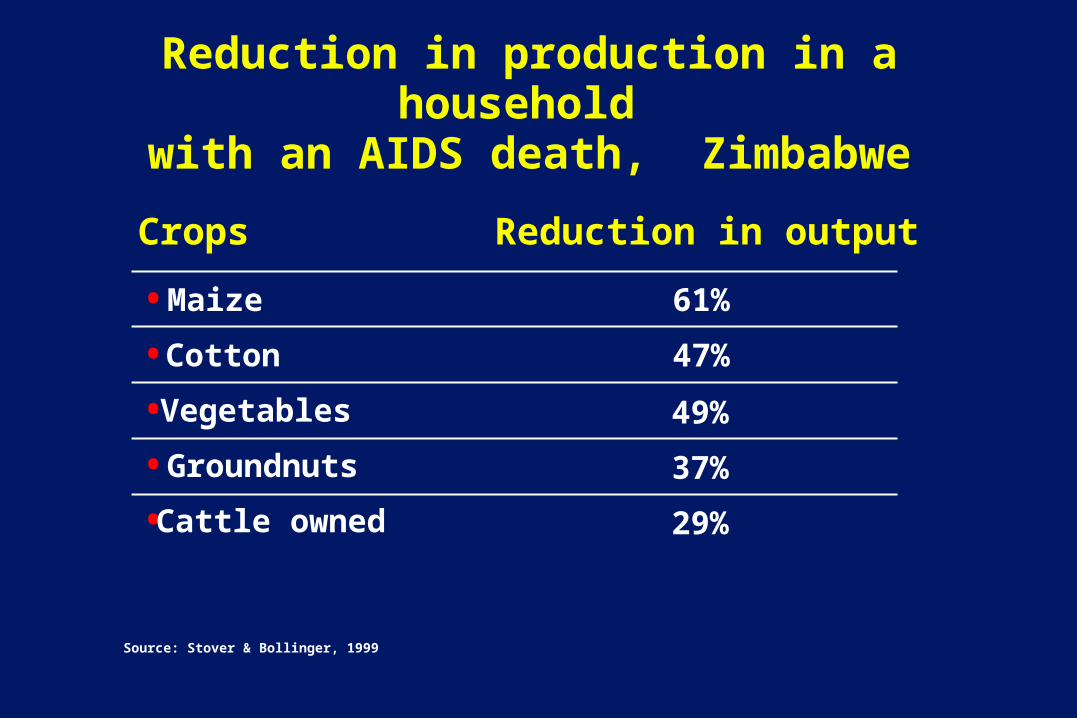
Reduction in production in a household
with an AIDS death, Zimbabwe
Source: Stover & Bollinger, 1999
•
•
•
•
•
Crops Reduction in output
Maize
Cotton
Vegetables
Groundnuts
Cattle owned
49%
37%
29%
47%
61%
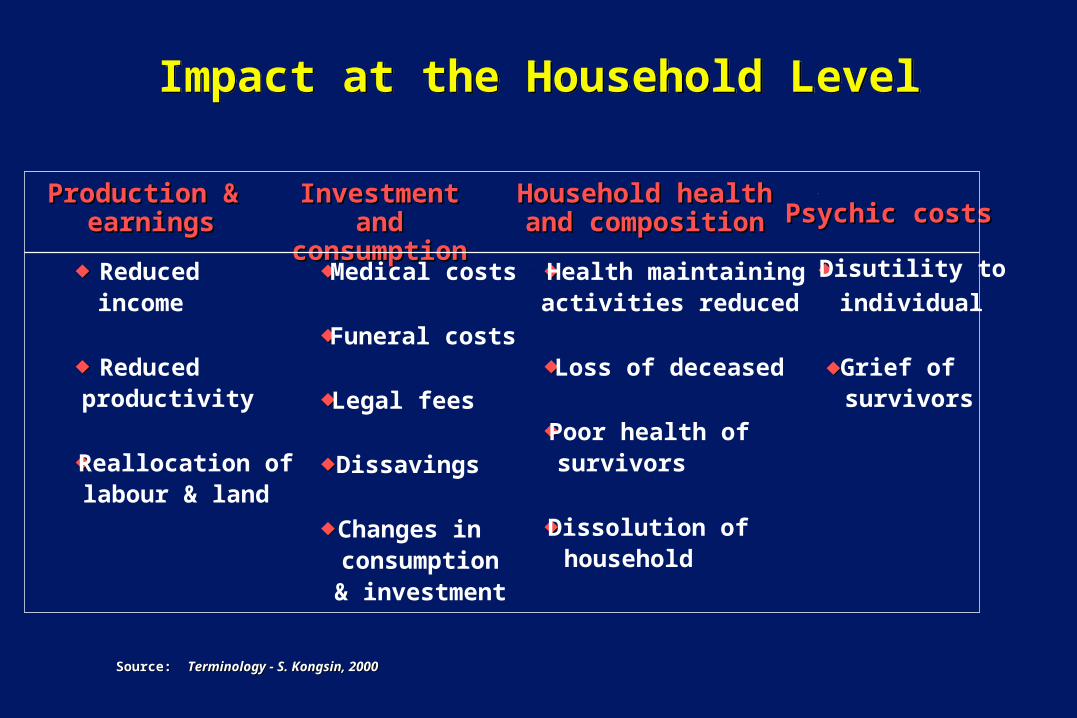
Impact at the Household LevelImpact at the Household Level
Production & Production & earningsearnings
Investment and Investment and consumptionconsumption
Household health Household health and compositionand composition Psychic costsPsychic costs
Reducedincome
Reducedproductivity
Reallocation oflabour & land
Medical costs
Funeral costs
Legal fees
Dissavings
Changes inconsumption& investment
Health maintainingactivities reduced
Loss of deceased
Poor health ofsurvivors
Dissolution ofhousehold
Disutility to
individual
Grief ofsurvivors
Source: Source: Terminology - S. Kongsin, 2000Terminology - S. Kongsin, 2000
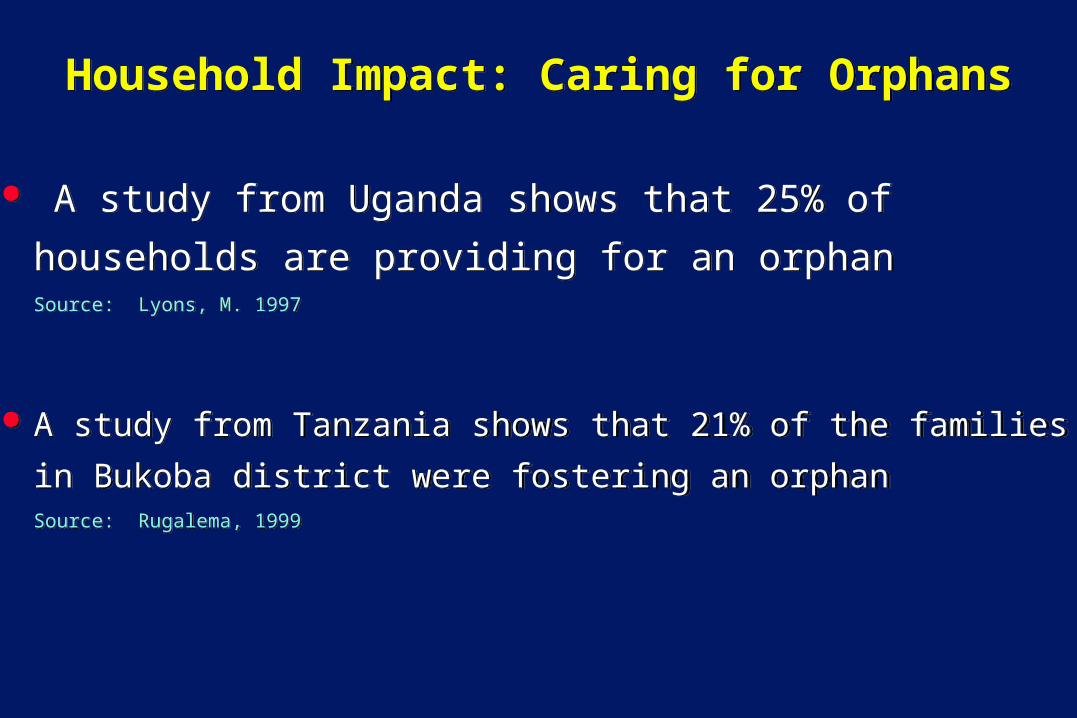
Household Impact: Caring for OrphansHousehold Impact: Caring for Orphans
A study from Uganda shows that 25% of households
are providing for an orphan Source: Lyons, M. 1997
A study from Tanzania shows that 21% of the families in
Bukoba district were fostering an orphanSource: Rugalema, 1999
A study from Uganda shows that 25% of households
are providing for an orphan Source: Lyons, M. 1997
A study from Tanzania shows that 21% of the families in
Bukoba district were fostering an orphanSource: Rugalema, 1999
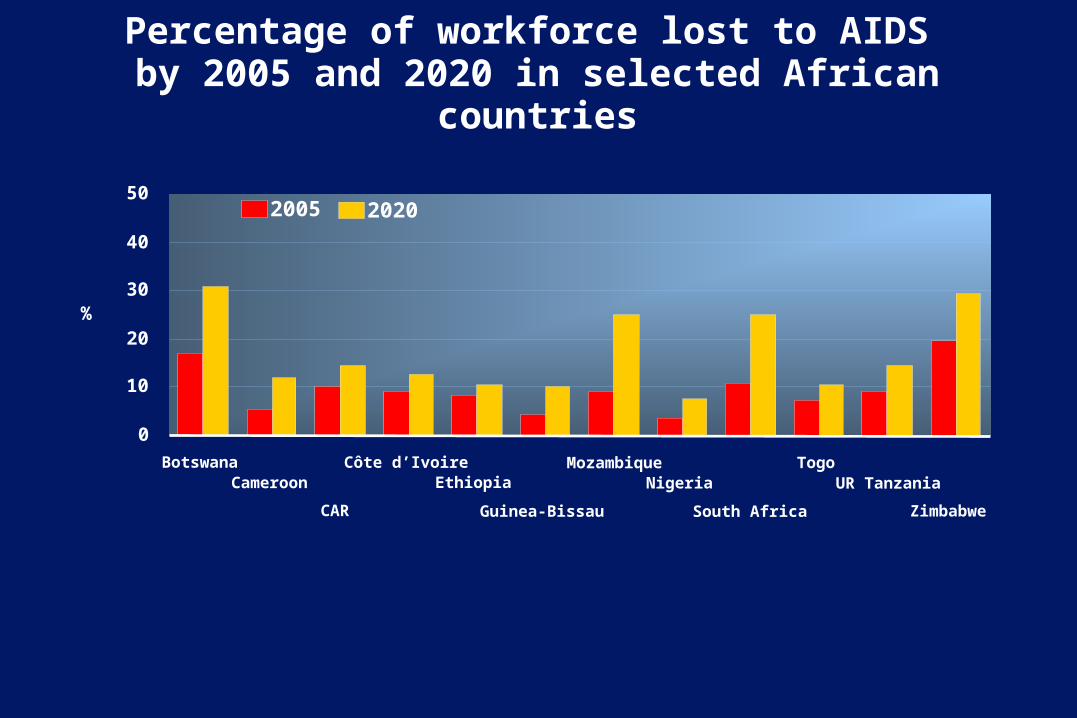
Percentage of workforce lost to AIDS by 2005 and 2020 in selected African
countries
0
10
20
30
40
50
%
2005 2020
BotswanaCameroon
CAR
Côte d’IvoireEthiopia
Guinea-Bissau
MozambiqueNigeria
South Africa
TogoUR Tanzania
Zimbabwe
Sources: ILO (2000) POPILO population and labour force projection; UN Department of Economic and Social Affairs, Population Division (1998) World Population Prospects: the 1998 Revision
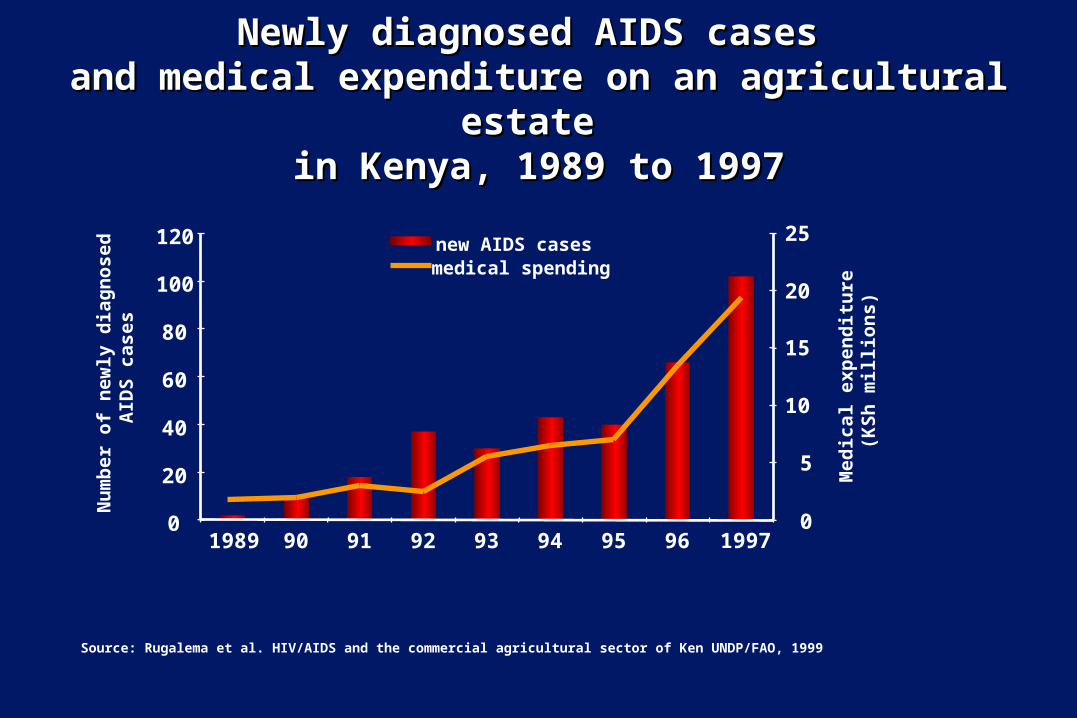
Newly diagnosed AIDS cases Newly diagnosed AIDS cases and medical expenditure on an agricultural estate and medical expenditure on an agricultural estate
in Kenya, 1989 to 1997in Kenya, 1989 to 1997
0
20
40
60
80
100
120
Nu
mb
er o
f n
ewly
dia
gn
ose
d
AID
S c
ases
0
5
10
15
20
25
Med
ical
exp
end
itu
re
(KS
h m
illi
on
s)
1989 90 91 92 93 94 95 96 1997
new AIDS casesmedical spending
Source: Rugalema et al. HIV/AIDS and the commercial agricultural sector of Ken UNDP/FAO, 1999

Hours lost to Sickness and Funerals,Hours lost to Sickness and Funerals,Chilanga-Works(Source Ministry of Health-Chilanga-Works(Source Ministry of Health-
Zambia)Zambia)
0
10,000
20,000
30,000
40,000
50,000
92-93 93-94 94-95
Funerals
Sickness
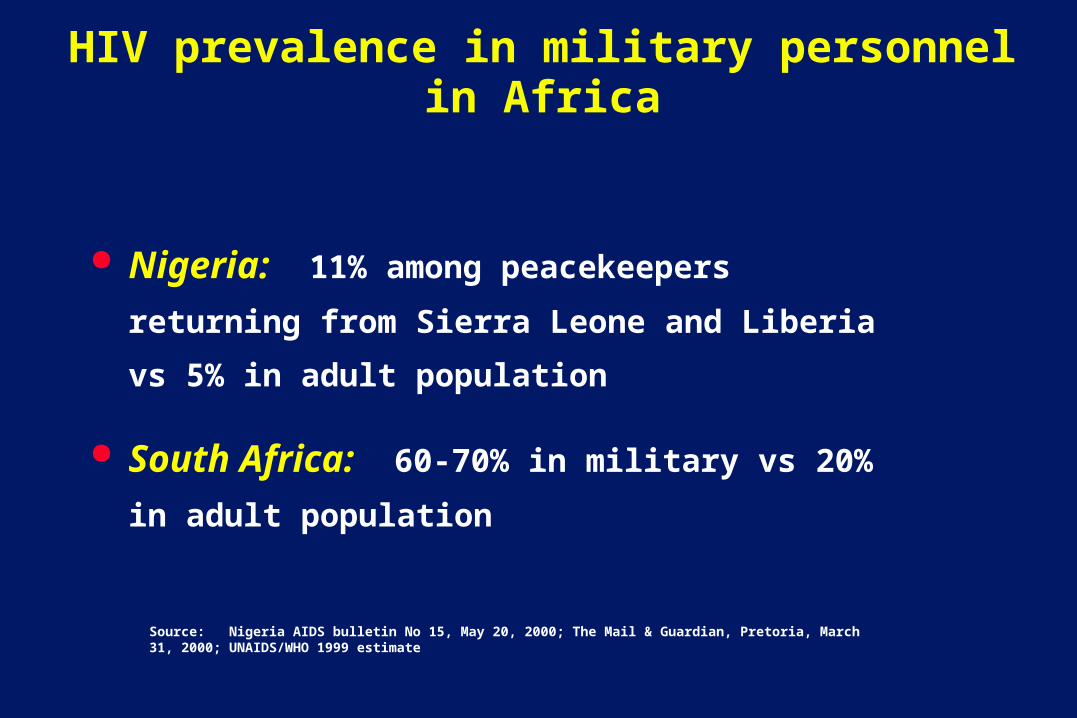
HIV prevalence in military personnel in Africa
Nigeria: 11% among peacekeepers returning from
Sierra Leone and Liberia vs 5% in adult population
South Africa: 60-70% in military vs 20% in adult
population
Source: Nigeria AIDS bulletin No 15, May 20, 2000; The Mail & Guardian, Pretoria, March 31, 2000; UNAIDS/WHO 1999 estimate
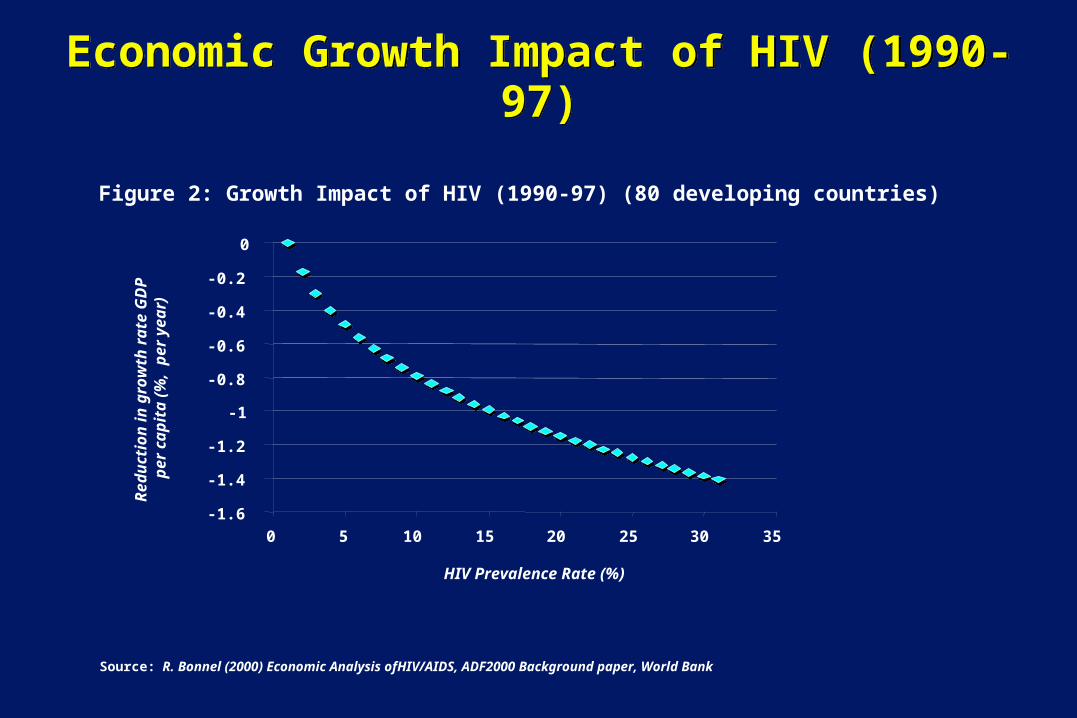
Economic Growth Impact of HIV (1990-97)Economic Growth Impact of HIV (1990-97)
Figure 2: Growth Impact of HIV (1990-97) (80 developing countries)
-1.6
-1.4
-1.2
-1
-0.8
-0.6
-0.4
-0.2
0
0 5 10 15 20 25 30 35
HIV Prevalence Rate (%)
Re
du
cti
on
in
gro
wth
ra
te G
DP
p
er
ca
pit
a (
%,
pe
r y
ea
r)
Source: R. Bonnel (2000) Economic Analysis ofHIV/AIDS, ADF2000 Background paper, World Bank
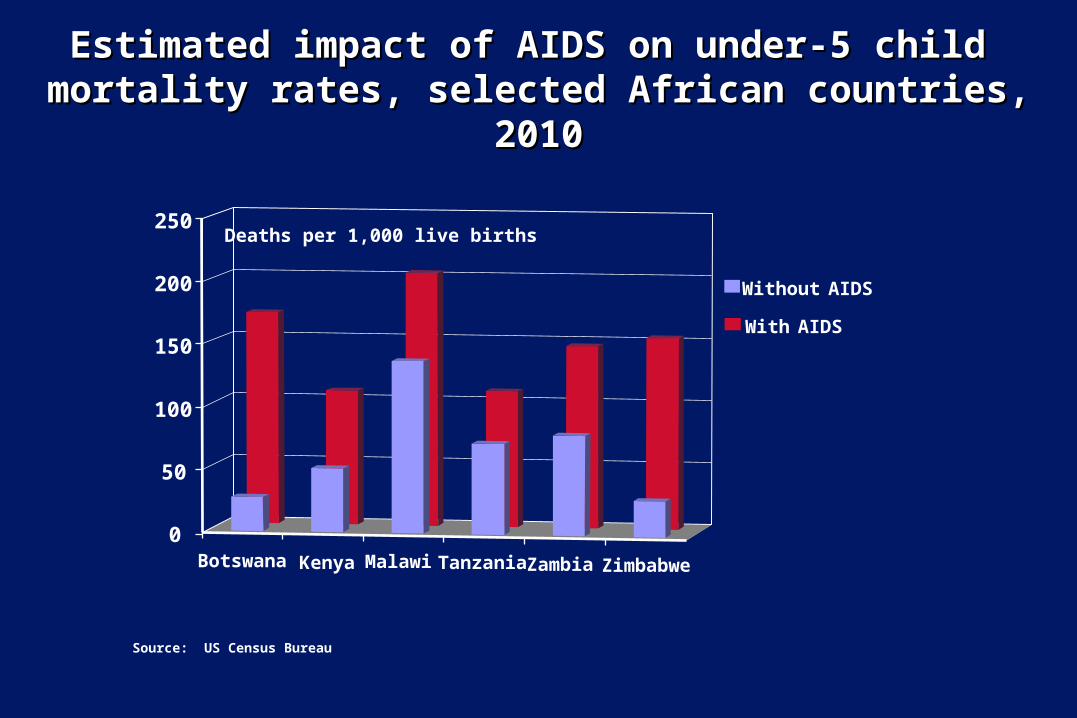
Estimated impact of AIDS on under-5 child Estimated impact of AIDS on under-5 child mortality rates, selected African countries, 2010mortality rates, selected African countries, 2010
Botswana Kenya Malawi Tanzania Zambia Zimbabwe
0
50
100
150
200
250Deaths per 1,000 live births
Without AIDS
With AIDS
Source: US Census Bureau
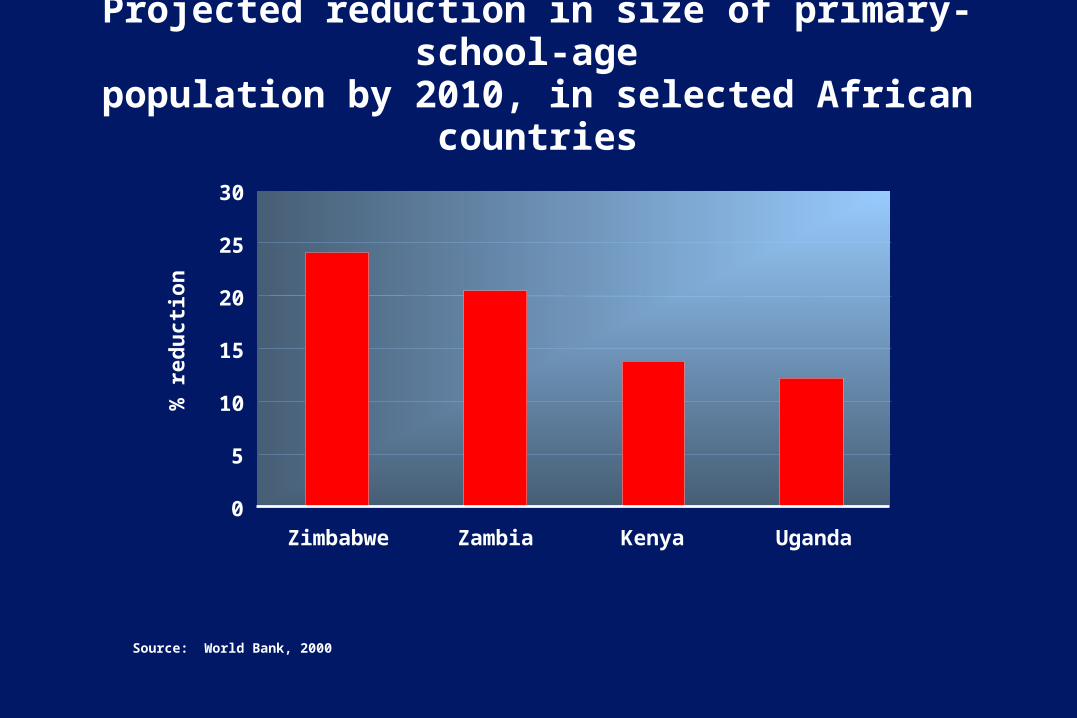
Projected reduction in size of primary-school-age
population by 2010, in selected African countries
0
5
10
15
20
25
30
Zimbabwe Zambia Kenya Uganda
% r
ed
ucti
on
Source: World Bank, 2000

Success stories
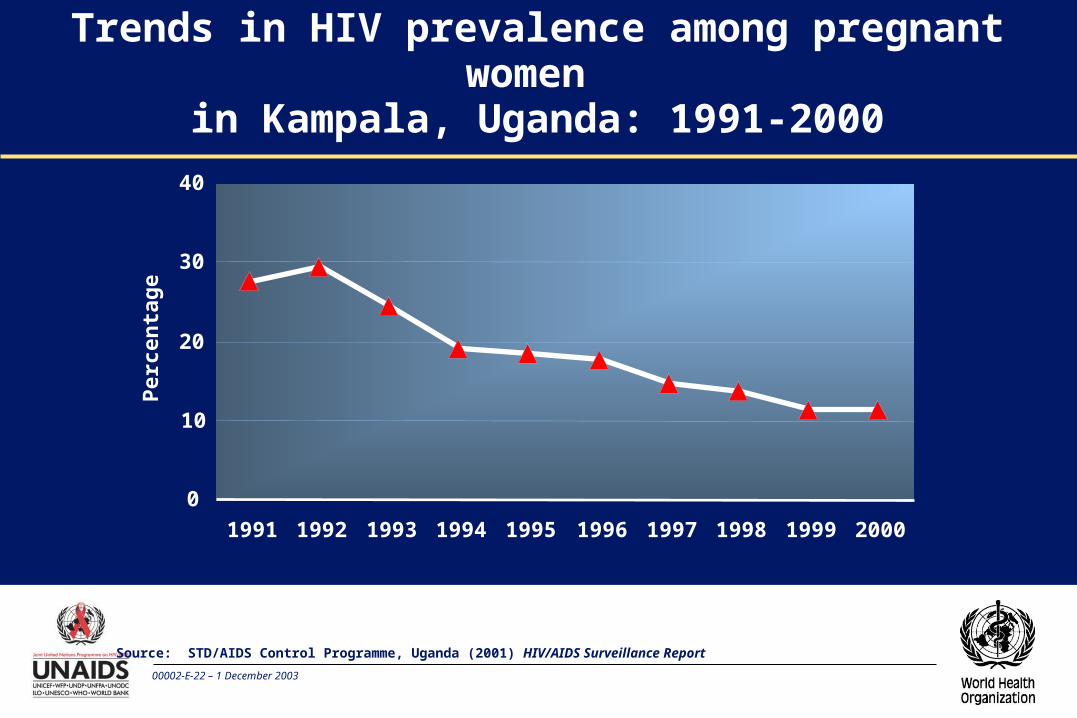
00002-E-22 – 1 December 2003
Trends in HIV prevalence among pregnant women
in Kampala, Uganda: 1991-2000
Source: STD/AIDS Control Programme, Uganda (2001) HIV/AIDS Surveillance Report
0
10
20
30
40
1991 1992 1993 1994 1995 1996 1997 1998 1999 2000
Perc
en
tag
e
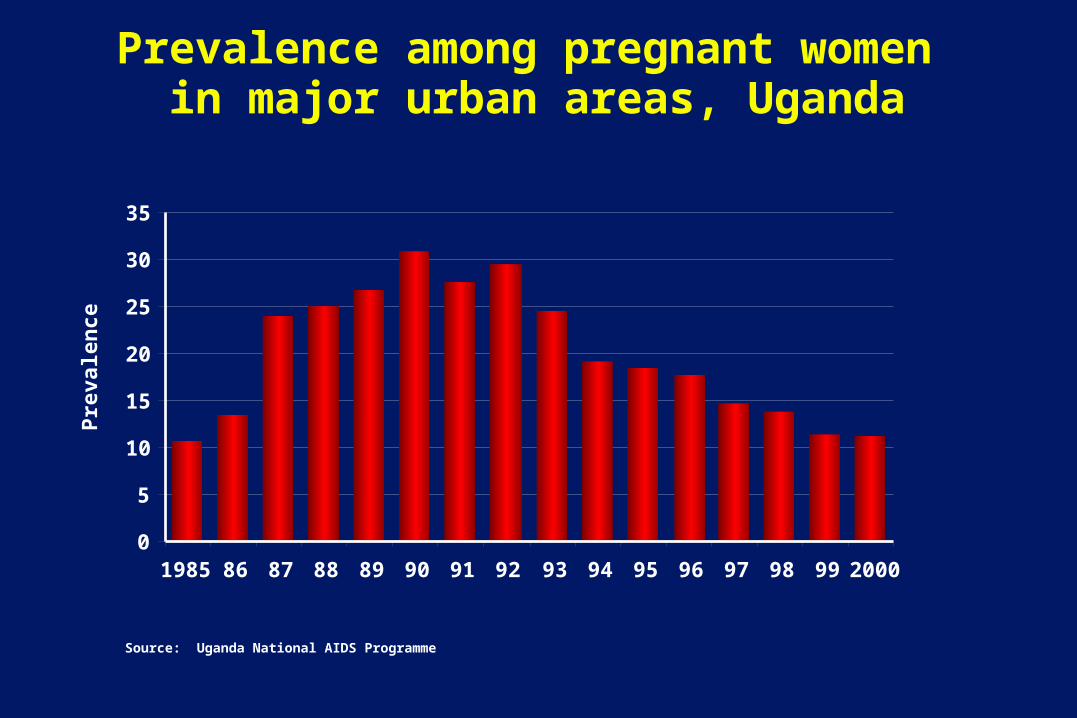
Prevalence among pregnant women in major urban areas, Uganda
Source: Uganda National AIDS Programme
0
5
10
15
20
25
30
35
1985 86 87 88 89 90 91 92 93 94 95 96 97 98 99 2000
Pre
vale
nce
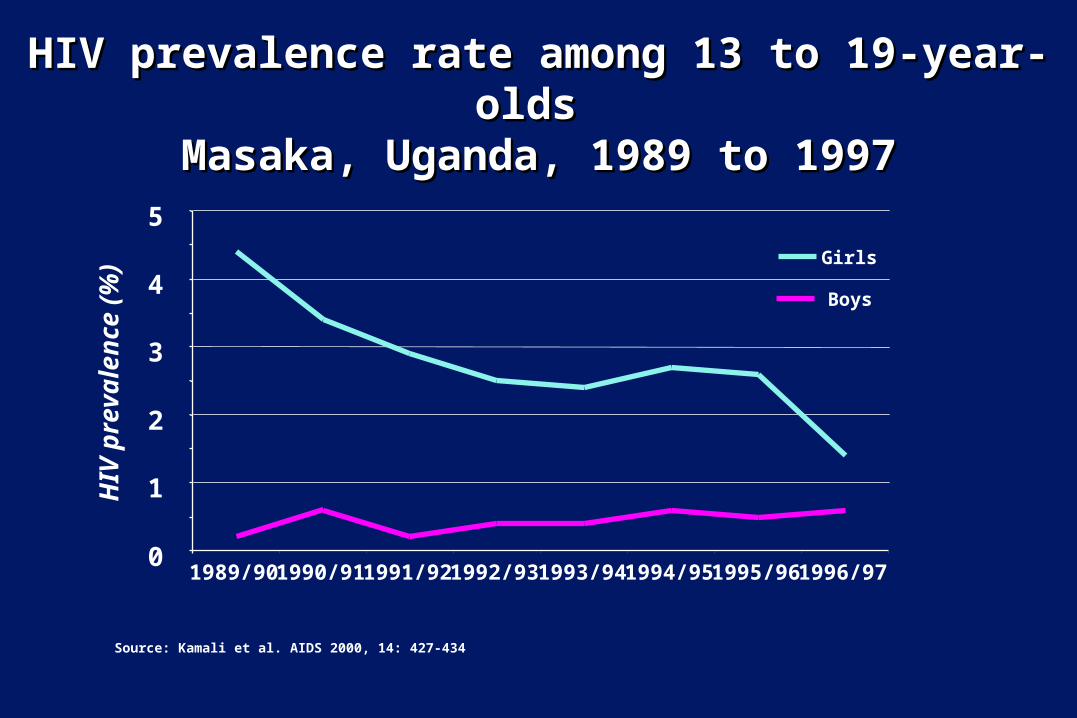
HIV prevalence rate among 13 to 19-year-HIV prevalence rate among 13 to 19-year-olds olds
Masaka, Uganda, 1989 to 1997Masaka, Uganda, 1989 to 1997
Source: Kamali et al. AIDS 2000, 14: 427-434
0
1
2
3
4
5
1989/90 1990/91 1991/92 1992/93 1993/94 1994/95 1995/96 1996/97
Girls
Boys
HIV
pre
va
len
ce
(%)
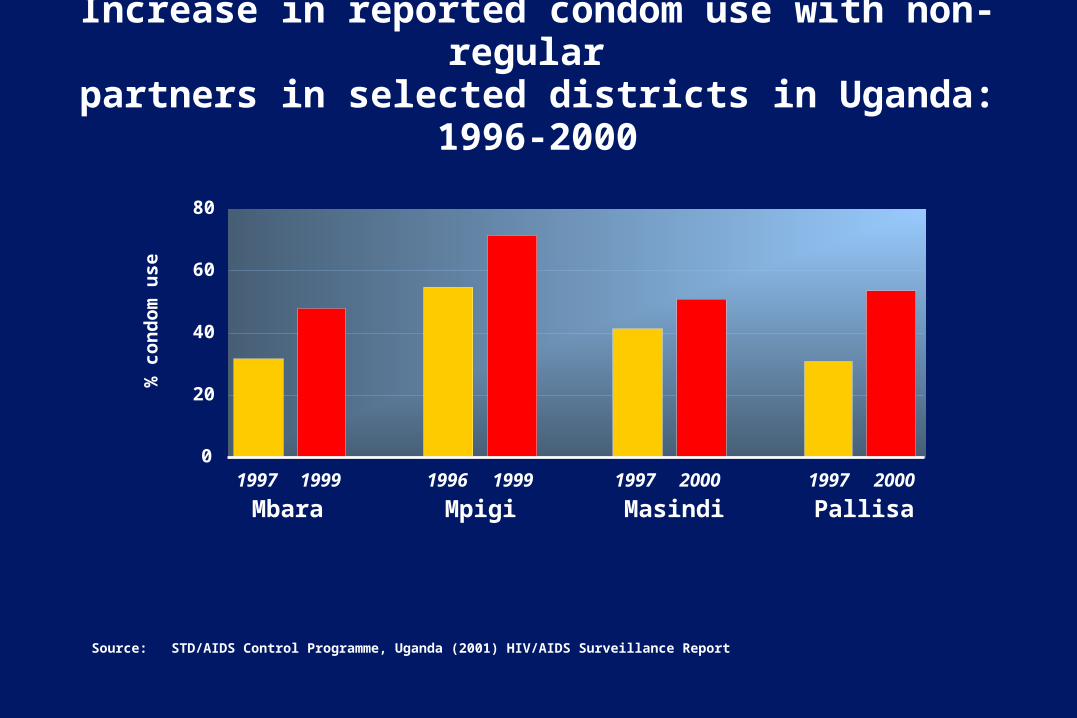
Increase in reported condom use with non-regular
partners in selected districts in Uganda: 1996-2000
Source: STD/AIDS Control Programme, Uganda (2001) HIV/AIDS Surveillance Report
0
20
40
60
80
% c
on
dom
use
1997 1999 1996 1999 1997 2000 1997 2000
Mbara Mpigi Masindi Pallisa
00002-E-26 – 1 December 2003
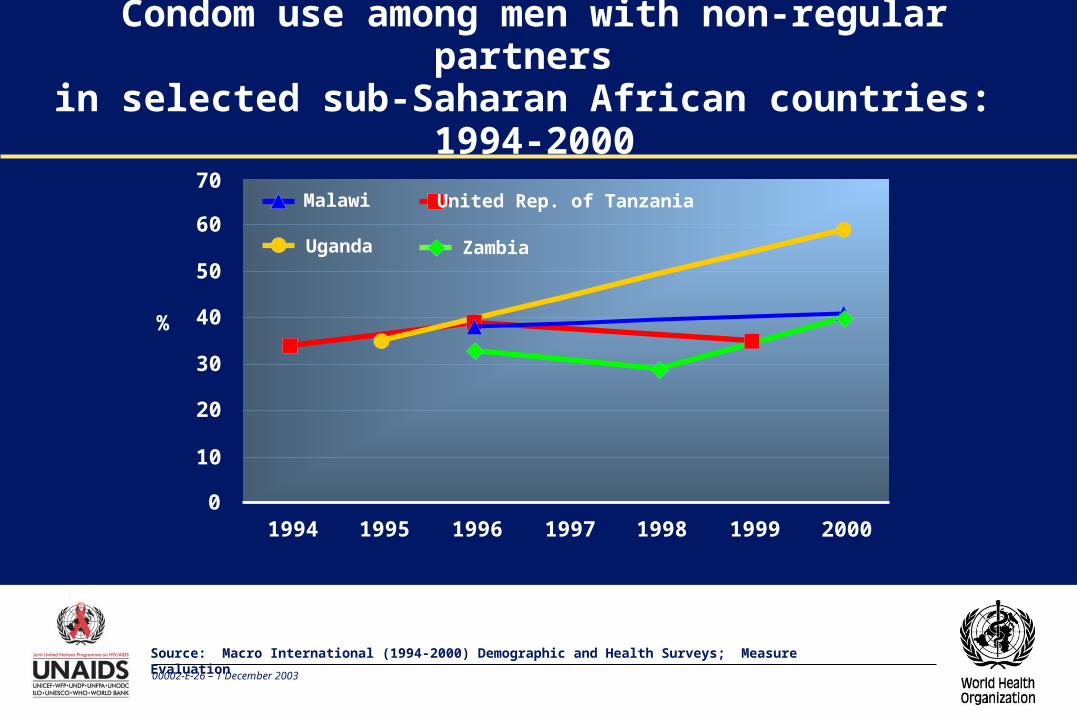
Condom use among men with non-regular partners
in selected sub-Saharan African countries: 1994-2000
Source: Macro International (1994-2000) Demographic and Health Surveys; Measure Evaluation
20
30
40
50
60
1994 1995 1996 1997 1998 1999 2000
Malawi United Rep. of Tanzania
Uganda Zambia
%
70
10
0
00002-E-27 – 1 December 2003
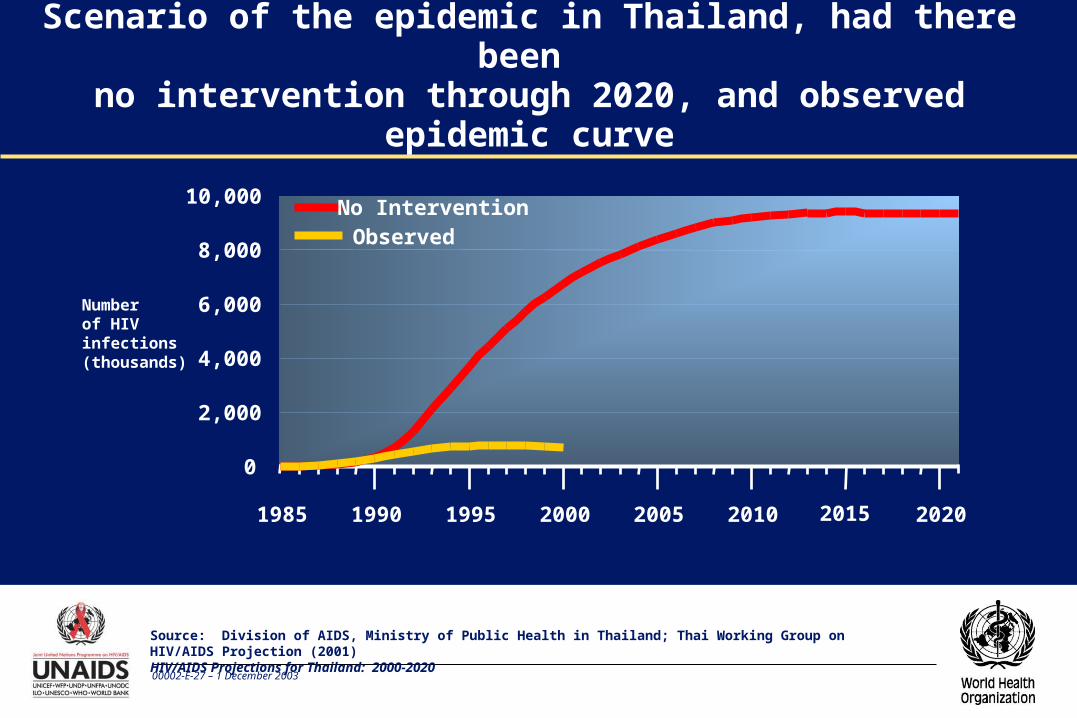
Scenario of the epidemic in Thailand, had there been
no intervention through 2020, and observed epidemic curve
0
2,000
4,000
6,000
8,000
10,000
Number of HIV infections (thousands)
1985 1990 1995 2000 2005 2010 20202015
ObservedNo Intervention
Source: Division of AIDS, Ministry of Public Health in Thailand; Thai Working Group on HIV/AIDS Projection (2001)HIV/AIDS Projections for Thailand: 2000-2020