Modernes Instandhaltungsmanagement für Modern Maintenance ... · 6 SAP ERP ist das Hauptprodukt...
26
Modernes Instandhaltungsmanagement für Gleise Deutsche Kurzfassung Seite 2 - 9 Modern Maintenance Management for Tracks English summary page 10 - 17 Gestion moderne de la maintenance de voies ferrées Résumé français page 18 - 25 Version: 2.0 16.06.2013
Transcript of Modernes Instandhaltungsmanagement für Modern Maintenance ... · 6 SAP ERP ist das Hauptprodukt...

Modernes Instandhaltungsmanagement für Gleise
Deutsche Kurzfassung Seite 2 - 9 Modern Maintenance Management for Tracks
English summary page 10 - 17 Gestion moderne de la maintenance de voies ferrées Résumé français page 18 - 25
Version: 2.0 16.06.2013

Rhomberg Sersa Rail Group – Maintenance Management Service Seite 2/26
Modernes Instandhaltungsmanagement für Gleise Transparenz für eine optimierte Mittelverwendung Die Infrastruktur der Verkehrsunternehmen bildet mit ihren ortsfesten Anlagen den Grundbaustein des Verkehrssystems. Instandhaltung und Betrieb dieser Verkehrsanlagen verursachen mit ca. 65 % der Lebenszykluskosten (LCC) hohe wirtschaftliche Aufwendungen (Abbildung 1).
Abbildung 1 Typische Kostenaufteilung von Bahnanlagen nach Lebenszyklen
Im Fokus stehen dabei die betriebssichere und wirtschaftliche Vorhaltung der Infrastruktur und eine anforderungsgerechte Anlagenverfügbarkeit. Aufgaben, denen sich heute ein modernes Instandhaltungsmanagement, das sich als die Gesamtheit aller Maßnahmen zur Gestaltung, Lenkung und Entwicklung der Instandhaltung definiert, aktiv stellt. Die möglichst optimale Verwendung der Instandhaltungsressourcen gehört zu den Kernaufgaben des Instandhaltungsmanagements. Ein effizientes und zielorientiertes Instandhaltungsmanagement macht es zudem erforderlich, strukturierte Geschäftsprozesse zu verwirklichen und aktuelle bedarfsorientierte Datengrundlagen (Bestandsdaten und Zustandsdaten) einzusetzen. Zur Wahrung ihrer gesetzlichen Sorgfaltspflicht (gemäß BOStrab, EBO und BOA) müssen Verkehrsunternehmen den Zustand ihrer Anlagen regelmäßig überprüfen. Diese Zustandsüberprüfung kann neben dem Nachweis der Betriebssicherheit auch zur Ermittlung des Instandhaltungsbedarfs genutzt werden. Von Inspektion wird immer dann gesprochen, wenn beide Zwecke verfolgt werden. Inspektionen bestehen aus 2 Teilen: a) Visuelle Prüfung b) Messungen Entscheidende Vorteile erzielt, wer mit geringem Aufwand aus Inspektionsdaten bedarfsgerechte Informationen für das Instandhaltungsmanagement bereitstellt; bedarfsgerecht im Hinblick auf Umfang und Qualität, also hinsichtlich der unmittelbaren Verwendbarkeit für die Planung und Steuerung der Instandhaltung.
t 30-50 Jahre
K
o
s
t
e
n
Planung Realisierung, Bau Betrieb, Instandhaltung Rückbau
2 %
65 %
28 %5 %

Rhomberg Sersa Rail Group – Maintenance Management Service Seite 3/26
Aus Daten werden Informationen Die Bereitstellung qualifizierter Daten wird dank verbesserter Datentechnik, Fahrwegdiagnose und moderner Inspektionsmethoden seit der Einführung digitaler Messsysteme wesentlich erleichtert. Der Informationsbedarf steigt – parallel dazu nehmen die zur Verfügung stehenden Datenmengen mitunter beängstigende Umfänge an. Mit der Zahl der Messparameter, der Genauigkeit der Geräte und immer kürzerer Messintervalle droht hier ganz schnell ein neues Problem, das in der Regel den Namen „Datenflut“ verdient. Damit die zur Verfügung stehenden Datenmengen mit geringem Aufwand zu bedarfsgerechten Informationen für das Instandhaltungsmanagement werden können, empfiehlt es sich, diese auf das wesentliche zu konzentrieren und in eine transportable und strukturierte Form zu bringen, die die An- oder Einbindung von datenbankgestützten Instandhaltungsmanagementsystemen ermöglicht. Dazu sollten Klassifizierungs- und Verdichtungsverfahren (Abbildung 2) und das Datenmodell des IDMVU1 mit dem Schnittstellenstandard VDV 456 die Grundlage bilden. Eine Differenzierung der Anlagen nach deren Belastung und die standardisierte Fehlerdiagnose mit daraus abgeleiteten Maßnahmen erleichtern Instandsetzungsentscheidungen und machen sie nachvollziehbar und transparent. Sie bedeuten zusätzliche Sicherheit bei der Planung und Steuerung der Instandhaltung.
Abbildung 2 Schematischer Verlauf der Verschleißentwicklung mit den Bewertungsgrenzen: Toleranzen (zur
Klassifizierung von Messergebnissen) und Fehlerklassen (zur Klassifizierung von Ergebnissen der visuellen Prüfung)
Anlagensubstanz messen - Kennziffer Abnutzungsvorrat (KAV®)
1 Das BMVBS Forschungsprojekt Infrastruktur-Daten-Management (IDMVU) bildet die für Instandhaltungslösungen notwendigen Datenstrukturen in Form eines konzeptionellen Datenmodells und eines Schnittstellenstandards zum Datenaustausch für Bestands- und Zustandsdaten fach- und netzübergreifend ab und ist als VDV Schrift 456 veröffentlicht www.idmvu.org

Rhomberg Sersa Rail Group – Maintenance Management Service Seite 4/26
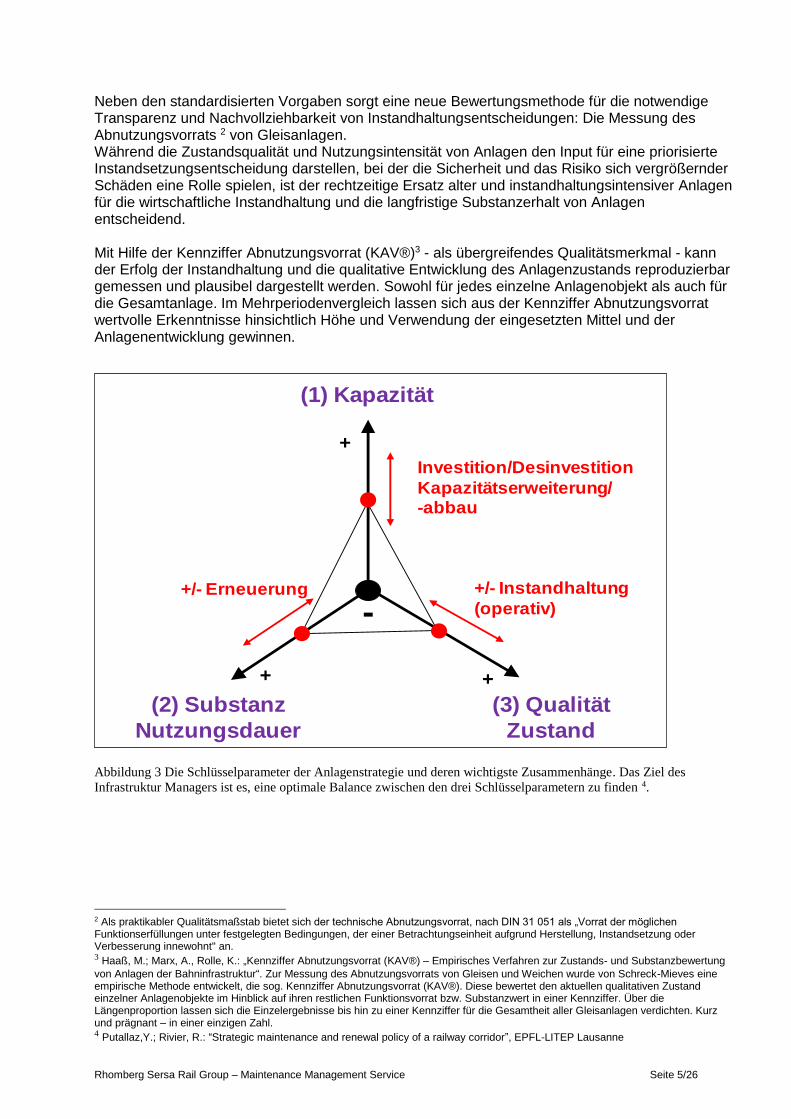
Art und Weise, Umfang und Höhe des Instandhaltungsaufwands werden maßgeblich von drei Schlüsselparametern der Anlagenstrategie (Abbildung 3) bestimmt: - Bei der Kapazität (1) einer Anlage geht es um die Größe und Ausdehnung der Infrastruktur. Es liegt auf der Hand, dass ein kleines Netz in der Regel einen geringeren Instandhaltungsaufwand verursacht als ein großes Netz. Die Netzkapazität wird von der Anlagenstrategie des Eigentümers bestimmt. - Messgrößen der Kapazität sind: Gleislänge, Nutzlängen, Abstelllängen etc. - Anpassung durch Investition (Streckenerweiterung) bzw. Desinvestition (Rückbau) aber auch durch Aufrüstung (Upgrade) vorhandener Anlagen beispielsweise durch neue Elektrifizierungs- oder Sicherungssysteme - Unter Substanz (2) einer Anlage versteht man die verbleibende Rest-Nutzungsdauer (economic life). Eine junge Infrastruktur besitzt eine große Substanz. Ein wesentlicher Aspekt der Substanz stellt die wirtschaftliche Nutzungsdauer der Anlage dar. Die Anlagensubstanz spiegelt sich technisch als Abnutzungsvorrat wieder. Dieser ist ein wichtiger Indikator zur Bestimmung des optimalen Erneuerungszeitpunkts und die werterhaltende Instandhaltung. - Messgrößen der Substanz von Gleisnetzen sind: Abnutzungsvorrat, Nutzungsdauer, Durchschnittsalter - Anpassung durch Erneuerung (Grundinstandsetzung) ganzer Anlagen oder Kompo- nenten, z.B. Untergrundsanierung, Streckenumbau, Schienen- oder Schwellenwechsel - Die Qualität (3) Die Qualität einer Anlage wird weitgehend von den Aspekten der Sicherheit und Verfügbarkeit bestimmt. Die Anlagenqualität verschlechtert sich durch die Verwendung (Verkehrsbelastung), durch auftretenden Verschleiß. Sie verbessert sich durch Instandsetzung und Erneuerung. Die Netzqualität wird wesentlich von Umfang und Qualität der operativen Instandhaltung (Inspektion, Wartung, Instandsetzung) beeinflusst. - Messgrößen der Netzqualität sind: Zustand, Verfügbarkeit, Fehlerklassen pro Einheit etc. - Anpassung mittels mehr (+) oder weniger (-) Instandsetzung, z.B. Einzelfehlerbeseitigung, Schleifen, Schweißen, Stopfen Die 3 Schlüsselparameter der Anlagenstrategie stehen in direkter gegenseitiger Abhängigkeit: - Ein großes Netz erfordert mehr Instandhaltung als ein kleineres. - Eine höhere Verkehrsbelastung verursacht mehr Verschleiß als eine geringere
Belastung. - Eine alte Anlage verursacht mehr Instandhaltungsaufwand als eine neue
Anlage. - Eine schlechte Anlagenqualität beschleunigt den Verschleißfortschritt und
verkürzt die wirtschaftliche Nutzungsdauer; unterlassene, oder schlecht ausgeführte Instandsetzung genauso.
Eine ausgewogene Anlagenstrategie ist der Schlüssel zur erfolgreichen Instandhaltung. Ausgewogenheit liegt dann vor, wenn sich Kapazität, Substanz und Qualität der Anlage im Gleichgewicht befinden. Eine nicht ausgewogene, einseitige Anlagenstrategie führt auf Dauer zu höheren Unterhaltskosten und damit zu einem beschleunigten Werteverzehr von langfristig eingesetztem Kapital. Unterlassene Instandhaltung zeigt sicherheitstechnisch zunächst kaum Folgen - eine Häufung von Ausfällen tritt meist zeitverzögert auf. Aber wie alle über lange Zeiträume genutzte Anlagen verzeiht auch eine Gleisanlage Instandhaltungsunterlassungen nicht: Die Lebensdauer der Anlage wird rapide verkürzt – die Lebenszykluskosten steigen überproportional. Fehlen Daten über die Zustands- und Substanzentwicklung, bleibt dieser kausale Zusammenhang verborgen.
Rhomberg Sersa Rail Group – Maintenance Management Service Seite 5/26
Neben den standardisierten Vorgaben sorgt eine neue Bewertungsmethode für die notwendige Transparenz und Nachvollziehbarkeit von Instandhaltungsentscheidungen: Die Messung des Abnutzungsvorrats 2 von Gleisanlagen. Während die Zustandsqualität und Nutzungsintensität von Anlagen den Input für eine priorisierte Instandsetzungsentscheidung darstellen, bei der die Sicherheit und das Risiko sich vergrößernder Schäden eine Rolle spielen, ist der rechtzeitige Ersatz alter und instandhaltungsintensiver Anlagen für die wirtschaftliche Instandhaltung und die langfristige Substanzerhalt von Anlagen entscheidend. Mit Hilfe der Kennziffer Abnutzungsvorrat (KAV®)3 - als übergreifendes Qualitätsmerkmal - kann der Erfolg der Instandhaltung und die qualitative Entwicklung des Anlagenzustands reproduzierbar gemessen und plausibel dargestellt werden. Sowohl für jedes einzelne Anlagenobjekt als auch für die Gesamtanlage. Im Mehrperiodenvergleich lassen sich aus der Kennziffer Abnutzungsvorrat wertvolle Erkenntnisse hinsichtlich Höhe und Verwendung der eingesetzten Mittel und der Anlagenentwicklung gewinnen.
Abbildung 3 Die Schlüsselparameter der Anlagenstrategie und deren wichtigste Zusammenhänge. Das Ziel des
Infrastruktur Managers ist es, eine optimale Balance zwischen den drei Schlüsselparametern zu finden 4.
2 Als praktikabler Qualitätsmaßstab bietet sich der technische Abnutzungsvorrat, nach DIN 31 051 als „Vorrat der möglichen Funktionserfüllungen unter festgelegten Bedingungen, der einer Betrachtungseinheit aufgrund Herstellung, Instandsetzung oder Verbesserung innewohnt" an. 3 Haaß, M.; Marx, A., Rolle, K.: „Kennziffer Abnutzungsvorrat (KAV®) – Empirisches Verfahren zur Zustands- und Substanzbewertung
von Anlagen der Bahninfrastruktur“. Zur Messung des Abnutzungsvorrats von Gleisen und Weichen wurde von Schreck-Mieves eine empirische Methode entwickelt, die sog. Kennziffer Abnutzungsvorrat (KAV®). Diese bewertet den aktuellen qualitativen Zustand einzelner Anlagenobjekte im Hinblick auf ihren restlichen Funktionsvorrat bzw. Substanzwert in einer Kennziffer. Über die Längenproportion lassen sich die Einzelergebnisse bis hin zu einer Kennziffer für die Gesamtheit aller Gleisanlagen verdichten. Kurz und prägnant – in einer einzigen Zahl. 4 Putallaz,Y.; Rivier, R.: “Strategic maintenance and renewal policy of a railway corridor”, EPFL-LITEP Lausanne
(1) Kapazität
(3) Qualität
Zustand
(2) Substanz
Nutzungsdauer
Investition/Desinvestition
Kapazitätserweiterung/ -abbau
+/- Instandhaltung
(operativ)+/- Erneuerung
+
-
+
+

Rhomberg Sersa Rail Group – Maintenance Management Service Seite 6/26
Abbildung 4 zeigt den typischen Entwicklungsverlauf des Abnutzungsvorrats – ohne Intervention - mit dem Maßstab
Kennziffer Abnutzungsvorrat (KAV®)
Rhomberg Sersa Rail Group – Maintenance Management Service Seite 7/26
MR.pro® - Instandhaltungsmanagement System für ganzheitliche Lösungen
MR.pro®5 ist ein datenbankgestütztes, technisches Informations- und Instandhaltungsmanagement-System. Entstanden aus dem „Tagesgeschäft“ der Inspektion von Gleisen und Weichen. Die zunächst ausschließlich für den Eigenbedarf entwickelte Software diente ursprünglich nur dazu, die mit digitalen Weichen- und Gleismessgeräten gesammelten Daten schnell und zuverlässig auswerten und mit den Ergebnissen der visuellen Prüfung zu einer Gesamtzustandsbeurteilung verzahnen zu können. Die automatisierte Erstellung von leicht verständlichen, visuell unterstützten Dokumentationen, die Dank der klassifizierten Mängel auch ohne technische Spezialkenntnisse und Hilfsmittel interpretierbar sind, war dabei ein wesentlicher Aspekt. Gründe für die durchgehende Zustandserfassung auf digitalen Endgeräten (ohne Medienbruch) waren in erster Linie die Fehlerminimierung durch Plausibilitäts-Checks, der Entfall von Übertragungsfehlern und nicht zu vernachlässigen, die Vollständigkeit der Informationen durch die integrierte Dialogführung, die zu jeder festgestellten Abweichung vom Sollzustand einen vor Ort getroffenen Maßnahmenvorschlag verlangt.
Basierend auf einer ergonomischen Zustandserfassung, der automatisierten Zustandsanalyse, Auswertung und Dokumentation erschließt die Software inzwischen neben den genannten Qualitätsverbesserungen zusätzliche Kostenvorteile durch eine konsequente Prozessoptimierung und visuell unterstützte Entscheidungs- und Planungshilfen.
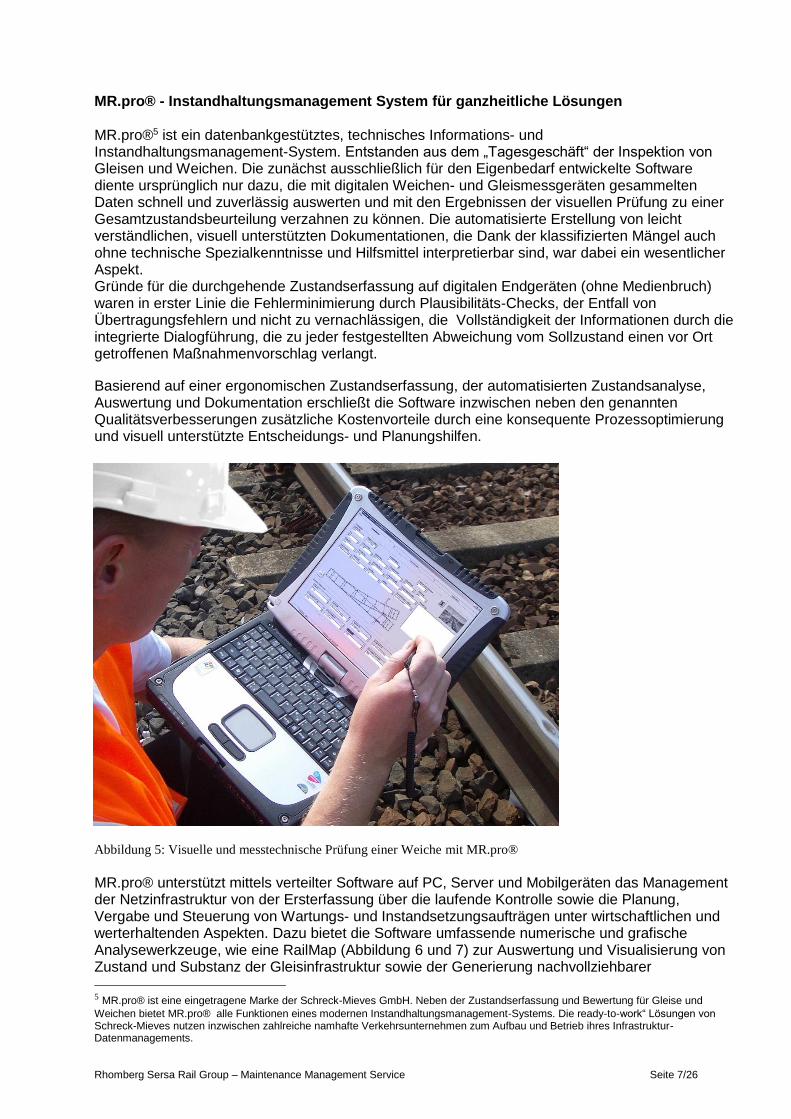
Abbildung 5: Visuelle und messtechnische Prüfung einer Weiche mit MR.pro®
MR.pro® unterstützt mittels verteilter Software auf PC, Server und Mobilgeräten das Management der Netzinfrastruktur von der Ersterfassung über die laufende Kontrolle sowie die Planung, Vergabe und Steuerung von Wartungs- und Instandsetzungsaufträgen unter wirtschaftlichen und werterhaltenden Aspekten. Dazu bietet die Software umfassende numerische und grafische Analysewerkzeuge, wie eine RailMap (Abbildung 6 und 7) zur Auswertung und Visualisierung von Zustand und Substanz der Gleisinfrastruktur sowie der Generierung nachvollziehbarer 5 MR.pro® ist eine eingetragene Marke der Schreck-Mieves GmbH. Neben der Zustandserfassung und Bewertung für Gleise und
Weichen bietet MR.pro® alle Funktionen eines modernen Instandhaltungsmanagement-Systems. Die ready-to-work“ Lösungen von Schreck-Mieves nutzen inzwischen zahlreiche namhafte Verkehrsunternehmen zum Aufbau und Betrieb ihres Infrastruktur-Datenmanagements.
Rhomberg Sersa Rail Group – Maintenance Management Service Seite 8/26
Entscheidungen notwendiger und sinnvoller Instandsetzungs- und Wartungsmaßnahmen. Bidirektionale Schnittstellen sichern die Anbindung an betriebswirtschaftliche Instandhaltungsmanagement- und Planungssysteme - ERP-Systeme wie z.B. SAP/PM6. Die beiden arbeitsteiligen Systeme lassen sich durch Geografische Informationssysteme (GIS) als globale Informationsplattformen und Planungsbasis ergänzen. Der MR.pro® Funktionsumfang umfasst unter anderem:
- RailMap, ein interaktiver schematischer Gleisplan zur Darstellung von Gesamt- oder Teilnetzen mit bidirektionaler Datenbankanbindung,
- GoogleMaps™ 7 -Integration als Orientierungs- und Positionierungshilfe, - Gewährleistungs- und Nutzungsdauermanagement, - Anlagen-Substanzermittlung (Kennziffer Abnutzungsvorrat KAV®), - Wartungs- und Revisionsmanagement, - Störungsmanagement, - Instandhaltungskalender als Terminübersicht, - Auftragsmanagement mit Schnittstelle zu SAP/PM, - Leistungsverzeichnismodul (GEAB Datenformat)
MR.pro® ist auch in einer preiswerten „passiven“ Version, ohne die „aktiven“ Module zur Zustandserfassung und -bewertung erhältlich. MR.pro®LT ist für Verkehrsunternehmen konzipiert, die Inspektionen von Servicepartnern ausführen lassen.
Weitere Informationen: www.mr-pro.de
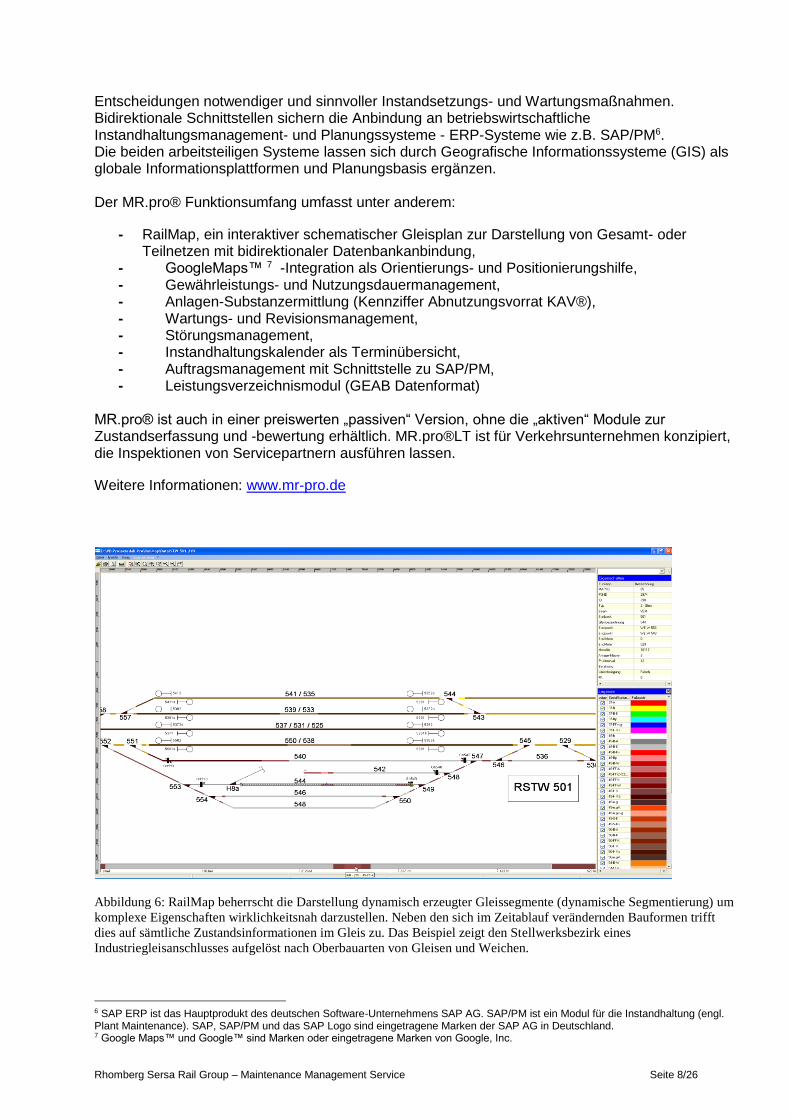
Abbildung 6: RailMap beherrscht die Darstellung dynamisch erzeugter Gleissegmente (dynamische Segmentierung) um
komplexe Eigenschaften wirklichkeitsnah darzustellen. Neben den sich im Zeitablauf verändernden Bauformen trifft
dies auf sämtliche Zustandsinformationen im Gleis zu. Das Beispiel zeigt den Stellwerksbezirk eines
Industriegleisanschlusses aufgelöst nach Oberbauarten von Gleisen und Weichen.
6 SAP ERP ist das Hauptprodukt des deutschen Software-Unternehmens SAP AG. SAP/PM ist ein Modul für die Instandhaltung (engl. Plant Maintenance). SAP, SAP/PM und das SAP Logo sind eingetragene Marken der SAP AG in Deutschland. 7 Google Maps™ und Google™ sind Marken oder eingetragene Marken von Google, Inc.

Rhomberg Sersa Rail Group – Maintenance Management Service Seite 9/26
Der Aufbau eines Infrastruktur-Daten-Managements ist eine komplexe Aufgabe, die ein struktu-riertes und streng ergebnisorientiertes Vorgehen erfordert. Detaillierungsgrad und Struktur der Daten sollten sich am IDMVU-Standard orientieren und an die Anforderungen der Beteiligten an-gepasst werden, da der mit jedem Datenbankfeld einhergehende Pflegeaufwand beträchtlich sein kann. Zur Schaffung einer verlässlichen Datenlage sind durchgängige und aktuelle Bestandsinformatio-nen der Netzinfrastruktur eine Grundvoraussetzung. Dies ist aufgrund der heterogenen und wech-selnden Bauformen innerhalb des Gleisnetzes eine wichtige und notwendige Aufgabe. Nimmt die Bestandsaufnahme (Inventur) des Netzes einen längeren Zeitraum in Anspruch, ist die Aktualität der zuerst erfassten Objekte mitunter schon in Frage zu stellen. Eine konzentrierte Komplettauf-nahme des Gesamtnetzes oder von Teilnetzen ist deshalb empfehlenswert. Die Datenbasis „Gleis“ sollte erfassungstechnisch immer den Anfang bilden. Einigen Verkehrsunternehmen gelingt der Start ins digitale Infrastruktur-Daten-Management auf Anhieb, da sie eine Kombination aus Dienstleistung sowie Soft- und Hardwarelieferung – sozusa-gen eine „ready to work“-Lösung, nutzen. Schreck-Mieves nennt diese Kombilösung „Simplify Database für Gleisanlagen“ die in kürzester Zeit eine verlässliche Datenlage aus Bestands- und Zustandsinformationen schafft. Zunächst wird der im Rahmen der Instandhaltungsplanung und -steuerung sinnvolle Informationsbedarf mit dem Betreiber vorkonfiguriert. Dazu zählen schon im Vorfeld ermittelte Details zu Bewertungs- und Klassifizierungsverfahren, Schnittstellen und der Weiterverarbeitung von Zustandsinformationen in Planungs- und/oder Geografischen Informationssystemen (GIS). In der weiteren Umsetzung erstellen die Spezialisten von Schreck-Mieves – zumeist gemeinsam mit dem Fachpersonal des Verkehrsbetriebs - bei der Inventur-Aufnahme der Gleis- und Weichenanlagen eine komplette Datenbasis. MR.pro® wird kundengerecht mit allen Bestands- und Zustandsdaten installiert, das Inspektions-Equipment nach intensiver Schulung an den Betreiber übergeben und der „fliegende Start“ professionell unterstützt und betreut.
Abbildung 7 Die integrierte RailMap von MR.pro® bietet neben einem guten Zustandsüberblick einen direkten
Zugang zu Bestands- und Zustandsdaten sowie sämtlichen zugeordneten Dokumenten – auch für große Netze.
Dargestellt ist die streckenbezogene Fehlerverteilung (Fehlerklassen) innerhalb des aktivierten Gleisabschnitts 16.6.
(Quelle: IFTEC, Netz der Leipziger Verkehrsbetriebe)

Rhomberg Sersa Rail Group – Maintenance Management Service Seite 10/26
Modern Maintenance Management for Tracks
Transparency for an optimised implementation of resources The infrastructure of a transportation company together with its fixed installations forms the foundation of a transportation system. The maintenance and operation of transportation facilities which constitutes approximately 65% of the life cycle costs (LCC) result in a high economic expenditure (Figure 1).
Figure 1 Typical distribution of costs of railway facilities according to their life cycle
The focus lies on providing a reliable and economic infrastructure service as well as ensuring the availability of the system according to requirements. These are the challenges of modern maintenance management systems which are defined by the combination of all measures required for the creation, control and development of maintenance. The core tasks of maintenance management are the optimal use of maintenance resources. An efficient and aim oriented maintenance management also requires structured business processes and the implementation of up-to-date fundamental data (inventory data and condition data). In order to meet their legal obligations of care, transportation companies regularly have to check the condition of their infrastructure. This inspection data can besides the proof of operational safety also be used to determine maintenance requirements. It is always spoken of an inspection when both purposes are followed. Inspections consist of two parts: a) Visual inspection b) Measurements Marked advantages are achieved if required information for maintenance management is made available with the minimum of effort. The information should be tailored to need in view of circumference and quality, in other words aimed at the immediate use for planning and control of maintenance.
t 30 - 50 years
C
o
s
t
s
Plannin
g
Realisation, Operation, maintenance Removal
2 %
65 %
28 % 5 %
Rhomberg Sersa Rail Group – Maintenance Management Service Seite 11/26
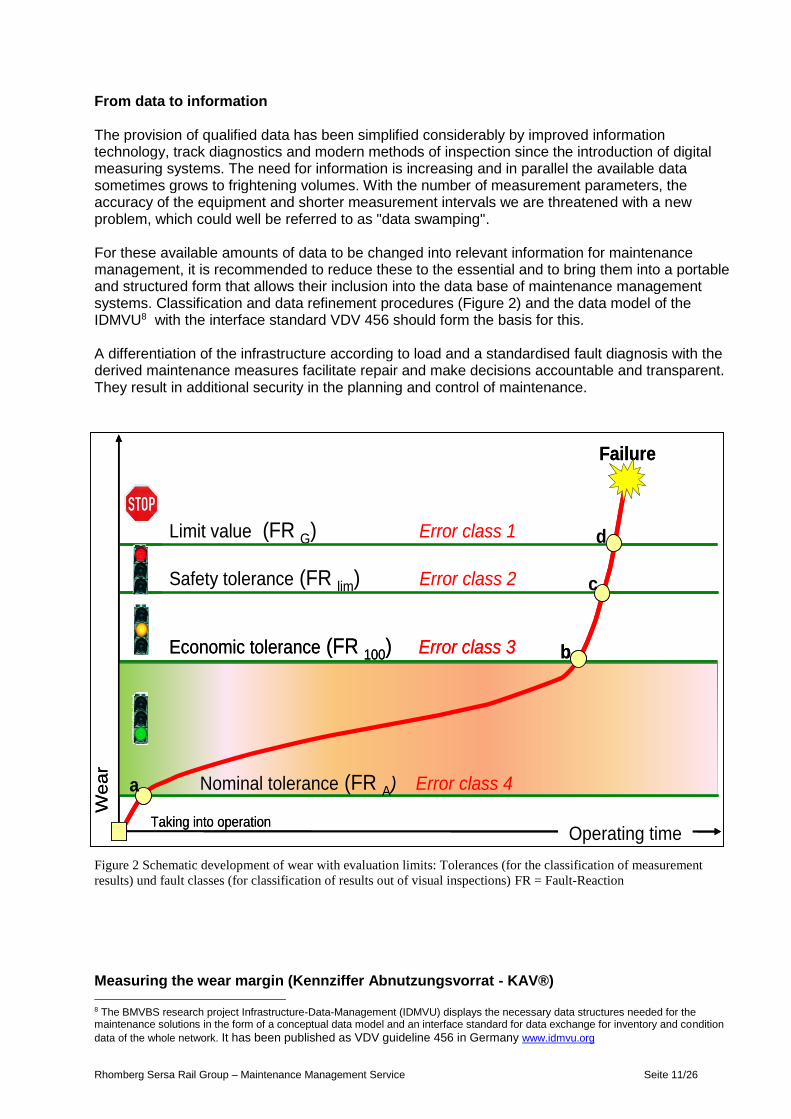
From data to information The provision of qualified data has been simplified considerably by improved information technology, track diagnostics and modern methods of inspection since the introduction of digital measuring systems. The need for information is increasing and in parallel the available data sometimes grows to frightening volumes. With the number of measurement parameters, the accuracy of the equipment and shorter measurement intervals we are threatened with a new problem, which could well be referred to as "data swamping". For these available amounts of data to be changed into relevant information for maintenance management, it is recommended to reduce these to the essential and to bring them into a portable and structured form that allows their inclusion into the data base of maintenance management systems. Classification and data refinement procedures (Figure 2) and the data model of the IDMVU8 with the interface standard VDV 456 should form the basis for this. A differentiation of the infrastructure according to load and a standardised fault diagnosis with the derived maintenance measures facilitate repair and make decisions accountable and transparent. They result in additional security in the planning and control of maintenance.
Figure 2 Schematic development of wear with evaluation limits: Tolerances (for the classification of measurement
results) und fault classes (for classification of results out of visual inspections) FR = Fault-Reaction
Measuring the wear margin (Kennziffer Abnutzungsvorrat - KAV®) 8 The BMVBS research project Infrastructure-Data-Management (IDMVU) displays the necessary data structures needed for the maintenance solutions in the form of a conceptual data model and an interface standard for data exchange for inventory and condition
data of the whole network. It has been published as VDV guideline 456 in Germany www.idmvu.org
Failure
Taking into operation
Limit value (FR G) Error class 1
Safety tolerance (FR lim) Error class 2
Economic tolerance (FR 100) Error class 3
Wear
Nominal tolerance (FR A) Error class 4
d
c
b
a
Operating time
Failure
Taking into operation
Limit value (FR G) Error class 1
Safety tolerance (FR lim) Error class 2
Economic tolerance (FR 100) Error class 3
Wear
Nominal tolerance (FR A) Error class 4
d
c
b
a
Operating time

Rhomberg Sersa Rail Group – Maintenance Management Service Seite 12/26
The method, volume and size of the maintenance effort are markedly influenced by three key parameters of the infrastructure strategy (Figure 3): - Capacity (1) relates to the size and spread of the infrastructure. It is obvious that a smaller
network has less maintenance effort compared to a larger system. The network capacity is determined by the infrastructure strategy of the owner. - Measurable sizes of the network are: track length, useful length, side line length etc. - Adaptation through investment (track extension) or disinvestment (dismantling) but also
through the upgrade of existing infrastructure for example by new electrification or safety systems
- Substance (2)
A significant aspect of the remaining wear margin represents the economical life span of the site. The remaining infrastructure substance is technically reflected in the wear margin. This is an important indicator for renewal and value retaining maintenance. A young (new) infrastructure has a large wear margin. - Measurements of remaining substance of track networks are: wear margin, expected life
span, average age - Adaptation through renewal (basic maintenance) of the complete site or components
thereof, e.g. substructure renewal, modification of rail sections and track or sleeper exchange.
- Quality (3)
The quality of a site is substantially determined by the aspects of security and availability. The quality is reduced by usage (traffic load), in the form of wear. It is renewed by maintenance and renewal. The network quality is influenced considerably by circumference and quality of the maintenance operations (inspection, maintenance, and repair). - Measurable quantities of network quality are: condition, availability, error classes per unit
etc. - Adaptation through more (+) or less (-) maintenance, e.g. removal of individual faults,
grinding, welding and tamping. The three key parameters stand in direct relation to each other: - A large network requires more maintenance than a small one. - A heavy traffic load results in more wear than a smaller load. - An old site requires more maintenance than a new site. - A poor infrastructure quality accelerates the progress of wear and tear and reduces the
economical life span. The same holds for neglected or poor maintenance. A balanced infrastructure strategy is the key for successful maintenance. A balance exists then when the capacity, the material and the quality of the infrastructure are in balance with each other. An unbalanced one-sided infrastructure strategy on the long run leads to higher maintenance costs and therefore also to an accelerated depreciation of invested capital. Neglected maintenance initially has no safety related influence – the culmination of faults occurs with delay. But the same as with any site used over a long period of time a track infrastructure does also not forgive the neglect of maintenance. The lifespan of the infrastructure is rapidly reduced – the life cycle costs rise beyond proportion. If data concerning the conditional and material development is missing then this causal relation remains hidden.

Rhomberg Sersa Rail Group – Maintenance Management Service Seite 13/26
Besides the prescribed methods there is a new method of evaluation which provides the necessary transparency and traceability of maintenance decisions: The measurement of the reference wear margin9 of track infrastructure. Whilst the condition and the intensity of use of a site, of which the safety and the risk of increasing damages play a role, present the input for prioritised maintenance decisions, it is decisive to replace old and maintenance intensive sites in good time to ensure economical maintainability and the long-term conservation of rail infrastructure. With the aid of the wear margin reference (Kennziffer Abnutzungsvorrat KAV®)10 ) – as an overall characteristic of quality – can the success of maintenance and the qualitative development of the condition of the infrastructure be measured reproducibly and be presented plausibly. This holds for each individual object as well as for the complete rail site. Through the comparison of the wear margin over a longer period of time valuable insight concerning amount and use of the applied resources and the development of the infrastructure can be gained.
Figure 3 The key parameters of the infrastructure strategy and their most important relationships.
The objective of the infrastructure manager is to find the optimal balance between the three parameters 11.
9 As a practical measure of quality the technical wear margin presents itself according to DIN 31 051 as “the material reserves required for the functionality achievement under prescribed conditions, inherent in the observed entity based on construction, maintenance or improvement”. 10 Haaß, M.; Marx, A., Rolle, K.: ‘Kennziffer Abnutzungsvorrat’ (KAV®) – empirical method for the evaluation of condition and substance
evaluation of sites of the rail infrastructure. For the measurement of the wear margin of tracks and turnouts Schreck-Mieves has developed an empirical method, the so called Kennziffer Abnutzungsvorrat (KAV®). This evaluates the current qualitative condition of individual infrastructure objects in view of their remaining margin of wear in form of a code. Via the proportional lengths the individual results can be condensed into a single value for the complete infrastructure. In short – one single digit (KAV). 11 Putallaz,Y.; Rivier, R.: “Strategic maintenance and renewal policy of a railway corridor”, EPFL-LITEP Lausanne
(1) Capacity
(3) Quality
Condition
(2) Substance
expected life span
Investment/Disinvestment
Capacityenlargement/reduction
+/- Maintenance
(operational)+/- Renewal
+
-
+
+

Rhomberg Sersa Rail Group – Maintenance Management Service Seite 14/26
Figure 4 displays the typical development of the wear margin – without intervention – with the variable (KAV®)
Substance / Remaining wear margin of infrastructure
Reference wear margin (KAV®)
1,0
0,5
0,0
Operating time
Wear margin upon commission (100 %)
Wear margin
Rhomberg Sersa Rail Group – Maintenance Management Service Seite 15/26
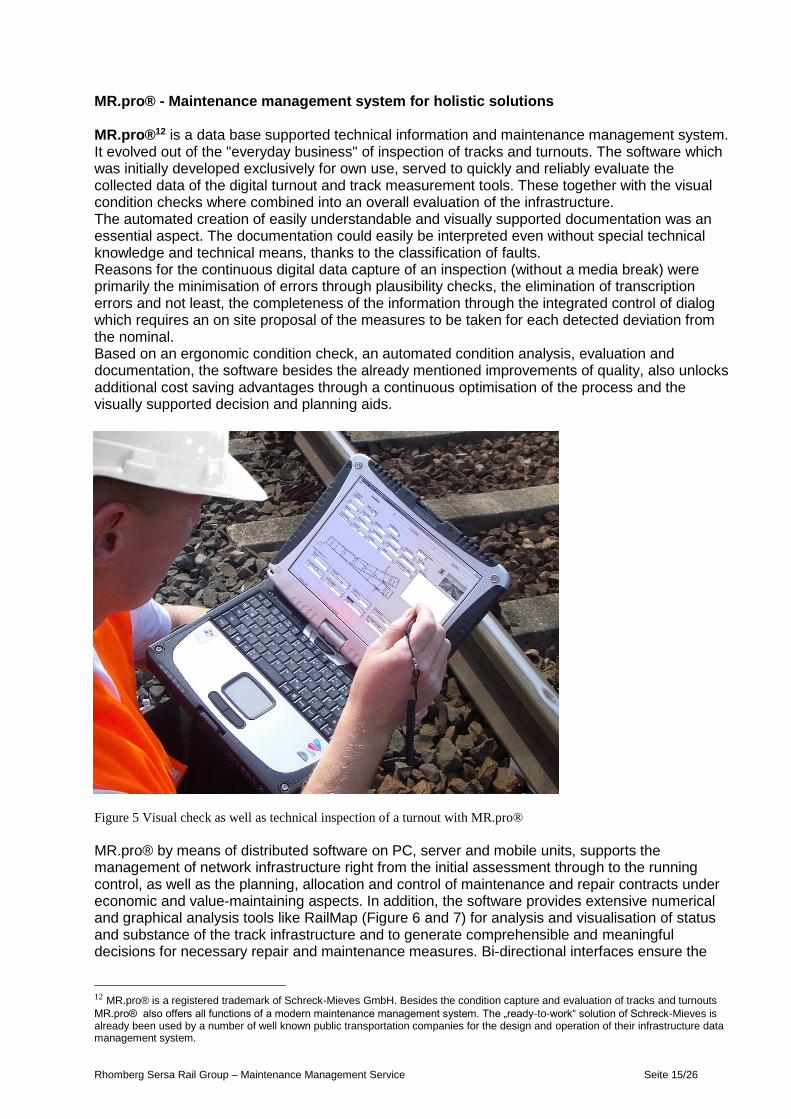
MR.pro® - Maintenance management system for holistic solutions MR.pro®12 is a data base supported technical information and maintenance management system. It evolved out of the "everyday business" of inspection of tracks and turnouts. The software which was initially developed exclusively for own use, served to quickly and reliably evaluate the collected data of the digital turnout and track measurement tools. These together with the visual condition checks where combined into an overall evaluation of the infrastructure. The automated creation of easily understandable and visually supported documentation was an essential aspect. The documentation could easily be interpreted even without special technical knowledge and technical means, thanks to the classification of faults. Reasons for the continuous digital data capture of an inspection (without a media break) were primarily the minimisation of errors through plausibility checks, the elimination of transcription errors and not least, the completeness of the information through the integrated control of dialog which requires an on site proposal of the measures to be taken for each detected deviation from the nominal. Based on an ergonomic condition check, an automated condition analysis, evaluation and documentation, the software besides the already mentioned improvements of quality, also unlocks additional cost saving advantages through a continuous optimisation of the process and the visually supported decision and planning aids.
Figure 5 Visual check as well as technical inspection of a turnout with MR.pro®
MR.pro® by means of distributed software on PC, server and mobile units, supports the management of network infrastructure right from the initial assessment through to the running control, as well as the planning, allocation and control of maintenance and repair contracts under economic and value-maintaining aspects. In addition, the software provides extensive numerical and graphical analysis tools like RailMap (Figure 6 and 7) for analysis and visualisation of status and substance of the track infrastructure and to generate comprehensible and meaningful decisions for necessary repair and maintenance measures. Bi-directional interfaces ensure the
12 MR.pro® is a registered trademark of Schreck-Mieves GmbH. Besides the condition capture and evaluation of tracks and turnouts
MR.pro® also offers all functions of a modern maintenance management system. The „ready-to-work“ solution of Schreck-Mieves is already been used by a number of well known public transportation companies for the design and operation of their infrastructure data management system.

Rhomberg Sersa Rail Group – Maintenance Management Service Seite 16/26
connect ability to business management maintenance and planning systems - ERP systems such as SAP/PM13. The two labour systems can be supplemented by geographic information systems (GIS) as a global information platform and basis for planning. The MR.pro® functionality amongst other covers the following:
RailMap, an interactive schematic plan for the representation of all, or part of a network with bi-directional database connectivity,
GoogleMaps™ 14- has been integrated as an orientation and positioning tool,
warranty and lifespan management,
measurement of the wear margin (Kennziffer Abnutzungsvorrat KAV),
Maintenance and inspection management,
Fault management,
maintenance calendar for the overview of schedules,
Order management with interface to SAP / PM,
Specifications module (GEAB format) MR.pro® is also available in a reduced „passive“ version, without the „active“ module for condition capture and evaluation. MR.pro®LT has been developed for transportation companies who assign the inspections to service partners.
Further information: www.mr-pro.de
Figure 6 RailMap supports the presentation of dynamically generated track segments (dynamic segmentation) and can
thus present complex properties very realistically. Besides the construction forms which change over time, this applies
to all condition data of the track. This example illustrates an industrial railway siding dissolved according to the
superstructure types of tracks and turnouts.
13 SAP ERP is the main product of the German Software-company SAP AG. SAP/PM (Plant Maintenance) is a module for maintenance. SAP, SAP/PM and the SAP Logo are registered trademarks of SAP AG in Germany. 14 Google Maps™ and Google™ are registered trademarks of Google Inc.

Rhomberg Sersa Rail Group – Maintenance Management Service Seite 17/26
The establishment of an infrastructure data management system is a complex task that requires a structured and strict results-oriented approach. Detail and structure of the data should be based on IDMVU standards and should be adapted to the requirements of the users, as the maintenance effort associated with each data base field can be quite substantial. To create a reliable data base, consistent and up-to-date inventory information of the network infrastructure is a basic prerequisite. Due to the heterogeneous and changing construction types within the track network this is an important and necessary task. If the inventory of an infrastructure takes a longer period of time the validity of the objects inspected first, might already be questionable. It is therefore recommended to execute a concentrated data capture of the complete railway network or sub-sections thereof. The data base "track" should in terms of the order of data capture always form the beginning. Some railway network operators manage the transition into the digital infrastructure data management (IDM) at first go, because they use a combination of service as well as software and hardware – in other words a "ready to work" solution. Schreck-Mieves calls this combination solution „Simplify Database for tracks“ which in the shortest possible time provides a reliable data overview of the inventory and condition information. First of all the meaningful information required for maintenance planning and control is pre-configured in co-operation with the operator. These are details of assessment and classification procedures which have already been determined in advance, interfaces and processing of state information in planning and/or Geographical Information Systems (GIS). In the further implementation the specialists of Schreck-Mieves – generally in co-operation with the professional staff of the transportation company - create a complete data base of the tracks and turnouts while conducting the inventory. MR.pro® is installed, tailor made for the customer with all inventory and condition data. The inspection equipment is handed over to the operator after intensive training, and finally the „flying start“ is professionally supported and supervised.
Figure 7 The integrated RailMap of MR.pro® besides offering a good overview of condition, also offers direct access
to inventory and condition data as well as all associated documents - even for large networks. Shown is the track related
fault distribution (error class) within the activated track section 16.6. (Source: IFTEC, Network of the Leipzig
transportation company)
Rhomberg Sersa Rail Group – Maintenance Management Service Seite 18/26
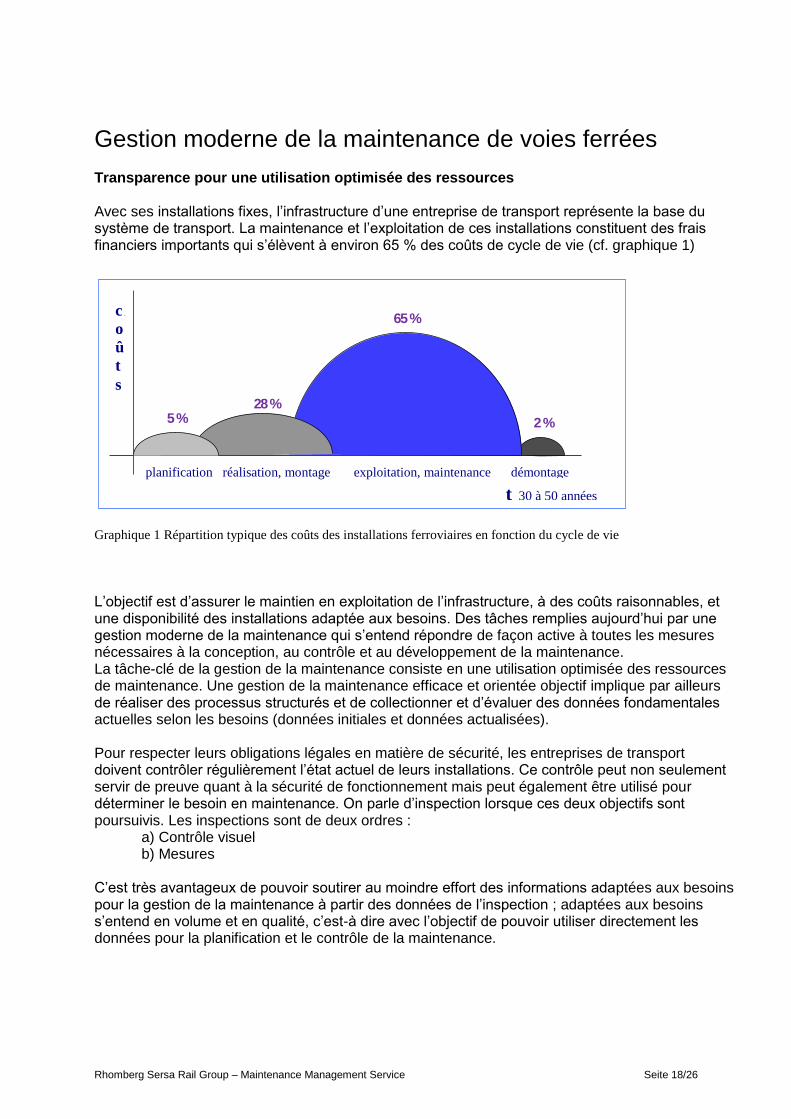
Gestion moderne de la maintenance de voies ferrées Transparence pour une utilisation optimisée des ressources Avec ses installations fixes, l’infrastructure d’une entreprise de transport représente la base du système de transport. La maintenance et l’exploitation de ces installations constituent des frais financiers importants qui s’élèvent à environ 65 % des coûts de cycle de vie (cf. graphique 1)
Graphique 1 Répartition typique des coûts des installations ferroviaires en fonction du cycle de vie
L’objectif est d’assurer le maintien en exploitation de l’infrastructure, à des coûts raisonnables, et une disponibilité des installations adaptée aux besoins. Des tâches remplies aujourd’hui par une gestion moderne de la maintenance qui s’entend répondre de façon active à toutes les mesures nécessaires à la conception, au contrôle et au développement de la maintenance. La tâche-clé de la gestion de la maintenance consiste en une utilisation optimisée des ressources de maintenance. Une gestion de la maintenance efficace et orientée objectif implique par ailleurs de réaliser des processus structurés et de collectionner et d’évaluer des données fondamentales actuelles selon les besoins (données initiales et données actualisées). Pour respecter leurs obligations légales en matière de sécurité, les entreprises de transport doivent contrôler régulièrement l’état actuel de leurs installations. Ce contrôle peut non seulement servir de preuve quant à la sécurité de fonctionnement mais peut également être utilisé pour déterminer le besoin en maintenance. On parle d’inspection lorsque ces deux objectifs sont poursuivis. Les inspections sont de deux ordres : a) Contrôle visuel b) Mesures C’est très avantageux de pouvoir soutirer au moindre effort des informations adaptées aux besoins pour la gestion de la maintenance à partir des données de l’inspection ; adaptées aux besoins s’entend en volume et en qualité, c’est-à dire avec l’objectif de pouvoir utiliser directement les données pour la planification et le contrôle de la maintenance.
t 30-50 Jahre
K
o
s
t
e
n
Planung Realisierung, Bau Betrieb, Instandhaltung Rückbau
2 %
65 %
28 %5 %
c
o
û
t
s
planification réalisation, montage exploitation, maintenance démontage
t 30 à 50 années

Rhomberg Sersa Rail Group – Maintenance Management Service Seite 19/26
Evaluer les données Depuis l’introduction de systèmes numériques de mesure, il est nettement plus facile d’acquérir des données de qualité grâce à une technique améliorée, des diagnostics de voie et des méthodes modernes d’inspection. Le besoin en information s’accroît – en même temps, les volumes de données disponibles atteignent des proportions effrayantes. Avec le nombre de paramètres de mesure, l’exactitude des appareils et des intervalles de mesure qui se réduisent en permanence, nous sommes en présence d’un nouveau problème à juste titre communément appelé « inondation de données ». Pour tirer facilement les informations nécessaires à la gestion de la maintenance à partir des volumes de données disponibles, il est recommandé de les réduire à l’essentiel et de les adapter en une forme structurée et transportable qui permette de les relier ou de les intégrer aux bases de données des systèmes de gestion de maintenance. Pour cela, il faut se servir en premier lieu des procédés de classification et de compression des données (cf. graphique 2) et du modèle de données de l’IDMVU1 avec le standard d’interface VDV 456. Une différenciation de l’infrastructure en fonction de la charge d’exploitation, un diagnostic d’erreurs standardisé relié à des mesures adéquates soulagent les décisions de maintenance et les rendent compréhensibles et transparentes. Elles apportent un gain de sécurité lors de la planification et du contrôle de la maintenance.
Graphique 2 Déroulement schématique de l’usure avec les limites d’évaluation: Tolérances (pour classifier les résultats
de mesure) et niveau d’erreurs (pour classifier les résultats des contrôles visuels)
1 Le projet de recherche BMVBS Infrastructure-Données-Management (IDMVU) forme les structures de données nécessaires pour les
solutions de maintenance sous forme de modèle de données conceptuel et un standard interface pour des échanges de données initiales et actualisées de toute l’infrastructure. Cela a été publié en VDV guide 456 en Allemagne www.idmvu.org
Panne
Mise en exploitation
Limite d’action immédiate (FRG) Niveau d’erreurs 1
Limite d’intervention (FRlim) Niveau d’erreurs 2
Limite d’alerte (FR100) Niveau d’erreurs 3
Usure
Limite d’acceptation (FRA) Niveau d’erreurs 4
d
c
b
a
Période d’exploitation
FR = Fault – Reaction selon TSI & DIN EN 13848-5
Rhomberg Sersa Rail Group – Maintenance Management Service Seite 20/26
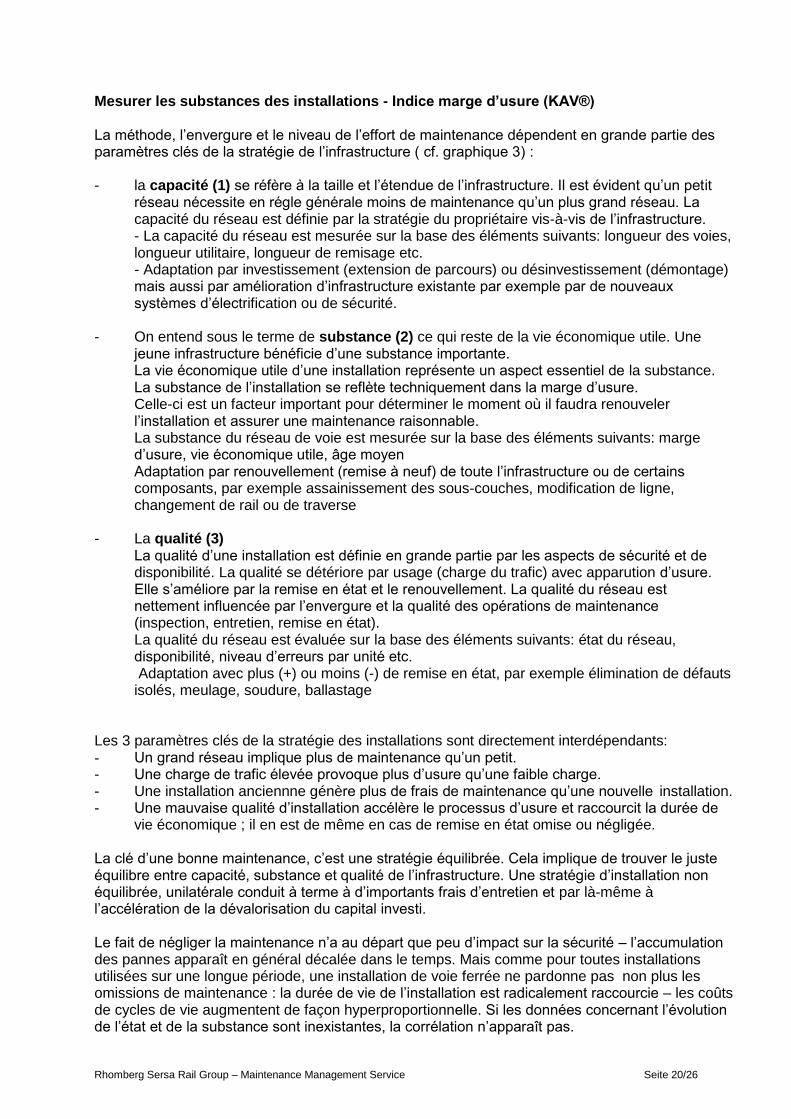
Mesurer les substances des installations - Indice marge d’usure (KAV®) La méthode, l’envergure et le niveau de l’effort de maintenance dépendent en grande partie des paramètres clés de la stratégie de l’infrastructure ( cf. graphique 3) : - la capacité (1) se réfère à la taille et l’étendue de l’infrastructure. Il est évident qu’un petit
réseau nécessite en régle générale moins de maintenance qu’un plus grand réseau. La capacité du réseau est définie par la stratégie du propriétaire vis-à-vis de l’infrastructure.
- La capacité du réseau est mesurée sur la base des éléments suivants: longueur des voies, longueur utilitaire, longueur de remisage etc. - Adaptation par investissement (extension de parcours) ou désinvestissement (démontage)
mais aussi par amélioration d’infrastructure existante par exemple par de nouveaux systèmes d’électrification ou de sécurité.
- On entend sous le terme de substance (2) ce qui reste de la vie économique utile. Une
jeune infrastructure bénéficie d’une substance importante. La vie économique utile d’une installation représente un aspect essentiel de la substance. La substance de l’installation se reflète techniquement dans la marge d’usure. Celle-ci est un facteur important pour déterminer le moment où il faudra renouveler
l’installation et assurer une maintenance raisonnable. La substance du réseau de voie est mesurée sur la base des éléments suivants: marge d’usure, vie économique utile, âge moyen Adaptation par renouvellement (remise à neuf) de toute l’infrastructure ou de certains
composants, par exemple assainissement des sous-couches, modification de ligne, changement de rail ou de traverse
- La qualité (3) La qualité d’une installation est définie en grande partie par les aspects de sécurité et de disponibilité. La qualité se détériore par usage (charge du trafic) avec apparution d’usure.
Elle s’améliore par la remise en état et le renouvellement. La qualité du réseau est nettement influencée par l’envergure et la qualité des opérations de maintenance (inspection, entretien, remise en état).
La qualité du réseau est évaluée sur la base des éléments suivants: état du réseau, disponibilité, niveau d’erreurs par unité etc.
Adaptation avec plus (+) ou moins (-) de remise en état, par exemple élimination de défauts isolés, meulage, soudure, ballastage
Les 3 paramètres clés de la stratégie des installations sont directement interdépendants: - Un grand réseau implique plus de maintenance qu’un petit. - Une charge de trafic élevée provoque plus d’usure qu’une faible charge. - Une installation anciennne génère plus de frais de maintenance qu’une nouvelle installation. - Une mauvaise qualité d’installation accélère le processus d’usure et raccourcit la durée de
vie économique ; il en est de même en cas de remise en état omise ou négligée. La clé d’une bonne maintenance, c’est une stratégie équilibrée. Cela implique de trouver le juste équilibre entre capacité, substance et qualité de l’infrastructure. Une stratégie d’installation non équilibrée, unilatérale conduit à terme à d’importants frais d’entretien et par là-même à l’accélération de la dévalorisation du capital investi. Le fait de négliger la maintenance n’a au départ que peu d’impact sur la sécurité – l’accumulation des pannes apparaît en général décalée dans le temps. Mais comme pour toutes installations utilisées sur une longue période, une installation de voie ferrée ne pardonne pas non plus les omissions de maintenance : la durée de vie de l’installation est radicalement raccourcie – les coûts de cycles de vie augmentent de façon hyperproportionnelle. Si les données concernant l’évolution de l’état et de la substance sont inexistantes, la corrélation n’apparaît pas.
Rhomberg Sersa Rail Group – Maintenance Management Service Seite 21/26
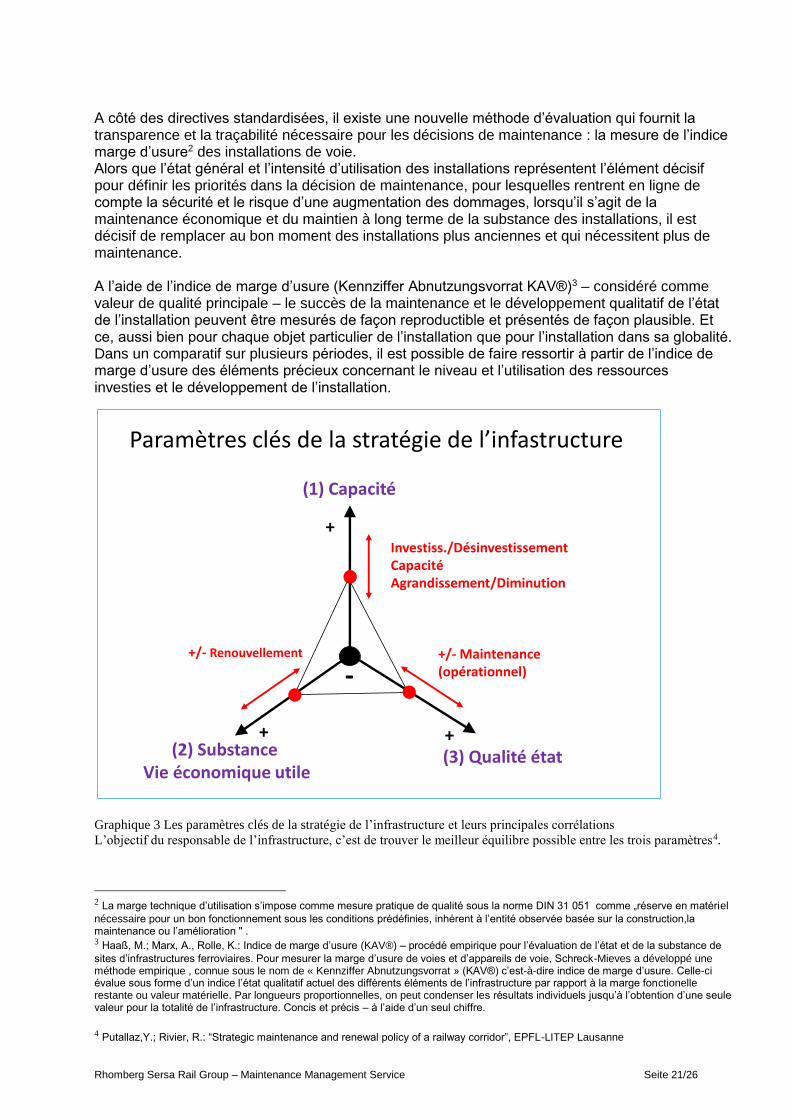
A côté des directives standardisées, il existe une nouvelle méthode d’évaluation qui fournit la transparence et la traçabilité nécessaire pour les décisions de maintenance : la mesure de l’indice marge d’usure2 des installations de voie. Alors que l’état général et l’intensité d’utilisation des installations représentent l’élément décisif pour définir les priorités dans la décision de maintenance, pour lesquelles rentrent en ligne de compte la sécurité et le risque d’une augmentation des dommages, lorsqu’il s’agit de la maintenance économique et du maintien à long terme de la substance des installations, il est décisif de remplacer au bon moment des installations plus anciennes et qui nécessitent plus de maintenance. A l’aide de l’indice de marge d’usure (Kennziffer Abnutzungsvorrat KAV®)3 – considéré comme valeur de qualité principale – le succès de la maintenance et le développement qualitatif de l’état de l’installation peuvent être mesurés de façon reproductible et présentés de façon plausible. Et ce, aussi bien pour chaque objet particulier de l’installation que pour l’installation dans sa globalité. Dans un comparatif sur plusieurs périodes, il est possible de faire ressortir à partir de l’indice de marge d’usure des éléments précieux concernant le niveau et l’utilisation des ressources investies et le développement de l’installation.
Graphique 3 Les paramètres clés de la stratégie de l’infrastructure et leurs principales corrélations
L’objectif du responsable de l’infrastructure, c’est de trouver le meilleur équilibre possible entre les trois paramètres4.
2 La marge technique d’utilisation s’impose comme mesure pratique de qualité sous la norme DIN 31 051 comme „réserve en matériel
nécessaire pour un bon fonctionnement sous les conditions prédéfinies, inhérent à l’entité observée basée sur la construction,la maintenance ou l’amélioration " . 3 Haaß, M.; Marx, A., Rolle, K.: Indice de marge d’usure (KAV®) – procédé empirique pour l’évaluation de l’état et de la substance de
sites d’infrastructures ferroviaires. Pour mesurer la marge d’usure de voies et d’appareils de voie, Schreck-Mieves a développé une méthode empirique , connue sous le nom de « Kennziffer Abnutzungsvorrat » (KAV®) c’est-à-dire indice de marge d’usure. Celle-ci évalue sous forme d’un indice l’état qualitatif actuel des différents éléments de l’infrastructure par rapport à la marge fonctionelle restante ou valeur matérielle. Par longueurs proportionnelles, on peut condenser les résultats individuels jusqu’à l’obtention d’une seule valeur pour la totalité de l’infrastructure. Concis et précis – à l’aide d’un seul chiffre. 4 Putallaz,Y.; Rivier, R.: “Strategic maintenance and renewal policy of a railway corridor”, EPFL-LITEP Lausanne
Paramètres clés de la stratégie de l’infastructure
(1) Capacité
(3) Qualité état (2) SubstanceVie économique utile
Investiss./DésinvestissementCapacitéAgrandissement/Diminution
+/- Maintenance (opérationnel)
+/- Renouvellement
+
-
+
+

Rhomberg Sersa Rail Group – Maintenance Management Service Seite 22/26
Graphique 4 montre le processus de développement typique de la marge d’usure – sans intervention – avec la variable
(KAV®)
L‘indice marge d‘usure (KAV) est déterminé lors d‘inspections systèmatiques et reflète l‘évolution à court et moyen terme de la qualité du site.
Valeur de substance ou marge d‘usure restante de la structureIndice KAV marge d‘usure (1,0 bis 0,0)Etat neuf ./. Usure = marge d‘usure restante
Le graphique représente sur l‘axe des ordonnées (y) la marge d‘usure et sur l‘axe des abscisses (x) la durée d‘exploitation du site.
Indice marge d‘usure (KAV)
1,0
0,5
0,0Durée d‘exploitation t
Marge d‘usure lors de la mise en service

Rhomberg Sersa Rail Group – Maintenance Management Service Seite 23/26
MR.pro® - Système de gestion de maintenance pour des solutions globales
MR.pro®5 est un système technique de gestion d’informations et de maintenance équipé de bases de données. Issu à partir du „journal de bord“ de l’inspection de voies et d’appareils de voie. Le logiciel, développé tout d’abord exclusivement à but interne, servait à évaluer de façon rapide et fiable les données collectionnées par les appareils numériques de mesure au niveau des voies et des appareils de voie et à pouvoir les relier avec les résultats de contrôle visuel afin d’obtenir une évaluation globale de l’infrastructure. L’un des aspects essentiels était de pouvoir élaborer automatiquement des documents facilement compréhensibles, commentés par des graphiques qui soient interprétables grâce à la classification des défauts même sans aide et sans connaissances techniques spécifiques. Plusieurs raisons ont motivé l’enregistrement de l’état en continu sur des terminaux numériques (sans rupture médiatique) : en premier lieu, la minimisation des erreurs grâce à des tests de plausibilité, la disparition d’erreurs de transmission et à ne pas négliger l’intégralité des informations grâce au contrôle intégré par dialogue, qui exige une proposition de mesures adaptées sur place pour tout écart constaté par rapport à l’objectif. Reposant sur un enregistrement ergonomique et sur l’analyse automatisée de l’état actuel, évaluation et documentation, le programme, en plus des améliorations de qualité déjà citées, tire profit d’avantages financiers grâce à une optimisation continue du procédé et à des graphiques qui aident à prendre des décisions et à planifier.
Graphique 5: Conrôle visuel et inspection technique d’une voie avec MR.pro®
Grâce à des logiciels répartis sur des PCs, des serveurs et des portables, MR.pro® soutient la gestion de l’infrastructure en réseau depuis l’enregistrement de la première donnée au planning, attribution et réalisation des contrats de remise en état et de maintenance en passant par les
5 MR.pro® est une marque déposée de la Sàrl Schreck-Mieves. En plus de l’enregistrement de l’état actuel et de l’évaluation des voies
et appareils de voie, MR.pro® propose toutes les fonctions d’un système moderne de gestion de maintenance. Entre-temps, de nombreuses entreprises renommées de transport utilisent les solutions „ ready-to-work“ de Schreck-Mieves pour mettre en place et exploiter la gestion des données de leurs infrastructures.

Rhomberg Sersa Rail Group – Maintenance Management Service Seite 24/26
contrôles courants sous des aspects économiques et dans le souci de maintenir la valeur de l’infrastructure. Le programme propose à cet effet un nombre important d’outils d’analyse numériques et graphiques, tel que le RailMap ( schémsa 6 et 7) pour l’évaluation et la visualisation de l’état actuel et de la substance de l’infrastructure de voie ainsi que la génération de décisions compréhensibles de mesures de maintenance et d’entretien nécessaires et raisonnables. Des interfaces bidirectionnels assurent le lien avec les systèmes de gestion et de planning de la maintenance économique – systèmes ERP comme par ex. SAP/PM6. Les deux systèmes de travail peuvent se compléter grâce à un système d’information géographique (GIS) pour donner une plate-forme d’informations globale et une base de planification.
L’envergure fonctionnelle de MR.pro® englobe entre autre :
- RailMap, un plan de voie schématique interactif pour représentation de réseaux globaux ou
partiels avec connection bidirectionelle aux bases de données, - GoogleMaps™7 - Intégré comme outil d’orientation et de positionnement, - Gestion garantie et vie économique utile, - Détermination de la marge d’usure (Indice Kennziffer Abnutzungsvorrat KAV®), - Gestion maintenance et inspection, - Gestion pannes, - Calendrier de maintenance comme agenda récapitulatif - Gestion des contrats avec interface vers SAP/PM, - Module Cahier des charges (Format GEAB)
MR.pro® est également disponible en version économique „passive“, sans le module „actif“ de saisie et d’évaluation de l’état. MR.pro®LT est conçu pour les entreprises de transport qui confient leurs inspections à des sociétés de service partenaires.
Informations complémentaires: www.mr-pro.de
Graphique 6: RailMap maîtrise la représentation de segments de voie dynamiquement générés (segmentation
dynamique) et peut ainsi représenter de facon réaliste des propriétés complexes. A côté des formes de construction qui
changent au cours du temps, ceci s’applique à toutes les informations concernant l’état de la voie. L’exemple montre la
zone de poste d’aiguillage d’un branchement de voies industriel ordonné par superstructure de voies et d’appareils de
voie.
6 SAP ERP est le produit principal de l’entreprise allemande de logiciels SAP AG. SAP/PM est un module pour la maintenance (angl.
Plant Maintenance). SAP, SAP/PM et le Logo SAP sont des marques déposées de la SA SAP en Allemagne. 7 Google Maps™ et Google™ sont des marques ou des marques déposées de Google, Inc.
Rhomberg Sersa Rail Group – Maintenance Management Service Seite 25/26
La mise en place d’une gestion des données d’une infrastructure est une tâche complexe qui exige une démarche structurée et rigoureuse axée sur les résultats. Le niveau de détails et la structure des données doivent s’orienter au standard IDMVU et doivent être adaptés aux besoins car l’effort de maintenance à fournir pour chaque nouveau champ de base de données peut être considérable.
Pour mettre en place une base fiable de données, il faut impérativement des informations actuelles et complètes concernant l’état actuel de l’infrastructure du réseau. C’est une tâche d’autant plus importante que les formes de construction sont hétérogènes et changeantes au sein d’un réseau de voies. Si l’inventaire du réseau doit se réaliser sur une longue période, on doit déjà remettre en question l’actualité des objets enregistrés en premier. C’est pourquoi il est conseillé de faire le plus vite possible un inventaire complet de tout le réseau ou bien de sous-réseaux, en partant des données concernant la voie. Certaines entreprises de transport parviennent à démarrer du premier coup leur gestion numérique des données d’infrastructure parce qu’ils choisissent une solution pour ainsi dire « ready to work » avec prestation de service et livraison de matériel et de logiciel. Schreck-Mieves appelle cette solution combinée « Simplify banque de données pour voies ferrées ». Elle permet de mettre en place en peu de temps une base fiable de données concernant les installations existantes et leur état. Il faut tout d’abord préconfigurer avec l’exploitant du réseau le besoin d’informations judicieux dans le cadre de la planification et du contrôle de la maintenance. Quelques éléments sont éventuellement connus d’avance, comme les détails concernant les procédures prévues d’évaluation et de classification, les interfaces et la transformation ultérieure des informations concernant l’état actuel par intégration dans les systèmes GIS d’information géographique et de planification. Dans l’étape suivante, les spécialistes de Schreck-Mieves établissent – la plupart du temps en collaboration avec le personnel qualifié de l’entreprise de transport - une base de données complète à partir du relevé d’inventaire des voies et des appareils de voie. MR.pro® est installé dans une version adaptée au client avec toutes les données concernant les installations existantes et leur état, l’équipement d’inspection est confié à l’exploitant après avoir assuré une formation intensive et « l’envol » est soutenu et encadré professionnellement.
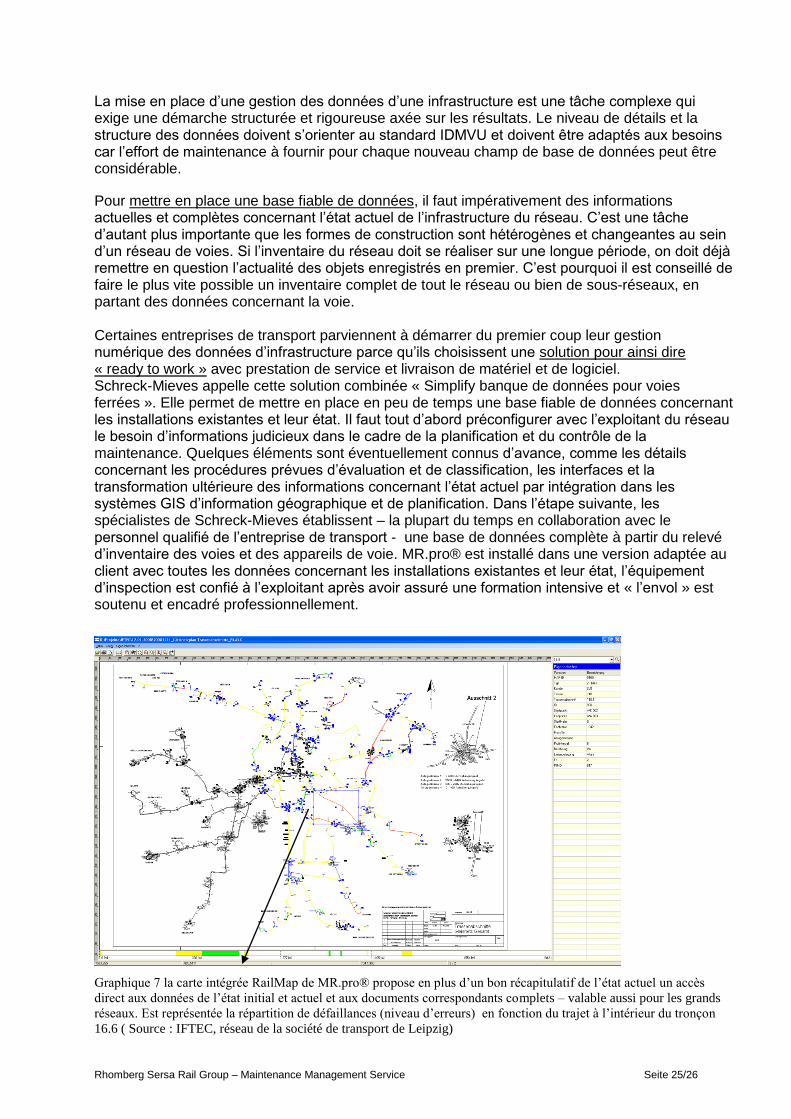
Graphique 7 la carte intégrée RailMap de MR.pro® propose en plus d’un bon récapitulatif de l’état actuel un accès
direct aux données de l’état initial et actuel et aux documents correspondants complets – valable aussi pour les grands
réseaux. Est représentée la répartition de défaillances (niveau d’erreurs) en fonction du trajet à l’intérieur du tronçon
16.6 ( Source : IFTEC, réseau de la société de transport de Leipzig)

Rhomberg Sersa Rail Group – Maintenance Management Service Seite 26/26
Author:
Andreas Marx 51 Jahre, Studium der Betriebs- und Volkswirtschaft (Trier und Hagen) Tätigkeit in verschiedenen Industriebranchen mit Schwerpunkt Materialwirtschaft und Instandhaltung, seit 1994 bei Schreck-Mieves GmbH für den Geschäftsbereich Services verantwortlich. Schreck-Mieves gehört heute zur Rhomberg Sersa Rail Group in Deutschland, einem international agierenden Anbieter von Bahninfrastrukturleistungen. RSRG entwickelt Konzepte und praxisnahe Software für Anlagenmanager zur Gesamtoptimierung der Instandhaltung von Rad und Schiene, z.B. Erfassungs- und Diagnosesysteme, Bewertungsverfahren zur Messung von Anlagenqualität, spurführungstechnische Untersuchungen sowie die Qualifizierung von Fach- und Führungskräften des schienengebundenen Güter-, Nah- und Fernverkehrs.
51 years of age, Studies in business management and economics (Trier and Hagen) Involvement in various industrial branches with the focus on asset management and maintenance. Since 1994 he has been responsible for the operational group ’Services’ within Schreck-Mieves GmbH. Today, Schreck- Mieves is part of Rhomberg Sersa Rail Group Germany, an internationally operating provider of railway infrastructure services. RSRG develops concepts and practical software for infrastructure managers for the optimisation of the maintenance of wheel and track, e.g. recording and diagnostic systems, evaluation concepts for the measurement of infrastructure quality, technical research in track guidance as well as the qualification of technical- and management staff in rail related goods- urban- and long distance traffic. 51 ans, Etudes de sciences micro- et macro-économiques (Trèves et Hagen) Activité dans différentes branches industrielles avec un profil gestion des matériaux et maintenance, depuis 1994 chez Schreck-Mieves Sàrl responsable du département Services. Aujourd'hui Schreck-Mieves fait partie de Rhomberg Sersa Rail Group en Allemagne, un fournisseur mondial
de services d'infrastructure ferroviaire. RSRG développe des concepts et des logiciels pratiques pour les directeurs d’usine pour une optimisation globale de la maintenance roue-rail, par ex. par des systèmes de saisie et de diagnostics, des procédures d’évaluation pour mesurer la qualité du site, des études de technique de guidage ainsi que la qualification de personnel spécialisé et responsable dans le domaine des transports sur rails de biens et de personnes pour les trafics à longue ou courte distance. Contact: RS Gleisbau GmbH Head of Services In den Kreuzfeldern 2 D-54340 Longuich / Trier Germany - Allemagne Fon +49 (6502) 9941-63 Fax +49 (6502) 9941-68 Mobile +49 (160) 5829-558 Mail [email protected] Web www.sersa.de [English by Manfred Schommarz, Longuich] [Français par Sonia Fiedler, Communication Trier]