New players in neuropathic pain? microRNA expression in ...
92
Aus der Klinik und Poliklinik für Anästhesiologie der Universität Würzburg Direktor: Prof. Dr. med. Dr. h.c. N. Roewer New players in neuropathic pain? microRNA expression in dorsal root ganglia and differential transcriptional profiling in primary sensory neurons Inaugural-Dissertation zur Erlangung der Doktorwürde der Medizinischen Fakultät der Julius-Maximilians-Universität Würzburg vorgelegt von Ann-Kristin Reinhold aus Münster Würzburg, Juni 2016
Transcript of New players in neuropathic pain? microRNA expression in ...
Aus der Klinik und Poliklinik für Anästhesiologie
der Universität Würzburg
Direktor: Prof. Dr. med. Dr. h.c. N. Roewer
New players in neuropathic pain? microRNA expression in dorsal root
ganglia and differential transcriptional profiling in primary sensory
neurons
Inaugural-Dissertation
zur Erlangung der Doktorwürde der
Medizinischen Fakultät
der
Julius-Maximilians-Universität Würzburg
vorgelegt von
Ann-Kristin Reinhold
aus Münster
Würzburg, Juni 2016

Referentin: Prof. Dr. med. Heike Rittner
Koreferentin: Prof. Dr. med. Claudia Sommer
Dekan: Prof. Dr. Matthias Frosch
Tag der mündlichen Prüfung: 28.06.2016
Die Promovendin ist Ärztin

Meinen Eltern gewidmet
Table of contents
1 Introduction 1
1.1 Pain and Nociception 1
1.2 Neuropathic Pain 3
1.2.1 Aetiologies & Symptoms
1.2.2 Molecular Mechanisms
1.2.2.1 Ion Channels
1.2.2.2 Immune and Glial Modulations
1.2.2.3 Central Mechanisms
1.2.3 Animal Models of Neuropathic Pain
1.2.4 Epidemiology and Treatments
1.3 MicroRNAs 8
1.3.1 Biogenesis
1.3.2 Working Principles
1.3.3 miRNA Target Prediction
1.3.4 miRNAs in Medicine
1.4 MicroRNAs in Pain 11
1.5 Neuronal Tracing 12
2 Objectives 14
3 Methods 15
3.1 Animals 15
3.2 Tissue 15
3.2.1 Surgery
3.2.2 Neuronal Staining
3.2.3 Tissue Collection
3.2.4 RNA Extraction
3.3 Assessment of Surgical Effect 17
3.4 MicroRNA Assay 18
3.5 qRT-PCR 19
3.6 Histology 20
3.6.1 In situ Hybridization
3.6.2 Immunohistochemistry
3.7 Neuron-Specific RNA Analysis 22
3.7.1 Cell Isolation and FACS
3.7.2 RNA Extraction and Analysis
3.8 Bioinformatics 23
3.8.1 SylArray
3.8.2 MirAct
3.8.3 myMIR
3.9 Data Processing 24
3.9.1 Data Calculation
3.9.2 Data Analysis
4 Results 26
4.1 CCI Produces a Neuropathy-Specific Response 26
4.2 MicroRNAs are Regulated in CCI 27
4.2.1 Increase in microRNA Regulation over Time
4.2.2 Predominently Downregulation of microRNAs
4.3 Validation of Regulation Patterns for Selected microRNAs 29
4.3.1 miR-183
4.3.2 miR-137
4.3.3 miR-124
4.3.4 miR-505
4.3.5 miR-27b
4.4 In Silico Target Prediction for Selected microRNAs 32
4.4.1 miR-183
4.4.2 miR-137
4.5 Localization of miR-183 and -137 in DRG 34
4.6 Neuronal Tracing Allows Distinction between Damaged And Intact
Neurons 36
4.7 Distinct mRNA Expression Patterns in Damaged vs Intact DRG
Neurons after CCI 38
4.7.1 Class Comparison of mRNA Regulation
4.7.2 Differentially Regulated Genes after CCI
4.7.2.1 Damaged vs. Contralateral DRG Neurons
4.7.2.2 Damaged vs. Adjacent Spared DRG Neurons
4.7.2.3 Regulated Ion Channels
4.7.2.4 Regulated Peptides
4.7.2.5 Regulation of microRNA Top Targets
4.8 In Silico Deduction of microRNA Involvement after CCI 45
4.8.1 SylArray Analysis
4.8.2 MirAct Analysis
5 Discussion 52
5.1 MicroRNAs in Neuropathic Pain 52
5.1.1 Time Course of microRNA Expression in DRG after CCI
5.1.2 MicroRNA Profiling in Contralateral DRG
5.2 MiRNAs Potentially Involved In Neuropathic Pain 52
5.2.1 miR-183 in Various States of Pain
5.2.2 miR-137 in Sensory Neurons and its Role in Pain
5.2.3 miR-124 in Pain – Neuronal or Immune Origin?
5.2.4 miR-505 and miR-27b
5.2.5 Further microRNAs Described in Neuropathic Pain
5.3 Divergent Results in microRNA Profiling 57
5.4 Neuron-Specific Approach 58
5.4.1 Advantages of Cell Type- and Damage-Specific Approach
5.4.2 mRNA Regulation in Damaged Neurons
5.4.2.1 Global Findings
5.4.2.2 Regulation of Genes Described in Neuropathic Pain
5.4.2.3 Novel Regulated Genes
5.4.3 Bioinformatical Inference on Potential microRNA Contribution
5.5 Outlook 65
5.5.1 Validation of miR-183 and -137 in Neuropathic Pain
5.5.2 Further Characterisation of Specific Genes in Neuropathic Pain
5.5.3 Cell Type-Specific Expression Analysis
6 Summary/Zusammenfassung 68
6.1 Summary 68

6.2 Zusammenfassung 70
7 Bibliography 72
8 List of Figures and Tables 78
9 Abbreviations 79
1
1 Introduction
1.1 Pain and Nociception
Pain is a concept commonly used to describe unpleasant states of the most diverse kind.
Accordingly, in 1979, the International Association for the Study of Pain (IASP) defined
pain very broadly as “… an unpleasant sensory and emotional experience associated
with actual or potential tissue damage, or described in terms of such damage” (cf.
Bonica, 1979). Besides the physiological transduction of stimuli, it thus requires
additional cognitive and emotional processing and is often even used as a concept void
of any immediate physical experience.
In contrast to the culturally and psychologically connoted concept of pain, the sheer
physiological processes are referred to as nociception. It primarily serves as a warning
device against potentially noxious stimuli, be they thermal (e.g., a hot plate or an ice
bucket), mechanical (a harsh squeeze), or chemical (hot chilli pepper).
In mammals, the detection of such stimuli is carried out by specific receptors, so-called
nociceptors, of the peripheral nervous system (PNS) which transform the stimulus into
an electric impulse (transduction). In contrast to encapsulated detectors of innocuous
tactile stimuli, nociceptors are bare nerve endings in cutaneous as well as visceral
tissue. The cell bodies of these pseudo-unipolar primary afferent neurons are located in
trigeminal (TG) or dorsal root ganglia (DRG) and innervate head and body,
respectively. Whereas TG are restricted to cranial nerve fibres, DRG are conglomerates
of several thousand1 sensory nerve bodies (somata), located in the dorsal root of the
spinal nerves and thus responsible for segmental body innervation. From the DRG, the
primary nociceptive neurons enter the spinal cord through the ipsilateral dorsal horn,
where they connect to the central nervous system (CNS) (transmission). Secondary
neurons cross to the contralateral side via the anterior commissure, and ascend in the
lateral spinothalamic tract to the lateral thalamic nuclei. From there, they project
towards the primary sensory cortex (perception), but also to subcortical structures like
the limbic system where signals are further processed. Descending pathways from the
cerebrum, in turn, regulate nociception (modulation) (Fig. 1, for details see Schaible &
Richter, 2004).
1 Lawson (1979) estimates 6,000 neurons in L3 DRG of adult mice; Shi et al. (2001) counted 12,000 in murine L5
DRG.
2
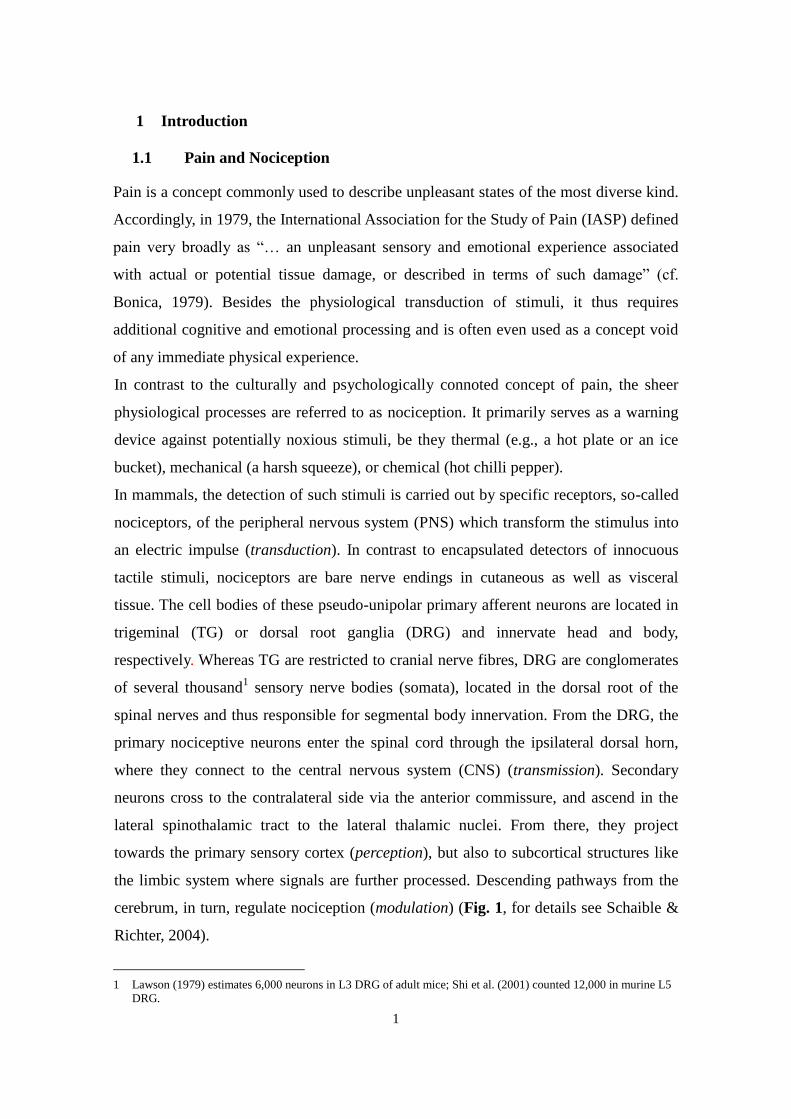
Nociceptors contain two classes of neural fibres that differ in the nociceptive character
elicited and in the velocity by which the stimulus is conducted. Aδ fibres are thinly
myelinated, have a diameter of 30-40 µm, and transport signals at a velocity of about 1-
10 m/s, whereas C fibres are unmyelinated, thinner (<30 µm) and, with a conduction
rate of <1 m/s, are considerably slower (Erlanger & Gasser, 1930; reviewed in
Whitwam, 1976). All these classes lack heavy neurofilaments like neurofilament 200
(NF200) which distinguishes them from big and medium-sized myelinated Aβ fibres.
C fibres can each be further classified by their molecular properties: One subset, so-
called “peptidergic” fibres, expresses pro-inflammatory peptides, such as substance P
and calcitonin gene-related peptide (CGRP). A second, “non-peptidergic” group does
not express such peptides but shows other properties, e.g., binding sites for lectin IB4.
Furthermore, these sets differ in affinity to neurotrophic factors, electrophysiological
properties, and spatial distribution (Boucher & McMahon, 2001; Stucky & Lewin,
1999; Caterina & Julius, 1997).
Figure 1: Principles of nociception
A: Principal nociceptive pathways. B: Topological anatomy of the peripheral sensory
nervous system (from Ferrante & VadeBoncoeur, 1993).
A B
3
1.2 Neuropathic Pain
In contrast to its function as a warning device, pain can also be evoked without the
presence of noxious stimuli,. As this pain experience is due to neuronal pathology, it is
referred to as “neuropathic pain”. According to the IASP, neuropathic pain is “arising as
direct consequence of a lesion or disease affecting the somatosensory system.” (Treede
et al., 2008). This broad definition reflects the diversity of underlying aetiologies and
locations as well as symptoms.
1.2.1 Aetiologies and Symptoms
Causes of neuropathic pain are very diverse: They include benign as well as
paraneoplastic syndromes; pain may be caused by chronic diseases as well as by
trauma; it can be located and evoked in the peripheral as well as in the central nervous
system. Moreover, one medical condition can cause several neuropathic mechanisms:
Diabetic neuropathy, for example, is caused by direct nerve damage due to free radicals
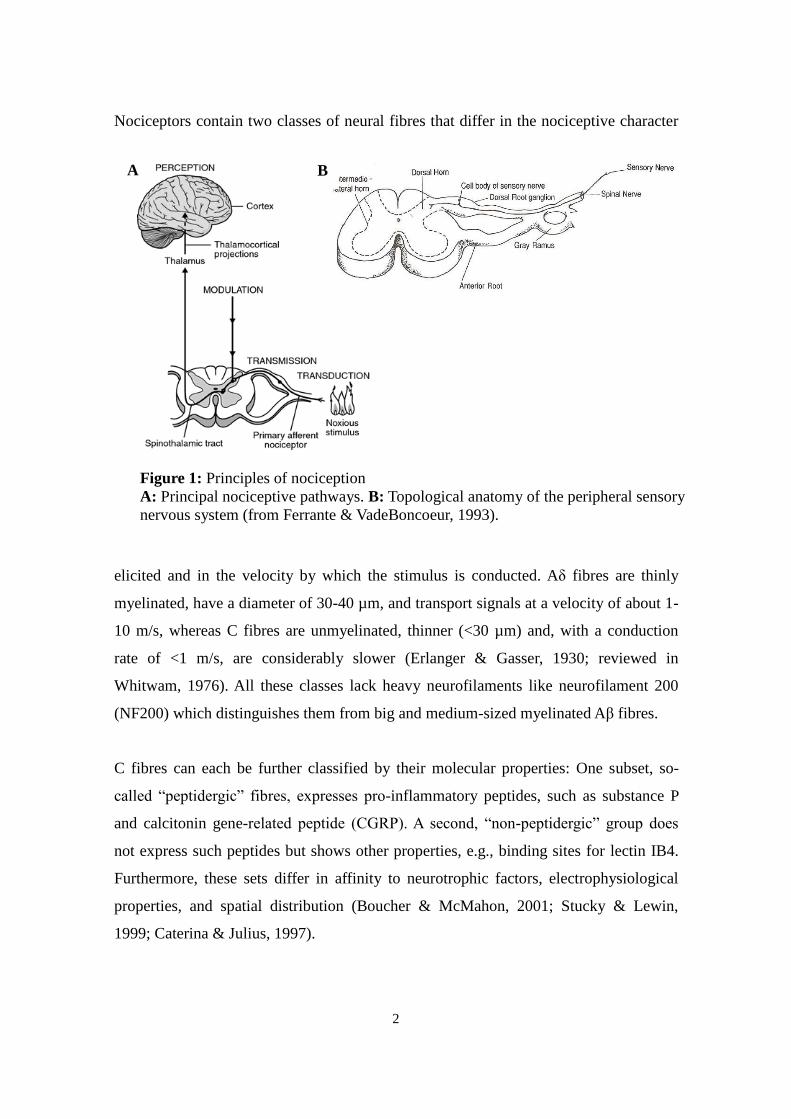
as well as secondary damage caused by angiopathy (cf. table 1 for examples).
Peripheral Nervous System Central Nervous System
Autoimmune polyarthritis nodosa multiple sclerosis
Infectious VZV, HIV, neuroborreliosis HIV, tuberculosis, syphilitic
myelitis
Metabolic/toxic
diabetes mellitus,
hypothyroidism, alcohol,
pharmacotherapy
myelosis funicularis
Vascular microangiopathy,
trigeminal neuralgia
brain infarction, arterio-
venous malformation
Congenital hereditary neuropathies
(Charcot-Marie-Tooth) syringomyelia, dysraphism
Mechanic/traumatic phantom limb syndrome,
entrapment syndromes
spinal cord injury, disc
herniation
Malignant plasmocytoma,
paraneoplastic syndrome
primary CNS tumours,
metastases
Moreover, neuropathic pain can manifest itself in different ways: Features include not
Table 1: Exemplary aetiologies of central and peripheral neuropathic pain
(cf. Baron, 2006).
4
only diverse, but also opposed, “positive” and “negative” symptoms: paraesthesia as
well as hypaesthesia, allodynia as well as hyperalgesia (Woolf & Mannion, 1999). The
pain may be described as “burning”, “itching”, or “numb”; it may be constant or
paroxysmal. It is for these incongruities in aetiologies and symptoms that diagnosis
often proves difficult and treatment outcome is moderate. An attempt to classify and
treat neuropathic pain based on symptoms rather than aetiologies (e.g. Baron, 2006;
Rolke et al., 2006) is still under debate.
1.2.2 Molecular Mechanisms
Given such diversity in aetiologies and manifestations, also cellular and molecular
mechanisms of neuropathic pain are complex and may vary considerably. However,
certain features have been identified that are central to initiation and maintenance of
neuropathic pain.
Relevant modifications occur at several locations: At the site of injury as well as in
primary sensory neuron somata, in damaged as well as in adjacent intact neurons, in the
CNS as well as in the PNS, in neurons as well as in immune or glial cells (Campbell &
Meyer, 2006).
At the site of injury, due to neuronal damage and Wallerian degeneration, pro-
inflammatory mediators are released, such as prostaglandin E2 (PGE2), bradykinin,
reactive oxygen species (ROS), nitric oxide (NO), protons, histamine, neurotrophins,
interleukins (IL-1), tumour necrosis factor α (TNF-α), cytokines, serotonin (HT-5),
glutamate, or adenosintriphosphate (ATP), a mix often referred to as “inflammatory
soup”. Regulatory mechanisms include both ionotropic and metabotropic effects (e.g.
activation of tyrosine kinase receptors by neurotrophins). A central role play
neuropeptides such as substance P, neuropeptide Y, CGRP, cholecystokinin, galanin, and
neurotensin: These peptides not only alter neuronal excitability but also account for
long-lasting effects as they may influence gene expression and synaptogenesis by
activating G-protein-coupled receptors (GPCR). They show complex regulation in
neuropathic pain (Ji & Strichartz, 2004).
1.2.2.1 Ion Channels
A central feature of neuropathic pain is the altered excitability of neurons, i.e. a change
in membrane properties. This is mainly achieved by modifications in membrane ion
5
channel expression. Prominent examples are voltage-gated sodium channels: Whereas
slow-inactivating tetrodotoxin (TTX)-resistant channels NaV1.8 and NaV1.9 are
downregulated, quick-inactivating TTX-sensitive NaV1.3, physiological only in
embryonic DRG, is upregulated. These changes alter membrane properties thus
allowing for repetitive bursting discharges (Ekberg & Adams, 2006; Wood et al., 2004).
Calcium currents are modified by expression of ionotropic ATP receptor family P2X,
Cavα2δ1 subunit (upregulation) as well as L- and T-type channels (downregulation) (Ji
& Strichartz, 2004). Interestingly, the decrease in the latter causes enhanced excitability
as it inhibits Ca2+-modulated K
+ currents. Of K
+ currents, mostly G protein-activated
rectifying potassium channels (GIRK) control resting potential. Other potassium
channels include delayed rectifying channels and KCNQ channels. While many K+
channels exhibit antinociceptive features (Ocaña et al., 2004), there are reports of
downregulation in neuropathic pain (e.g. Rose et al., 2011).
A group of less selective cation channels involved in neuropathic pain are transient
receptor potential (TRP) channels, most notably TRPV1 (upregulation), TRPM3,
TRPM8, and TRPA1 (downregulation) (Ji & Strichartz, 2004; Staaf et al., 2009;
Caspani et al., 2009).
Due to changes in ion channel expression, membrane potentials are altered and
damaged axons tend to spontaneously emit action potentials without external stimulus.
This ectopic firing affects not only the site of injury: Also cell bodies in the DRG
undergo significant changes as described above (Campbell & Meyer, 2006).
Importantly, the initial “inflammatory soup” and subsequent expression alterations also
affect adjacent non-damaged nociceptors (Ji & Stichartz, 2004; Moalem & Tracey,
2005): The milieu at the site of injury can affect their sensitivity and their spontaneous
activity. This has been observed mostly for C fibres and goes along with a differential
regulation of various genes. Repetitive excitation of neurons causes further long-lasting
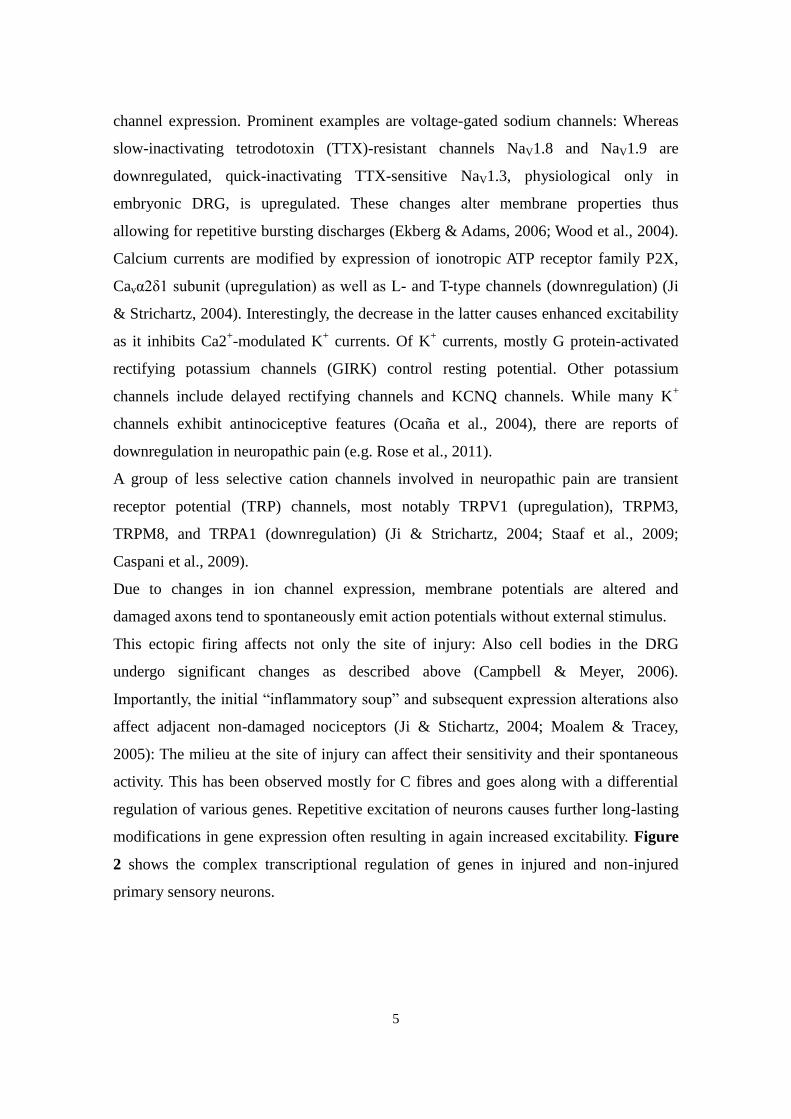
modifications in gene expression often resulting in again increased excitability. Figure
2 shows the complex transcriptional regulation of genes in injured and non-injured
primary sensory neurons.
6
1.2.2.2 Immune and Glial Modulations
One important factor that contributes to enhanced sensitization is the role of non-
neuronal cells. Throughout the past years, the relevance of immune cells and glia in the
maintenance and perseverance of neuropathic states has become evident. In fact, Scholz
& Woolf (2007) assume a “neuropathic triad”: Neuropathic alterations start with the
initial inflammatory response described above. Macrophages are activated and recruited
by chemokines released from the lesion site. Their activation causes blood-nerve barrier
destruction and hyperaemia by matrix metalloproteinases and vasoactive mediators,
thus facilitating further infiltration with macrophages, T lymphocytes and mast cells.
Furthermore, they enhance post-translational regulation in primary sensory neurons by
release of inflammatory mediators like TNF-α and interleukins.
A good example of interaction between neuronal and glial cells is neuregulin, a growth
factor on the axonal membrane that acts on Schwann cells. In a first response, it induces
demyelination via tyrosine kinase receptor ERBB2, which is later associated with
remyelination. In turn, Schwann cells promote further nociceptor sensitization by
release of NGF and GDNF, PGE2 and cytokines (reviewed by Scholz & Woolf, 2007;
Ohara et al., 2009).
Figure 2: Regulatory pathways in injured and non-injured neurons (from Ji &
Strichartz, 2004).
7
In this context, it is relevant to emphasize that immune and glial cells, in variable
proportions, constitute the bulk of DRG cells, only ~15% of all DRG cells are neuronal
(Ng et al., 2010). This diversity needs to be considered in the experimental setting and
interpretation of results (see chapter 1.5).
1.2.2.3 Central Mechanisms
Furthermore, various modulations occur in the CNS, such as a central sensitization in
postsynaptic dorsal horn cells caused by microglia activation and an increased
descending responsiveness. As this thesis deals with alterations in the PNS, though, I
will not further elaborate on these mechanisms (for further details, see Campbell, 2006).
1.2.3 Animal Models of Neuropathic Pain
In animals, various models have been developed mimicking different forms of
neuropathic pain. Among the most frequently used are peripheral nerve injuries in
rodents, such as Spinal Nerve Ligation (SNL) or Chronic Constriction Injury (CCI),
where spinal or peripheral nerves are being continuously irritated (Kim & Chung, 1992;
Bennett & Xie, 1988). In contrast, axotomy models such as Sciatic Nerve Transection
(SNT, Wall et al., 1974) emulate a deafferential rather than neuropathic phenotype.
Other non-traumatic models include chemical induction (e.g. streptozotocin for diabetic
neuropathy, Jakobsen & Lundbaek, 1976) or in-vitro approaches like stress induction by
cell isolation (described by Zheng et al., 2007). In this study, the Chronic Constriction
Injury model was used as it is well-established in rodents, easy to perform, provides a
distinct, well-described phenotype, and is widely accepted as an apt model.
1.2.4 Epidemiology and Treatments
As neuropathic pain imposes severe restrictions on everyday life (Jensen et al., 2007),
enormous pressure for therapeutic management exists, all the more as neuropathic pain
is a growing medical condition. Due to its association with lifestyle diseases like type 2
diabetes mellitus or with medical treatment (chemotherapy) its prevalence is on the rise:
Numbers in literature vary from 1.5% (1998, USA) to 17.9% (2006, Canada) of the
population, with an increasing tendency (cf. Bennett, 1998; Toth et al., 2006). This rise
is all the more alarming as it represents a heavy economic burden: A survey from 2000
8
suggested annual costs of $17,350 per patient in the US, more than three times the costs
of matched controls (Berger et al., published 2004)2. Yet, despite efforts, adequate
treatment still remains difficult: only 40-60% of the patients experience at least partial
relief after pharmacological treatment (Dworkin et al., 2007).
Among the most effective drugs are tricyclic antidepressants (re-uptake inhibitors of
neurotransmitters), anticonvulsants (esp. Cav blockers like Gabapentin), and opioids.
Still, success parameters like the number of patients needed to treat (NNT) remain poor
(for details, see Attal et al., 2006). One reason is certainly the often only accidental
discovery of their beneficence: They consequently represent only a symptomatic
approach. Other, targeting approaches include cell and gene therapy (Jain, 2008; Dray,
2008) but are at present still at an experimental stage. Invasive treatments such as
microvascular decompression or neuroablation in trigeminal neuralgia can be
considered only a final alternative in severe cases (Tronnier & Rasche, 2009).
1.3 MicroRNAs
MicroRNAs (miRNAs) are small (20-23 nucleotides (nt)), single-stranded non-coding
RNAs that have been shown to play a crucial role in post-transcriptional gene
regulation. They were first described in 1993, for C. elegans, by Lee et al. In 2000,
Pasquinelli et al. detected analogous RNA molecules in a variety of species, including
the human genome, thus indicating a general, conserved principle of gene expression
regulation (Pasquinelli et al., 2000). One year later, the term microRNA was coined
(e.g., Lagos-Quintana et al., 2001). Since then, miRNAs have been revealed as an
important regulative factor in gene expression and have elicited intense research. By
now, the number of miRNAs identified in genomes of animals, plants, fungi, and
viruses amounts to thousands, many of them suggesting an ancient well-conserved role
in gene regulation. For mice, more than 800 miRNAs are currently known
(http://www.mirbase.org/, retrieved last on Aug 18, 2013).
1.3.1 Biogenesis
MiRNA in the DNA may be located inter- or intragenetically, i.e. between coding genes
2 This number derives from frequent medical consultations, expensive treatment and frequent co-morbidities like
reactive depression. Moreover, as neuropathic pain is often related with work impairment, real costs are
considered much higher.
9
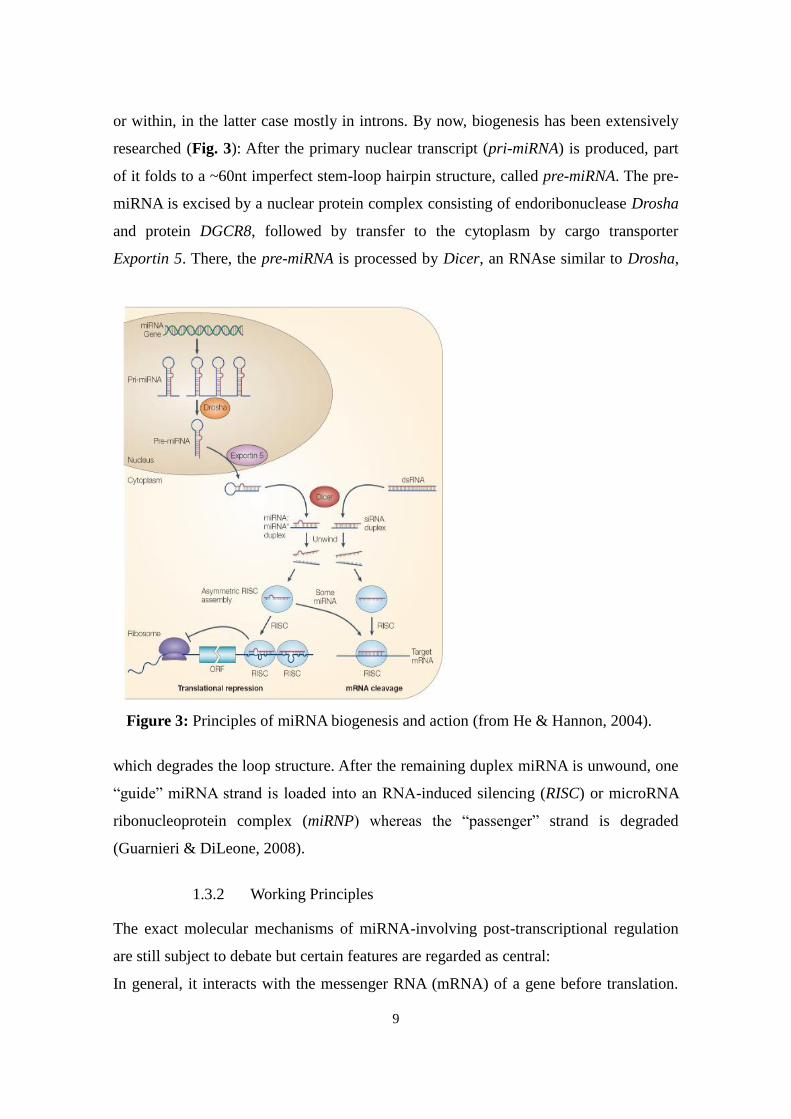
or within, in the latter case mostly in introns. By now, biogenesis has been extensively
researched (Fig. 3): After the primary nuclear transcript (pri-miRNA) is produced, part
of it folds to a ~60nt imperfect stem-loop hairpin structure, called pre-miRNA. The pre-
miRNA is excised by a nuclear protein complex consisting of endoribonuclease Drosha
and protein DGCR8, followed by transfer to the cytoplasm by cargo transporter
Exportin 5. There, the pre-miRNA is processed by Dicer, an RNAse similar to Drosha,
which degrades the loop structure. After the remaining duplex miRNA is unwound, one
“guide” miRNA strand is loaded into an RNA-induced silencing (RISC) or microRNA
ribonucleoprotein complex (miRNP) whereas the “passenger” strand is degraded
(Guarnieri & DiLeone, 2008).
1.3.2 Working Principles
The exact molecular mechanisms of miRNA-involving post-transcriptional regulation
are still subject to debate but certain features are regarded as central:
In general, it interacts with the messenger RNA (mRNA) of a gene before translation.
Figure 3: Principles of miRNA biogenesis and action (from He & Hannon, 2004).
10
Two basic principles of miRNA-mRNA interaction can be distinguished: mRNA
cleavage and translational repression. In plants, the RISC containing the miRNA
recognizes a stretch of complementary bases in the 3'-untranslated region (UTR) of a
target mRNA and induces mRNA cleavage by argonaute proteins with endonuclease
activity (Ago). In metazoa, in contrast, miRNA and 3'UTR of the target mRNA most
commonly share only partial complementarity, displaying a) contiguous Watson-Crick
pairing in the so-called 5' proximal seed region (~nt 2-8), responsible for target
recognition and b) incomplete homology in the central part (nt 10-11) which precludes
endonucleolytic cleavage of the target mRNA by Agos (Pillai et al., 2007). Instead, the
miRNP:mRNA complex is translocated to small cytoplasmic foci called p-bodies
(processing bodies). These contain enzymes responsible for mRNA degradation but can
also serve as “temporary storage sites” from where mRNAs can re-enter translation
(Pillai et al., 2007; Kulkarni et al., 2010).3 Although most miRNA research so far has
focused on repressive regulation, further mechanisms including gene-enhancing instead
of silencing (Vasudevan et al., 2007) are being discussed.
1.3.3 miRNA Target Prediction
Analyses estimate that miRNAs regulate about 30% of the human genome (Lewis et al.,
2005). Still, target prediction results challenging due to several factors: First of all, the
small size of 20-23nt and a relevant seed sequence of merely ~7nt impede
discrimination between random sequence correlation and functional relevance. Second,
miRNAs seem to act pleiotropically: It is estimated that up to 200 genes can be targeted
by a single miRNA (Krützfeldt et al., 2005). At the same time, genes may be regulated
by different miRNAs independently: Such redundancy indicates the possibility of
combinatorial action to maximize inhibitory effects. Moreover, as the field is rather
young, only few validated targets exist that might serve as model for further predictions.
Still, the major obstacle lies in the imperfect homology between miRNA and target
required. Several computational approaches have been developed, based on factors that
determine miRNA:mRNA binding, such as between-species conservation, stringency of
seed pairing, site number, site type, thermodynamical considerations, or predicted
3 Besides the effect on translation initiation, other models propose miRNA involvement in later stages of
translation (cf. Peterson et al., 2006, for details).
11
pairing stability. (for details, see Bartel, 2009). Still, established databases like
miRANDA, TargetScan or PicTar suggest up to 1,000 potential target genes for a single
miRNA with sometimes surprisingly diverging results. Recently developed databases
like myMIR aim at integrating these different approaches. A rather novel bioinformatical
approach is the deduction of miRNA involvement from sequence comparison to
differentially regulated genes (e.g. SylArray, mirAct, see chapter 3.8).
1.3.4 miRNAs in Medicine
By now, miRNAs have been described in many fields, especially in developmental
pathways, carcinogenesis and immunological processes. Despite its rather recent
discovery, miRNA dysregulation has been suggested as pathomechanism for a number
of clinical conditions. Examples include neoplasia like ovarian cancer (Iorio et al.,
2007), congenital defects such as polycystic kidney disease (Chu & Friedman, 2008), or
viral infects like Hepatitis C (van der Ree, 2014) but also conditions not primarily
related to developmental or differentiation disorders: MiR-133, for example, is
discussed as potential serum biomarker for myocardial infarction (Cheng et al., 2014).
Besides its putative role as diagnostic tool, studies also aim at using miRNAs as
therapeutic targets or agents (e.g. Baek et al., 2043, on miR-122 in hepatitis C). As yet,
however, attempts have been only experimental.
1.4 MicroRNAs in Pain
Despite the enthusiasm about miRNAs, surprisingly little has been published on their
role in pain and nociception. In fact, when I started this project, only one paper had been
released concerning peripheral pain, by Bai et al. (2007) who reported differential
expression of seven miRNAs in TG after inflammatory muscle pain. They described a
downregulation in miR-10a, -29a, -98, -99a, -124a, -134, and -183 by up to 80% within
min. The effect lasted between 1 and 4 d and in some cases even resulted in later over-
expression (Bai et al., 2007).
By now, several studies have been published on miRNA in the PNS and pain. The
principle of miRNAs in inflammatory pain has been proven by creating a conditional
Dicer knockout mouse that showed diminished pain response to inflammatory
mediators (Zhao et al., 2010). Aldrich et al. (2009) described a downregulation of miR-
12
182/-183/-96 in DRG following SNL. Yu et al. (2011) reported differential regulation of
miR-21, miR-221 (upregulation), miR-500 and miR-551b (downregulation) after sciatic
nerve transection (i.e. deafferentiation pain). These findings were partially confirmed by
Strickland et al. (2011) who found an axotomy-induced upregulation of miR-21.
Furthermore, Sakai & Suzuki (2013) could establish the role of miR-21 by pain
attenuation through intrathecal administration of a direct inhibitor. An in vitro approach
was used by Bastian et al. to show a downregulation of miR-1 (Bastian et al., 2011).
Notably, compared to Bai et al, the in vivo experiments concerned with neuropathic pain
observed a regulation over a much larger time course, in most cases over 14 d which is
consistent with previous literature data on gene regulation.
The first comparison of miRNA regulation in different pain mechanisms has been made
by Kusuda et al. who analysed the expression patterns of three miRNAs (miR-1, miR-
16, miR-206) in different pain conditions in both PNS and CNS. For DRG, they
observed a decrease of all miRNAs in inflammatory pain but only for miR-1 and -206 in
partial nerve ligation neuropathy. Interestingly, all three miRNAs were upregulated after
axotomy4. Finally, acute nociceptive pain increased expression of miR-1 and -16
(Kusuda et al., 2011).
1.5 Neuronal Tracing
As described above, DRG consist of different cell types that seem to interact in a
complex pattern. Therefore, much energy has been dedicated to better discriminate
between the different fractions. One method that as proved powerful is fluorescent
labelling, e.g. of neurons. Fluorescent neuronal labelling has long been established in
histology to trace the course of nerve fibres or to identify neuronal subsets. Various
tracers serve different purposes. Fluoroemerald (FE) is a fluorescein-labelled 10,000 Da
dextran (Choi et al., 2002). As its high molecular weight impedes the permeation of
intact neuronal membranes, it can be taken up only by neurons with an impaired
membrane barrier function and is therefore suitable for the labelling of primarily
damaged neurons (Fritzsch & Sonntag, 1991). In contrast, DiI, an ambiphilic
carbocyanine with two long hydrocarbon side chains, is quickly taken up by neurons
and embedded in the lipid bilayer of the cell membrane where it passively diffuses
4 These findings underline the importance to distinguish between neuropathic and deafferentiation pain.
13
along the axon (Honig & Hume, 1986). Its properties qualify DiI as a marker for
neurons, and it has been established in neuronal staining (Vidal-Sanz, 1988;
Sarantopoulos, 2002). Importantly, the distance between the application site and the
soma (DRG) prevents accidental selection of non-neuronal tissue: Only neurons possess
such long continuous branches. Double-labelling for injured vs spared neurons has
mainly been described for differentiation in histology (e.g. Fluororuby and Fluorogold;
Schäfers et al., 2003).
14
2 Objectives
The primary aim of this thesis was the investigation of possible microRNA involvement
in peripheral neuropathic pain. MicroRNAs (miRNAs) have proven crucial for post-
transcriptional regulation in many contexts, especially cell growth and differentiation.
However, only little was known about their role in pain.
Based on findings in inflammatory pain (Bai et al., 2007) as well as the known
relevance of cell growth (neurogenesis) in neuropathic pain, I postulated that specific
miRNAs in the dorsal root ganglia (DRG) are regulated in the course of neuropathic
pain. To this end, the miRNA expression profile is characterized in a murine model of
peripheral neuropathic pain, using the established Chronic Constriction Injury (CCI)
model by Bennett & Xie (1988). To obtain first information about temporal patterns as
well as systemic effects, expression patterns in neuropathic and contralateral DRG at
three different time points are analysed. Subsequently, significantly regulated single
miRNAs are identified. For the resulting candidates, findings are validated and further
analysed including histological distribution. Thus, regulation pattern and cell-specific
localization of several miRNAs are characterized and linked to existent knowledge
about genes involved.
In a second step, I postulated that a cell type-specific damage-related mRNA expression
analysis in DRG neurons will allow a more specific and reliable method to identify new
targets and the involvement of miRNAs. As DRG are of a very heterocellular nature
including neuronal, immune and glial tissue, cell-type specific regulation, e.g. of
neurons, might be blurred. Moreover, it has been shown that not only damaged neurons
but also adjacent intact neurons undergo expression changes: A neuron-specific
technique is developed that allows comparison of primarily damaged primary sensory
neurons and non-damaged adjacent neurons via staining with fluorescent tracers in flow
cytometry. To obtain neuron-specific information about miRNA involvement,
bioinformatic prediction of miRNA involvement was conducted based on gene
expression results. I hypothesized that this approach of transcriptional profiling of
neuronal subpopulation will yield new insights in the respective role of damaged and
intact neurons in neuropathic pain.
15
3 Methods5
3.1 Animals
For this project, female C57/BL6 mice of 6-8 weeks of age were used (Charles River,
Wilmington, MA, USA). Mice were housed in sawdust cages (4-5 mice per cage, water
and food provided ad libitum) and exposed to a circadian rhythm (light for 12h, from 6
am to 6 pm). Animal experiments were approved by EMBL Monterotondo animal
committee and comply with Italian legislation (Art. 9, 27. Jan 1992, no 116) under
licence from the Italian Ministry of Health.
3.2 Tissue
3.2.1 Surgery
Mice were anesthetized with an intraperitoneal injection of 1.5 ml/g 2.5% Avertin®
(Tribromoethanol, Sigma Aldrich, St Louis, MO, USA) in PBS. Chronic constriction
injury (CCI) was performed as follows: After fur removal in the surgery area (left
proximal dorsal thigh) and skin incision (ca. 3mm), the left biceps femoris muscle was
bluntly dissected at about mid-thigh level and the sciatic nerve exposed. Three friction-
knotted loose ligations were tied around the sciatic nerve using 7-0 silk threads. Nerve
and muscle were placed back in situ and the wound was closed with a 9 mm metal clip
(cf. Bennett & Xie, 1988).
3.2.2 Neuronal Staining
For tracer application, surgery was performed as above. Immediately following the
ligation, 2 µl of Fluoroemerald (FE, 5% in 0.9% saline) were injected epineurally into
the exposed nerve proximal to the ligation site using a Hamilton syringe and a 32 G
needle. Great care was taken not to penetrate deeper layers of the nerve. After closure of
the wound, 4 µl DiI (1,1-dioctadecyl-3,3,3,3-tetramethylindocarbocyanine
perchlorate,10 mg/ml in DMSO, Invitrogen, Carlsbad, CA, USA) were injected
subcutaneously into the plantar surface of both hind paws using a 28 G needle. The site
of injection was manually pressed for one minute to facilitate puncture closure and
5 If not specified otherwise, all solutions and buffers used were manufactured at EMBL Monterotondo following
standard protocol.
16
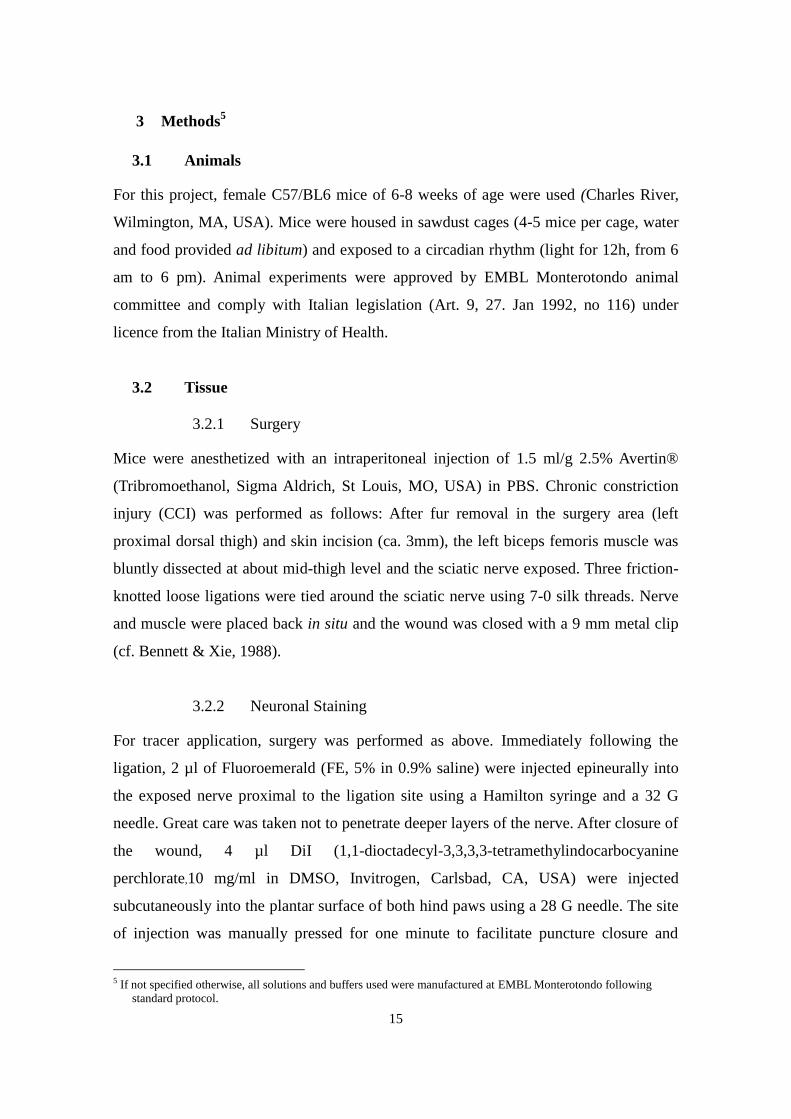
avoid dye leakage (Fig. 4).
3.2.3 Tissue Collection
After a specific time-point (6 h, 1 d, 7 d respectively), mice were sacrificed by cervical
dislocation. The spinal column, including surrounding tissue, was excised, followed by
careful removal of vertebral bodies and the spinal cord. The proximal parts of the sciatic
nerve were exposed and traced back to the respective spinal nerves. The corresponding
DRG (L3-5) were excised and detached from axons and surrounding tissue before
stored at -80 °C. Throughout the entire procedure, great care was taken to provide an
RNAse-free workplace (e.g. RNAse ZAP®, Invitrogen, Carlsbad, CA, USA).
3.2.4 RNA Extraction
Tissue homogenization and RNA extraction followed standard Trizol® protocol
(Invitrogen, Carlsbad, CA, USA): DRG were pooled (from 6- 10 mice per condition and
run), homogenized with 1 ml Trizol reagent for 30 s and stored on ice for 10 min. After
Figure 4: Principle of fluorescent tracer injection. FE (green) is injected just
proximal to the site of injury (purple ligatures); it is taken up by damaged neurons
and transported to the DRG. DiI (red) is injected into the hindpaw just after surgical
procedure. It permeates the axonal membrane and diffuses along the axon.
Membrane disruption, however, impedes further diffusion towards the DRG.
17
centrifugation (12,000g at +4 °C, 10 min), supernatant was pipetted off and mixed well
with 200 µl chloroform. After 3 min at room temperature (RT) the samples were again
centrifuged. The resulting aqueous phase was pipetted off and washed with 100%
isopropanol and 75% ethanol in RNAse-free water. RNA quantity and quality were
assessed by Nanodrop 8000 (Nanodrop Technologies, Wilmington, DE, USA) and
Agilent 2100 Bioanalyzer (Agilent Technologies, Santa Clara, CA, USA), respectively.
3.3 Assessment of Surgical Effect
The effect of CCI in terms of neuronal damage was tested by quantitative real-time
PCR, assessing the level of galanin mRNA against a reference gene. Galanin, a 30
amino acid polypeptide, has been shown to be up-regulated in DRG neurons after
neuropathic pain compared to other types of pain or to naïve tissue (Ma & Bisby, 1997;
Villar et al., 1989) and has hence served as a marker gene. Ubiquitin served as reference
gene (Sigma-Aldrich, St Louis, MO, USA).
Primers Sequences
Galanin left: CTC TAG TCC TCC TGC GGT TG
right: CTG GAA CCC TCC CTA CCT TC
Ubiquitin left: TGG CTA TTA ATT ATT CGG TCT GCA T
right: GCA AGT GGC TAG AGT GCA GAG TAA
After extraction as described above, RNA of ipsilateral, contralateral and naïve tissue
was reverse transcribed using the Invitrogen SuperScript™ kit following manufacturer‟s
protocol.
PCR master mix was prepared using 5 μl Roche Sybr®Green, 1 μl of 5 μM Primer Mix,
and cDNA mix corresponding to 50 ng cDNA and filled up with ddH2O to a total
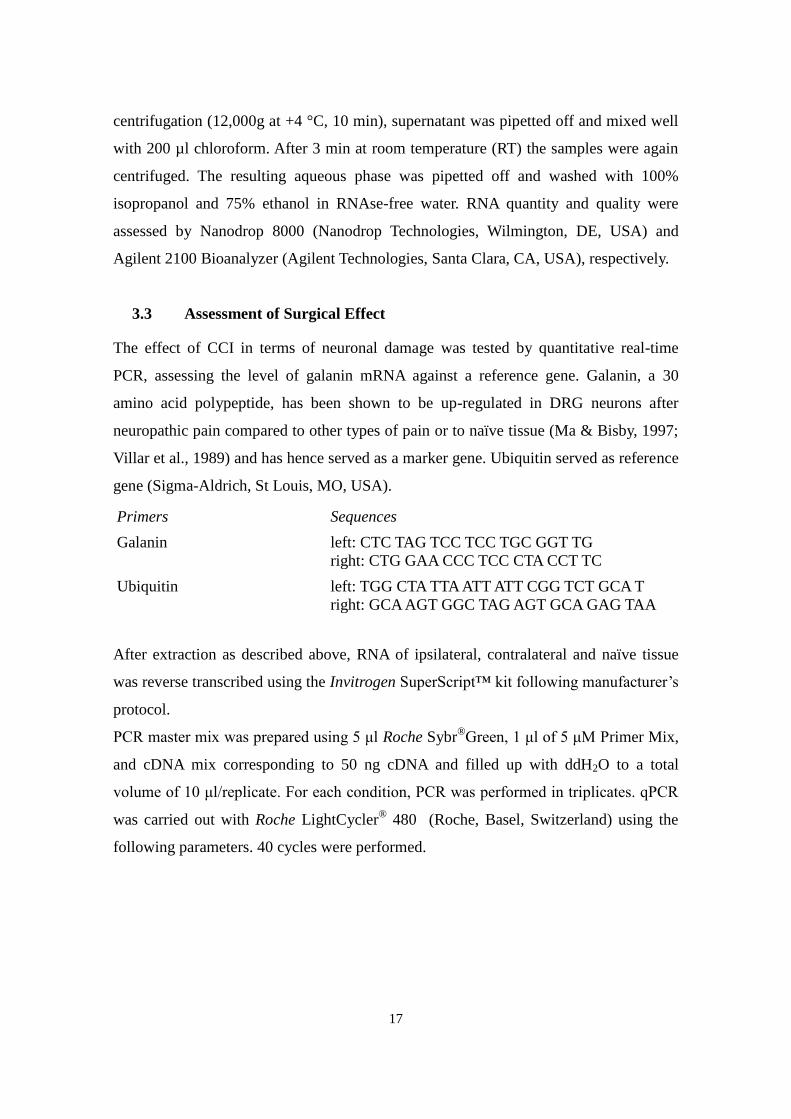
volume of 10 μl/replicate. For each condition, PCR was performed in triplicates. qPCR
was carried out with Roche LightCycler® 480 (Roche, Basel, Switzerland) using the
following parameters. 40 cycles were performed.
18
Temperature (°C) Time (min)
Pre-Incubation 95 10:00
Denaturation 95 00:10 Annealing 58 00:15 Elongation 72 00:10 Melting Curve 95 00:05
65 01:00 97 Cont.
Cooling 40 00:10
Fluorescence was measured after each cycle and cycle threshold (Ct) values calculated
for each replicate. Based on respective Ct values, galanin expression level (EL) relative
to ubiquitin was calculated using the following formula: EL (Gal) = 2^-ΔCt = 2^ -
(Ct(Gal) - Ct(Ubi). Moreover, behaviour was observed on a daily basis. Formal
algesiometric tests were not conducted.
3.4 MicroRNA Assay
MiRNA expression was analysed using a bead set technique (Luminex®, Luminex
Corp., Austin, TX, USA) based on solution hybridization: oligos specific to one miRNA
are bound to a polystyrene bead. Per run and condition, RNA of 12 mice was pooled. 4
runs were conducted. Total RNA extracted (5 μg/sample) was spiked with three
synthetic pre-labelling control RNAs (3 fmol/sample) to control for target preparation
efficiency. After running a 15% polyacrylamide gel (SequaGel®, National Diagnostics,
Atlanta, GA, USA), the gel pieces corresponding to a size of 18-26 nt were cut out and
eluted overnight in 0.3 M NaCl. MiRNA was ligated to 3‟ and 5‟ linkers using T4 RNA
ligase, each ligation followed by gel purification. The bi-ligated products were reverse-
transcribed and amplified by PCR using Biotin-labelled primers. Amplification was
performed using the following parameters: 95 °C for 30 s, 50 °C for 30 s and 72 °C for
40 s (18 cycles). PCR products were precipitated and re-dissolved in TE buffer
containing biotinylated post-labelling controls (100 fmol/μl).
Labelled samples were hybridized to color-coded polystyrene beads. Five distinct bead
sets were used, each allowing the detecting of ~90 different miRNAs (from D.
O‟Carroll, EMBL Monterotondo; for further information see Blenkiron et al., 2007).
Replicates were added across bead sets to guarantee comparability. Water-only blanks
and bead blanks served for background noise control. Hybridization was carried out at
19
50 °C overnight (33 μl of bead pool and 15 μl of labelled sample per well).
Oligo Sequence
PreControl III pCAG UCA GUC AGU CAG UCA GUC AG
PreControl IV pGAC CUC CAU GUA AAC GUA CAA
PreControl V pUUG CAG AUA ACU GGU ACA AG
3' linker pUUU aac cgc gaa ttc cag t
5' linker acg gaa ttc ctc act AAA
Reverse transcription primer TAC TGG AAT TCG CGG TTA
Amplification primers 5' Biotin-CAA CGG AAT TCC TCA CAT AA
3' TAC TGG AAT TCG CGG TTA
Unbound samples were removed by filtering and washing with 1x TE and 1x TMAC
buffer. After re-suspension in 1x TMAC buffer, reporter protein SAPE (Streptavidin
Phycoerythrin, 1:100 dilution) was added and activated by incubation at 50 °C for 10
min. Samples were transferred to a 96-well plate and processed in a Luminex 100®
instrument: For each miRNA, mean fluorescence was measured.
Mean fluorescence data obtained from Luminex were processed as follows:
MiRNAs that displayed values lower than three times the background noise in all
samples were removed. The remaining values were normalized based on the mean value
of the pre-control samples of the respective bead set. For replicate samples, mean value
and standard deviation were calculated to control for stability across bead sets. All
normalized values were log2-transformed, thus allowing a better comparison between
samples. Furthermore, precontrol-normalized values were again normalized based on
the naïve tissue value for each miRNA.
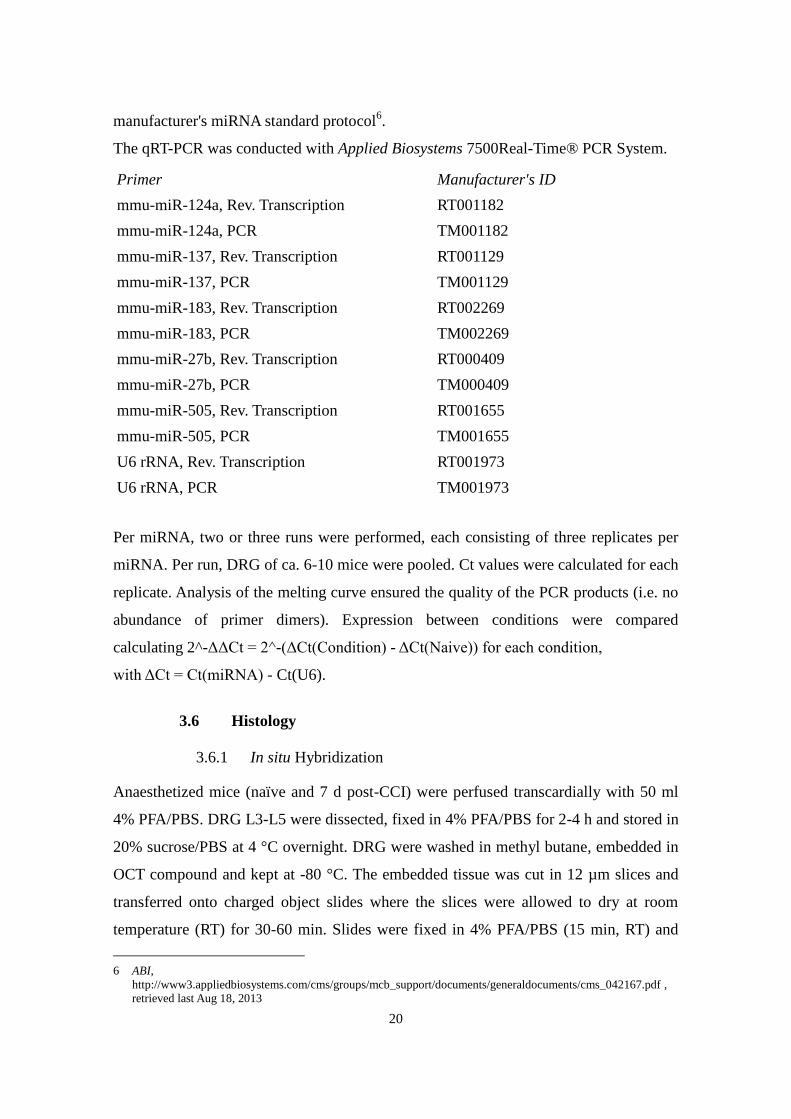
3.5 qRT-PCR
For selected miRNAs (mir-124, mir-137, mir-183, miR-27b and miR-505), qRT-PCR
(TaqMan®, ABI, Foster City, CA, USA) was conducted in neuropathic DRG RNA ipsi-
and contralaterally at 7 d post-CCI and in naïve DRG RNA. Small nuclear RNA U6
served as a reference gene. All primers were ordered as predesigned by the
manufacturer. For reverse transcription and PCR, ABI TaqMan®
MicroRNA Reverse
Transcription Kit and TaqMan® MicroRNA Assays were used following the
20
manufacturer's miRNA standard protocol6.
The qRT-PCR was conducted with Applied Biosystems 7500Real-Time® PCR System.
Primer Manufacturer's ID
mmu-miR-124a, Rev. Transcription RT001182
mmu-miR-124a, PCR TM001182
mmu-miR-137, Rev. Transcription RT001129
mmu-miR-137, PCR TM001129
mmu-miR-183, Rev. Transcription RT002269
mmu-miR-183, PCR TM002269
mmu-miR-27b, Rev. Transcription RT000409
mmu-miR-27b, PCR TM000409
mmu-miR-505, Rev. Transcription RT001655
mmu-miR-505, PCR TM001655
U6 rRNA, Rev. Transcription RT001973
U6 rRNA, PCR TM001973
Per miRNA, two or three runs were performed, each consisting of three replicates per
miRNA. Per run, DRG of ca. 6-10 mice were pooled. Ct values were calculated for each
replicate. Analysis of the melting curve ensured the quality of the PCR products (i.e. no
abundance of primer dimers). Expression between conditions were compared
calculating 2^-ΔΔCt = 2^-(ΔCt(Condition) - ΔCt(Naive)) for each condition,
with ΔCt = Ct(miRNA) - Ct(U6).
3.6 Histology
3.6.1 In situ Hybridization
Anaesthetized mice (naïve and 7 d post-CCI) were perfused transcardially with 50 ml
4% PFA/PBS. DRG L3-L5 were dissected, fixed in 4% PFA/PBS for 2-4 h and stored in
20% sucrose/PBS at 4 °C overnight. DRG were washed in methyl butane, embedded in
OCT compound and kept at -80 °C. The embedded tissue was cut in 12 µm slices and
transferred onto charged object slides where the slices were allowed to dry at room
temperature (RT) for 30-60 min. Slides were fixed in 4% PFA/PBS (15 min, RT) and
6 ABI,
http://www3.appliedbiosystems.com/cms/groups/mcb_support/documents/generaldocuments/cms_042167.pdf ,
retrieved last Aug 18, 2013
21
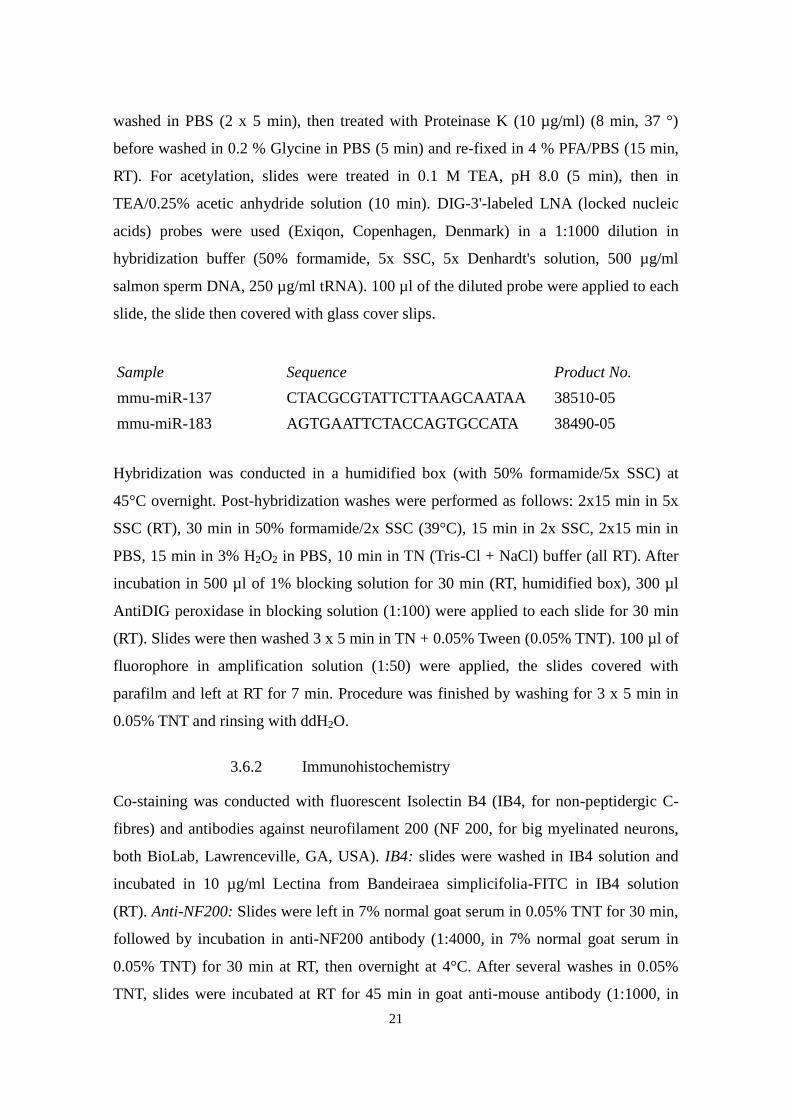
washed in PBS (2 x 5 min), then treated with Proteinase K (10 µg/ml) (8 min, 37 °)
before washed in 0.2 % Glycine in PBS (5 min) and re-fixed in 4 % PFA/PBS (15 min,
RT). For acetylation, slides were treated in 0.1 M TEA, pH 8.0 (5 min), then in
TEA/0.25% acetic anhydride solution (10 min). DIG-3'-labeled LNA (locked nucleic
acids) probes were used (Exiqon, Copenhagen, Denmark) in a 1:1000 dilution in
hybridization buffer (50% formamide, 5x SSC, 5x Denhardt's solution, 500 µg/ml
salmon sperm DNA, 250 µg/ml tRNA). 100 µl of the diluted probe were applied to each
slide, the slide then covered with glass cover slips.
Sample Sequence Product No.
mmu-miR-137 CTACGCGTATTCTTAAGCAATAA 38510-05
mmu-miR-183 AGTGAATTCTACCAGTGCCATA 38490-05
Hybridization was conducted in a humidified box (with 50% formamide/5x SSC) at
45°C overnight. Post-hybridization washes were performed as follows: 2x15 min in 5x
SSC (RT), 30 min in 50% formamide/2x SSC (39°C), 15 min in 2x SSC, 2x15 min in
PBS, 15 min in 3% H2O2 in PBS, 10 min in TN (Tris-Cl + NaCl) buffer (all RT). After
incubation in 500 µl of 1% blocking solution for 30 min (RT, humidified box), 300 µl
AntiDIG peroxidase in blocking solution (1:100) were applied to each slide for 30 min
(RT). Slides were then washed 3 x 5 min in TN + 0.05% Tween (0.05% TNT). 100 µl of
fluorophore in amplification solution (1:50) were applied, the slides covered with
parafilm and left at RT for 7 min. Procedure was finished by washing for 3 x 5 min in
0.05% TNT and rinsing with ddH2O.
3.6.2 Immunohistochemistry
Co-staining was conducted with fluorescent Isolectin B4 (IB4, for non-peptidergic C-
fibres) and antibodies against neurofilament 200 (NF 200, for big myelinated neurons,
both BioLab, Lawrenceville, GA, USA). IB4: slides were washed in IB4 solution and
incubated in 10 µg/ml Lectina from Bandeiraea simplicifolia-FITC in IB4 solution
(RT). Anti-NF200: Slides were left in 7% normal goat serum in 0.05% TNT for 30 min,
followed by incubation in anti-NF200 antibody (1:4000, in 7% normal goat serum in
0.05% TNT) for 30 min at RT, then overnight at 4°C. After several washes in 0.05%
TNT, slides were incubated at RT for 45 min in goat anti-mouse antibody (1:1000, in
22
7% normal goat serum in 0.05% TNT).
For both stainings, slides were embedded in Mowiol® (polyvinyl alcohol, Sigma-
Aldrich) after thorough washing in 0.05 % TNT and rinsing with ddH2O.
All pictures were taken using a Leica TCS SP5 confocal microscope (Leica, Wetzlar,
Germany).
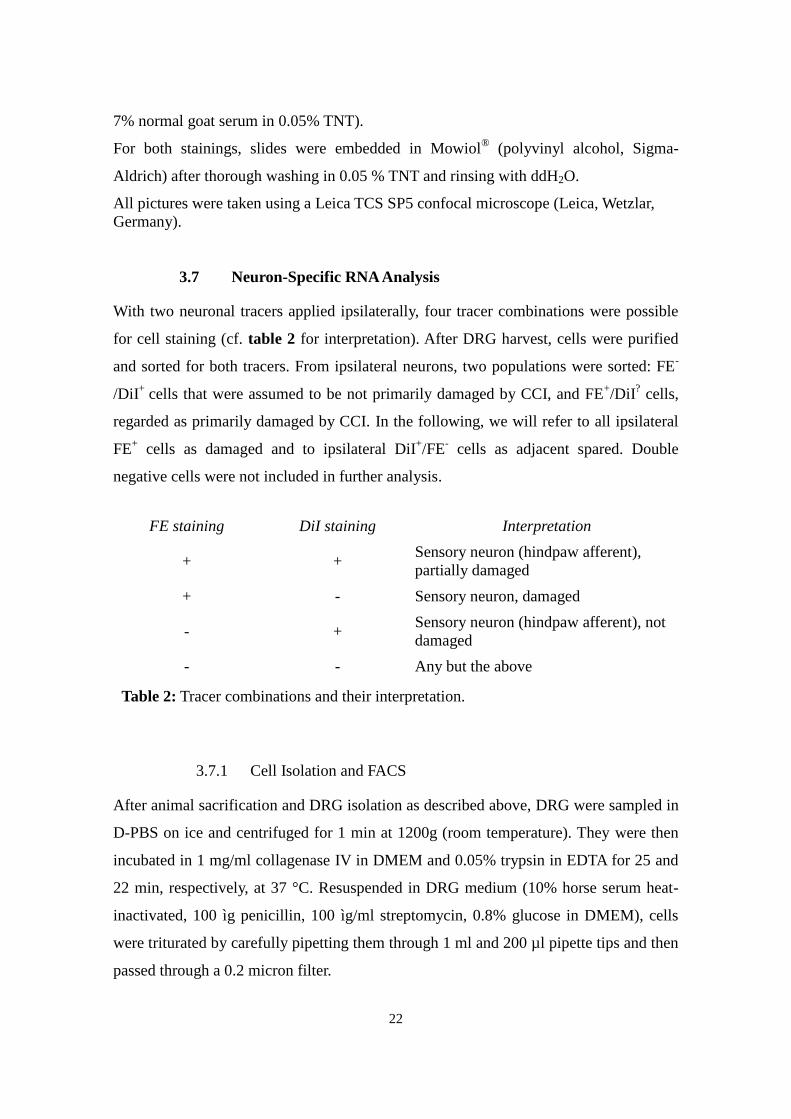
3.7 Neuron-Specific RNA Analysis
With two neuronal tracers applied ipsilaterally, four tracer combinations were possible
for cell staining (cf. table 2 for interpretation). After DRG harvest, cells were purified
and sorted for both tracers. From ipsilateral neurons, two populations were sorted: FE-
/DiI+
cells that were assumed to be not primarily damaged by CCI, and FE+/DiI
? cells,
regarded as primarily damaged by CCI. In the following, we will refer to all ipsilateral
FE+ cells as damaged and to ipsilateral DiI
+/FE
- cells as adjacent spared. Double
negative cells were not included in further analysis.
FE staining DiI staining Interpretation
+ + Sensory neuron (hindpaw afferent),
partially damaged
+ - Sensory neuron, damaged
- + Sensory neuron (hindpaw afferent), not
damaged
- - Any but the above
3.7.1 Cell Isolation and FACS
After animal sacrification and DRG isolation as described above, DRG were sampled in
D-PBS on ice and centrifuged for 1 min at 1200g (room temperature). They were then
incubated in 1 mg/ml collagenase IV in DMEM and 0.05% trypsin in EDTA for 25 and
22 min, respectively, at 37 °C. Resuspended in DRG medium (10% horse serum heat-
inactivated, 100 ìg penicillin, 100 ìg/ml streptomycin, 0.8% glucose in DMEM), cells
were triturated by carefully pipetting them through 1 ml and 200 µl pipette tips and then
passed through a 0.2 micron filter.
Table 2: Tracer combinations and their interpretation.
23
Filtered cells were resuspended in DRG medium and stored on ice. Just before cell
sorting, 2 µl of Sytox®Blue (Invitrogen), a DNA-binding agent, were added to control
for cell damage.
FE has a peak excitation at 495 nm and peak emission at 524 nm, whilst for DiI, peak
excitation is at 551 nm and peak emission at 565 nm. Two-colour analysis was therefore
carried out with blue argon excitation at 488 nm; detection channels were FITC
(fluorescein isothiocyanate, peak emission at 525 nm) for FE, and PE (phycoerythrin,
peak emission at 578 nm) to identify DiI.
3.7.2 RNA Extraction and Assay
RNA was extracted from sorted cells using Trizol® (see above). Isolated RNA was
stored at -80°C and shipped to EMBL Heidelberg for Affymetrix Gene Expression
analysis (assay: Affymetrix Gene Expression Mouse 430_2; conducted by Sabine
Schmidt, EMBL Heidelberg).
3.8 Bioinformatics
Affymetrix Gene Expression results on mRNA were used for further bioinformatical
analysis for a possible role of miRNAs. Two different web-based tools were used to
minimize program-specific bias.
3.8.1 SylArray
SylArray (http://www.ebi.ac.uk/enright-srv/sylarray/, developed by Enright group, EBI
Hinxton7) analyses over- or underrepresented miRNA-specific wordings in 3'UTRs of a
gene list sorted by regulation. P-values for enrichment or depletion of each wording
along the gene list are calculated in a hypergeometric approach (van Dongen et al.,
2008; Bartonicek & Enright, 2010). Results are visualized for each miRNA in a chart
representing enrichment or depletion along the gene list: Steep peaks suggest significant
correlation to a specific gene in the gene list.
Based on Affymetrix expression data, sorted gene lists were submitted to compare a)
damaged with contralateral neurons and b) damaged with adjacent spared neurons. For
specificity reasons, only heptameric wordings were analysed and redundant sequences
7 Retrieved last Aug 18, 2013
24
excluded (“purging”). The general pattern was evaluated, the most significant miRNAs
analysed, and the curves of candidates miR-124, -137, -183, -27b, and -505 considered.
For expert evaluation of the emerging pattern, results were sent to the developers
(Anton Enright, EBI Hinxton).
3.8.2 MirAct
MirAct (http://sysbio.ustc.edu.cn/software/mirAct, developed by Wu group, Shanghai)
uses a different approach: Initially, single miRNA activity is assessed by comparing
regulation of presumed targets with non-targets for each sample (targets are extracted
from online databases like TargetScan or MiRanda, to be selected by the user), resulting
in a “sample score”. In a second step, different classes of samples, i.e. conditions, are
compared and a non-parametric analysis of variance performed (for details, cf. Liang et
al., 2011a). Significance is calculated using the established p-value and the more recent
q-value, a measure of false discovery rate. Depending on number and size of samples,
several calculation parameters can be adjusted. All three classes of neurons were
compared to each other in a single run. The following settings were used: Target
prediction using TargetScan 5.0, data transformation by ranking within sample; miRNA
activity determination based on sample scores. All other settings were set at default.
Cluster analysis was performed based on the significance of activity alteration across
classes using the q-value. As with SylArray, the general pattern was evaluated, the most
significant miRNAs analysed, and data for miR-124, -137, -183, -27b, and -505
considered.
3.8.3 myMIR
To assess potential targets of miR-137 and 183, myMIR, a recently developed database,
was used. By integrating the results of various established databases with different
algorithms (TargetScan, MiRanda, PITA, RNAhybrid and MicroT), a resulting score is
calculated on which target prediction is based. (http://www.itb.cnr.it/micro/, retrieved
last Aug 18, 2013. For details, see Corrada et al., 2011).
3.9 Data Processing
3.9.1 Data Calculation
25
Data extrapolation was performed using Microsoft Excel 2000 for Windows and
Sigmaplot 10 software.
3.9.2 Data Analysis
For qPCR experiments, significance was tested using Student's t-test (Sigmaplot 10).
Cluster analysis for miRNA assay (Luminex) was executed with Systat 13 software. For
gene expression analysis, statistical analysis was performed with GeneSpring GX
software. Data were normalized using RMA algorithm and transformed to the median of
all values. Entities within the 20th
-100th
percentile were included in further analysis. To
test significance, One-way ANOVA for unequal variance was performed, followed by
Tukey HSD test. Statistical significance was determined as p<.05.
26
4 Results
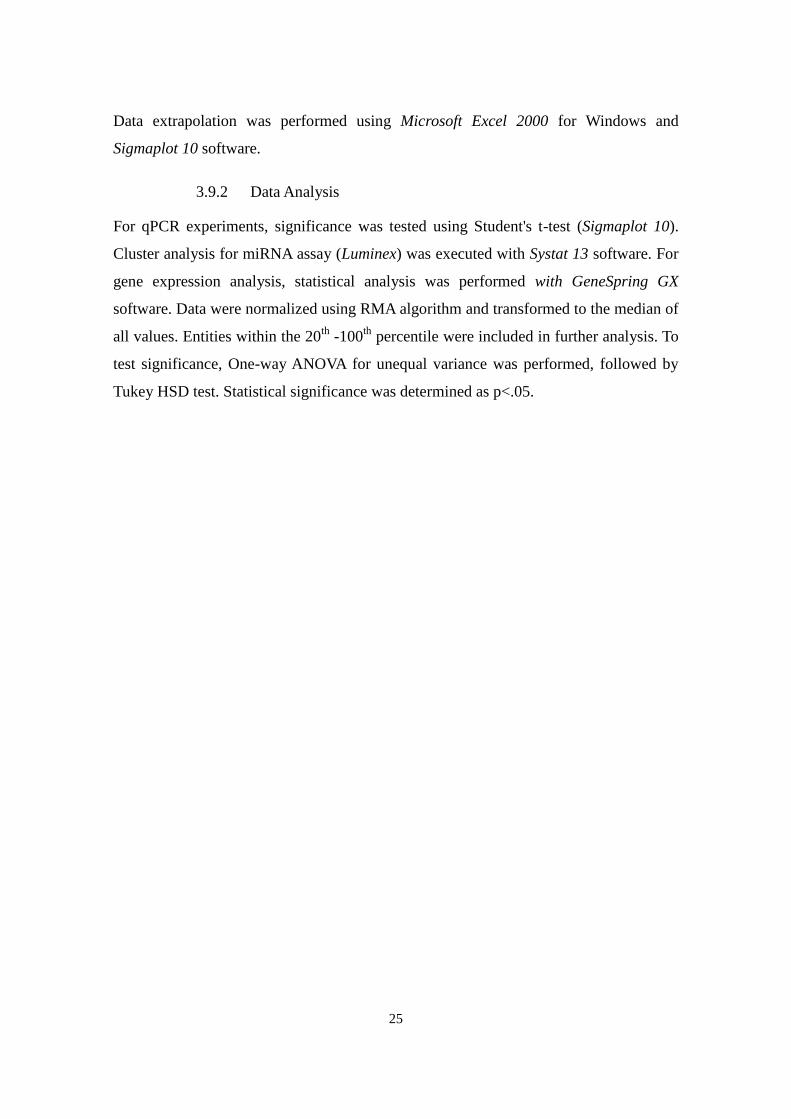
4.1 CCI Produces a Neuropathy-Specific Response
To validate the effectiveness of the CCI procedure, galanin expression was quantified in
RNA from CCI vs. control DRG using qRT-PCR. Although algesiometric tests were not
conducted in this experiemental protocols, the CCI procedure as conducted in our
working group consistently leads to a neuropathic phenotype after seven days, i.e.
significant thermal and mechanical allodynia (Caspani et al., 2009). Furthermore,
galanin upregulation has been shown to develop concurrent to the neuropathic
phenotype (not published, personal communication PA Heppenstall). In ipsilateral DRG,
results showed a steep upregulation in galanin expression over the course of 7 d (4.8-
fold after 1 d, 24.3-fold after 7 d, compared to naïve control, both p<0.001, n=3 per
group). Contralateral expression remained fairly constant (<twofold up- or
downregulation, p>0.05) (Fig. 5). Amplification of reference gene ubiquitin was reliable
in all runs (standard deviation 4.1 % of mean Ct value).
Galanin expression 6h, 1d and 7d post-CCI
Gal expre
ssio
n level re
lative to U
biq
uitin
(m
eans)
0,00
0,01
0,02
0,03
0,04
0,05
6h 1d 7d 6h 1d 7d
naive ipsilateral contralateral
6h: n = 121d: n = 107d: n = 20naive: n = 7
no. of miceFigure 5: Galanin expression in ipsi- and contralateral DRG after 6 h, 1 d, and 7 d,
compared to naïve controls. The y-axis indicates the expression relative to ubiquitin
using the Ct calculation model. Error bars indicate standard deviation. Asterisk
denotes p<0.001 compared to naïve DRG. n=3 per group,12 mice per run).
* *
27
4.2 MicroRNAs are Regulated in CCI
4.2.1 Increase in microRNA Regulation over Time
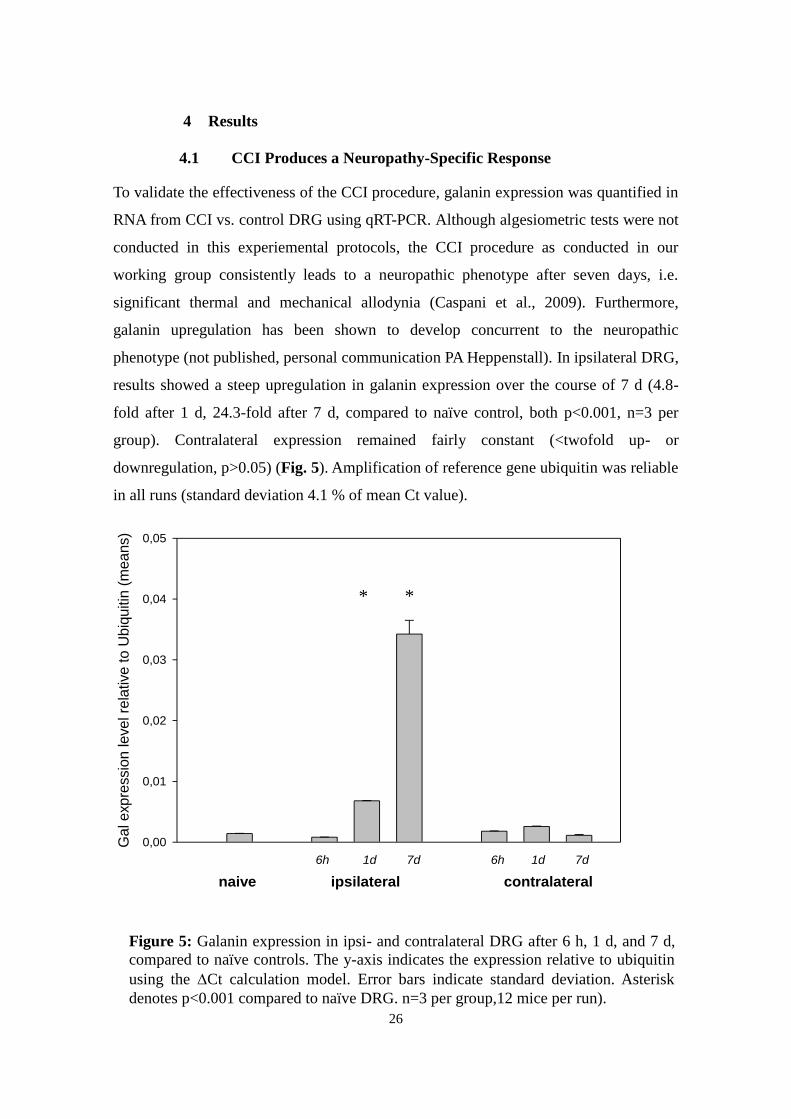
To assess development of miRNA regulation, expression was assessed at three different
time points: 6 h post-surgery, after a latency of 1 d, and after 7 d. Four runs of Luminex
assay were performed, one of which was excluded from further analysis due to low
expression values (less than 10% of miRNAs showed signals considerably (>3fold)
above background signalling). Per run and condition, RNA from 12 animals was pooled.
As for the three runs included in further analysis, cluster analysis of the expression
profile showed the 7 d samples as most divergent from control samples, with the
ipsilateral expression pattern being more distinct than the contralateral (Fig. 6). Hence,
further experiments focus exclusively on expression after 7 d.
Cluster Tree
0,0 0,1 0,2 0,3 0,4 0,5 0,6 0,7 0,8
Distances
7d ipsi
7d contra
1d ipsi
1d contra
naive
6h contra
6h ipsi
Figure 6: Condition-based cluster analysis of miRNA assay data. X-axis denotes
distance. The graph shows an increasing distance over time with a clear distinction
bilaterally after 7 d (distance metric Euclidean distance; average linking method.
n=3, 12 mice per run)
28
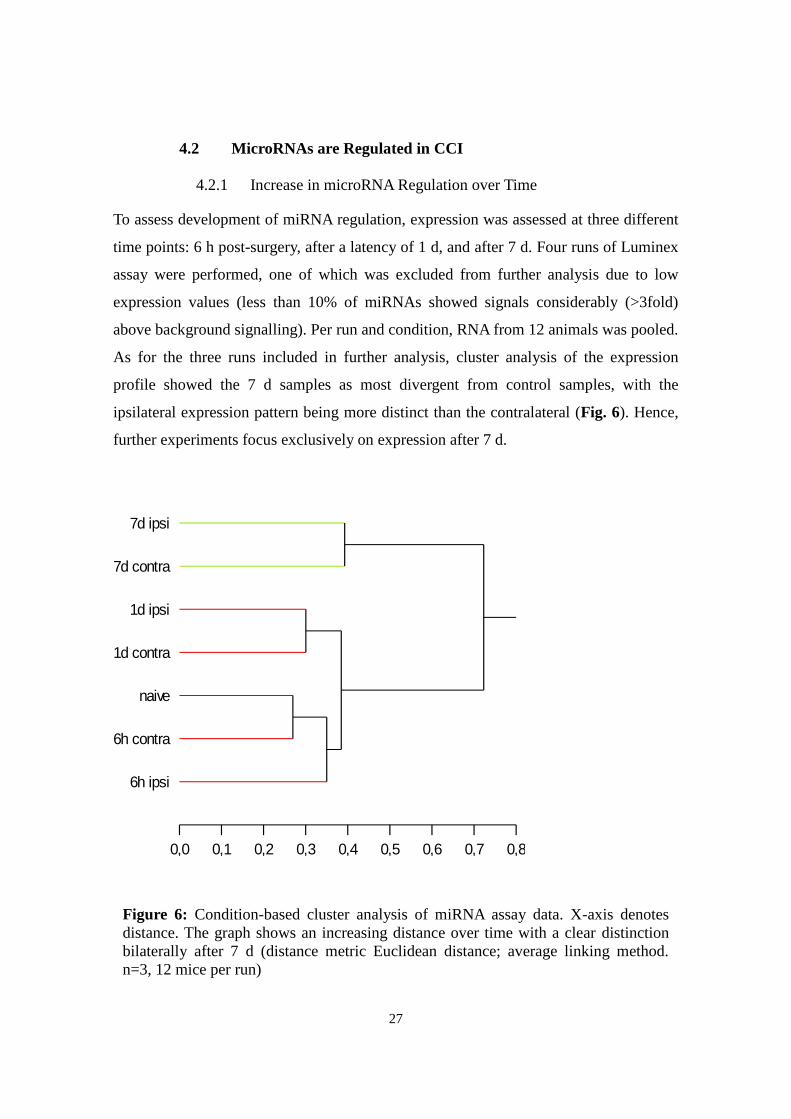
4.2.2 Predominantly Downregulation of microRNAs
The number of regulated miRNAs in neuropathic neurons varied considerably between
runs. Only a few miRNAs showed a consistent and distinctive up- or downregulation
(>twofold) against naïve DRG tissue. Few miRNAs were upregulated compared to the
number of downregulated genes. Table 3 gives an overview of relevant miRNAs;
included are all miRNAs downregulated in 7 d ipsilateral compared to naïve DRG in at
least one run. In table 4, miRNAs that either show a >twofold upregulation in 7 d
ipsilateral against naïve DRG or an upregulation <twofold plus a discrepancy between
ipsi- and contralateral tissue are included.
RUN 1 RUN 2 RUN 3
7 d ipsi
7 d contra
7 d ipsi
7 d contra
7 d ipsi
7 d contra
let-7a 0.43 0.45 let-7a 0.48 0.50
let-7c 0.40 0.47 let-7c 0.48 0.50
let-7f 0.48 0.60 let-7f 0.47 0.48
miR-1 0.46 0.44 miR-1 0.50 0.45
miR-103 0.45 0.60
miR-107 0.44 0.60
miR-124 0.33 0.59 miR-124 0.28 0.40 miR-124 0.39 0.53
miR-126-5p 0.46 0.57
miR-126-5p 0.50 0.49
miR-128a 0.47 0.64 miR-128a 0.43 0.59
miR-128b 0.33 0.49 miR-128b 0.35 0.57
miR-130a 0.49 0.67
miR-136 0.41 0.51 miR-136 0.43 0.54
miR-137 0.36 0.58 miR-137 0.24 0.30 miR-137 0.32 0.34
miR-138 0.41 0.50 miR-138 0.41 0.60 miR-138 0.50 0.63
miR-16 0.38 0.51
miR-181b 0.50 0.72
miR-182 0.50 0.51
miR-183 0.47 0.73 miR-183 0.42 0.53 miR-183 0.50 0.54
miR-193 0.30 0.37
miR-24 0.36 0.51
miR-26a 0.49 0.58
miR-26b 0.43 0.50 miR-26b 0.45 0.46
miR-29a 0.50 0.55
miR-29b 0.42 0.54 miR-29b 0.28 0.44 miR-29b 0.34 0.48
miR-29c 0.37 0.48 miR-29c 0.40 0.50
miR-30d 0.40 0.52 miR-30d 0.43 0.54
miR-320 0.34 0.43
miR-33 0.43 0.55 miR-33 0.32 0.38 miR-338-3p 0.49 0.72
miR-34a 0.45 0.61
miR-382 0.49 0.55 miR-382 0.38 0.44
miR-674 0.46 0.75 miR-674 0.46 0.63
29
miR-700 0.49 0.74
miR-7b 0.35 0.51 miR-7b 0.38 0.49
miR-7d 0.42 0.57 miR-7d 0.48 0.53
miR-96 0.48 0.57
RUN 1 RUN 2 RUN 3
7 d ipsi 7 d contra 7 d ipsi 7 d contra 7 d ipsi 7 d contra
miR-215 2.05 1.12
(none) miR-27b 1.46 0.65 miR-27b 1.72 0.70
miR-505 1.37 0.87 miR-505 1.85 1.20
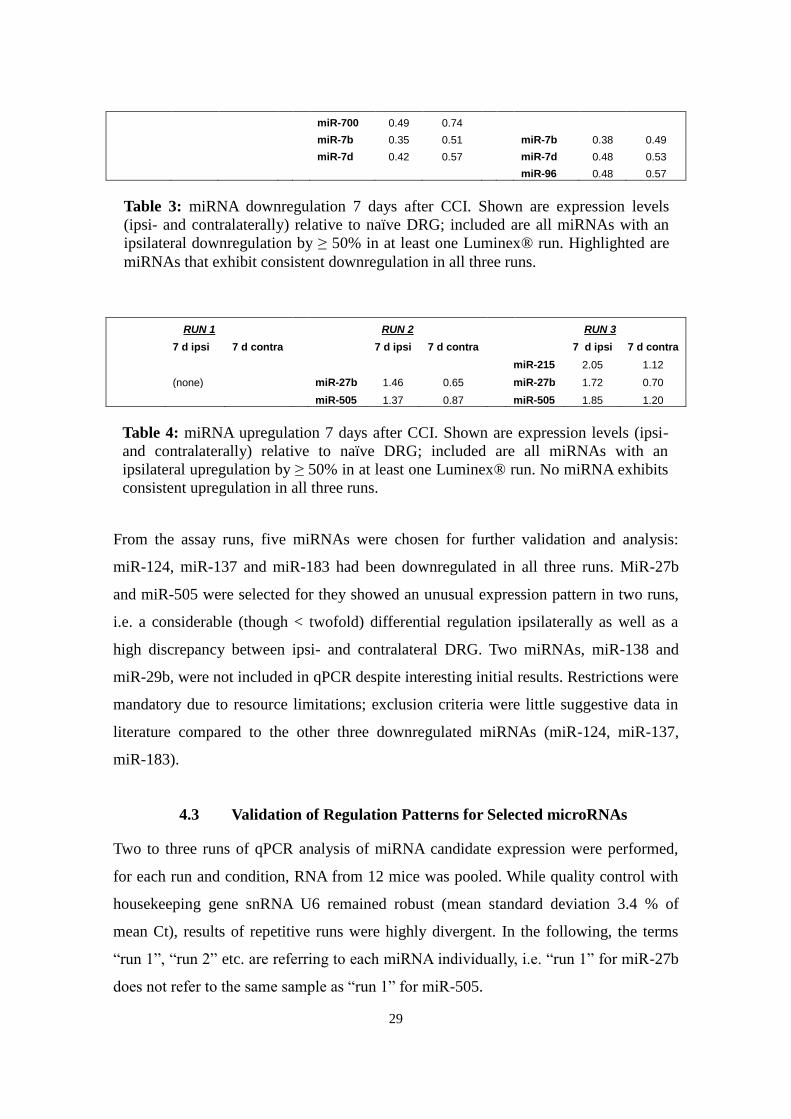
From the assay runs, five miRNAs were chosen for further validation and analysis:
miR-124, miR-137 and miR-183 had been downregulated in all three runs. MiR-27b
and miR-505 were selected for they showed an unusual expression pattern in two runs,
i.e. a considerable (though < twofold) differential regulation ipsilaterally as well as a
high discrepancy between ipsi- and contralateral DRG. Two miRNAs, miR-138 and
miR-29b, were not included in qPCR despite interesting initial results. Restrictions were
mandatory due to resource limitations; exclusion criteria were little suggestive data in
literature compared to the other three downregulated miRNAs (miR-124, miR-137,
miR-183).
4.3 Validation of Regulation Patterns for Selected microRNAs
Two to three runs of qPCR analysis of miRNA candidate expression were performed,
for each run and condition, RNA from 12 mice was pooled. While quality control with
housekeeping gene snRNA U6 remained robust (mean standard deviation 3.4 % of
mean Ct), results of repetitive runs were highly divergent. In the following, the terms
“run 1”, “run 2” etc. are referring to each miRNA individually, i.e. “run 1” for miR-27b
does not refer to the same sample as “run 1” for miR-505.
Table 4: miRNA upregulation 7 days after CCI. Shown are expression levels (ipsi-
and contralaterally) relative to naïve DRG; included are all miRNAs with an
ipsilateral upregulation by ≥ 50% in at least one Luminex® run. No miRNA exhibits
consistent upregulation in all three runs.
Table 3: miRNA downregulation 7 days after CCI. Shown are expression levels
(ipsi- and contralaterally) relative to naïve DRG; included are all miRNAs with an
ipsilateral downregulation by ≥ 50% in at least one Luminex® run. Highlighted are
miRNAs that exhibit consistent downregulation in all three runs.
30
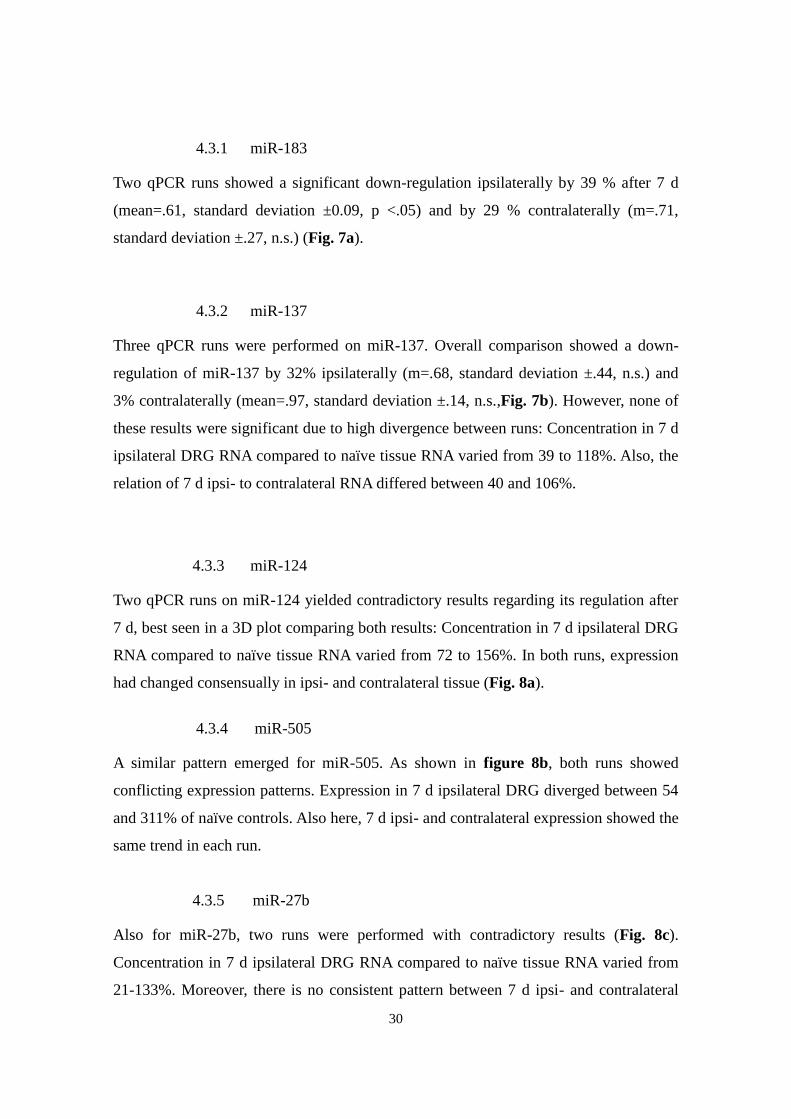
4.3.1 miR-183
Two qPCR runs showed a significant down-regulation ipsilaterally by 39 % after 7 d
(mean=.61, standard deviation ±0.09, p <.05) and by 29 % contralaterally (m=.71,
standard deviation ±.27, n.s.) (Fig. 7a).
4.3.2 miR-137
Three qPCR runs were performed on miR-137. Overall comparison showed a down-
regulation of miR-137 by 32% ipsilaterally (m=.68, standard deviation ±.44, n.s.) and
3% contralaterally (mean=.97, standard deviation ±.14, n.s.,Fig. 7b). However, none of
these results were significant due to high divergence between runs: Concentration in 7 d
ipsilateral DRG RNA compared to naïve tissue RNA varied from 39 to 118%. Also, the
relation of 7 d ipsi- to contralateral RNA differed between 40 and 106%.
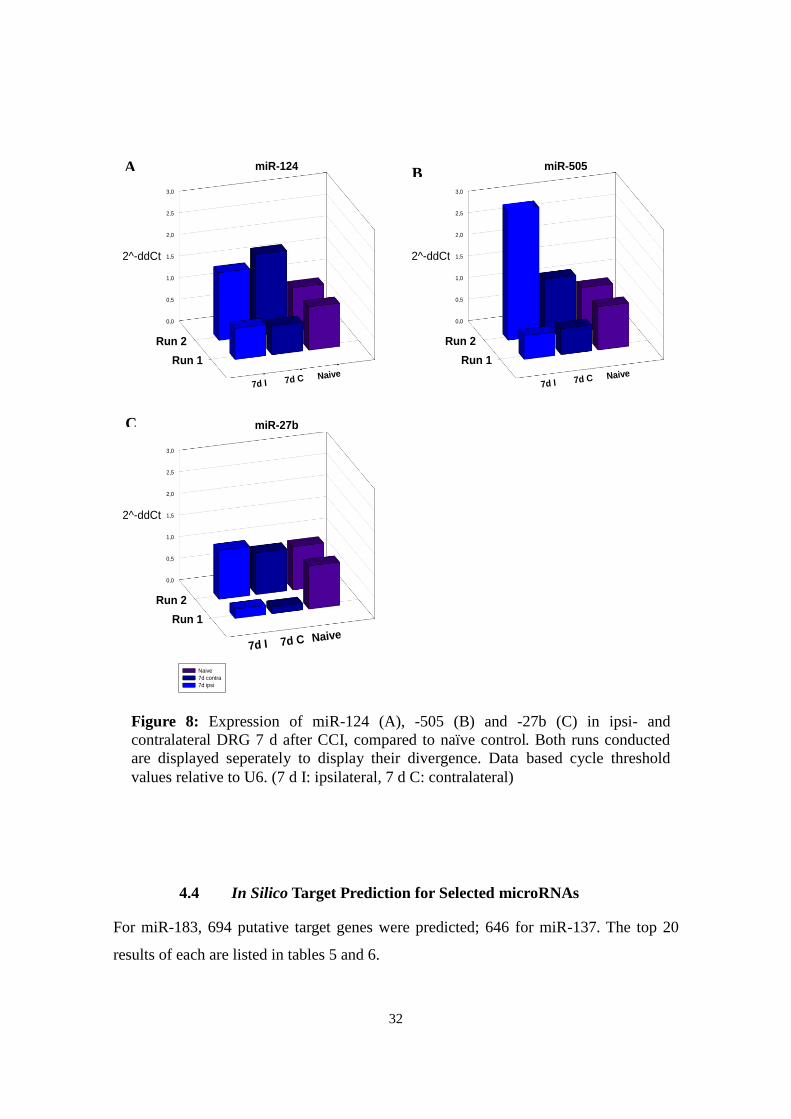
4.3.3 miR-124
Two qPCR runs on miR-124 yielded contradictory results regarding its regulation after
7 d, best seen in a 3D plot comparing both results: Concentration in 7 d ipsilateral DRG
RNA compared to naïve tissue RNA varied from 72 to 156%. In both runs, expression
had changed consensually in ipsi- and contralateral tissue (Fig. 8a).
4.3.4 miR-505
A similar pattern emerged for miR-505. As shown in figure 8b, both runs showed
conflicting expression patterns. Expression in 7 d ipsilateral DRG diverged between 54
and 311% of naïve controls. Also here, 7 d ipsi- and contralateral expression showed the
same trend in each run.
4.3.5 miR-27b
Also for miR-27b, two runs were performed with contradictory results (Fig. 8c).
Concentration in 7 d ipsilateral DRG RNA compared to naïve tissue RNA varied from
21-133%. Moreover, there is no consistent pattern between 7 d ipsi- and contralateral
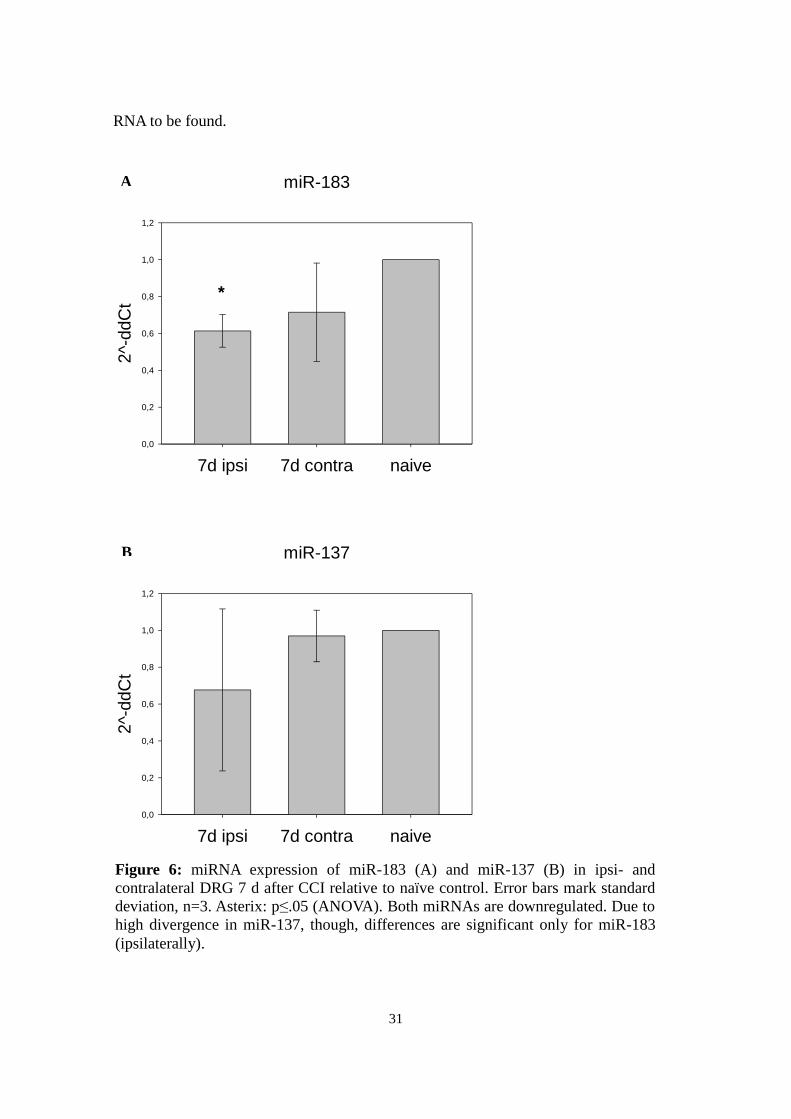
31
RNA to be found.
miR-137
7d ipsi 7d contra naive
2^-
ddC
t
0,0
0,2
0,4
0,6
0,8
1,0
1,2
miR-183
7d ipsi 7d contra naive
2^-
ddC
t
0,0
0,2
0,4
0,6
0,8
1,0
1,2
*
A
Figure 6: miRNA expression of miR-183 (A) and miR-137 (B) in ipsi- and
contralateral DRG 7 d after CCI relative to naïve control. Error bars mark standard
deviation, n=3. Asterix: p≤.05 (ANOVA). Both miRNAs are downregulated. Due to
high divergence in miR-137, though, differences are significant only for miR-183
(ipsilaterally).
B
32
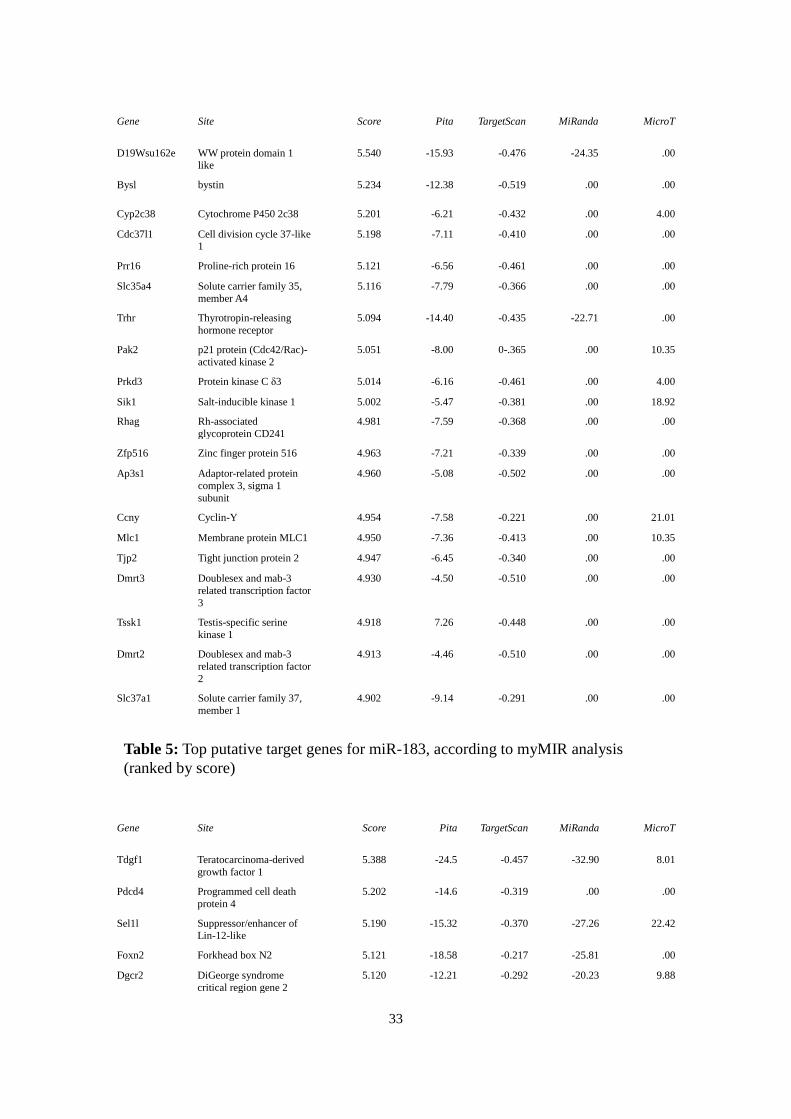
4.4 In Silico Target Prediction for Selected microRNAs
For miR-183, 694 putative target genes were predicted; 646 for miR-137. The top 20
results of each are listed in tables 5 and 6.
0,0
0,5
1,0
1,5
2,0
2,5
3,0
Run 1
Run 2
Naive7d C
7d I
2^-ddCt
miR-124
naive
7d contra
7d ipsi
0,0
0,5
1,0
1,5
2,0
2,5
3,0
Run 1
Run 2
Naive7d C
7d I
2^-ddCt
miR-505
Naive
7d contra
7d ipsi
0,0
0,5
1,0
1,5
2,0
2,5
3,0
Run 1
Run 2
Naive7d C
7d I
2^-ddCt
miR-27b
Naive
7d contra
7d ipsi
A B
C
Figure 8: Expression of miR-124 (A), -505 (B) and -27b (C) in ipsi- and
contralateral DRG 7 d after CCI, compared to naïve control. Both runs conducted
are displayed seperately to display their divergence. Data based cycle threshold
values relative to U6. (7 d I: ipsilateral, 7 d C: contralateral)
33
Gene
Site Score Pita TargetScan MiRanda MicroT
D19Wsu162e WW protein domain 1 like
5.540 -15.93 -0.476 -24.35 .00
Bysl bystin 5.234 -12.38 -0.519 .00 .00
Cyp2c38 Cytochrome P450 2c38 5.201 -6.21 -0.432 .00 4.00
Cdc37l1 Cell division cycle 37-like 1
5.198 -7.11 -0.410 .00 .00
Prr16 Proline-rich protein 16 5.121 -6.56 -0.461 .00 .00
Slc35a4 Solute carrier family 35,
member A4
5.116 -7.79 -0.366 .00 .00
Trhr Thyrotropin-releasing
hormone receptor
5.094 -14.40 -0.435 -22.71 .00
Pak2 p21 protein (Cdc42/Rac)-
activated kinase 2
5.051 -8.00 0-.365 .00 10.35
Prkd3 Protein kinase C δ3 5.014 -6.16 -0.461 .00 4.00
Sik1 Salt-inducible kinase 1 5.002 -5.47 -0.381 .00 18.92
Rhag Rh-associated
glycoprotein CD241
4.981 -7.59 -0.368 .00 .00
Zfp516 Zinc finger protein 516 4.963 -7.21 -0.339 .00 .00
Ap3s1 Adaptor-related protein
complex 3, sigma 1
subunit
4.960 -5.08 -0.502 .00 .00
Ccny Cyclin-Y 4.954 -7.58 -0.221 .00 21.01
Mlc1 Membrane protein MLC1 4.950 -7.36 -0.413 .00 10.35
Tjp2 Tight junction protein 2 4.947 -6.45 -0.340 .00 .00
Dmrt3 Doublesex and mab-3
related transcription factor
3
4.930 -4.50 -0.510 .00 .00
Tssk1 Testis-specific serine
kinase 1
4.918 7.26 -0.448 .00 .00
Dmrt2 Doublesex and mab-3
related transcription factor
2
4.913 -4.46 -0.510 .00 .00
Slc37a1 Solute carrier family 37,
member 1
4.902 -9.14 -0.291 .00 .00
Gene
Site Score Pita TargetScan MiRanda MicroT
Tdgf1 Teratocarcinoma-derived
growth factor 1
5.388 -24.5 -0.457 -32.90 8.01
Pdcd4 Programmed cell death
protein 4
5.202 -14.6 -0.319 .00 .00
Sel1l Suppressor/enhancer of Lin-12-like
5.190 -15.32 -0.370 -27.26 22.42
Foxn2 Forkhead box N2 5.121 -18.58 -0.217 -25.81 .00
Dgcr2 DiGeorge syndrome
critical region gene 2
5.120 -12.21 -0.292 -20.23 9.88
Table 5: Top putative target genes for miR-183, according to myMIR analysis
(ranked by score)
34
Zdhhc6 Zinc finger DHHC-type containing 6
5.045 -11.72 -0.228 .00 8.16
Npc2 Niemann-Pick disease, type C2
4.983 -13.28 -0.443 -20.90 15.62
Arhgap26 Rho GTPase activating
protein 26
4.934 -11.51 -0.303 .00 .00
Nr3c1 Nuclear receptor subfamily
3, group C, member 1 (glucocorticoid receptor)
4.901 -10.07 -0.252 .00 12.45
Kif2a Kinesin heavy chain
member 2A
4.890 -11.31 -0.360 -20.96 14.16
Rnf138 Ring finger protein 138,
E3 ubiquitin protein ligase
4.865 -11.02 -0.282 .00 .00
Tcf7l2 Transcription factor 7-like
2
4.791 -11.27 -0.210 -20.12 .00
Slc16a12 Solute carrier family 16,
member 12
4.785 -8.36 -0.332 .00 1.00
Cd300e CD300e, immune receptor expressed by myloid cells
(IREM)-2
4.780 -14.17 -0.359 -21.54 6.01
Clic5 Chloride intracellular
channel protein 5
4.771 -14.95 -0.226 .00 .00
Arhgap12 Rho GTPase activating protein 12
4.769 -6.46 -0.431 .00 22.82
Cep97 Centrosomal protein of 97 kDa
4.767 -12.13 -0.450 .00 .00
Ss18 Synovial sarcoma translocation, chromosome
18
4.761 -7.34 -0.389 .00 6.01
Zfpm2 Zinc finger protein, FOG family member 2
4.745 -11.85 -0.294 -20.97 .00
Csf1r Colony stimulating factor
1 receptor, CD115
4.732 -13,88 0.000 -24.79 .00
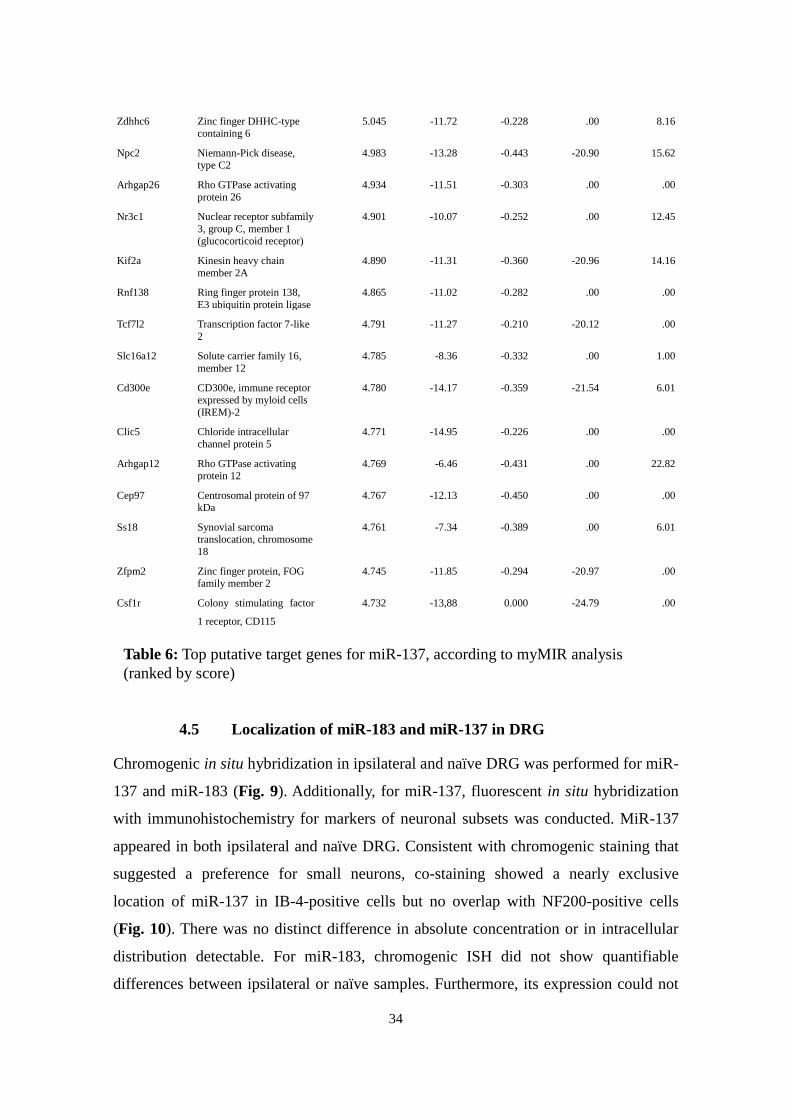
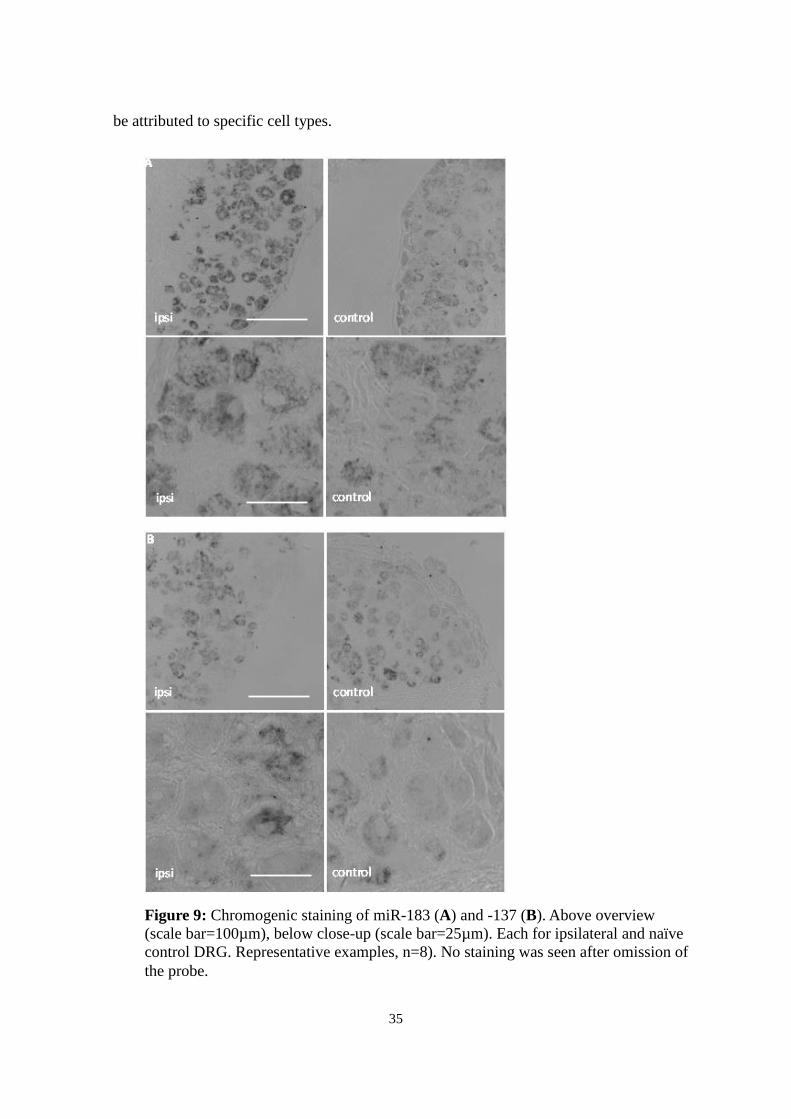
4.5 Localization of miR-183 and miR-137 in DRG
Chromogenic in situ hybridization in ipsilateral and naïve DRG was performed for miR-
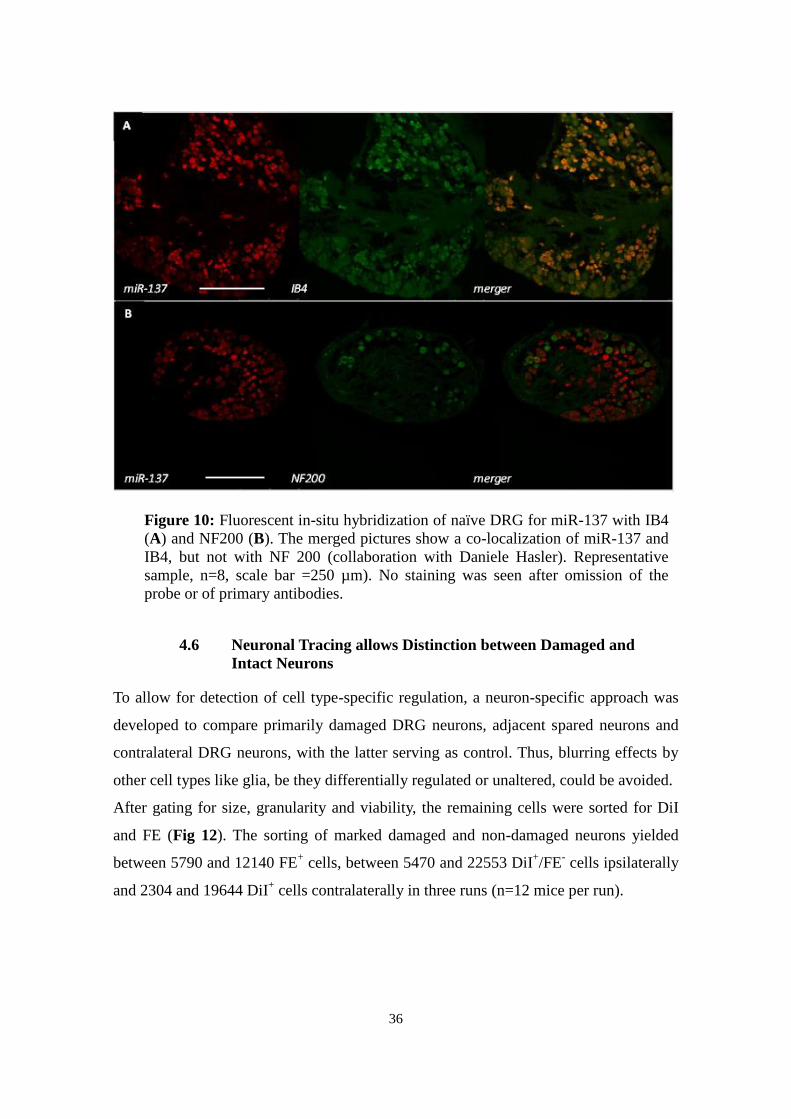
137 and miR-183 (Fig. 9). Additionally, for miR-137, fluorescent in situ hybridization
with immunohistochemistry for markers of neuronal subsets was conducted. MiR-137
appeared in both ipsilateral and naïve DRG. Consistent with chromogenic staining that
suggested a preference for small neurons, co-staining showed a nearly exclusive
location of miR-137 in IB-4-positive cells but no overlap with NF200-positive cells
(Fig. 10). There was no distinct difference in absolute concentration or in intracellular
distribution detectable. For miR-183, chromogenic ISH did not show quantifiable
differences between ipsilateral or naïve samples. Furthermore, its expression could not
Table 6: Top putative target genes for miR-137, according to myMIR analysis
(ranked by score)
35
be attributed to specific cell types.
Figure 9: Chromogenic staining of miR-183 (A) and -137 (B). Above overview
(scale bar=100µm), below close-up (scale bar=25µm). Each for ipsilateral and naïve
control DRG. Representative examples, n=8). No staining was seen after omission of
the probe.
36
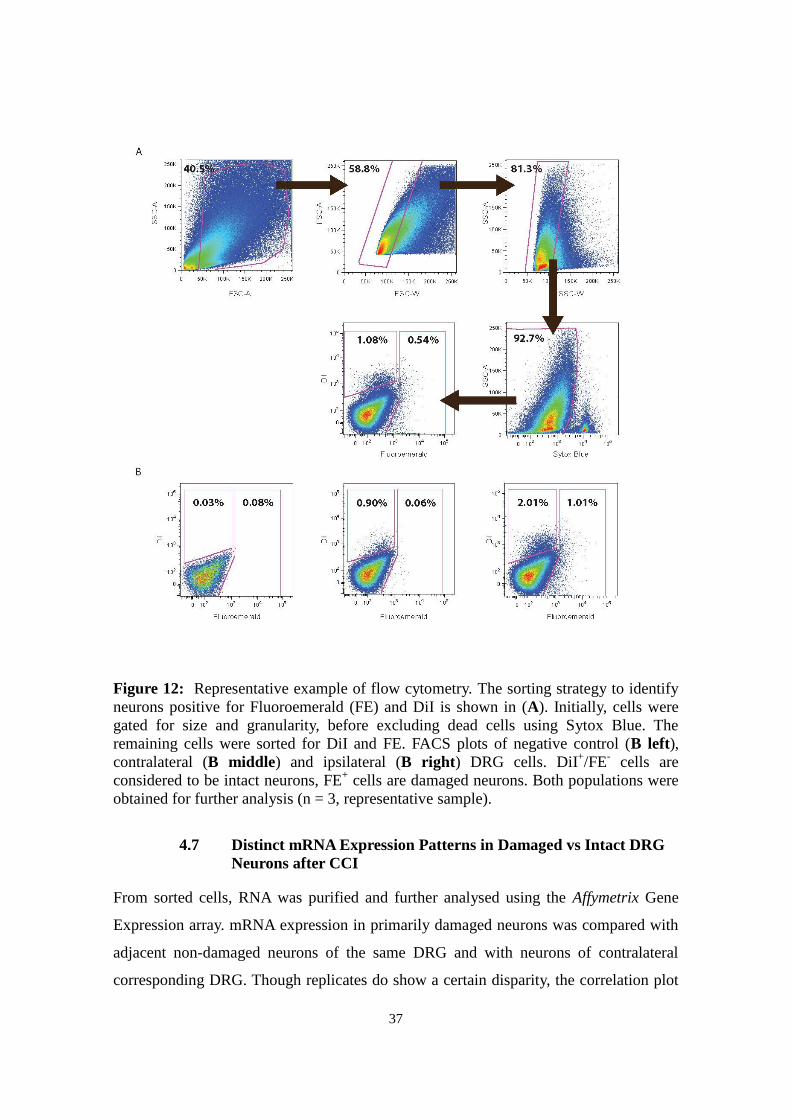
4.6 Neuronal Tracing allows Distinction between Damaged and
Intact Neurons
To allow for detection of cell type-specific regulation, a neuron-specific approach was
developed to compare primarily damaged DRG neurons, adjacent spared neurons and
contralateral DRG neurons, with the latter serving as control. Thus, blurring effects by
other cell types like glia, be they differentially regulated or unaltered, could be avoided.
After gating for size, granularity and viability, the remaining cells were sorted for DiI
and FE (Fig 12). The sorting of marked damaged and non-damaged neurons yielded
between 5790 and 12140 FE+ cells, between 5470 and 22553 DiI
+/FE
- cells ipsilaterally
and 2304 and 19644 DiI+ cells contralaterally in three runs (n=12 mice per run).
Figure 10: Fluorescent in-situ hybridization of naïve DRG for miR-137 with IB4
(A) and NF200 (B). The merged pictures show a co-localization of miR-137 and
IB4, but not with NF 200 (collaboration with Daniele Hasler). Representative
sample, n=8, scale bar =250 µm). No staining was seen after omission of the
probe or of primary antibodies.
37
Figure 12: Representative example of flow cytometry. The sorting strategy to identify
neurons positive for Fluoroemerald (FE) and DiI is shown in (A). Initially, cells were
gated for size and granularity, before excluding dead cells using Sytox Blue. The
remaining cells were sorted for DiI and FE. FACS plots of negative control (B left),
contralateral (B middle) and ipsilateral (B right) DRG cells. DiI+/FE
- cells are
considered to be intact neurons, FE+ cells are damaged neurons. Both populations were
obtained for further analysis (n = 3, representative sample).
4.7 Distinct mRNA Expression Patterns in Damaged vs Intact DRG
Neurons after CCI
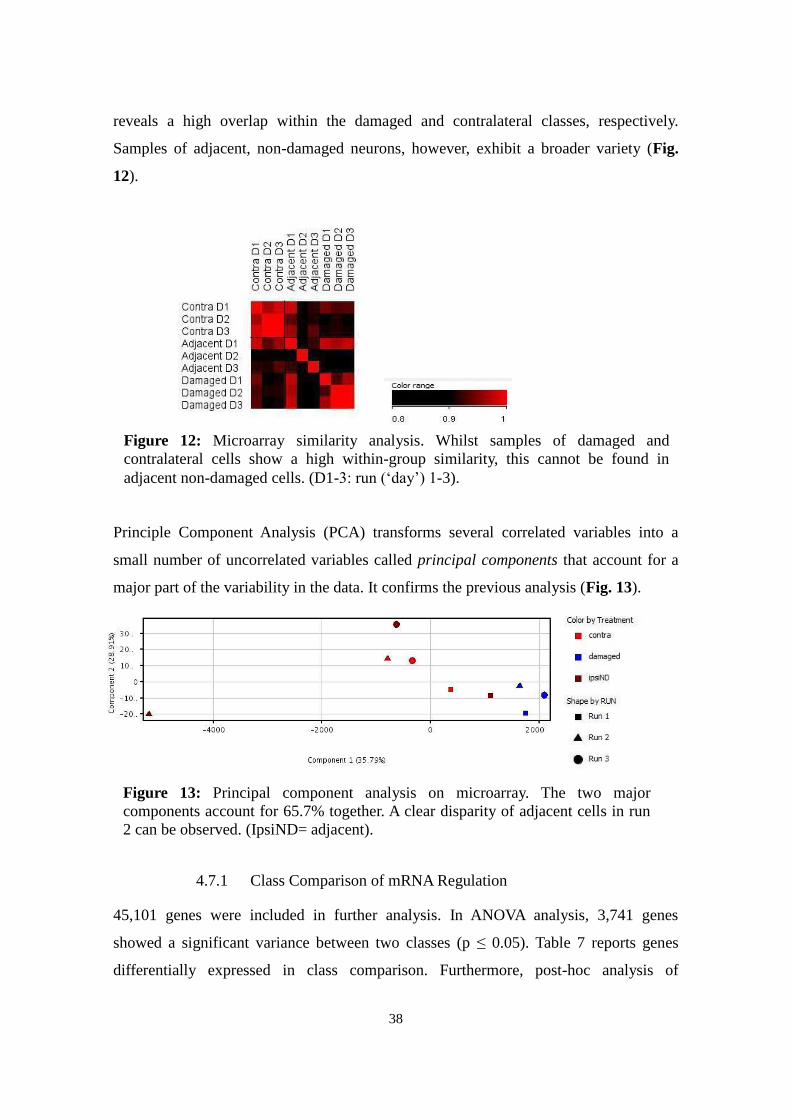
From sorted cells, RNA was purified and further analysed using the Affymetrix Gene
Expression array. mRNA expression in primarily damaged neurons was compared with
adjacent non-damaged neurons of the same DRG and with neurons of contralateral
corresponding DRG. Though replicates do show a certain disparity, the correlation plot
38
Figure 12: Microarray similarity analysis. Whilst samples of damaged and
contralateral cells show a high within-group similarity, this cannot be found in
adjacent non-damaged cells. (D1-3: run („day‟) 1-3).
reveals a high overlap within the damaged and contralateral classes, respectively.
Samples of adjacent, non-damaged neurons, however, exhibit a broader variety (Fig.
12).
Principle Component Analysis (PCA) transforms several correlated variables into a
small number of uncorrelated variables called principal components that account for a
major part of the variability in the data. It confirms the previous analysis (Fig. 13).
4.7.1 Class Comparison of mRNA Regulation
45,101 genes were included in further analysis. In ANOVA analysis, 3,741 genes
showed a significant variance between two classes (p ≤ 0.05). Table 7 reports genes
differentially expressed in class comparison. Furthermore, post-hoc analysis of
Figure 13: Principal component analysis on microarray. The two major
components account for 65.7% together. A clear disparity of adjacent cells in run
2 can be observed. (IpsiND= adjacent).
39
intersections shows a high overlap of the contra-vs-damaged and the adjacent-vs-
damaged comparisons: 1014 genes are differentially regulated in damaged neurons
compared to both contralateral and adjacent neurons. This number is considerably
higher than for contralateral (377) and adjacent (332) neurons and underlines the unique
expression pattern.
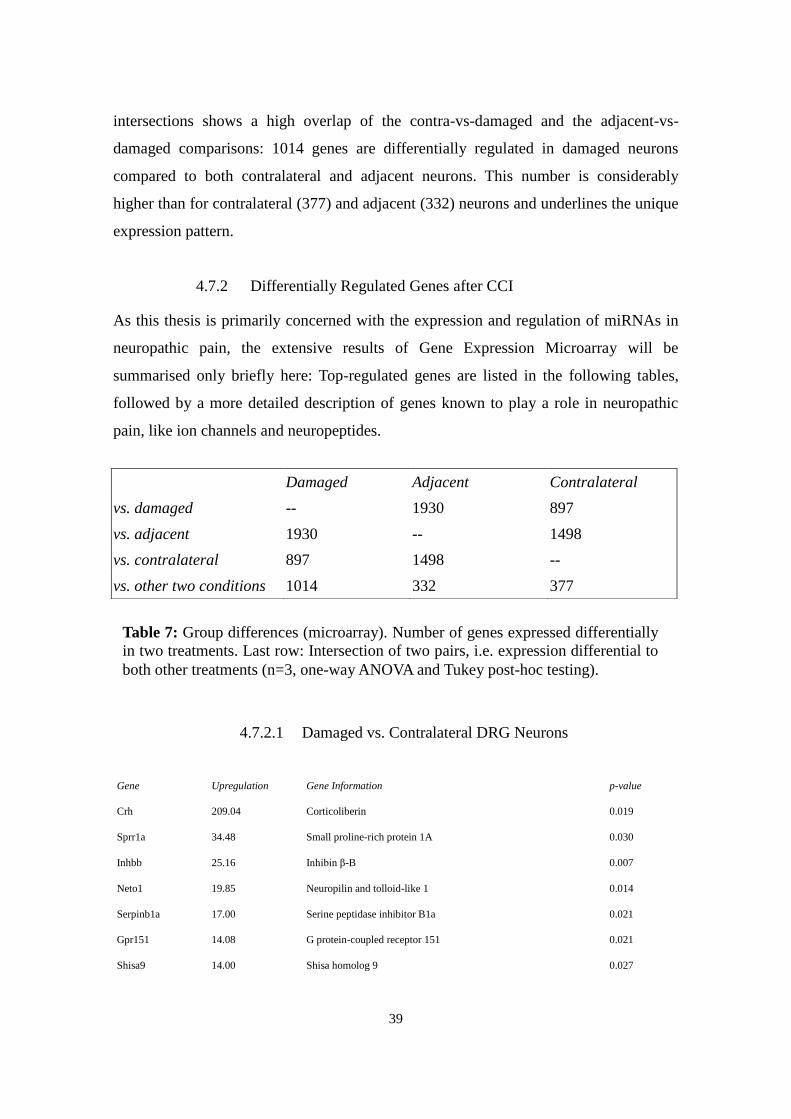
4.7.2 Differentially Regulated Genes after CCI
As this thesis is primarily concerned with the expression and regulation of miRNAs in
neuropathic pain, the extensive results of Gene Expression Microarray will be
summarised only briefly here: Top-regulated genes are listed in the following tables,
followed by a more detailed description of genes known to play a role in neuropathic
pain, like ion channels and neuropeptides.
4.7.2.1 Damaged vs. Contralateral DRG Neurons
Gene Upregulation Gene Information p-value
Crh 209.04 Corticoliberin 0.019
Sprr1a 34.48 Small proline-rich protein 1A 0.030
Inhbb 25.16 Inhibin β-B 0.007
Neto1 19.85 Neuropilin and tolloid-like 1 0.014
Serpinb1a 17.00 Serine peptidase inhibitor B1a 0.021
Gpr151 14.08 G protein-coupled receptor 151 0.021
Shisa9 14.00 Shisa homolog 9 0.027
Damaged Adjacent Contralateral
vs. damaged -- 1930 897
vs. adjacent 1930 -- 1498
vs. contralateral 897 1498 --
vs. other two conditions 1014 332 377
Table 7: Group differences (microarray). Number of genes expressed differentially
in two treatments. Last row: Intersection of two pairs, i.e. expression differential to
both other treatments (n=3, one-way ANOVA and Tukey post-hoc testing).
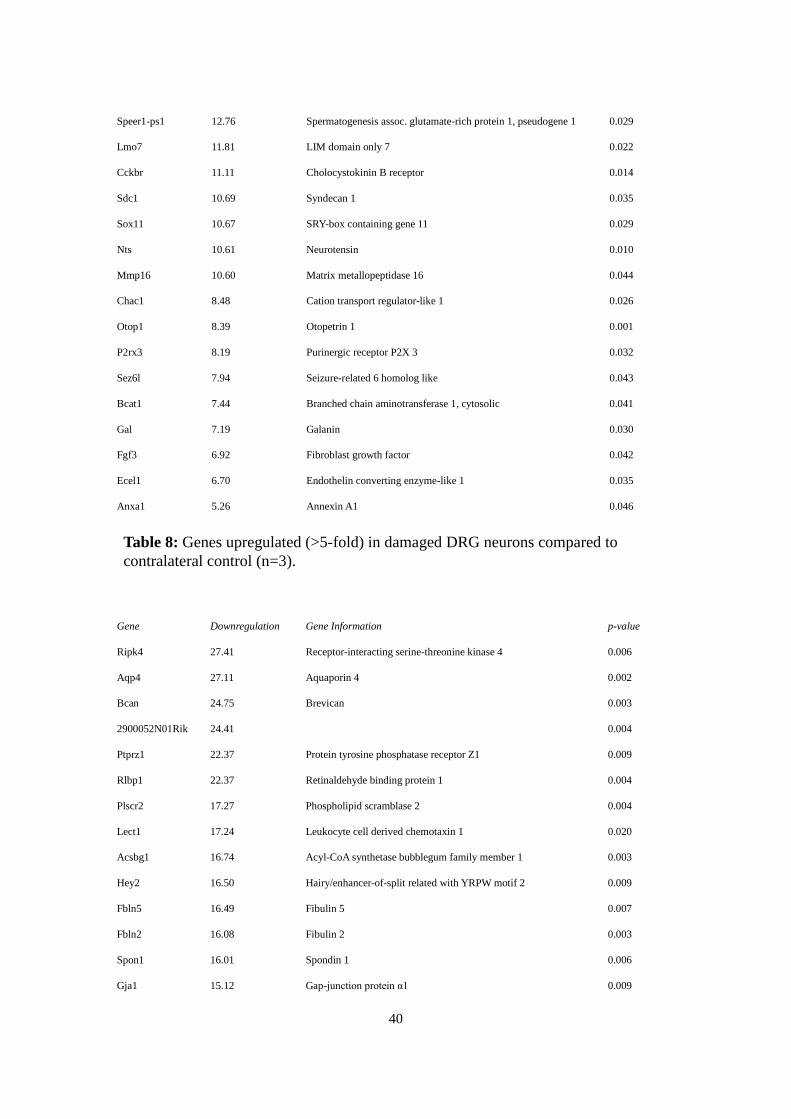
40
Speer1-ps1 12.76 Spermatogenesis assoc. glutamate-rich protein 1, pseudogene 1 0.029
Lmo7 11.81 LIM domain only 7 0.022
Cckbr 11.11 Cholocystokinin B receptor 0.014
Sdc1 10.69 Syndecan 1 0.035
Sox11 10.67 SRY-box containing gene 11 0.029
Nts 10.61 Neurotensin 0.010
Mmp16 10.60 Matrix metallopeptidase 16 0.044
Chac1 8.48 Cation transport regulator-like 1 0.026
Otop1 8.39 Otopetrin 1 0.001
P2rx3 8.19 Purinergic receptor P2X 3 0.032
Sez6l 7.94 Seizure-related 6 homolog like 0.043
Bcat1 7.44 Branched chain aminotransferase 1, cytosolic 0.041
Gal 7.19 Galanin 0.030
Fgf3 6.92 Fibroblast growth factor 0.042
Ecel1 6.70 Endothelin converting enzyme-like 1 0.035
Anxa1 5.26 Annexin A1 0.046
Gene Downregulation Gene Information p-value
Ripk4 27.41 Receptor-interacting serine-threonine kinase 4 0.006
Aqp4 27.11 Aquaporin 4 0.002
Bcan 24.75 Brevican 0.003
2900052N01Rik 24.41 0.004
Ptprz1 22.37 Protein tyrosine phosphatase receptor Z1 0.009
Rlbp1 22.37 Retinaldehyde binding protein 1 0.004
Plscr2 17.27 Phospholipid scramblase 2 0.004
Lect1 17.24 Leukocyte cell derived chemotaxin 1 0.020
Acsbg1 16.74 Acyl-CoA synthetase bubblegum family member 1 0.003
Hey2 16.50 Hairy/enhancer-of-split related with YRPW motif 2 0.009
Fbln5 16.49 Fibulin 5 0.007
Fbln2 16.08 Fibulin 2 0.003
Spon1 16.01 Spondin 1 0.006
Gja1 15.12 Gap-junction protein α1 0.009
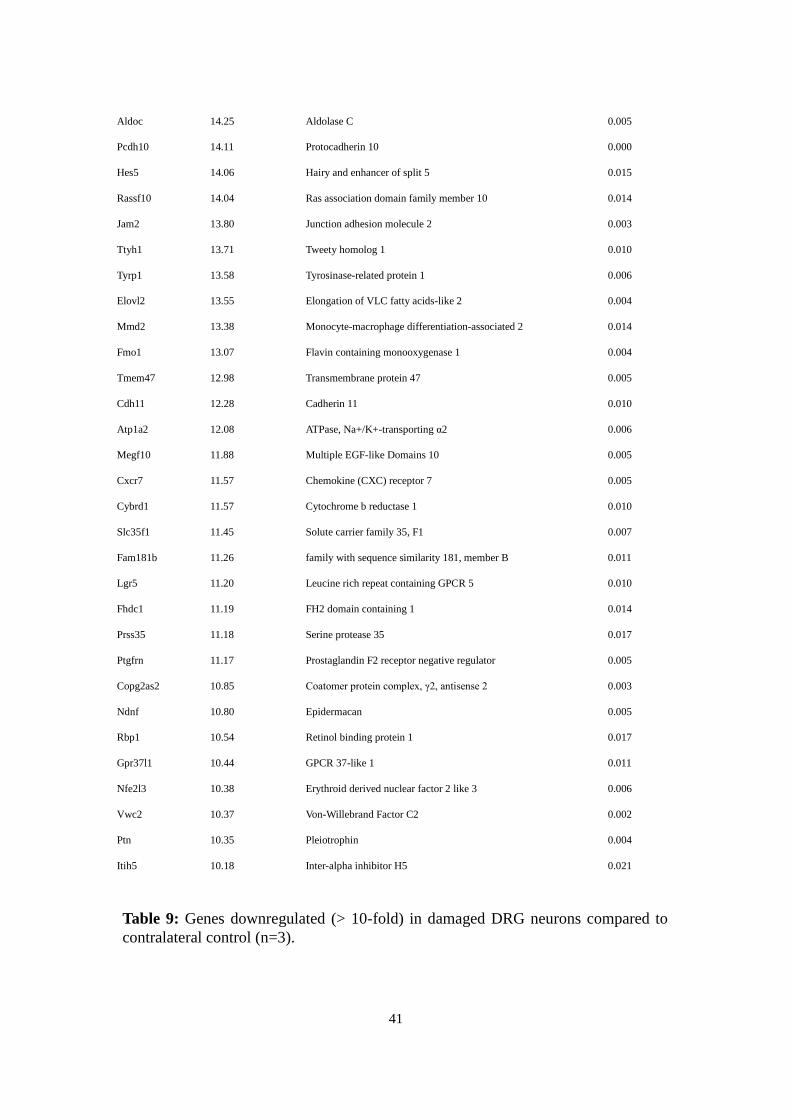
Table 8: Genes upregulated (>5-fold) in damaged DRG neurons compared to
contralateral control (n=3).
41
Aldoc 14.25 Aldolase C 0.005
Pcdh10 14.11 Protocadherin 10 0.000
Hes5 14.06 Hairy and enhancer of split 5 0.015
Rassf10 14.04 Ras association domain family member 10 0.014
Jam2 13.80 Junction adhesion molecule 2 0.003
Ttyh1 13.71 Tweety homolog 1 0.010
Tyrp1 13.58 Tyrosinase-related protein 1 0.006
Elovl2 13.55 Elongation of VLC fatty acids-like 2 0.004
Mmd2 13.38 Monocyte-macrophage differentiation-associated 2 0.014
Fmo1 13.07 Flavin containing monooxygenase 1 0.004
Tmem47 12.98 Transmembrane protein 47 0.005
Cdh11 12.28 Cadherin 11 0.010
Atp1a2 12.08 ATPase, Na+/K+-transporting α2 0.006
Megf10 11.88 Multiple EGF-like Domains 10 0.005
Cxcr7 11.57 Chemokine (CXC) receptor 7 0.005
Cybrd1 11.57 Cytochrome b reductase 1 0.010
Slc35f1 11.45 Solute carrier family 35, F1 0.007
Fam181b 11.26 family with sequence similarity 181, member B 0.011
Lgr5 11.20 Leucine rich repeat containing GPCR 5 0.010
Fhdc1 11.19 FH2 domain containing 1 0.014
Prss35 11.18 Serine protease 35 0.017
Ptgfrn 11.17 Prostaglandin F2 receptor negative regulator 0.005
Copg2as2 10.85 Coatomer protein complex, γ2, antisense 2 0.003
Ndnf 10.80 Epidermacan 0.005
Rbp1 10.54 Retinol binding protein 1 0.017
Gpr37l1 10.44 GPCR 37-like 1 0.011
Nfe2l3 10.38 Erythroid derived nuclear factor 2 like 3 0.006
Vwc2 10.37 Von-Willebrand Factor C2 0.002
Ptn 10.35 Pleiotrophin 0.004
Itih5 10.18 Inter-alpha inhibitor H5 0.021
Table 9: Genes downregulated (> 10-fold) in damaged DRG neurons compared to
contralateral control (n=3).
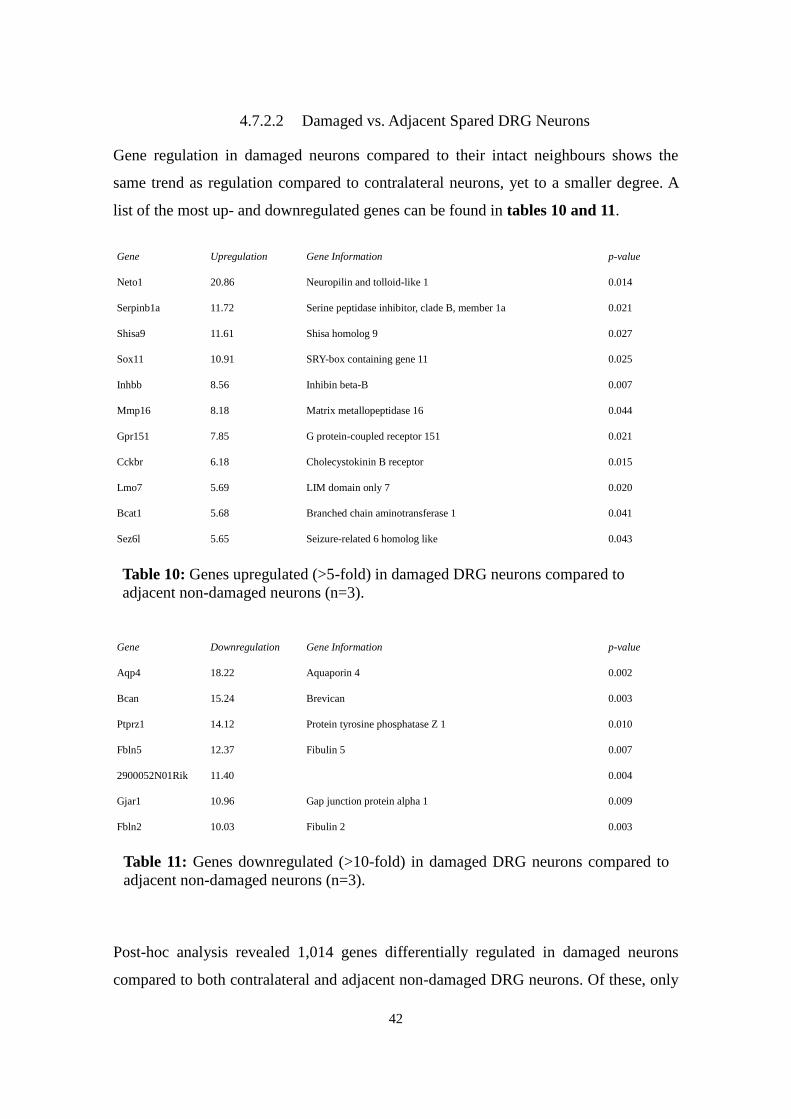
42
4.7.2.2 Damaged vs. Adjacent Spared DRG Neurons
Gene regulation in damaged neurons compared to their intact neighbours shows the
same trend as regulation compared to contralateral neurons, yet to a smaller degree. A
list of the most up- and downregulated genes can be found in tables 10 and 11.
Gene Upregulation Gene Information p-value
Neto1 20.86 Neuropilin and tolloid-like 1 0.014
Serpinb1a 11.72 Serine peptidase inhibitor, clade B, member 1a 0.021
Shisa9 11.61 Shisa homolog 9 0.027
Sox11 10.91 SRY-box containing gene 11 0.025
Inhbb 8.56 Inhibin beta-B 0.007
Mmp16 8.18 Matrix metallopeptidase 16 0.044
Gpr151 7.85 G protein-coupled receptor 151 0.021
Cckbr 6.18 Cholecystokinin B receptor 0.015
Lmo7 5.69 LIM domain only 7 0.020
Bcat1 5.68 Branched chain aminotransferase 1 0.041
Sez6l 5.65 Seizure-related 6 homolog like 0.043
Gene Downregulation Gene Information p-value
Aqp4 18.22 Aquaporin 4 0.002
Bcan 15.24 Brevican 0.003
Ptprz1 14.12 Protein tyrosine phosphatase Z 1 0.010
Fbln5 12.37 Fibulin 5 0.007
2900052N01Rik 11.40 0.004
Gjar1 10.96 Gap junction protein alpha 1 0.009
Fbln2 10.03 Fibulin 2 0.003
Post-hoc analysis revealed 1,014 genes differentially regulated in damaged neurons
compared to both contralateral and adjacent non-damaged DRG neurons. Of these, only
Table 10: Genes upregulated (>5-fold) in damaged DRG neurons compared to
adjacent non-damaged neurons (n=3).
Table 11: Genes downregulated (>10-fold) in damaged DRG neurons compared to
adjacent non-damaged neurons (n=3).
43
11 exhibited opposed regulation for damaged and adjacent neurons. The vast majority,
820, showed a regulation in damaged neurons that was larger compared to contralateral
than to adjacent neurons.
4.7.2.3 Regulated Ion Channels
As ion channels have been shown to play a crucial role in sensitization and ectopic
discharge in neuropathic pain, special attention was paid to their expression and
regulation in the Affymetrix® array. RNA of four channels was considerably
upregulated (> twofold) in damaged compared to contralateral neurons in all three runs:
Purinergic receptor P2x3, an ATP-gated ion channel (Ca2+
affine), voltage-gated
calcium channel alpha 2 delta subunit 1 (Cacnα2δ1), voltage-gated potassium channel
Q2 (Kcnq2) and anoctamin 4, a calcium-activated chloride channel of the TMEM16
family. Other upregulated proteins that regulate ion flux are cation transport regulator-
like 1 (Chac1) and Otopetrin (Otop1).
Down-regulated channels include various potassium channels (Kcnj10, Kcnn4, Kcnk2,
Kctd1) but also transient receptor potential channel Trpm3 and Scn3b, encoding for
TTX-S Nav1.3. Further channels like Trpa1 and TTX-R Nav1.8 and 1.9 are down-
regulated in two runs.
4.7.2.4 Regulated Peptides
Of the classical signalling neuropeptides known to be involved in neuropathic pain,
galanin was considerably upregulated in damaged neurons (7.19-fold compared to
contralateral neurons, 3.76-fold compared to adjacent neurons). Furthermore, CGRP
target chemokine ligand Ccl2 was found upregulated in damaged neurons in two runs:
between 2.2- and 2.9-fold compared to contralateral neurons and between 1.5- and 3.0-
fold to adjacent neurons. Substance P was not tested in the microarray, while
Neuropeptide Y and CGRP were eliminated from the ANOVA due to highly divergent
expression values within the conditions.
4.7.2.5 Regulation of microRNA Top Targets
Of the top 20 targets as listed by myMIR, only two targets for each miRNA are
significantly regulated in the array (p<.05), although to modest extent: For miR-137

44
targets Clic5 (chloride intracellular channel 5) and Zfpm2 (zinc finger protein 2),
upregulation levels are below 1.5-fold in damaged neurons. For miR-183, regulated
targets include Prkd3 (protein kinase Cδ3) and Mlc1 (membrane protein MLC1). While
the first is only little upregulated (below 1.5-fold), Mlc1 was surprisingly
downregulated by >9-fold compared to contralateral and by >7-fold compared to
adjacent neurons.
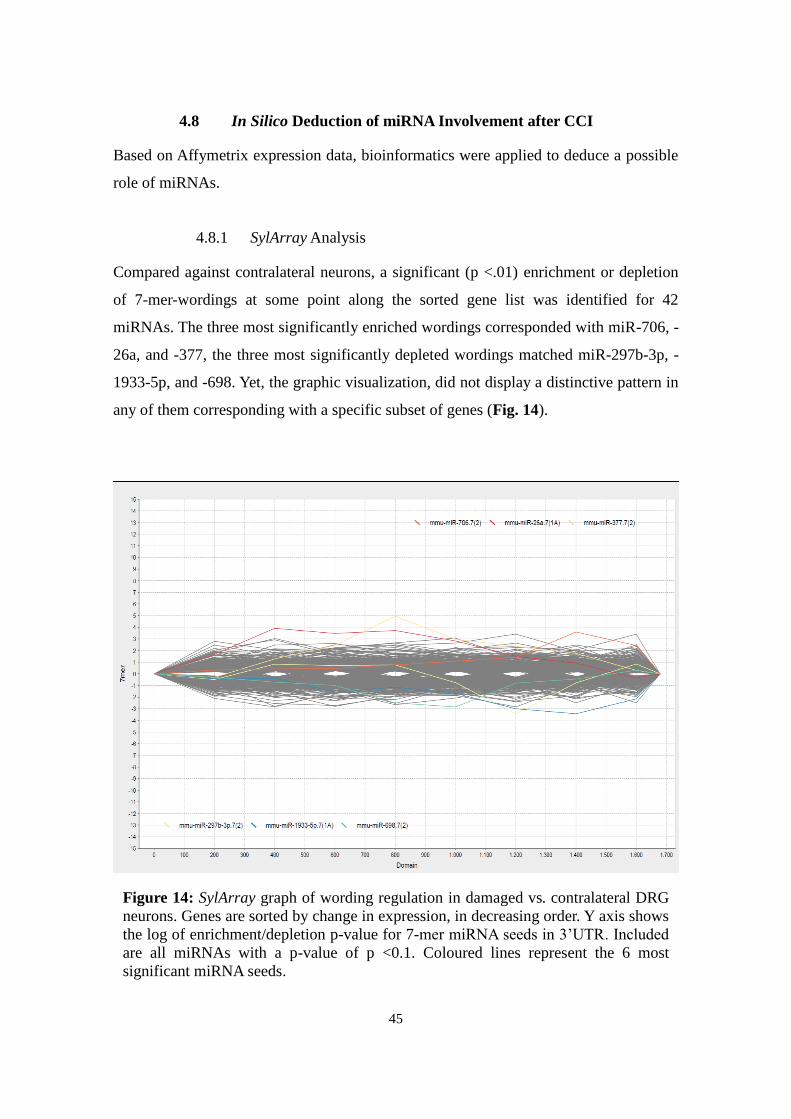
45
4.8 In Silico Deduction of miRNA Involvement after CCI
Based on Affymetrix expression data, bioinformatics were applied to deduce a possible
role of miRNAs.
4.8.1 SylArray Analysis
Compared against contralateral neurons, a significant (p <.01) enrichment or depletion
of 7-mer-wordings at some point along the sorted gene list was identified for 42
miRNAs. The three most significantly enriched wordings corresponded with miR-706, -
26a, and -377, the three most significantly depleted wordings matched miR-297b-3p, -
1933-5p, and -698. Yet, the graphic visualization, did not display a distinctive pattern in
any of them corresponding with a specific subset of genes (Fig. 14).
Figure 14: SylArray graph of wording regulation in damaged vs. contralateral DRG
neurons. Genes are sorted by change in expression, in decreasing order. Y axis shows
the log of enrichment/depletion p-value for 7-mer miRNA seeds in 3‟UTR. Included
are all miRNAs with a p-value of p <0.1. Coloured lines represent the 6 most
significant miRNA seeds.
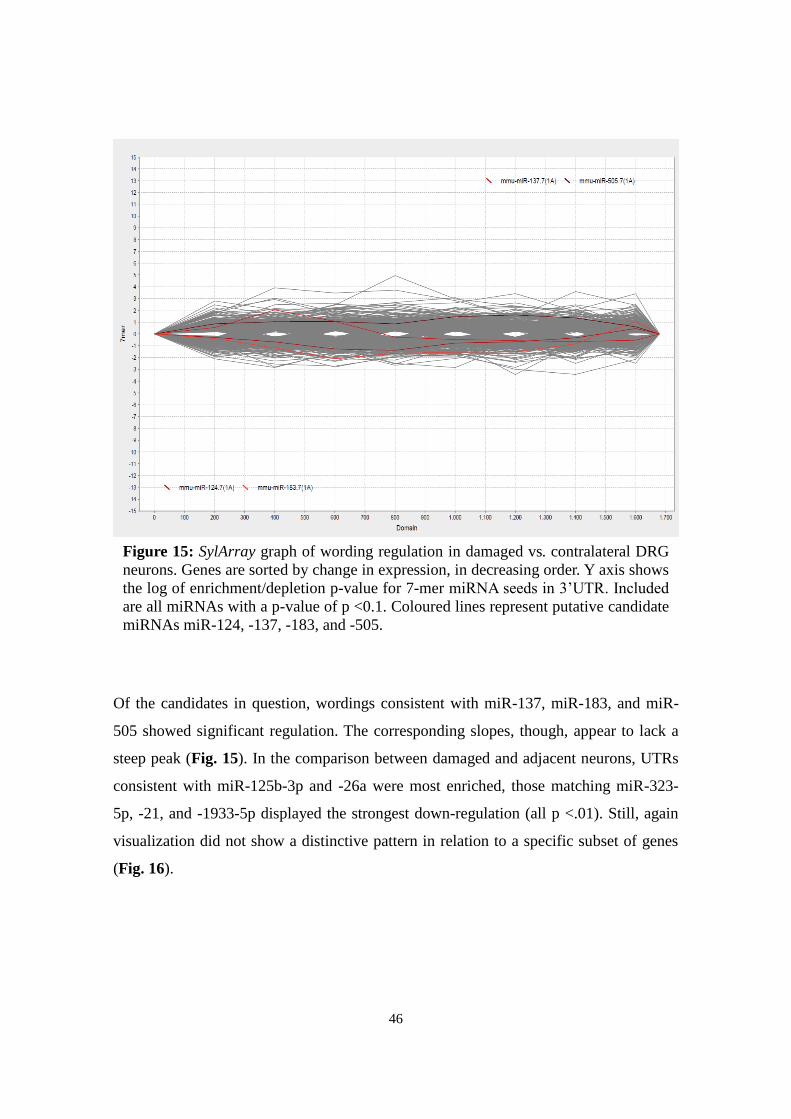
46
Of the candidates in question, wordings consistent with miR-137, miR-183, and miR-
505 showed significant regulation. The corresponding slopes, though, appear to lack a
steep peak (Fig. 15). In the comparison between damaged and adjacent neurons, UTRs
consistent with miR-125b-3p and -26a were most enriched, those matching miR-323-
5p, -21, and -1933-5p displayed the strongest down-regulation (all p <.01). Still, again
visualization did not show a distinctive pattern in relation to a specific subset of genes
(Fig. 16).
Figure 15: SylArray graph of wording regulation in damaged vs. contralateral DRG
neurons. Genes are sorted by change in expression, in decreasing order. Y axis shows
the log of enrichment/depletion p-value for 7-mer miRNA seeds in 3‟UTR. Included
are all miRNAs with a p-value of p <0.1. Coloured lines represent putative candidate
miRNAs miR-124, -137, -183, and -505.
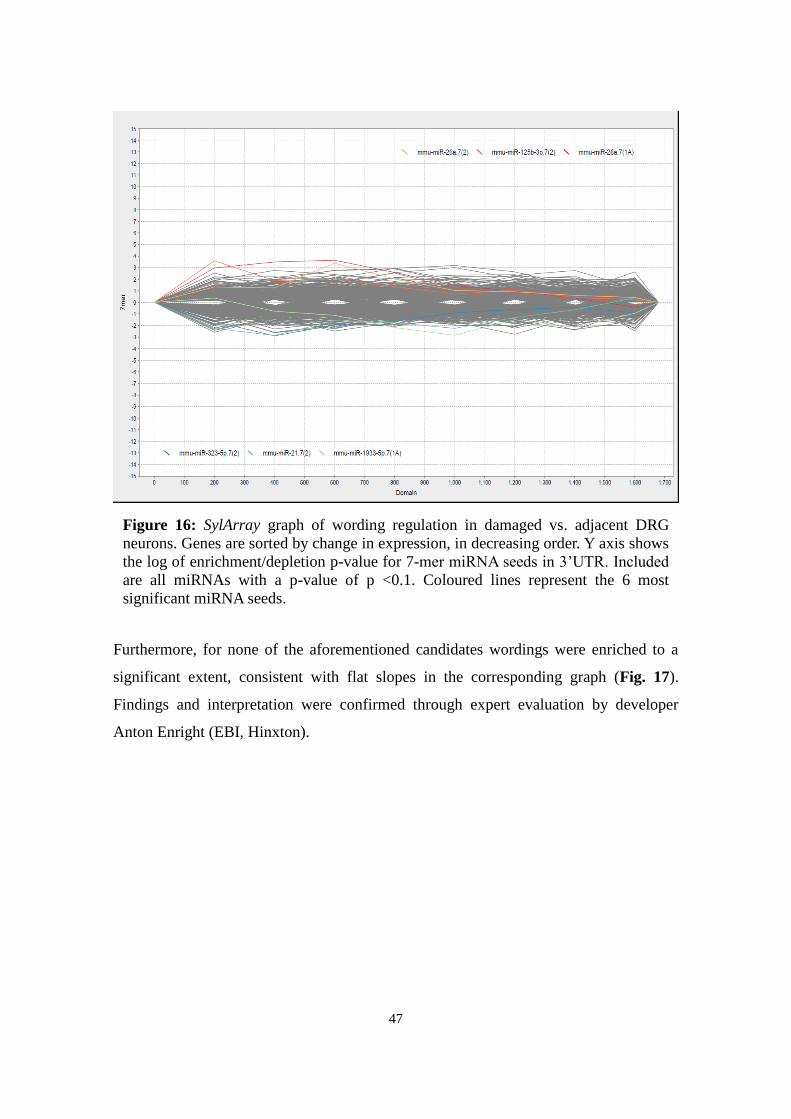
47
Furthermore, for none of the aforementioned candidates wordings were enriched to a
significant extent, consistent with flat slopes in the corresponding graph (Fig. 17).
Findings and interpretation were confirmed through expert evaluation by developer
Anton Enright (EBI, Hinxton).
Figure 16: SylArray graph of wording regulation in damaged vs. adjacent DRG
neurons. Genes are sorted by change in expression, in decreasing order. Y axis shows
the log of enrichment/depletion p-value for 7-mer miRNA seeds in 3‟UTR. Included
are all miRNAs with a p-value of p <0.1. Coloured lines represent the 6 most
significant miRNA seeds.
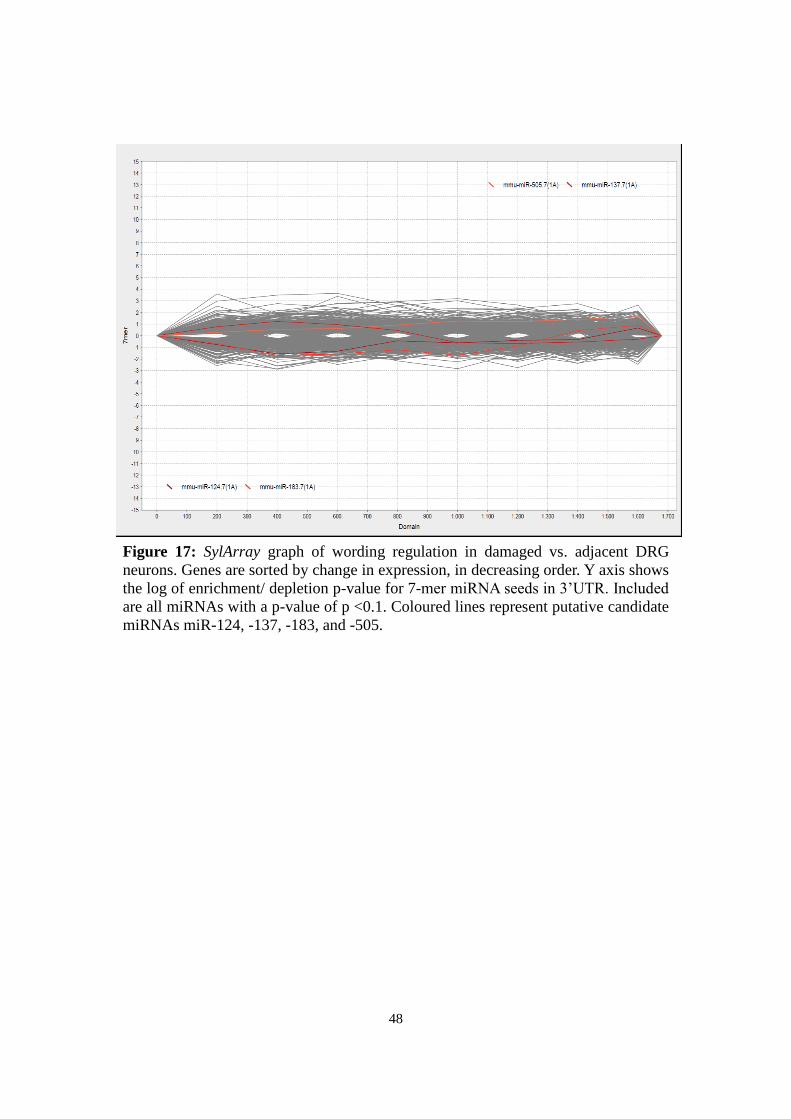
48
Figure 17: SylArray graph of wording regulation in damaged vs. adjacent DRG
neurons. Genes are sorted by change in expression, in decreasing order. Y axis shows
the log of enrichment/ depletion p-value for 7-mer miRNA seeds in 3‟UTR. Included
are all miRNAs with a p-value of p <0.1. Coloured lines represent putative candidate
miRNAs miR-124, -137, -183, and -505.
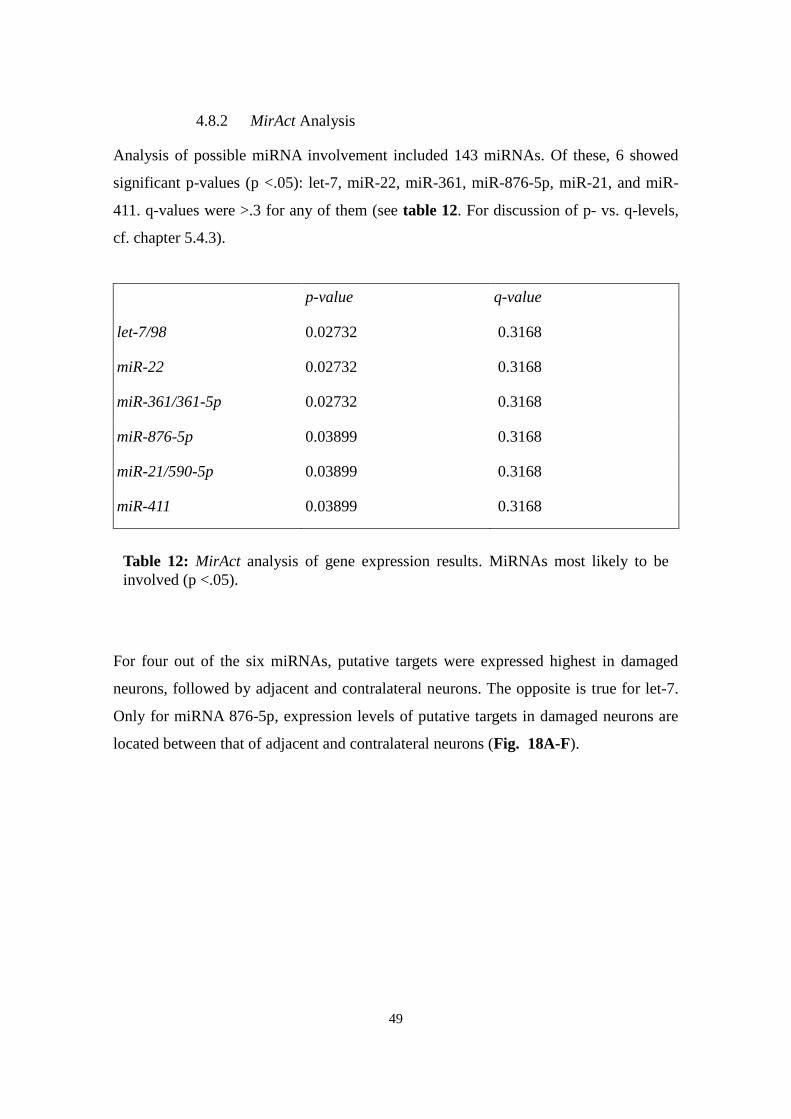
49
4.8.2 MirAct Analysis
Analysis of possible miRNA involvement included 143 miRNAs. Of these, 6 showed
significant p-values (p <.05): let-7, miR-22, miR-361, miR-876-5p, miR-21, and miR-
411. q-values were >.3 for any of them (see table 12. For discussion of p- vs. q-levels,
cf. chapter 5.4.3).
p-value q-value
let-7/98 0.02732 0.3168
miR-22 0.02732 0.3168
miR-361/361-5p 0.02732 0.3168
miR-876-5p 0.03899 0.3168
miR-21/590-5p 0.03899 0.3168
miR-411 0.03899 0.3168
For four out of the six miRNAs, putative targets were expressed highest in damaged
neurons, followed by adjacent and contralateral neurons. The opposite is true for let-7.
Only for miRNA 876-5p, expression levels of putative targets in damaged neurons are
located between that of adjacent and contralateral neurons (Fig. 18A-F).
Table 12: MirAct analysis of gene expression results. MiRNAs most likely to be
involved (p <.05).
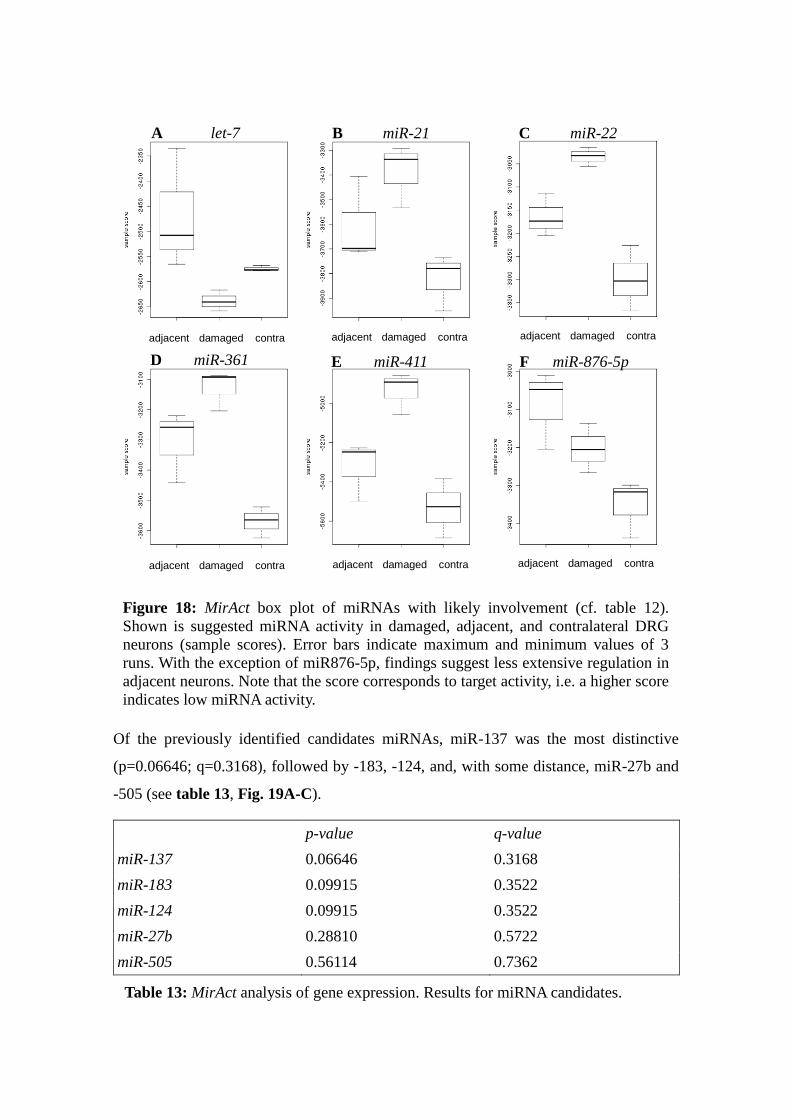
50
Of the previously identified candidates miRNAs, miR-137 was the most distinctive
(p=0.06646; q=0.3168), followed by -183, -124, and, with some distance, miR-27b and
-505 (see table 13, Fig. 19A-C).
p-value q-value
miR-137 0.06646 0.3168
miR-183 0.09915 0.3522
miR-124 0.09915 0.3522
miR-27b 0.28810 0.5722
miR-505 0.56114 0.7362
adjacent damaged
Figure 18: MirAct box plot of miRNAs with likely involvement (cf. table 12).
Shown is suggested miRNA activity in damaged, adjacent, and contralateral DRG
neurons (sample scores). Error bars indicate maximum and minimum values of 3
runs. With the exception of miR876-5p, findings suggest less extensive regulation in
adjacent neurons. Note that the score corresponds to target activity, i.e. a higher score
indicates low miRNA activity.
A let-7 B miR-21 C miR-22
D miR-361 E miR-411 F miR-876-5p
Table 13: MirAct analysis of gene expression. Results for miRNA candidates.
adjacent damaged
adjacent damaged contra adjacent damaged contra
adjacent damaged contra adjacent damaged contra adjacent damaged contra
adjacent damaged contra
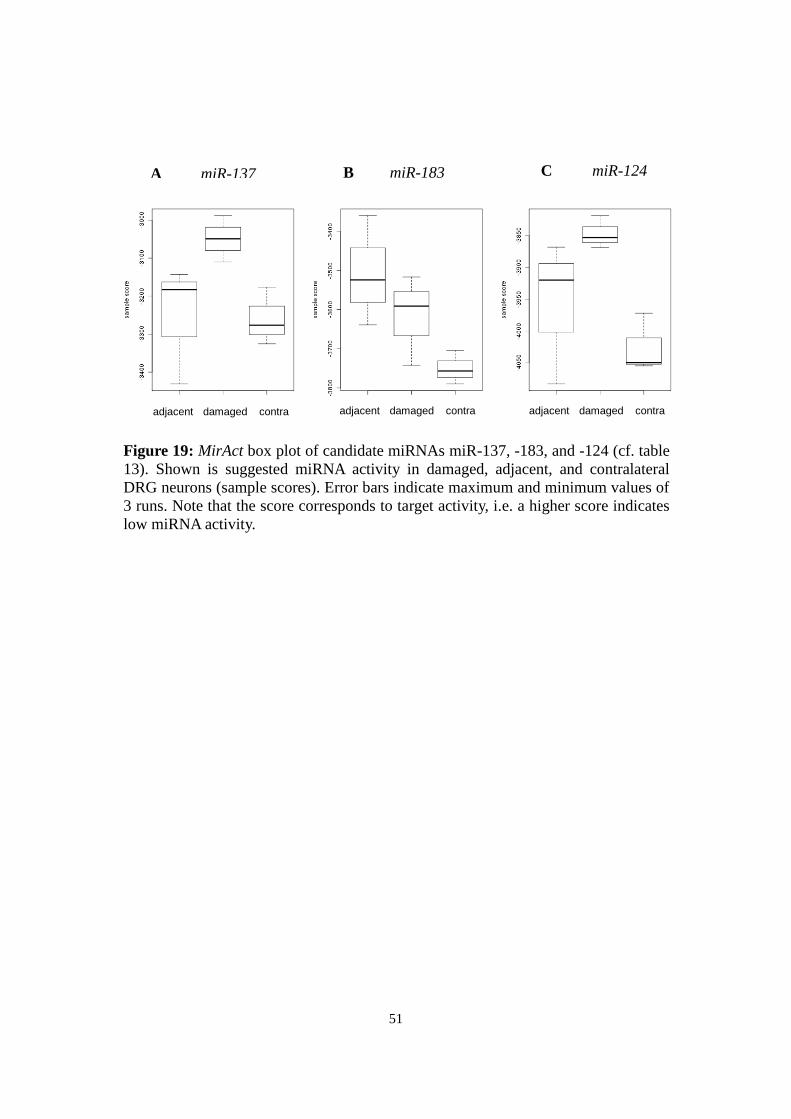
51
A miR-137 B miR-183 C miR-124
adjacent damaged contra adjacent damaged contra adjacent damaged contra
Figure 19: MirAct box plot of candidate miRNAs miR-137, -183, and -124 (cf. table
13). Shown is suggested miRNA activity in damaged, adjacent, and contralateral
DRG neurons (sample scores). Error bars indicate maximum and minimum values of
3 runs. Note that the score corresponds to target activity, i.e. a higher score indicates
low miRNA activity.
52
5 Discussion
5.1 MicroRNAs in Neuropathic Pain
The experiments presented aim to define a role for miRNAs in the development and
regulation of neuropathic pain in mice. Changes in whole DRG were covered as well as
in primary sensory neurons. Results suggest a contribution of miRNAs to neuropathic
pain, singling out some in particular. Yet, the picture that emerges is varied and reflects
the clinical and molecular complexity.
5.1.1 Time Course of microRNA Expression in DRG after CCI
After CCI surgery as performed in our group, a neuropathic phenotype typically evolves
within the course of 7 d. This has been endorsed by a highly significant upregulation of
galanin after 7 d. As miRNAs are known to interfere with mRNAs before gene
translation, an earlier onset of miRNA differential expression had been hypothesized
and different time points compared: 6 h, 1 d, and 7 d after CCI. In the assay data,
differential regulation of miRNAs in DRG evolved over the time-course of 7 d:
Ipsilateral samples after 7 d were most divergent from naïve controls. These findings are
in accordance with other, later studies (Aldrich et al., 2009; Kusuda et al., 2011).
5.1.2 MicroRNA Profiling in Contralateral DRG
Notably, contralateral DRG exhibited a differential expression pattern as well, although
to smaller extent. Thus, findings indicate a miRNA involvement both in local and
systemic reactions to neuropathic agents. However, the relation between both, i.e. a
thorough analysis of which miRNAs are involved exclusively in systemic processes and
which have an additional side-specific effect, requires deeper research and must be
further elucidated upon. As for now, no such investigation has been published yet.
5.2 MicroRNAs Potentially Involved in Neuropathic Pain
Initial whole-DRG screening did suggest several potential candidate miRNAs. For
validation and quantification, five miRNAs were analysed using qPCR. Two of these
were further characterized using in situ hybridization and bioinformatical target
prediction.
53
5.2.1 A Potential Role for miR-183 in Various States of Pain
MiR-183, located on chromosome 6 and with a 22-nucleotide mature sequence, has
been previously described as part of a sensory-organ specific cluster together with miR-
96 and -182, notably in inner ear hair cells and in retinal neurons (Sacheli et al., 2009;
Xu et al., 2007). In silico analysis of potential targets included genes known to be
involved in neuropathic pain, such as voltage-gated ion channels (Nav1.3, Trek-1);
proven targets include SRY-box containing gene 2 (Sox2) and Insulin receptor substrate
1 (Irs1) (Aldrich et al., 2009). As mentioned above, miR-183 has by now been described
by two groups as being downregulated in inflammatory and neuropathic pain.
Both miRNA assay and PCR data showed a decreased expression of miR-183 in
neuropathic DRG compared to controls as well as, to a lesser extent, contralateral DRG
(Table 3, Fig. 7A). In PCR, expression was reduced by ~60% ipsi- and 20%
contralaterally compared to naïve DRG. These findings are consistent with the report by
Aldrich et al. who observed a downregulation of the sensory-organ specific cluster
[miR-96, -182, -183] in rat DRG after spinal nerve ligation. In addition, the authors
suggest an intracellular redistribution of miRNAs observed in in situ hybridization.
Such alterations were not found for miR-183 in this study: signals were evenly
distributed in the cytoplasm, also no consistent overall reduction was detectable.
However, in-situ hybridisation is not a very sensitive method for gene expression
quantification. (Fig. 9). Notably, no relevant regulation was found for other miRNAs of
the suggested cluster, i.e. miR-96 and miR-182. This is in line with findings in
inflammatory pain (Bai et al., 2007). As for potential target genes, the microarray did
not show a strong differential expression of any of the suggested top targets. Rather,
Trek-1, Sox-2, Nav1.3 and Irs-1 were slightly downregulated in our neuron-specific
approach (not mentioned in table 9). Moreover, in silico analysis for miRNA
involvement did not strongly suggest a role for miR-183 (in neither SylArray nor
MirAct). Hence, at this point, no further conclusions can be made about the role of miR-
183 in neuropathic pain from the data. Still, the consistency with previous data plus the
ascribed role of miR-183 in sensory organs make it an interesting target for further
research, especially in the light of upregulated genes of the inner ear like Otopetrin (see
below).
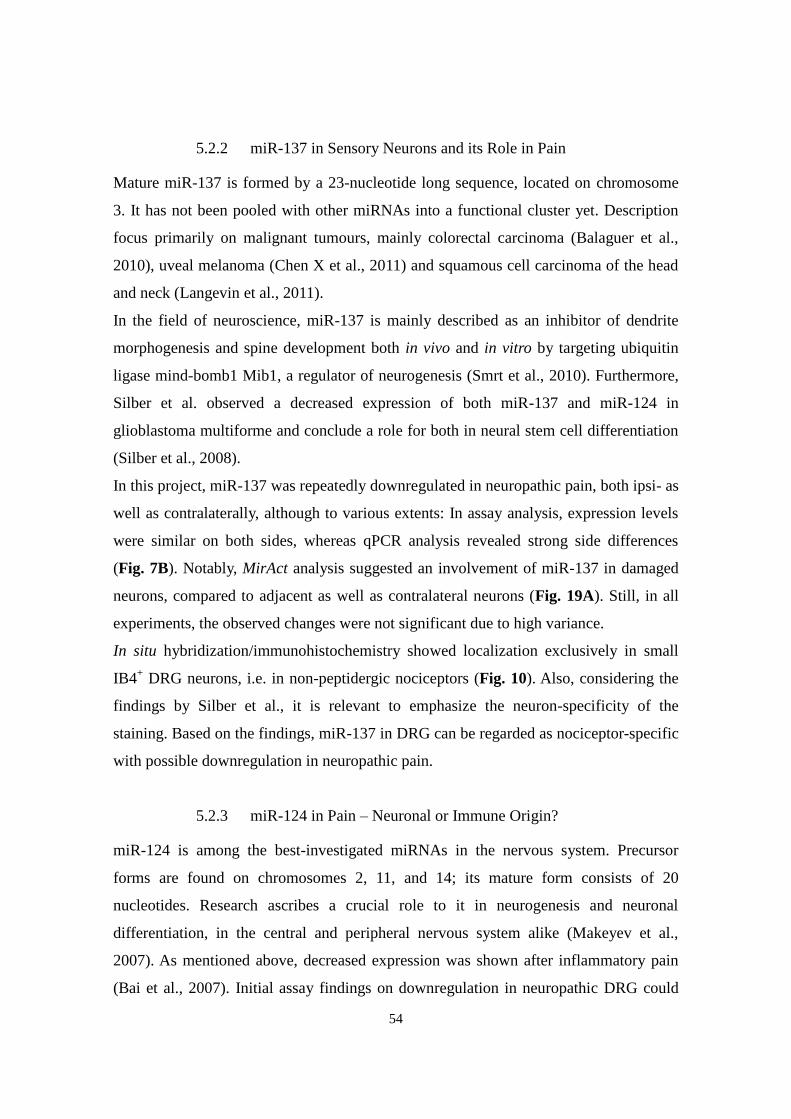
54
5.2.2 miR-137 in Sensory Neurons and its Role in Pain
Mature miR-137 is formed by a 23-nucleotide long sequence, located on chromosome
3. It has not been pooled with other miRNAs into a functional cluster yet. Description
focus primarily on malignant tumours, mainly colorectal carcinoma (Balaguer et al.,
2010), uveal melanoma (Chen X et al., 2011) and squamous cell carcinoma of the head
and neck (Langevin et al., 2011).
In the field of neuroscience, miR-137 is mainly described as an inhibitor of dendrite
morphogenesis and spine development both in vivo and in vitro by targeting ubiquitin
ligase mind-bomb1 Mib1, a regulator of neurogenesis (Smrt et al., 2010). Furthermore,
Silber et al. observed a decreased expression of both miR-137 and miR-124 in
glioblastoma multiforme and conclude a role for both in neural stem cell differentiation
(Silber et al., 2008).
In this project, miR-137 was repeatedly downregulated in neuropathic pain, both ipsi- as
well as contralaterally, although to various extents: In assay analysis, expression levels
were similar on both sides, whereas qPCR analysis revealed strong side differences
(Fig. 7B). Notably, MirAct analysis suggested an involvement of miR-137 in damaged
neurons, compared to adjacent as well as contralateral neurons (Fig. 19A). Still, in all
experiments, the observed changes were not significant due to high variance.
In situ hybridization/immunohistochemistry showed localization exclusively in small
IB4+ DRG neurons, i.e. in non-peptidergic nociceptors (Fig. 10). Also, considering the
findings by Silber et al., it is relevant to emphasize the neuron-specificity of the
staining. Based on the findings, miR-137 in DRG can be regarded as nociceptor-specific
with possible downregulation in neuropathic pain.
5.2.3 miR-124 in Pain – Neuronal or Immune Origin?
miR-124 is among the best-investigated miRNAs in the nervous system. Precursor
forms are found on chromosomes 2, 11, and 14; its mature form consists of 20
nucleotides. Research ascribes a crucial role to it in neurogenesis and neuronal
differentiation, in the central and peripheral nervous system alike (Makeyev et al.,
2007). As mentioned above, decreased expression was shown after inflammatory pain
(Bai et al., 2007). Initial assay findings on downregulation in neuropathic DRG could
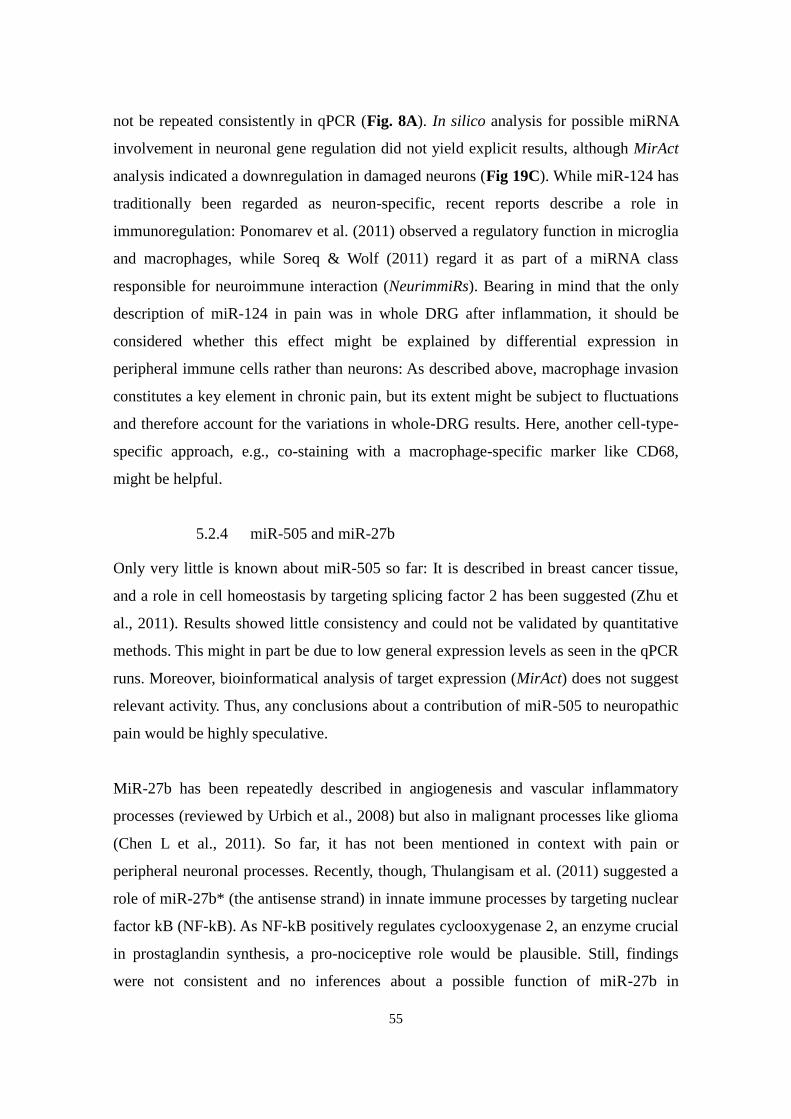
55
not be repeated consistently in qPCR (Fig. 8A). In silico analysis for possible miRNA
involvement in neuronal gene regulation did not yield explicit results, although MirAct
analysis indicated a downregulation in damaged neurons (Fig 19C). While miR-124 has
traditionally been regarded as neuron-specific, recent reports describe a role in
immunoregulation: Ponomarev et al. (2011) observed a regulatory function in microglia
and macrophages, while Soreq & Wolf (2011) regard it as part of a miRNA class
responsible for neuroimmune interaction (NeurimmiRs). Bearing in mind that the only
description of miR-124 in pain was in whole DRG after inflammation, it should be
considered whether this effect might be explained by differential expression in
peripheral immune cells rather than neurons: As described above, macrophage invasion
constitutes a key element in chronic pain, but its extent might be subject to fluctuations
and therefore account for the variations in whole-DRG results. Here, another cell-type-
specific approach, e.g., co-staining with a macrophage-specific marker like CD68,
might be helpful.
5.2.4 miR-505 and miR-27b
Only very little is known about miR-505 so far: It is described in breast cancer tissue,
and a role in cell homeostasis by targeting splicing factor 2 has been suggested (Zhu et
al., 2011). Results showed little consistency and could not be validated by quantitative
methods. This might in part be due to low general expression levels as seen in the qPCR
runs. Moreover, bioinformatical analysis of target expression (MirAct) does not suggest
relevant activity. Thus, any conclusions about a contribution of miR-505 to neuropathic
pain would be highly speculative.
MiR-27b has been repeatedly described in angiogenesis and vascular inflammatory
processes (reviewed by Urbich et al., 2008) but also in malignant processes like glioma
(Chen L et al., 2011). So far, it has not been mentioned in context with pain or
peripheral neuronal processes. Recently, though, Thulangisam et al. (2011) suggested a
role of miR-27b* (the antisense strand) in innate immune processes by targeting nuclear
factor kB (NF-kB). As NF-kB positively regulates cyclooxygenase 2, an enzyme crucial
in prostaglandin synthesis, a pro-nociceptive role would be plausible. Still, findings
were not consistent and no inferences about a possible function of miR-27b in
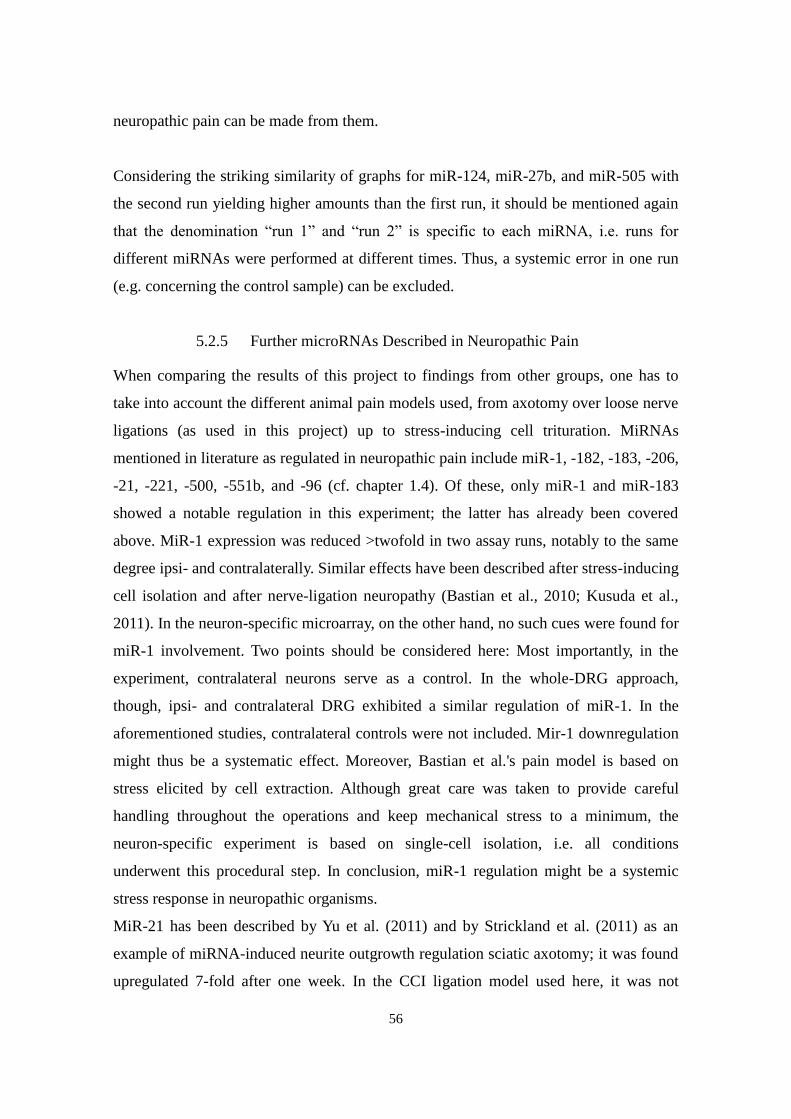
56
neuropathic pain can be made from them.
Considering the striking similarity of graphs for miR-124, miR-27b, and miR-505 with
the second run yielding higher amounts than the first run, it should be mentioned again
that the denomination “run 1” and “run 2” is specific to each miRNA, i.e. runs for
different miRNAs were performed at different times. Thus, a systemic error in one run
(e.g. concerning the control sample) can be excluded.
5.2.5 Further microRNAs Described in Neuropathic Pain
When comparing the results of this project to findings from other groups, one has to
take into account the different animal pain models used, from axotomy over loose nerve
ligations (as used in this project) up to stress-inducing cell trituration. MiRNAs
mentioned in literature as regulated in neuropathic pain include miR-1, -182, -183, -206,
-21, -221, -500, -551b, and -96 (cf. chapter 1.4). Of these, only miR-1 and miR-183
showed a notable regulation in this experiment; the latter has already been covered
above. MiR-1 expression was reduced >twofold in two assay runs, notably to the same
degree ipsi- and contralaterally. Similar effects have been described after stress-inducing
cell isolation and after nerve-ligation neuropathy (Bastian et al., 2010; Kusuda et al.,
2011). In the neuron-specific microarray, on the other hand, no such cues were found for
miR-1 involvement. Two points should be considered here: Most importantly, in the
experiment, contralateral neurons serve as a control. In the whole-DRG approach,
though, ipsi- and contralateral DRG exhibited a similar regulation of miR-1. In the
aforementioned studies, contralateral controls were not included. Mir-1 downregulation
might thus be a systematic effect. Moreover, Bastian et al.'s pain model is based on
stress elicited by cell extraction. Although great care was taken to provide careful
handling throughout the operations and keep mechanical stress to a minimum, the
neuron-specific experiment is based on single-cell isolation, i.e. all conditions
underwent this procedural step. In conclusion, miR-1 regulation might be a systemic
stress response in neuropathic organisms.
MiR-21 has been described by Yu et al. (2011) and by Strickland et al. (2011) as an
example of miRNA-induced neurite outgrowth regulation sciatic axotomy; it was found
upregulated 7-fold after one week. In the CCI ligation model used here, it was not
57
impressively regulated. Yet, MirAct analysis for miR-21/590-5p did list it among the
most significantly involved miRNAs: surprisingly, the respective graph shows an
upregulation of putative targets, thus indicating a downregulation of miR-21 or -590-5p.
Hence, miR-21 might be yet another example of contrary regulation in neurons after
neuropathic vs deafferential pain.
No relevant differential expression can be noticed for miR-221, miR-500, miR-551b, or
miR-206.
5.3 Divergent Results in microRNA Profiling
In general, the assessment of miRNA expression in DRG showed high divergence
between different runs of the same experiment as well as between different
experimental techniques (Luminex assay, qPCR, bioinformatical analysis)8.
One major obstacle lies certainly in experimental limitations. Per mouse and condition,
only 3 DRG (L3-5) can be extracted. As (mi)RNA yield from DRG is meagre, this adds
up to a considerable demand in animals. Moreover, this project was planned as
preliminary investigation with limited budget. Thus, repetition options and thereby
statistical interpretation were restricted. For the same reasons, no sham controls were
included. With RNA pooled from several mice for each experimental run, individual
effects are negligible. Still, technical effects need to be taken into consideration when
interpreting results, e.g. trends in qPCR.
Considering literature findings, however, divergent and contradictory results seem to be
a general phenomenon in the field: Only two miRNAs, miR-1 and miR-21, have been
reported by more than one study. The divergent findings on this subject can be attributed
to three major factors: the complexity of neuropathic pathways running simultaneously
with antinociceptive and regenerative mechanisms, the modest extent of miRNA
regulation, and the tissue heterogeneity in dorsal root ganglia. As the first two points are
difficult to tackle in terms of experimental design, focus was subsequently laid on tissue
composition: Whole-DRG approaches are established in the study of peripheral
neuropathies. Still, one has to bear in mind the cellular heterogeneity of DRG: Studies
suggest a neuronal percentage of only 15% of all DRG cells (Ng et al., 2010), the
8 As all experiments including surgery were conducted by the same person and under stable conditions,
experimenter-dependent differences can be excluded as relevant factor.
58
largest part being made up by glia, i.e. Schwann and satellite cells. In fact, as described
above, several DRG cell types are known to be involved in neuropathic mechanisms.
As the proportions fluctuate across ganglia, cell-type-specific expression changes may
vary considerably and, moreover, be drowned by high background signalling. In
combination with the two other factors mentioned above, this might cause limitations in
the investigation of miRNA-driven processes.
I therefore decided to take a cell type-specific approach by singling out neurons and
comparing damaged vs. non-damaged neurons.
5.4 Neuron-Specific Expression Analysis
5.4.1 Advantages of Cell Type- and Damage-Specific Approach
As described above, the different properties of fluorescent neuronal tracers can be
exploited to distinguish between neuronal subsets by double staining. However, so far
this has mainly been used for histological experiments. By combining differential
fluorescent neuronal labelling with fluorescence-activated cell sorting (FACS), the
approach not only allows to study neuron-specific expression but also compare gene
expression in damaged and adjacent intact DRG neurons. Thus, this neuron- and
damage-specific approach better reflects previous findings (as reviewed by Campbell &
Meyer, 2006) that emphasize different expression patterns in damaged and adjacent
neurons as well as contributions of non-neuronal cells to neuropathic features.
As this design requires enormous amounts of primary tissue in order to yield enough
final RNA for microarrays, some experimental features were adjusted to minimize
consumption. These changes need to be taken into consideration when comparing the
results to the initial whole-DRG approach: Firstly, as a control served contralateral DRG
neurons instead of DRG neurons from naïve animals. Thus, comparisons are always
made within the same animal; systemic reactions are therefore not captured. In previous
experiments, contralateral neurons had exhibited altered expression, as well. Secondly,
miRNA were not assessed directly: Instead, a mRNA microarray was performed and
information about miRNA involvement inferred from in silico analysis. Beside the
about tenfold decrease in RNA amount required and the more established principle, this
approach served another purpose - mRNA information could be used as a quality
control: Gene regulation in neuropathic sensory neurons has long been an extensively
59
researched field. Comparing results to literature served as validation for this rather
novel approach.
5.4.2 mRNA Regulation in Damaged Neurons
5.4.2.1 Global Findings
The FACS pattern for ipsilateral neurons consistently uncovered a subpopulation of
DiI+/FE
+ cells, suggesting strong neuronal damage. The bulk of cells negative for both
DiI and FE reaffirms the high amount of non-neuronal tissue in DRG. As correlation
and Principal Component Analysis both show a high consistency within damaged and
contralateral neurons respectively, this approach can be assumed effective. Interestingly,
this consistency is not the case true for non-damaged neurons; this observation might be
caused by anatomical differences (projection from peripheral to spinal nerves differs
considerably between individuals: While all DRG L3-L5 are used for the study of
sciatic pain models, the bulk of the sciatic nerve actually projects into L4 (Rigaud et al.,
2007).
In mRNA analysis, the number of genes differentially regulated compared to other
conditions was by far the highest for damaged neurons. Interestingly, the vast majority
of the genes showed a regulation in damaged neurons that was considerably bigger
compared to contralateral than to adjacent neurons. This gives the latter an
“intermediate” position thus indicating a trickle-down or paracrine-like effect. Such
changes in neighbouring tissue are in line with previous descriptions (e.g., reviewed by
Campbell & Meyer, 2006). Yet, some genes presented the contrary, thus indicating a
regulation exclusively in adjacent neurons. These include zinc finger, transmembrane or
gap junction proteins. Yet, differential regulation is only marginal.
Results show quantitative differences between FACS runs. These considerable within-
group variations can be attributed to different yields in cell extraction as well as
diverging efficiency of tracer injection. Moreover, they appear to confirm the
aforementioned concerns of individual composition differences in DRG tissue.
As this thesis is chiefly concerned with the regulation of miRNAs, a thorough analysis
of gene expression findings would be beyond the scope. The following discussion will
60
therefore focus on structures known to be regulated which might hence serve as quality
control, and only glance at some surprising and highly interesting novel genes, such as
CRH (see below).
5.4.2.2 Regulation of Genes Described in Neuropathic Pain
In the microarray, a number of genes known to play a role in neuropathic pain have
been differentially upregulated (Table 8). Among them are several ion channels: ATP-
sensing purinergic receptor P2rx3 has been long considered one of the major factors in
neuronal sensitization, as has calcium channel subunit α2δ1, the target of Gabapentin (Ji
& Strichartz, 2004). Also L-type calcium channel Cav1.2, a regulator of the CREB
pathway, has been described in neuropathic pain. Surprisingly, voltage-gated M-type
potassium channel Kcnq2, responsible for maintenance of resting membrane potential,
was upregulated in the experiment. This is contrary to literature findings (e.g. Rose et
al., 2011). Moreover, analgesics like flupirtine are known to act as Kcnq2 activators
(Gribkoff, 2003).
Channels down-regulated include various potassium channels (e.g. Kcnj10, Kcnn4,
Kctd1; see table 9). Voltage-gated potassium channel Kcnk2 (TREK-1) has been
described as polymodal pain sensor in small sensory neurons, regulated by GPCRs and
co-localized with TRPV1. Interestingly, mice with a disrupted TREK-1 gene are more
prone to thermal hyperalgesia (Alloui et al., 2005). Also Kcnc4 has been reported to be
reduced in neuropathic sensory neurons, thereby causing mechanical hypersensitivity
(Chien et al., 2007). At the same time, a number of voltage-gated sodium channels are
downregulated, among them Nav1.1 and TTX-R Nav1.8 and 1.9. Especially the role of
Nav1.8 in pain is still under debate. Still, it has, like Nav1.9, been described as being
down-regulated in perikarya of injured neurons but to accumulate in adjacent axons
(Lampert et al., 2010; Ji & Strichartz, 2004). Notably, two transient receptor potential
channels are among the downregulated genes, Trpm3 and Trpa1, which is in accordance
with findings from Staaf et al. (2009) and Caspani et al (2009).
Of “classical” neuropeptides known to be involved in neuropathic pain, only some met
ANOVA inclusion criteria. Most notable are galanin and its receptor Gpr151. Their
61
upregulation in damaged and, to lesser extent, in adjacent neurons is concordant with
previous findings (Ma & Bisby, 1997). Other examples include neurotensin and
cholecystokinin (CCK) which are thought to form a descending facilitatory pathway in
the management of pain: Gui et al. (2004) describe a facilitation of visceral nociception
by neurotensin that can be blocked by administration of CCK antagonists. Interestingly,
higher concentrations of neurotensin seem to have an antinociceptive effect. Both
phenomena have been described a) for nociceptive pain and b) in the spinal cord.
Nevertheless, the upregulation of both neurotensin and CCK receptor B observed here,
should be evaluated in the light of these findings. Further research into their role in
peripheral neuropathic pain seems therefore promising. Chemokine CCL2 has been
described as inflammatory and pain mediator released from primary afferents in the
dorsal horn spinal cord. It is co-localized with classical “neuropathic” peptides like
substance P and CGRP and thought to potentiate glutaminergic receptors
(AMPA/NMDA) as well as inhibit GABAergic receptors (GABAA) (cf. Van
Steenwinckel et al., 2011).
The fact that neuropeptide Y and CGRP were excluded from ANOVA due to
inconsistent expression seems surprising. Yet, raw data, do point towards an
upregulation of NPY and downregulation of CGRP in damaged neurons - which is
consistent with data in literature (Shi et al., 2001).
CD38 is an ADP ribosylcyclase that regulates transmembrane Ca2+ flux. An explicit
regulation in pain has not been described yet, but it has been shown to serve an
antinociceptive function through µ-opioid receptor regulation (Hull et al., 2010).
Further genes highly upregulated encode for proteins involved in axonal growth and
neuronal differentiation, like Syndecan1, growth factor Fgf3, Kainate-receptor
modulator Neto1, aminotransferase Bcat1, AMPAR-associated Shisa9 or Sox (SRY box-
containing gene) 11. Chac1 and Ecel1 are known to act downstream transcription factor
Atf3, a marker of neuronal damage (Tsujino et al., 2000). Another group of upregulated
genes hint at the inflammatory component of neuropathic pain, e.g. several CC
chemokines, seizure-related gene 6, peptidase inhibitor Serpinb1a, or Annexin 1.
Among the most down-regulated genes is Brevican, a chondroitin sulphate proteoglycan
with growth-inhibiting features. In neuropathies, it has previously been described as
up-regulated in dorsal root injury, i.e. deafferentiation (Waselle et al., 2009). As many of
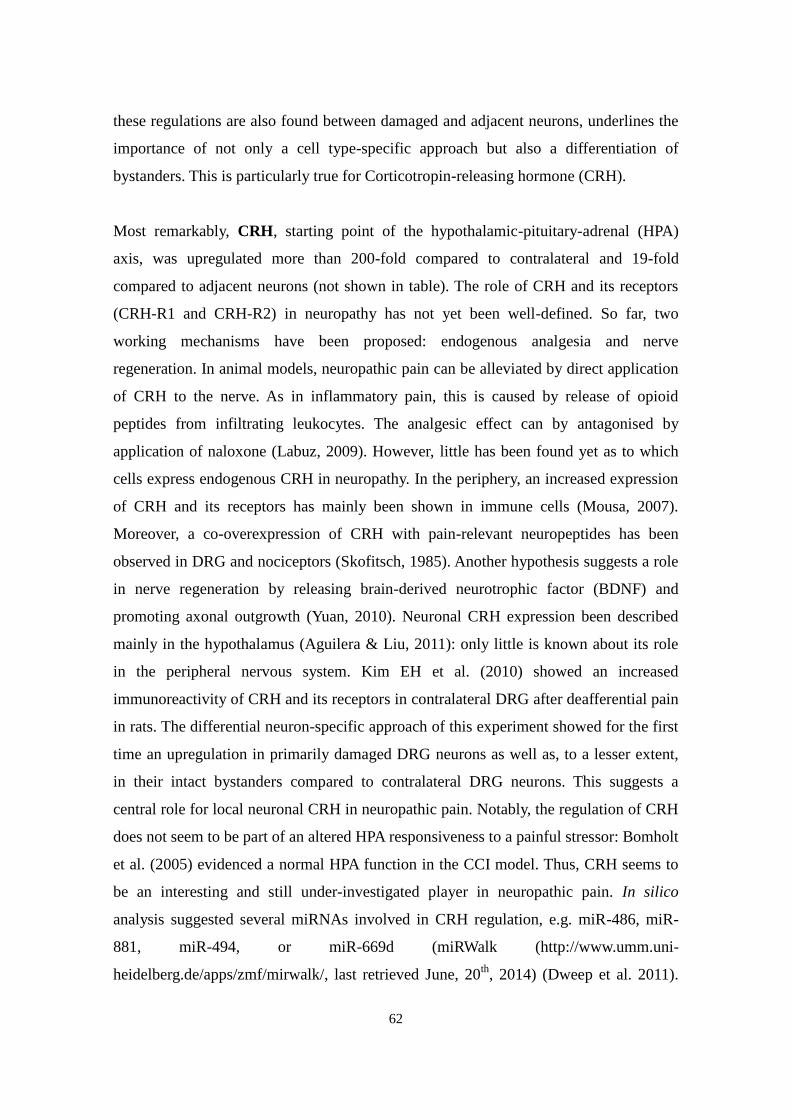
62
these regulations are also found between damaged and adjacent neurons, underlines the
importance of not only a cell type-specific approach but also a differentiation of
bystanders. This is particularly true for Corticotropin-releasing hormone (CRH).
Most remarkably, CRH, starting point of the hypothalamic-pituitary-adrenal (HPA)
axis, was upregulated more than 200-fold compared to contralateral and 19-fold
compared to adjacent neurons (not shown in table). The role of CRH and its receptors
(CRH-R1 and CRH-R2) in neuropathy has not yet been well-defined. So far, two
working mechanisms have been proposed: endogenous analgesia and nerve
regeneration. In animal models, neuropathic pain can be alleviated by direct application
of CRH to the nerve. As in inflammatory pain, this is caused by release of opioid
peptides from infiltrating leukocytes. The analgesic effect can by antagonised by
application of naloxone (Labuz, 2009). However, little has been found yet as to which
cells express endogenous CRH in neuropathy. In the periphery, an increased expression
of CRH and its receptors has mainly been shown in immune cells (Mousa, 2007).
Moreover, a co-overexpression of CRH with pain-relevant neuropeptides has been
observed in DRG and nociceptors (Skofitsch, 1985). Another hypothesis suggests a role
in nerve regeneration by releasing brain-derived neurotrophic factor (BDNF) and
promoting axonal outgrowth (Yuan, 2010). Neuronal CRH expression been described
mainly in the hypothalamus (Aguilera & Liu, 2011): only little is known about its role
in the peripheral nervous system. Kim EH et al. (2010) showed an increased
immunoreactivity of CRH and its receptors in contralateral DRG after deafferential pain
in rats. The differential neuron-specific approach of this experiment showed for the first
time an upregulation in primarily damaged DRG neurons as well as, to a lesser extent,
in their intact bystanders compared to contralateral DRG neurons. This suggests a
central role for local neuronal CRH in neuropathic pain. Notably, the regulation of CRH
does not seem to be part of an altered HPA responsiveness to a painful stressor: Bomholt
et al. (2005) evidenced a normal HPA function in the CCI model. Thus, CRH seems to
be an interesting and still under-investigated player in neuropathic pain. In silico
analysis suggested several miRNAs involved in CRH regulation, e.g. miR-486, miR-
881, miR-494, or miR-669d (miRWalk (http://www.umm.uni-
heidelberg.de/apps/zmf/mirwalk/, last retrieved June, 20th
, 2014) (Dweep et al. 2011).
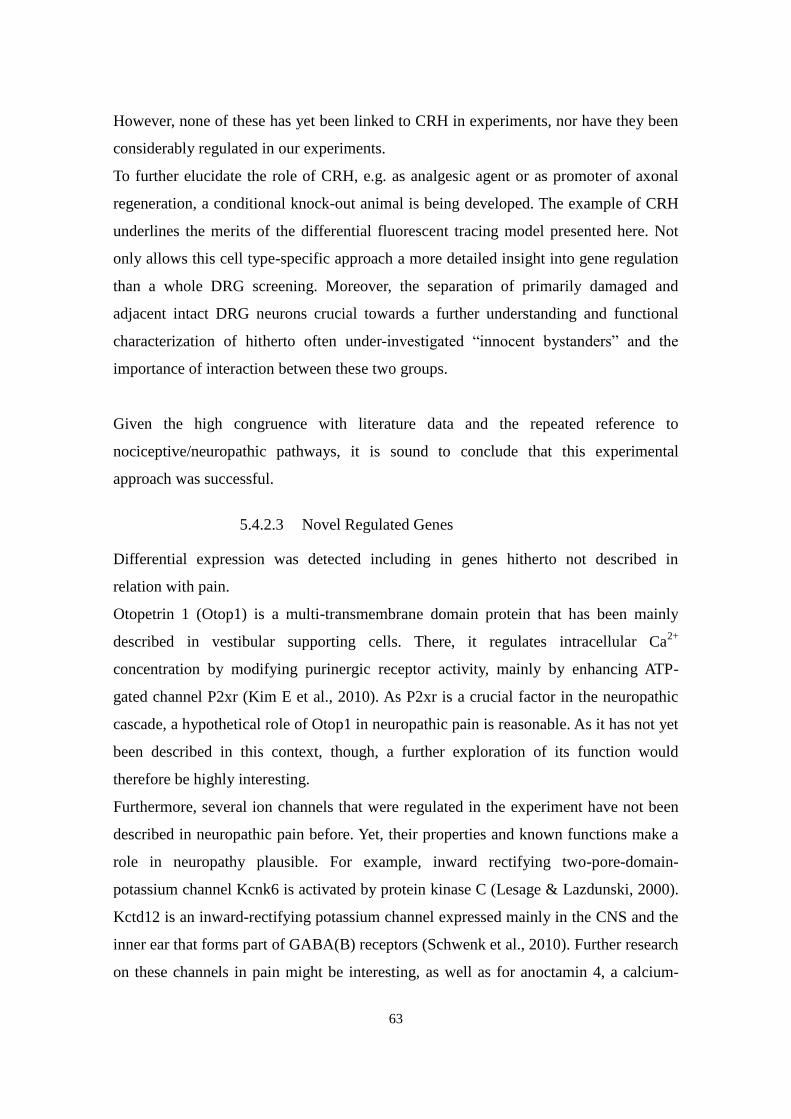
63
However, none of these has yet been linked to CRH in experiments, nor have they been
considerably regulated in our experiments.
To further elucidate the role of CRH, e.g. as analgesic agent or as promoter of axonal
regeneration, a conditional knock-out animal is being developed. The example of CRH
underlines the merits of the differential fluorescent tracing model presented here. Not
only allows this cell type-specific approach a more detailed insight into gene regulation
than a whole DRG screening. Moreover, the separation of primarily damaged and
adjacent intact DRG neurons crucial towards a further understanding and functional
characterization of hitherto often under-investigated “innocent bystanders” and the
importance of interaction between these two groups.
Given the high congruence with literature data and the repeated reference to
nociceptive/neuropathic pathways, it is sound to conclude that this experimental
approach was successful.
5.4.2.3 Novel Regulated Genes
Differential expression was detected including in genes hitherto not described in
relation with pain.
Otopetrin 1 (Otop1) is a multi-transmembrane domain protein that has been mainly
described in vestibular supporting cells. There, it regulates intracellular Ca2+
concentration by modifying purinergic receptor activity, mainly by enhancing ATP-
gated channel P2xr (Kim E et al., 2010). As P2xr is a crucial factor in the neuropathic
cascade, a hypothetical role of Otop1 in neuropathic pain is reasonable. As it has not yet
been described in this context, though, a further exploration of its function would
therefore be highly interesting.
Furthermore, several ion channels that were regulated in the experiment have not been
described in neuropathic pain before. Yet, their properties and known functions make a
role in neuropathy plausible. For example, inward rectifying two-pore-domain-
potassium channel Kcnk6 is activated by protein kinase C (Lesage & Lazdunski, 2000).
Kctd12 is an inward-rectifying potassium channel expressed mainly in the CNS and the
inner ear that forms part of GABA(B) receptors (Schwenk et al., 2010). Further research
on these channels in pain might be interesting, as well as for anoctamin 4, a calcium-
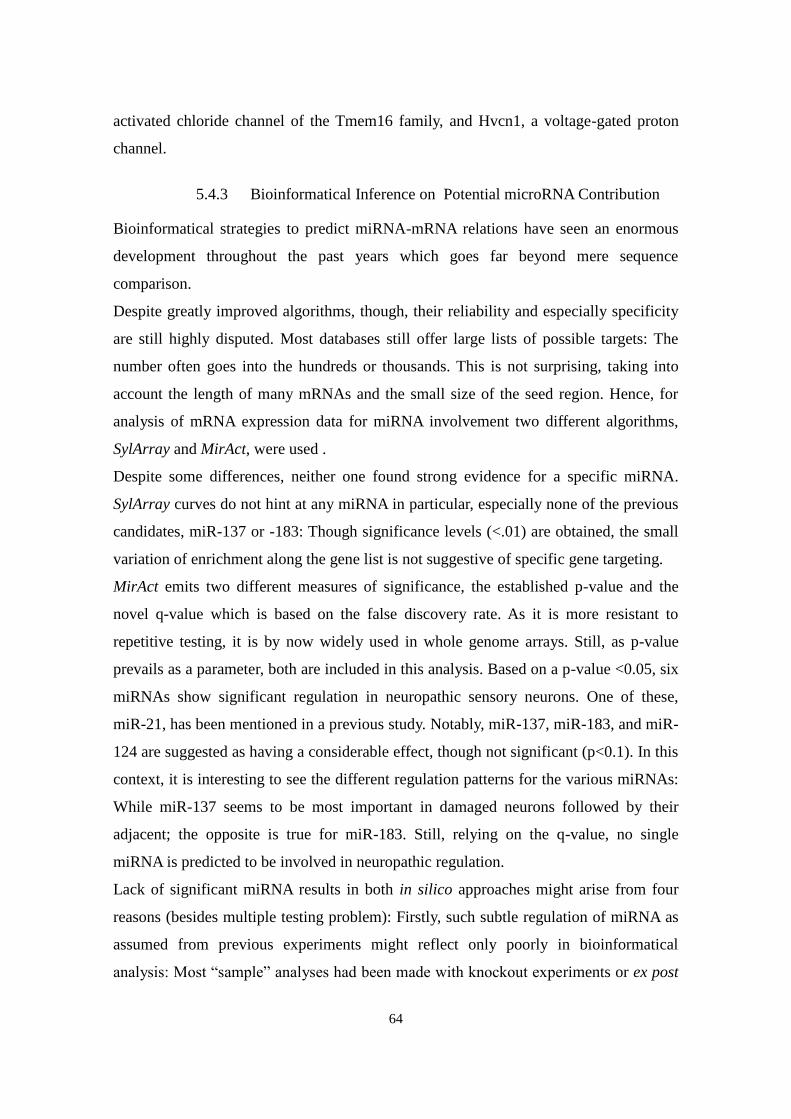
64
activated chloride channel of the Tmem16 family, and Hvcn1, a voltage-gated proton
channel.
5.4.3 Bioinformatical Inference on Potential microRNA Contribution
Bioinformatical strategies to predict miRNA-mRNA relations have seen an enormous
development throughout the past years which goes far beyond mere sequence
comparison.
Despite greatly improved algorithms, though, their reliability and especially specificity
are still highly disputed. Most databases still offer large lists of possible targets: The
number often goes into the hundreds or thousands. This is not surprising, taking into
account the length of many mRNAs and the small size of the seed region. Hence, for
analysis of mRNA expression data for miRNA involvement two different algorithms,
SylArray and MirAct, were used .
Despite some differences, neither one found strong evidence for a specific miRNA.
SylArray curves do not hint at any miRNA in particular, especially none of the previous
candidates, miR-137 or -183: Though significance levels (<.01) are obtained, the small
variation of enrichment along the gene list is not suggestive of specific gene targeting.
MirAct emits two different measures of significance, the established p-value and the
novel q-value which is based on the false discovery rate. As it is more resistant to
repetitive testing, it is by now widely used in whole genome arrays. Still, as p-value
prevails as a parameter, both are included in this analysis. Based on a p-value <0.05, six
miRNAs show significant regulation in neuropathic sensory neurons. One of these,
miR-21, has been mentioned in a previous study. Notably, miR-137, miR-183, and miR-
124 are suggested as having a considerable effect, though not significant (p<0.1). In this
context, it is interesting to see the different regulation patterns for the various miRNAs:
While miR-137 seems to be most important in damaged neurons followed by their
adjacent; the opposite is true for miR-183. Still, relying on the q-value, no single
miRNA is predicted to be involved in neuropathic regulation.
Lack of significant miRNA results in both in silico approaches might arise from four
reasons (besides multiple testing problem): Firstly, such subtle regulation of miRNA as
assumed from previous experiments might reflect only poorly in bioinformatical
analysis: Most “sample” analyses had been made with knockout experiments or ex post
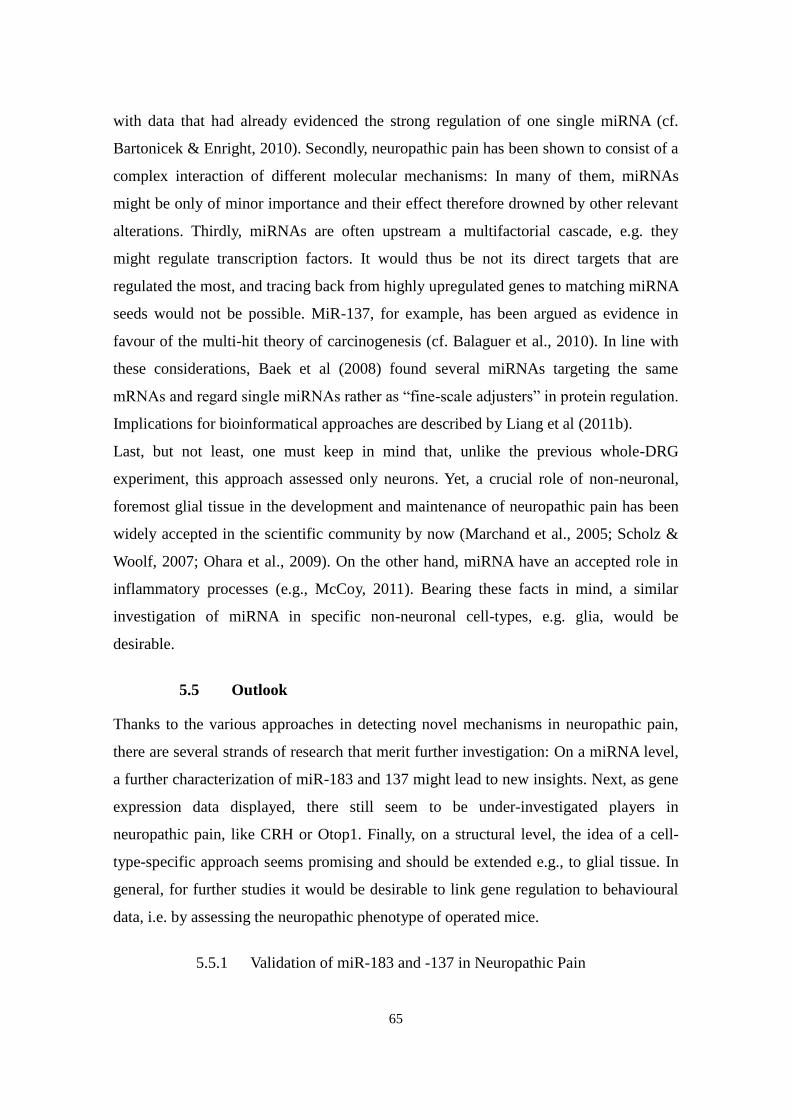
65
with data that had already evidenced the strong regulation of one single miRNA (cf.
Bartonicek & Enright, 2010). Secondly, neuropathic pain has been shown to consist of a
complex interaction of different molecular mechanisms: In many of them, miRNAs
might be only of minor importance and their effect therefore drowned by other relevant
alterations. Thirdly, miRNAs are often upstream a multifactorial cascade, e.g. they
might regulate transcription factors. It would thus be not its direct targets that are
regulated the most, and tracing back from highly upregulated genes to matching miRNA
seeds would not be possible. MiR-137, for example, has been argued as evidence in
favour of the multi-hit theory of carcinogenesis (cf. Balaguer et al., 2010). In line with
these considerations, Baek et al (2008) found several miRNAs targeting the same
mRNAs and regard single miRNAs rather as “fine-scale adjusters” in protein regulation.
Implications for bioinformatical approaches are described by Liang et al (2011b).
Last, but not least, one must keep in mind that, unlike the previous whole-DRG
experiment, this approach assessed only neurons. Yet, a crucial role of non-neuronal,
foremost glial tissue in the development and maintenance of neuropathic pain has been
widely accepted in the scientific community by now (Marchand et al., 2005; Scholz &
Woolf, 2007; Ohara et al., 2009). On the other hand, miRNA have an accepted role in
inflammatory processes (e.g., McCoy, 2011). Bearing these facts in mind, a similar
investigation of miRNA in specific non-neuronal cell-types, e.g. glia, would be
desirable.
5.5 Outlook
Thanks to the various approaches in detecting novel mechanisms in neuropathic pain,
there are several strands of research that merit further investigation: On a miRNA level,
a further characterization of miR-183 and 137 might lead to new insights. Next, as gene
expression data displayed, there still seem to be under-investigated players in
neuropathic pain, like CRH or Otop1. Finally, on a structural level, the idea of a cell-
type-specific approach seems promising and should be extended e.g., to glial tissue. In
general, for further studies it would be desirable to link gene regulation to behavioural
data, i.e. by assessing the neuropathic phenotype of operated mice.
5.5.1 Validation of miR-183 and -137 in Neuropathic Pain
66
The next step in defining the role of miR-183 and -137 in neuropathic pain would be in-
vivo testing. Yet considering the complex and heterogeneous mechanisms underlying
the emergence of pain, manipulation of a single miRNA would scarcely lead to
measurable changes in phenotype. (If at all, extreme mimicking might lead to some
induction of neuropathic pain-like behaviour in non-injured mice.) Rather, it might be
more promising to further narrow down potential targets, be it experimentally, like
HITS-CLIP (high-throughput sequencing of RNAs isolated by crosslinking
immunoprecipitation, cf. Licatalosi, 2008) or with further refined bioinformatical
methods. Based on this, potential pathways might be developed and their role be further
defined by manipulating the entire pathway instead of a single regulatory unit.
5.5.2 Further Characterisation of Specific Genes in Neuropathic Pain
The results displayed a distinctive expression pattern of several genes little or not at all
described in relation to neuropathic pain until now. Among the most striking ones is
certainly corticoliberin (CRH) which exhibits features similar to other peptides like
galanin, substance P, and vasoactive intestinal peptide (VIP). First follow-up
experiments within our work group seem to confirm the results (Reinhold et al.,
submitted); in-vivo studies including transgenic approaches are in progress.
Also, the role of calcium-regulating Otop1 deserves further investigation: Its effect via
purinergic P2X receptors renders the peptide highly interesting, as does the topical
relation to miR-183 in the vestibular inner ear. Immunohistochemistry in control vs.
neuropathic tissue might endorse the findings presented here. Also, a quantitative
assessment of Otop1 after miRNA-183 silencing might offer further insight. Again, in-
vivo silencing or mimicking of Otop1 is challenging not only for the complexity of
neuropathic phenotypes but also for the global relevance of its most relevant target,
P2XR: As it is crucial not only for neuropathic conditions, a highly distorted phenotype
is to be expected.
5.5.3 Cell Type-Specific Expression Analysis
Given the diversity in cellular composition of DRG and the neuron-specific results
presented here, the concept of cell type-specific analysis seems promising. A similar

67
approach for glial tissue, i.e. satellite cells ipsi- and contralaterally is conceivable. Yet,
one has to bear in mind that satellite cells are mainly involved in inflammatory
processes of neuropathic pain: therefore, phenotypic testing would be necessary here to
rule out mere inflammation due to an invasive and potentially infectious procedure (as
an alternative, pain parameters could be measured in neuronal populations).
Also, it would be interesting to repeat the neuron-specific approach with a miRNA
microarray or with naïve animals as negative controls. Still, both approaches would
require considerably higher amounts of RNA and therefore primary tissue, if conducted
in mice.
68
6 Summary/Zusammenfassung
6.1 Summary
Neuropathic pain, caused by neuronal damage, is a severely impairing mostly chronic
condition. Its underlying molecular mechanisms have not yet been thoroughly
understood in their variety. In this doctoral thesis, I investigated the role of microRNAs
(miRNAs) in a murine model of peripheral neuropathic pain. MiRNAs are small, non-
coding RNAs known to play a crucial role in post-transcriptional gene regulation,
mainly in cell proliferation and differentiation. Initially, expression patterns in affected
dorsal root ganglia (DRG) at different time points after setting a peripheral nerve lesion
were studied. DRG showed an increasingly differential expression pattern over the
course of one week. Interestingly, a similar effect, albeit to a smaller extent, was
observed in corresponding contralateral ganglia. Five miRNA (miR-124, miR-137,
miR-183, miR-27b, and miR-505) were further analysed. qPCR, in situ hybridization,
and bioinformatical analysis point towards a role for miR-137 and -183 in neuropathic
pain as both were downregulated. Furthermore, miR-137 is shown to be specific for
non-peptidergic non-myelinated nociceptors (C fibres) in DRG. As the ganglia consist
of highly heterocellular tissue, I also developed a neuron-specific approach. Primarily
damaged neurons were separated from intact adjacent neurons using fluorescence-
activated cell-sorting and their gene expression pattern was analysed using a microarray.
Thereby, not only were information obtained about mRNA expression in both groups
but, by bioinformatical tools, also inferences on miRNA involvement. The general
expression pattern was consistent with previous findings. Still, several genes were found
differentially expressed that had not been described in this context before. Among these
are corticoliberin or cation-regulating proteins like Otopetrin1. Bioinformatical data
conformed, in part, to results from whole DRG, e.g. they implied a down-regulation of
miR-124, -137, and -183. However, these results were not significant.
In summary, I found that a) miRNA expression in DRG is influenced by nerve lesions
typical of neuropathic pain and that b) these changes develop simultaneously to over-
expression of galanin, a marker for neuronal damage. Furthermore, several miRNAs
(miR-183, -137) exhibit distinct expression patterns in whole-DRG as well as in neuron-
specific approaches. Therefore, further investigation of their possible role in initiation
and maintenance of neuropathic pain seems promising.

69
Finally, the differential expression of genes like Corticoliberin or Otopetrin 1,
previously not described in neuropathic pain, has already resulted in follow-up projects.
70
6.2 Zusammenfassung
Neuropathischer Schmerz, d.h. Schmerz durch neuronale Schäden, ist eine stark
beeinträchtigendes, oft chronisches Leiden. Die hierfür verantwortlichen molekularen
Geschehen sind in ihrer Breite bislang nur unzureichend verstanden. In meiner
Promotion habe ich die Rolle von microRNAs (miRNAs) in einem Mäusemodell des
peripheren neuropathischen Schmerzes untersucht. MiRNAs sind kleine, nicht
kodierende RNAs, die für posttranskriptionelle Genregulation, besonders
Zellproliferation und –differenzierung verantwortlich sind. Im Experiment wurde
zunächst ihre Expression in den Dorsalganglien geschädigter Nerven analysiert. Hier
zeigte sich im Verlauf einer Woche ein zunehmend differentielles Expressionsmuster.
Bemerkenswert war ein ähnlicher, wenn auch geringerer Effekt in kontralateralen
Ganglien. In einem weiteren Schritt wurden fünf ausgewählte miRNAs (miR-124, miR-
137, miR-183, miR-27b und miR-505) weiter analysiert. qPCR, In-situ-Hybridisierung
und bioinformatische Untersuchungen deuteten auf Minderexpression von miR-137 und
-183 bei neuropathischem Schmerz hin. Weiterhin stellte sich miR-137 als spezifisch für
nicht-peptiderge nicht-myelinisierte Nozizeptoren in Dorsalganglien heraus. Da
Dorsalganglien aus äußerst heterozellulärem Gewebe bestehen, entwickelte ich im
Folgenden einen neuronenspezifischen Ansatz: Primär geschädigte sowie intakte
benachbarte Neuronen wurden durch fluoreszenzaktivierte Zellsortierung (FACS)
selektiert und ihre Genexpression jeweils in einem Microarray analysiert. Hierdurch
konnten nicht nur direkte Informationen über mRNA-Expression in beiden Gruppen
gewonnen, sondern durch bioinformatische Techniken auch Rückschlüsse auf miRNA-
Expression gezogen werden. Das generelle Expressionsmuster entsprach der
einschlägigen Literatur, allerdings zeigten sich auch bislang nicht beschriebene
Veränderungen. Hierzu gehören Corticoliberin sowie Otopetrin1. Die bioinformatische
Analyse bestätigte teilweise die Ergebnisse aus der ersten, ganglienweiten
Untersuchung: Sie wiesen auf eine Minderexpression von miR-124, -137 und -183 hin,
allerdings waren diese Ergebnisse nicht signifikant.
Zusammengefasst zeigte sich, dass sich a) die Expression von miRNA in
Dorsalganglien nach neuropathischen Läsionen ändert, und b) diese Veränderungen
parallel zum neuropathischen Phänotyp entwickeln. Weiterhin wiesen mehrere miRNAs

71
markante Expressionsmuster sowohl in ganglienweiten wie in neuronenspezifischen
Untersuchugen auf. Daher scheint die weitere Untersuchung ihrer Rolle in Entwicklung
und Aufrechterhaltung von neuropathischem Schmerz vielversprechend. Schließlich hat
die Entdeckung von Expressionsveränderungen bei Genen wie Corticoliberin und
Otopetrin1, bislang nicht im Zusammenhang mit neuropathischem Schmerz
beschrieben, bereits zu Nachfolgeprojekten geführt.
72
7 Bibliography
Aguilera G & Liu Y (2012). The molecular physiology of CRH neurons. Front
Neuroendocrinol 33(1): 67-84.
Aldrich BT, Frakes EP, Kasuya J, et al. (2009). Changes in expression of sensory organ-
specific microRNAs in rat dorsal root ganglia in association with mechanical
hypersensitivity induced by spinal nerve ligation. Neuroscience 164(2): 711-723.
Alloui A, Zimmermann K, Mamet J, et al. (2006). Trek-1, a K+ channel involved in
polymodal pain perception. EMBO J 25: 2368-2376.
Attal N, Cruccu G, Haanpaa M, et al. (2006). EFNS guidelines on pharmacological
treatment of neuropathic pain. Eur J Neurol 13(11): 1153-1169.
Bähr M & Frotscher M (2003). Duus' Neurologisch-topische Diagnostik. Stuttgart,
Georg Thieme Verlag.
Baek D, Villén J, Shin C, et al. (2008). The impact of microRNAs on protein output.
Nature 455(7209): 64-71.
Baek J, Kang S, Min H (2014). MicroRNA-targeting therapeutics for hepatitis C. Arch
Pharm Res 37(3): 299-305.
Bai G, Ambalavanar R, Wei D, et al. (2007). Downregulation of selective microRNAs
in trigeminal ganglion neurons following inflammatory muscle pain. Mol Pain 3:
15.
Balaguer F, Link A, Lozano JJ, et al. (2010). Epigenetic silencing of miR-137 is an early
event in colorectal carcinogenesis. Tumor and Stem Cell Biology 70(16).
Baron R (2006). Mechanisms of disease: neuropathic pain - a clinical perspective. Nat
Clin Pract Neurol 2(2): 95-106.
Bartel DP (2009). MicroRNAs: target recognition and regulatory functions. Cell 136(2):
215-233.
Bartonicek N & Enright AJ (2010). SylArray: a web server for automated detection of
miRNA effects from expression data. Bioinformatics 26(22): 2900-2901.
Bastian I, Tam Tam S, Zhou XF, et al. (2011). Differential expression of microRNA-1 in
dorsal root ganglion neurons. Histochem Cell Biol 135(1): 37-45.
Bennett GJ & Xie YK (1988). A peripheral mononeuropathy in rat that produces
disorders of pain sensation like those seen in man. Pain 33(1): 87-107.
Bennett GJ (1998). Neuropathic pain: new insights, new interventions. Hosp Pract
(Minneap) 33(10): 95-98.
Berger A, Dukes EM & Oster G (2004). Clinical characteristics and economic costs of
patients with painful neuropathic disorders. J Pain 5(3): 143-149.
Blenkiron C, Goldstein LD, Thorne NP, et al. (2007). MicroRNA expression profiling of
human breast cancer identifies new markers of tumor subtype. Genome Biol
8(10): R214.
Bomholt SF, Mikkelsen JD & Blackburn-Munro G (2005). Normal hypothalamo-
pituitary-adrenal axis function in a rat model of peripheral neuropathic pain.
Brain Res 1044: 216-226.
Bonica JJ (1979). The need of a taxonomy. Pain 6(3): 247-8.
Boucher TJ & McMahon SB (2001). Neurotrophic factors and neuropathic pain. Curr
Opin Pharmacol 1(1): 66-72.
Campbell JN & Meyer RA (2006). Mechanisms of neuropathic pain. Neuron 52(1): 77-
92.
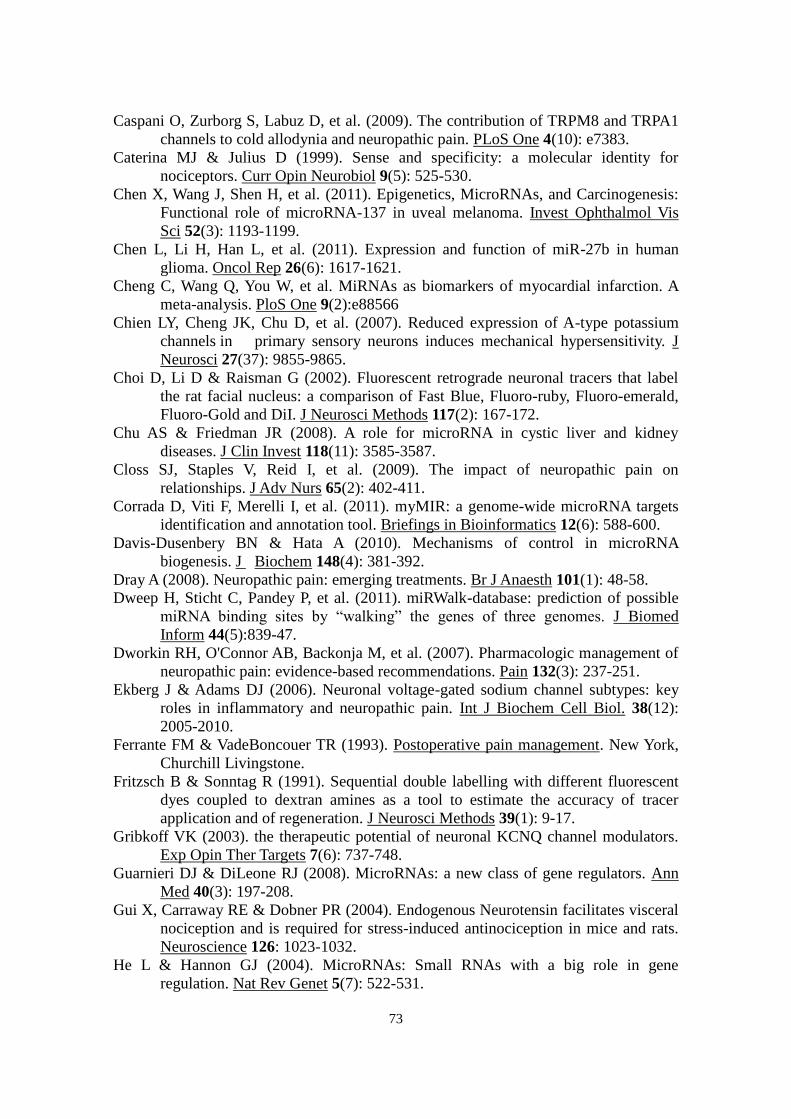
73
Caspani O, Zurborg S, Labuz D, et al. (2009). The contribution of TRPM8 and TRPA1
channels to cold allodynia and neuropathic pain. PLoS One 4(10): e7383.
Caterina MJ & Julius D (1999). Sense and specificity: a molecular identity for
nociceptors. Curr Opin Neurobiol 9(5): 525-530.
Chen X, Wang J, Shen H, et al. (2011). Epigenetics, MicroRNAs, and Carcinogenesis:
Functional role of microRNA-137 in uveal melanoma. Invest Ophthalmol Vis
Sci 52(3): 1193-1199.
Chen L, Li H, Han L, et al. (2011). Expression and function of miR-27b in human
glioma. Oncol Rep 26(6): 1617-1621.
Cheng C, Wang Q, You W, et al. MiRNAs as biomarkers of myocardial infarction. A
meta-analysis. PloS One 9(2):e88566
Chien LY, Cheng JK, Chu D, et al. (2007). Reduced expression of A-type potassium
channels in primary sensory neurons induces mechanical hypersensitivity. J
Neurosci 27(37): 9855-9865.
Choi D, Li D & Raisman G (2002). Fluorescent retrograde neuronal tracers that label
the rat facial nucleus: a comparison of Fast Blue, Fluoro-ruby, Fluoro-emerald,
Fluoro-Gold and DiI. J Neurosci Methods 117(2): 167-172.
Chu AS & Friedman JR (2008). A role for microRNA in cystic liver and kidney
diseases. J Clin Invest 118(11): 3585-3587.
Closs SJ, Staples V, Reid I, et al. (2009). The impact of neuropathic pain on
relationships. J Adv Nurs 65(2): 402-411.
Corrada D, Viti F, Merelli I, et al. (2011). myMIR: a genome-wide microRNA targets
identification and annotation tool. Briefings in Bioinformatics 12(6): 588-600.
Davis-Dusenbery BN & Hata A (2010). Mechanisms of control in microRNA
biogenesis. J Biochem 148(4): 381-392.
Dray A (2008). Neuropathic pain: emerging treatments. Br J Anaesth 101(1): 48-58.
Dweep H, Sticht C, Pandey P, et al. (2011). miRWalk-database: prediction of possible
miRNA binding sites by “walking” the genes of three genomes. J Biomed
Inform 44(5):839-47.
Dworkin RH, O'Connor AB, Backonja M, et al. (2007). Pharmacologic management of
neuropathic pain: evidence-based recommendations. Pain 132(3): 237-251.
Ekberg J & Adams DJ (2006). Neuronal voltage-gated sodium channel subtypes: key
roles in inflammatory and neuropathic pain. Int J Biochem Cell Biol. 38(12):
2005-2010.
Ferrante FM & VadeBoncouer TR (1993). Postoperative pain management. New York,
Churchill Livingstone.
Fritzsch B & Sonntag R (1991). Sequential double labelling with different fluorescent
dyes coupled to dextran amines as a tool to estimate the accuracy of tracer
application and of regeneration. J Neurosci Methods 39(1): 9-17.
Gribkoff VK (2003). the therapeutic potential of neuronal KCNQ channel modulators.
Exp Opin Ther Targets 7(6): 737-748.
Guarnieri DJ & DiLeone RJ (2008). MicroRNAs: a new class of gene regulators. Ann
Med 40(3): 197-208.
Gui X, Carraway RE & Dobner PR (2004). Endogenous Neurotensin facilitates visceral
nociception and is required for stress-induced antinociception in mice and rats.
Neuroscience 126: 1023-1032.
He L & Hannon GJ (2004). MicroRNAs: Small RNAs with a big role in gene
regulation. Nat Rev Genet 5(7): 522-531.
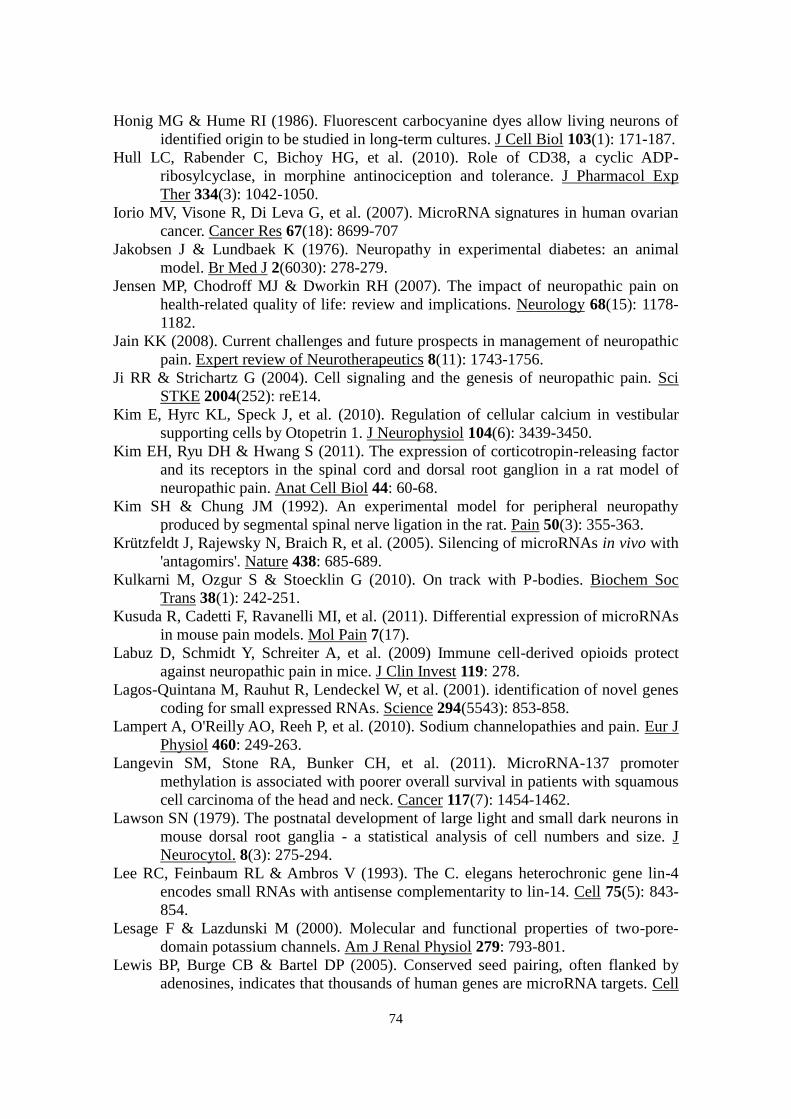
74
Honig MG & Hume RI (1986). Fluorescent carbocyanine dyes allow living neurons of
identified origin to be studied in long-term cultures. J Cell Biol 103(1): 171-187.
Hull LC, Rabender C, Bichoy HG, et al. (2010). Role of CD38, a cyclic ADP-
ribosylcyclase, in morphine antinociception and tolerance. J Pharmacol Exp
Ther 334(3): 1042-1050.
Iorio MV, Visone R, Di Leva G, et al. (2007). MicroRNA signatures in human ovarian
cancer. Cancer Res 67(18): 8699-707
Jakobsen J & Lundbaek K (1976). Neuropathy in experimental diabetes: an animal
model. Br Med J 2(6030): 278-279.
Jensen MP, Chodroff MJ & Dworkin RH (2007). The impact of neuropathic pain on
health-related quality of life: review and implications. Neurology 68(15): 1178-
1182.
Jain KK (2008). Current challenges and future prospects in management of neuropathic
pain. Expert review of Neurotherapeutics 8(11): 1743-1756.
Ji RR & Strichartz G (2004). Cell signaling and the genesis of neuropathic pain. Sci
STKE 2004(252): reE14.
Kim E, Hyrc KL, Speck J, et al. (2010). Regulation of cellular calcium in vestibular
supporting cells by Otopetrin 1. J Neurophysiol 104(6): 3439-3450.
Kim EH, Ryu DH & Hwang S (2011). The expression of corticotropin-releasing factor
and its receptors in the spinal cord and dorsal root ganglion in a rat model of
neuropathic pain. Anat Cell Biol 44: 60-68.
Kim SH & Chung JM (1992). An experimental model for peripheral neuropathy
produced by segmental spinal nerve ligation in the rat. Pain 50(3): 355-363.
Krützfeldt J, Rajewsky N, Braich R, et al. (2005). Silencing of microRNAs in vivo with
'antagomirs'. Nature 438: 685-689.
Kulkarni M, Ozgur S & Stoecklin G (2010). On track with P-bodies. Biochem Soc
Trans 38(1): 242-251.
Kusuda R, Cadetti F, Ravanelli MI, et al. (2011). Differential expression of microRNAs
in mouse pain models. Mol Pain 7(17).
Labuz D, Schmidt Y, Schreiter A, et al. (2009) Immune cell-derived opioids protect
against neuropathic pain in mice. J Clin Invest 119: 278.
Lagos-Quintana M, Rauhut R, Lendeckel W, et al. (2001). identification of novel genes
coding for small expressed RNAs. Science 294(5543): 853-858.
Lampert A, O'Reilly AO, Reeh P, et al. (2010). Sodium channelopathies and pain. Eur J
Physiol 460: 249-263.
Langevin SM, Stone RA, Bunker CH, et al. (2011). MicroRNA-137 promoter
methylation is associated with poorer overall survival in patients with squamous
cell carcinoma of the head and neck. Cancer 117(7): 1454-1462.
Lawson SN (1979). The postnatal development of large light and small dark neurons in
mouse dorsal root ganglia - a statistical analysis of cell numbers and size. J
Neurocytol. 8(3): 275-294.
Lee RC, Feinbaum RL & Ambros V (1993). The C. elegans heterochronic gene lin-4
encodes small RNAs with antisense complementarity to lin-14. Cell 75(5): 843-
854.
Lesage F & Lazdunski M (2000). Molecular and functional properties of two-pore-
domain potassium channels. Am J Renal Physiol 279: 793-801.
Lewis BP, Burge CB & Bartel DP (2005). Conserved seed pairing, often flanked by
adenosines, indicates that thousands of human genes are microRNA targets. Cell
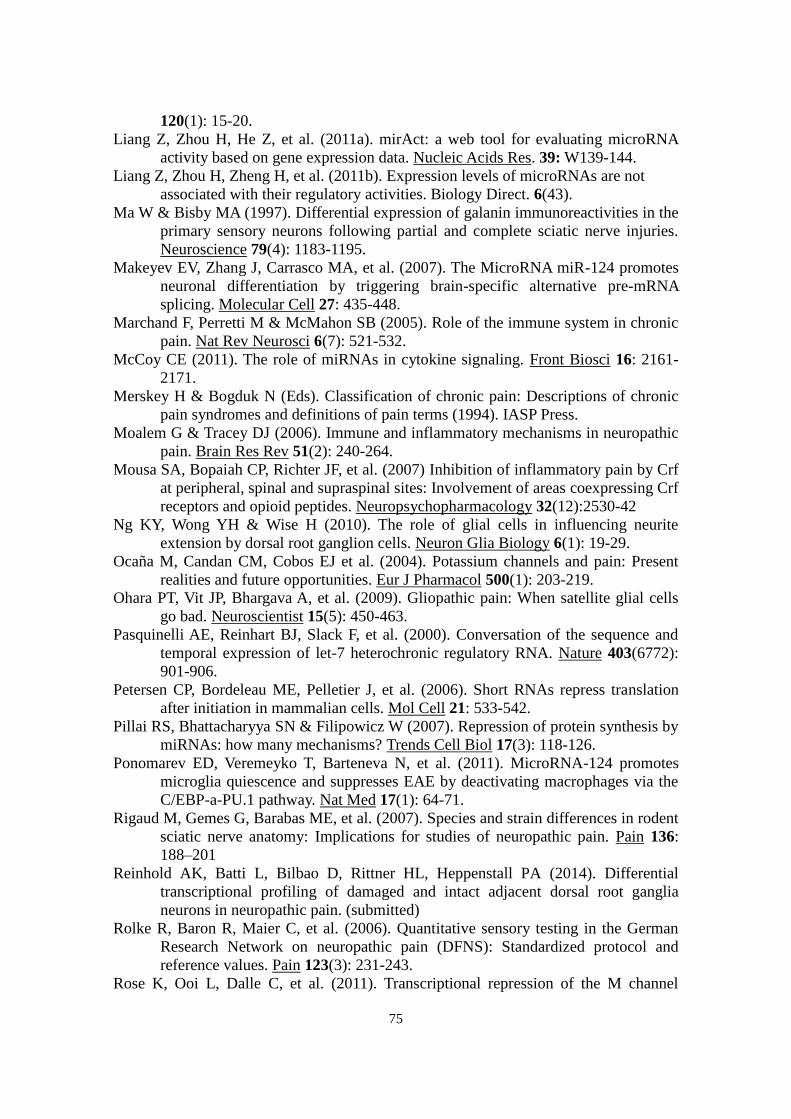
75
120(1): 15-20.
Liang Z, Zhou H, He Z, et al. (2011a). mirAct: a web tool for evaluating microRNA
activity based on gene expression data. Nucleic Acids Res. 39: W139-144.
Liang Z, Zhou H, Zheng H, et al. (2011b). Expression levels of microRNAs are not
associated with their regulatory activities. Biology Direct. 6(43).
Ma W & Bisby MA (1997). Differential expression of galanin immunoreactivities in the
primary sensory neurons following partial and complete sciatic nerve injuries.
Neuroscience 79(4): 1183-1195.
Makeyev EV, Zhang J, Carrasco MA, et al. (2007). The MicroRNA miR-124 promotes
neuronal differentiation by triggering brain-specific alternative pre-mRNA
splicing. Molecular Cell 27: 435-448.
Marchand F, Perretti M & McMahon SB (2005). Role of the immune system in chronic
pain. Nat Rev Neurosci 6(7): 521-532.
McCoy CE (2011). The role of miRNAs in cytokine signaling. Front Biosci 16: 2161-
2171.
Merskey H & Bogduk N (Eds). Classification of chronic pain: Descriptions of chronic
pain syndromes and definitions of pain terms (1994). IASP Press.
Moalem G & Tracey DJ (2006). Immune and inflammatory mechanisms in neuropathic
pain. Brain Res Rev 51(2): 240-264.
Mousa SA, Bopaiah CP, Richter JF, et al. (2007) Inhibition of inflammatory pain by Crf
at peripheral, spinal and supraspinal sites: Involvement of areas coexpressing Crf
receptors and opioid peptides. Neuropsychopharmacology 32(12):2530-42
Ng KY, Wong YH & Wise H (2010). The role of glial cells in influencing neurite
extension by dorsal root ganglion cells. Neuron Glia Biology 6(1): 19-29.
Ocaña M, Candan CM, Cobos EJ et al. (2004). Potassium channels and pain: Present
realities and future opportunities. Eur J Pharmacol 500(1): 203-219.
Ohara PT, Vit JP, Bhargava A, et al. (2009). Gliopathic pain: When satellite glial cells
go bad. Neuroscientist 15(5): 450-463.
Pasquinelli AE, Reinhart BJ, Slack F, et al. (2000). Conversation of the sequence and
temporal expression of let-7 heterochronic regulatory RNA. Nature 403(6772):
901-906.
Petersen CP, Bordeleau ME, Pelletier J, et al. (2006). Short RNAs repress translation
after initiation in mammalian cells. Mol Cell 21: 533-542.
Pillai RS, Bhattacharyya SN & Filipowicz W (2007). Repression of protein synthesis by
miRNAs: how many mechanisms? Trends Cell Biol 17(3): 118-126.
Ponomarev ED, Veremeyko T, Barteneva N, et al. (2011). MicroRNA-124 promotes
microglia quiescence and suppresses EAE by deactivating macrophages via the
C/EBP-a-PU.1 pathway. Nat Med 17(1): 64-71.
Rigaud M, Gemes G, Barabas ME, et al. (2007). Species and strain differences in rodent
sciatic nerve anatomy: Implications for studies of neuropathic pain. Pain 136:
188–201
Reinhold AK, Batti L, Bilbao D, Rittner HL, Heppenstall PA (2014). Differential
transcriptional profiling of damaged and intact adjacent dorsal root ganglia
neurons in neuropathic pain. (submitted)
Rolke R, Baron R, Maier C, et al. (2006). Quantitative sensory testing in the German
Research Network on neuropathic pain (DFNS): Standardized protocol and
reference values. Pain 123(3): 231-243.
Rose K, Ooi L, Dalle C, et al. (2011). Transcriptional repression of the M channel
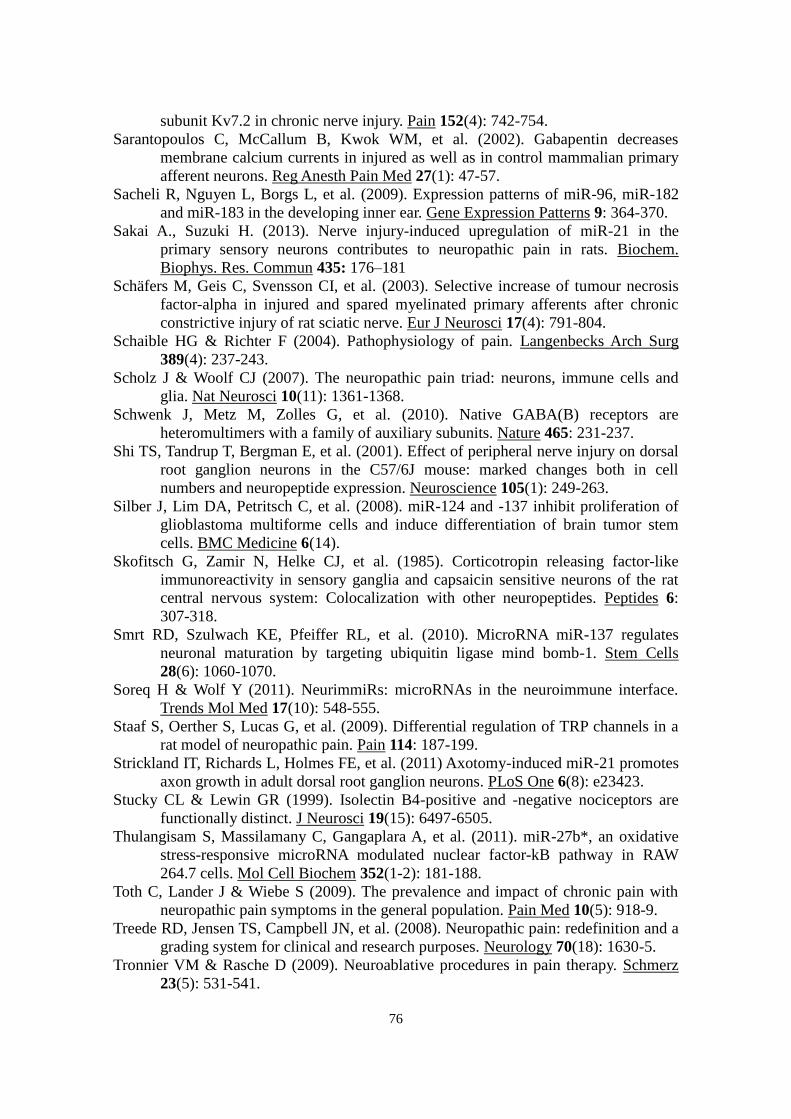
76
subunit Kv7.2 in chronic nerve injury. Pain 152(4): 742-754.
Sarantopoulos C, McCallum B, Kwok WM, et al. (2002). Gabapentin decreases
membrane calcium currents in injured as well as in control mammalian primary
afferent neurons. Reg Anesth Pain Med 27(1): 47-57.
Sacheli R, Nguyen L, Borgs L, et al. (2009). Expression patterns of miR-96, miR-182
and miR-183 in the developing inner ear. Gene Expression Patterns 9: 364-370.
Sakai A., Suzuki H. (2013). Nerve injury-induced upregulation of miR-21 in the
primary sensory neurons contributes to neuropathic pain in rats. Biochem.
Biophys. Res. Commun 435: 176–181
Schäfers M, Geis C, Svensson CI, et al. (2003). Selective increase of tumour necrosis
factor-alpha in injured and spared myelinated primary afferents after chronic
constrictive injury of rat sciatic nerve. Eur J Neurosci 17(4): 791-804.
Schaible HG & Richter F (2004). Pathophysiology of pain. Langenbecks Arch Surg
389(4): 237-243.
Scholz J & Woolf CJ (2007). The neuropathic pain triad: neurons, immune cells and
glia. Nat Neurosci 10(11): 1361-1368.
Schwenk J, Metz M, Zolles G, et al. (2010). Native GABA(B) receptors are
heteromultimers with a family of auxiliary subunits. Nature 465: 231-237.
Shi TS, Tandrup T, Bergman E, et al. (2001). Effect of peripheral nerve injury on dorsal
root ganglion neurons in the C57/6J mouse: marked changes both in cell
numbers and neuropeptide expression. Neuroscience 105(1): 249-263.
Silber J, Lim DA, Petritsch C, et al. (2008). miR-124 and -137 inhibit proliferation of
glioblastoma multiforme cells and induce differentiation of brain tumor stem
cells. BMC Medicine 6(14).
Skofitsch G, Zamir N, Helke CJ, et al. (1985). Corticotropin releasing factor-like
immunoreactivity in sensory ganglia and capsaicin sensitive neurons of the rat
central nervous system: Colocalization with other neuropeptides. Peptides 6:
307-318.
Smrt RD, Szulwach KE, Pfeiffer RL, et al. (2010). MicroRNA miR-137 regulates
neuronal maturation by targeting ubiquitin ligase mind bomb-1. Stem Cells
28(6): 1060-1070.
Soreq H & Wolf Y (2011). NeurimmiRs: microRNAs in the neuroimmune interface.
Trends Mol Med 17(10): 548-555.
Staaf S, Oerther S, Lucas G, et al. (2009). Differential regulation of TRP channels in a
rat model of neuropathic pain. Pain 114: 187-199.
Strickland IT, Richards L, Holmes FE, et al. (2011) Axotomy-induced miR-21 promotes
axon growth in adult dorsal root ganglion neurons. PLoS One 6(8): e23423.
Stucky CL & Lewin GR (1999). Isolectin B4-positive and -negative nociceptors are
functionally distinct. J Neurosci 19(15): 6497-6505.
Thulangisam S, Massilamany C, Gangaplara A, et al. (2011). miR-27b*, an oxidative
stress-responsive microRNA modulated nuclear factor-kB pathway in RAW
264.7 cells. Mol Cell Biochem 352(1-2): 181-188.
Toth C, Lander J & Wiebe S (2009). The prevalence and impact of chronic pain with
neuropathic pain symptoms in the general population. Pain Med 10(5): 918-9.
Treede RD, Jensen TS, Campbell JN, et al. (2008). Neuropathic pain: redefinition and a
grading system for clinical and research purposes. Neurology 70(18): 1630-5.
Tronnier VM & Rasche D (2009). Neuroablative procedures in pain therapy. Schmerz
23(5): 531-541.
77
Tsujino H, Kondo E, Fukuoka T, et al. (2000). Activating transcription factor 3 (ATF3)
induction by axotomy in sensory and motoneurons: A novel neuronal marker of
nerve injury. Mol Cell Neurosci 15(2): 170-182.
Urbich C, Kuehbacher A & Dimmeler S (2008). Role of microRNAs in vasculare
diseases, inflammation, and angiogenesis. Cardiovasc Res 79(4): 581-588.
van der Ree MH, de Bruijne J, Kootstra NA, et al. (2014). MicroRNAs: role and
therapeutic target sin viral hepatitis. Antivit Ther (epub ahead of print)
van Dongen S, Abreu-Goodger C & Enright AJ (2008). Detecting microRNA binding
and siRNA off-target effects from expression data. Nat Methods 5(12): 1023-
1025.
van Steenwinckel J, Reaux-Le Goazigo A, Pommier B, et al. (2011). CCL2 Released
from neuronal synaptic vesicles in the spinal cord is a major mediator of local
inflammation and pain after peripheral nerve injury. J Neurosci 31(15): 5865-
5875.
Vasudevan S, Tong Y & Steitz JA (2007). Switching from repression to activation:
microRNAs can up-regulate translation. Science 318(5858): 1931-1934.
Vidal-Sanz M, Villegas-Perez MP, Bray GM, et al. (1988). Persistent retrograde
labelling of adult rat retinal ganglion cells with the carbocyanine dye diI. Exp
Neurol 102(1): 92-101.
Villar M, Corté R, Theodorsson E, et al. (1989). Neuropeptide expression in rat dorsal
root ganglion cells and spinal cord after peripheral nerve injury with special
reference to galanin. Neuroscience 33(3): 587-604.
Wall PD, Waxman S & Basbaum AI (1974). Ongoing activity in peripheral nerve: injury
discharge. Exp Neurol 45(3): 576-589.
Waselle L, Quaglia X, Zurn AD (2009). Differential proteoglycan expression in tweo
spinal cord regions after dorsal root injury. Mol Cell Neurosci 42(4): 315-27.
Whitwam JG (1976). Classification of peripheral nerves. Anaesthesia 31(4): 494-503.
Wood JN, Boorman JP, Okuse K, et al. (2004). Voltage-gated sodium channels and pain
pathways. J Neurobiol 61(1): 55-71.
Woolf CJ & Mannion RJ (1999). Neuropathic pain: aetiology, symptoms, mechanisms,
and management. Lancet 353(9168): 1959-1964.
Xu S, Witmer PD, Lumayag S, et al. (2007). MicroRNA transcriptome of mouse retina
and identification of a sensory organ-specific miRNA cluster. J Biol Chem
282(34): 25053-25066.
Yu B, Zhou S, Qian T, et al. (2011). Altered microRNA expression following sciatic
nerve resection in dorsal root ganglia of rats. Acta Biochim Biophys Sin 43(11):
909-915.
Yuan H, Xu S, Wang Y, Xu H, et al. (2010) Corticotrophin-Releasing Hormone (Crh)
facilitates axon outgrowth. Spinal Cord 48: 850.
Zhao J, Lee MC, Momin A, et al. (2010). Small RNAs control sodium channel
expression, nociceptor excitability, and pain thresholds. J Neurosci 30(32):
10860-10871.
Zheng JH, Walters ET & Song XJ (1007). Dissociation of Dorsal Root Ganglion
neurons induces hyperexcitability that it maintained by increased responsiveness
to cAMP and cGMP. J Neurophysiol 97: 15-25.
Zhu M, Yi M, Kim CH, et al. (2011). Integrated miRNA and mRNA expression
profiling of mouse mammary tumor models identifies miRNA signatures
associated with mammary tumor lineage. Genome Biol 12(8): R77.

78
79
8 List of Figures & Tables
Figure 1. Principles of nociception
Figure 2. Regulatory pathways in injured and non-injured neurons
Figure 3. Principles of miRNA biogenesis and action
Figure 4. Principle of fluorescent tracer injection
Figure 5. Galanin expression in ipsi- and contralateral DRG
Figure 6. Condition-based cluster analysis of Luminex data
Figure 7. Expression of miR-183 and -137
Figure 8. Expression of miR-124, -505, and -27b
Figure 9. Chromogenic staining of miR-183 and -137.
Figure 10. Fluorescent in-situ hybridisation of naïve DRG for miR-137
Figure 11. Representative example of flow cytometry.
Figure 12. Microarray similarity analysis
Figure 13. Principal Component Analysis on microarray
Figure 14. SylArray graph of wording regulation in damaged vs contralateral DRG
neurons (significant seeds)
Figure 15. SylArray graph of wording regulation in damaged vs contralateral DRG
neurons (candidates)
Figure 16. SylArray graph of wording regulation in damaged vs adjacent DRG neurons
(significant seeds)
Figure 17. SylArray graph of wording regulation in damaged vs adjacent DRG neurons
(candidates)
Figure 18. MirAct box plot of miRNAs with likely involvement
Figure 19. MirAct box plot for miR-137, -183, and -124
Table 1. Exemplary aetiologies of central and peripheral neuropathic pain
Table 2. Tracer combinations and their interpretation
Table 3. miRNA downregulation 7 d after CCI
Table 4. miRNA upregulation 7 d after CCI
Table 5. Top putative target genes for miR-183
Table 6. Top putative target genes for miR-137
Table 7. Group differences (microarray)
Table 8. Genes upregulated in damaged DRG neurons compared to contralateral control
Table 9. Genes downregulated in damaged DRG neurons compared to contralateral
control
Table 10. Genes upregulated in damaged DRG neurons compared to adjacent neurons
Table 11. Genes downregulated in damaged DRG neurons compared to adjacent
neurons
Table 12. MirAct analysis of gene expression results (most significant)
Table 13. MirAct analysis of gene expression results (candidates)
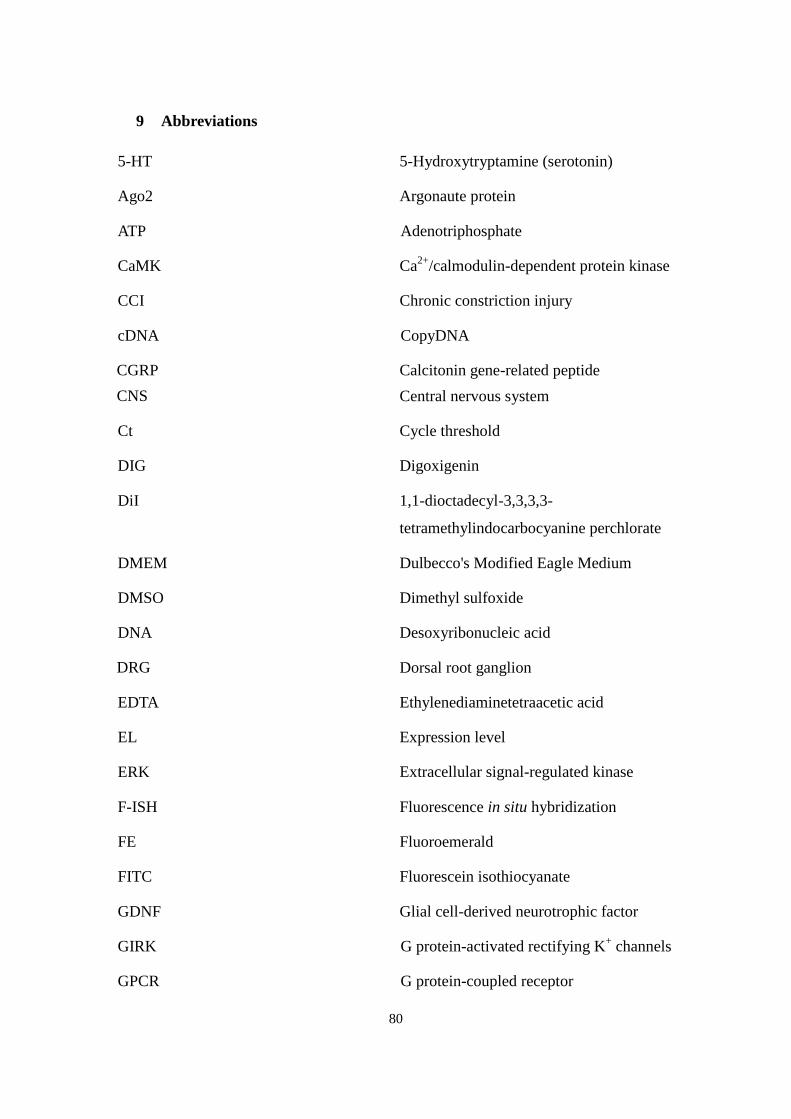
80
9 Abbreviations
5-HT 5-Hydroxytryptamine (serotonin)
Ago2 Argonaute protein
ATP Adenotriphosphate
CaMK Ca2+
/calmodulin-dependent protein kinase
CCI Chronic constriction injury
cDNA CopyDNA
CGRP Calcitonin gene-related peptide
CNS Central nervous system
Ct Cycle threshold
DIG Digoxigenin
DiI 1,1-dioctadecyl-3,3,3,3-
tetramethylindocarbocyanine perchlorate
DMEM Dulbecco's Modified Eagle Medium
DMSO Dimethyl sulfoxide
DNA Desoxyribonucleic acid
DRG Dorsal root ganglion
EDTA Ethylenediaminetetraacetic acid
EL Expression level
ERK Extracellular signal-regulated kinase
F-ISH Fluorescence in situ hybridization
FE Fluoroemerald
FITC Fluorescein isothiocyanate
GDNF Glial cell-derived neurotrophic factor
GIRK G protein-activated rectifying K+ channels
GPCR G protein-coupled receptor
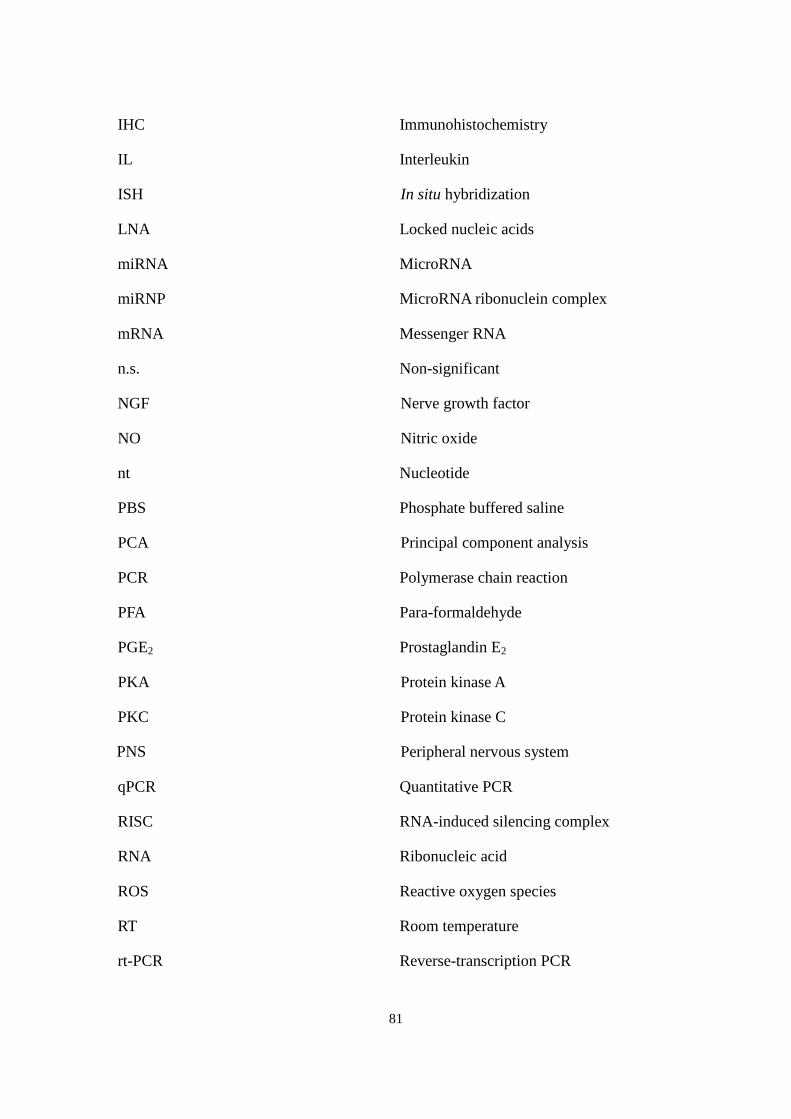
81
IHC Immunohistochemistry
IL Interleukin
ISH In situ hybridization
LNA Locked nucleic acids
miRNA MicroRNA
miRNP MicroRNA ribonuclein complex
mRNA Messenger RNA
n.s. Non-significant
NGF Nerve growth factor
NO Nitric oxide
nt Nucleotide
PBS Phosphate buffered saline
PCA Principal component analysis
PCR Polymerase chain reaction
PFA Para-formaldehyde
PGE2 Prostaglandin E2
PKA Protein kinase A
PKC Protein kinase C
PNS Peripheral nervous system
qPCR Quantitative PCR
RISC RNA-induced silencing complex
RNA Ribonucleic acid
ROS Reactive oxygen species
RT Room temperature
rt-PCR Reverse-transcription PCR
82
SNL Spinal nerve ligation
SSC Saline-sodium citrate
TEA Triethanoleamine
TG Trigeminal ganglion
TNF- α Tumor necrosis factor α
TrkA Tyrosine kinase A
tRNA Transfer RNA
TRP Transient receptor potential
TTX Tetradotoxin
UTR Untranslated region
VIP Vasoactive intestinal peptide
Danksagung
Dass aus diesem Projekt eine Dissertation entstehen konnte, ist vielen Leuten zu
verdanken. Es war eine spannende Zeit, manchmal nervenaufreibend, immer intensiv.
Ich danke meiner Doktormutter, Prof. Dr. med. Heike Rittner, sehr herzlich für ihre
Bereitschaft, die Betreuung meiner Dissertation zu übernehmen, mich zu unterstützen
und so offen in ihrer Arbeitsgruppe aufzunehmen.
Nichts wäre möglich gewesen ohne Prof. Dr. Paul Heppenstall am EMBL in
Monterotondo, der mir dieses spannende Forschungsthema anbot. „There is just one
problem – you‟d have to go to Rome“… Vielen Dank für diese einmalige Chance, die
tolle, produktive und offene Atmosphäre im Labor und die stete Bereitschaft, weitere
Ideen auszutüfteln, doch noch einen neuen Ansatz mitzutragen, nicht nachzulassen...
Die Zeit am EMBL hat auch mein Verständnis von Wissenschaft entscheidend geprägt,
mich gelehrt, Forschung nicht nur methodisch, sondern auch ethisch kritisch zu
hinterfragen, und öfter „the big picture“ zu suchen.
In Monterotondo haben mir viele Leute den Start in die Forschung sehr erleichtert. In
der AG Heppenstall waren dies vor allem Sandra Zurborg und Brian Yurgionas, die
mich mit Expertise, Geduld und Freundschaft den Laboralltag, Techniken und
Frustrationstoleranz gelehrt haben.
Ohne Kasper Rasmussen wäre die Welt der microRNA wohl kaum so anschaulich
geworden; Daniel „the FACS man“ Bilbao Cortez und Emerald Perlas, der mit großer
Expertise und Freundlichkeit in jeglichen Histologiefragen weiterhalf, waren jederzeit
Stützen. Weiterhin danke ich Daniele Hasler für die Weiterführung der Färbungen und
die Überlassung seiner Aufnahmen für diese Arbeit.
Tausend Dank an meine Eltern und Freunde, die ich als konstante Begleiter stets zur
Seite wusste, in Frustrationsphasen wie in Euphoriemomenten.
Grazie, Roma!
1
Curriculum Vitae
Persönliche Daten
Name: Ann-Kristin Reinhold
Geburtsdatum: 20.08.1983 in Münster (D)
Schullaufbahn
1990 - 1994 Grundschule
1994 - 2003 Friedrichs-Gymnasium Herford
2003 Abitur
Studium
2003 - 2004 European Studies (B.A.), Universiteit Maastricht (NL)
2004 - 2005 Psychologie (Dipl.), Albert-Ludwigs-Universität Freiburg
i. Br.
2005 - 2007 Humanmedizin (StEx), Vorklinischer Abschnitt, Albert-
Ludwigs-Universität Freiburg i. Br.
09 / 2007 Erster Teil der Medizinischen Prüfung
2007 - 2012 Humanmedizin (StEx), Klinischer Abschnitt, Charité
Universitätsmedizin Berlin
05 / 2012 Zweiter Teil der Medizinischen Prüfung, Approbation
Klinische Ausbildung
09 / 2008 Famulatur in der Medizinischen Klinik des Mathilden-
Hospitals Herford
08 / 2009 Famulatur in der Medizinischen Rettungsstelle des
Klinikums am Urban Berlin
03 / 2010 Famulatur in der Pädiatrie im Hospital Universitario de los
Andes Merida (Venezuela)
09 / 2010 Famulatur in Neurozentrum und Anästhesiologie des
2
Klinikums Frankfurt/Oder
02 – 12 / 2011 Praktisches Jahr des Medizinstudiums
1. Tertial Neurologie (Wahlfach) Klinikum E. v. Bergmann (Potsdam),
Prof. Dr. W. Christe
2. Tertial Innere Medizin Klinikum E. v. Bergmann (Potsdam)
Prof. Dr. F.X. Kleber (Kardiologie)
Prof. Dr. T. Weinke (Gastroenterologie)
3. Tertial Chirurgie Vivantes Klinikum Neukölln (Berlin),
Prof. Dr. S. Eggeling(Thoraxchirurgie),
Prof. Dr. B. Böhm (Viszeralchirurgie)
Prof. Dr. R.-A. Laun (Unfallchirurgie)
Prof. Dr. B. Tillig (Kinderchirurgie)
01 / 2013 Hospitation in der Zentralen Notaufnahme des Queen
Elizabeth Central Hospital, Blantyre (Malawi)
seit 05/2013 Assistenzärztin in der Weiterbildung, Klinik und Poliklinik
für Anästhesiologie (Prof. Dr. Dr. h.c. N. Roewer)
Wissenschaftliche Ausbildung
2005 – 07 Stud. Hilfskraft am Institut für Allgemeine Psychologie
der Albert-Ludwigs-Universität Freiburg (Prof. H. Spada).
seit 2008 Promotionsprojekt“miRNA-Veränderungen bei
neuropathischem Schmerz”
(Prof. P. Heppenstall, European Molecular Biology
Laboratories (EMBL)/Charité; Prof. H. Rittner)
10 / 2008 – 04 / 09 Trainee am EMBL Montorotondo im Rahmen der
Promotion (Prof. P. Heppenstall).
05 – 11 / 2009 Stud. Hilfskraft am Neurowissenschaftlichen
Forschungszentrums Berlin (Prof. F. Zipp).
12 / 2010 – 02 / 11 Visiting Scientist am EMBL Montorotondo im Rahmen
der Promotion (Prof. P. Heppenstall)
10 / 2012 – 01 / 13 Wissenschaftliche Mitarbeiterin der Klinik für Neurologie,
TU München. Projekt Neurological side effects associated
with neurocysticercosis following mass drug
administration for the control of schistosomiasis in
Malawi (Dr. Dr. A. Winkler)
seit 05/2013 Mitarbeiterin der AG “Molekulare Schmerzforschung”,
Klinik für Anästhesiologie (Prof. Rittner/Prof. Brack)

3
Förderungen/Stipendien
2004 – 12 Stipendiatin der Studienstiftung des Deutschen Volkes
2007 – 08 Kollegiatin des Studienkollegs zu Berlin.
Sprachkenntnisse
Englisch: fließend in Sprache und Schrift
Spanisch: fließend in Sprache und Schrift
Italienisch: Konversationsniveau
Französisch, Niederländisch: Grundkenntnisse


![InsurTech Übersicht - New Players Networknewplayersnetwork.jetzt/wp-content/uploads/2019/09/...InsurTech [Zusammensetzung aus und ] Für diesen](https://static.fdokument.com/doc/165x107/5ec86863d4e86d494304324b/insurtech-oebersicht-new-players-net-insurtech-zusammensetzung-aus-und-.jpg)