PCC AR2015 Umschlag web · 2016-08-16 · PCC AT A GLANCE Rounding differences possible. * for...
195
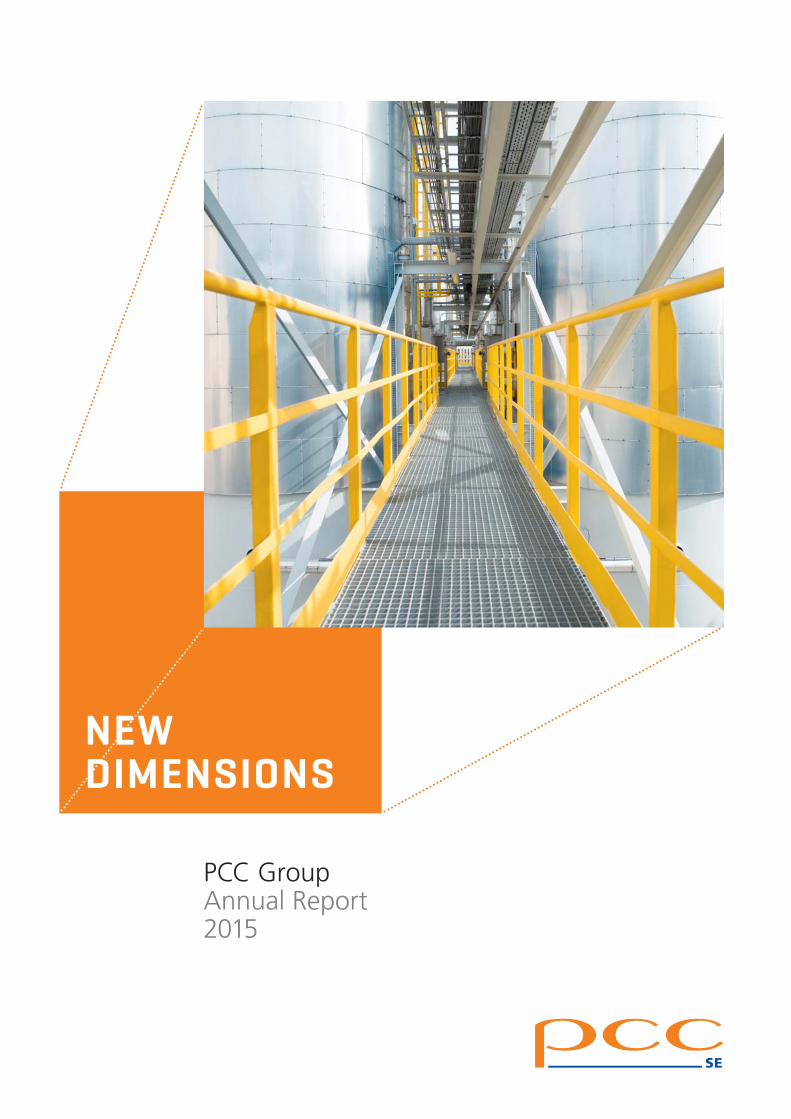
PCC Group Annual Report 2015 NEW DIMENSIONS
Transcript of PCC AR2015 Umschlag web · 2016-08-16 · PCC AT A GLANCE Rounding differences possible. * for...
PCC Group Annual Report 2015
NEWDIMENSIONS
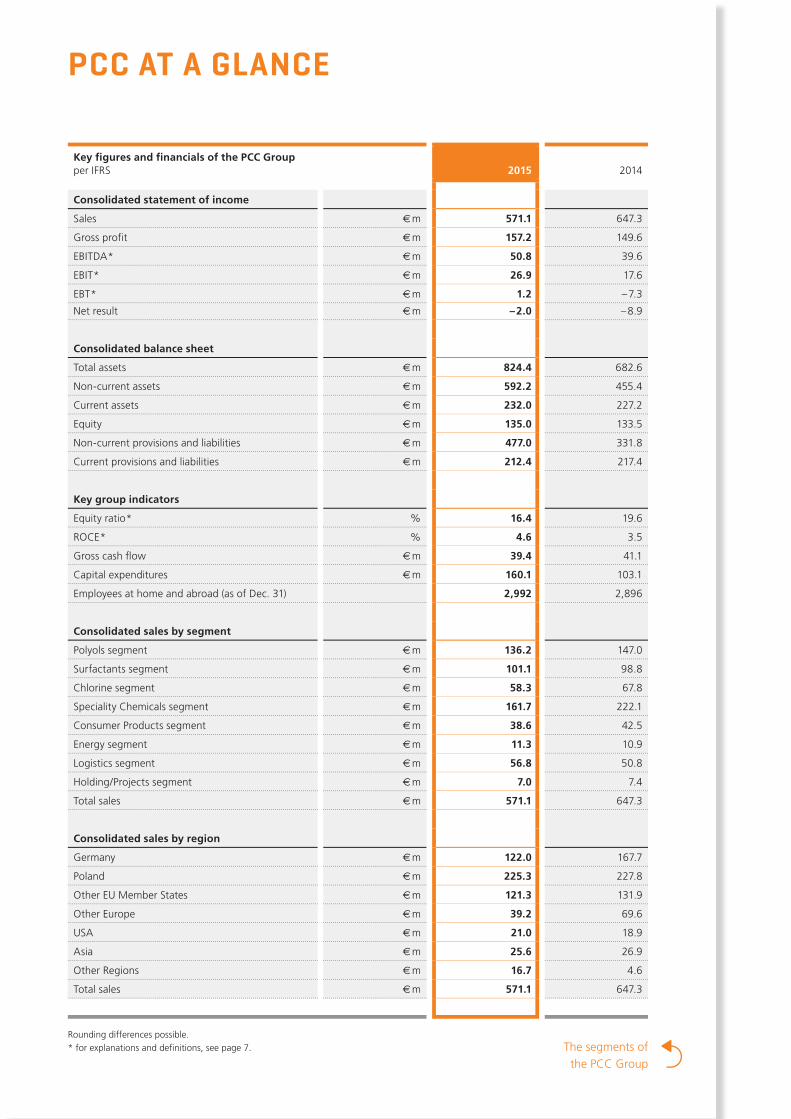
PCC AT A GLANCE
Rounding differences possible. * for explanations and defi nitions, see page 7.
Key fi gures and fi nancials of the PCC Groupper IFRS 2015 2014
Consolidated statement of income
Sales € m 571.1 647.3
Gross profi t € m 157.2 149.6
EBITDA * € m 50.8 39.6
EBIT * € m 26.9 17.6
EBT * € m 1.2 – 7.3
Net result € m – 2.0 – 8.9
Consolidated balance sheet
Total assets € m 824.4 682.6
Non-current assets € m 592.2 455.4
Current assets € m 232.0 227.2
Equity € m 135.0 133.5
Non-current provisions and liabilities € m 477.0 331.8
Current provisions and liabilities € m 212.4 217.4
Key group indicators
Equity ratio * % 16.4 19.6
ROCE * % 4.6 3.5
Gross cash fl ow € m 39.4 41.1
Capital expenditures € m 160.1 103.1
Employees at home and abroad (as of Dec. 31) 2,992 2,896
Consolidated sales by segment
Polyols segment € m 136.2 147.0
Surfactants segment € m 101.1 98.8
Chlorine segment € m 58.3 67.8
Speciality Chemicals segment € m 161.7 222.1
Consumer Products segment € m 38.6 42.5
Energy segment € m 11.3 10.9
Logistics segment € m 56.8 50.8
Holding/Projects segment € m 7.0 7.4
Total sales € m 571.1 647.3
Consolidated sales by region
Germany € m 122.0 167.7
Poland € m 225.3 227.8
Other EU Member States € m 121.3 131.9
Other Europe € m 39.2 69.6
USA € m 21.0 18.9
Asia € m 25.6 26.9
Other Regions € m 16.7 4.6
Total sales € m 571.1 647.3
The segments of the PCC Group
PCC Group Annual Report 2015
NEW DIMENSIONS
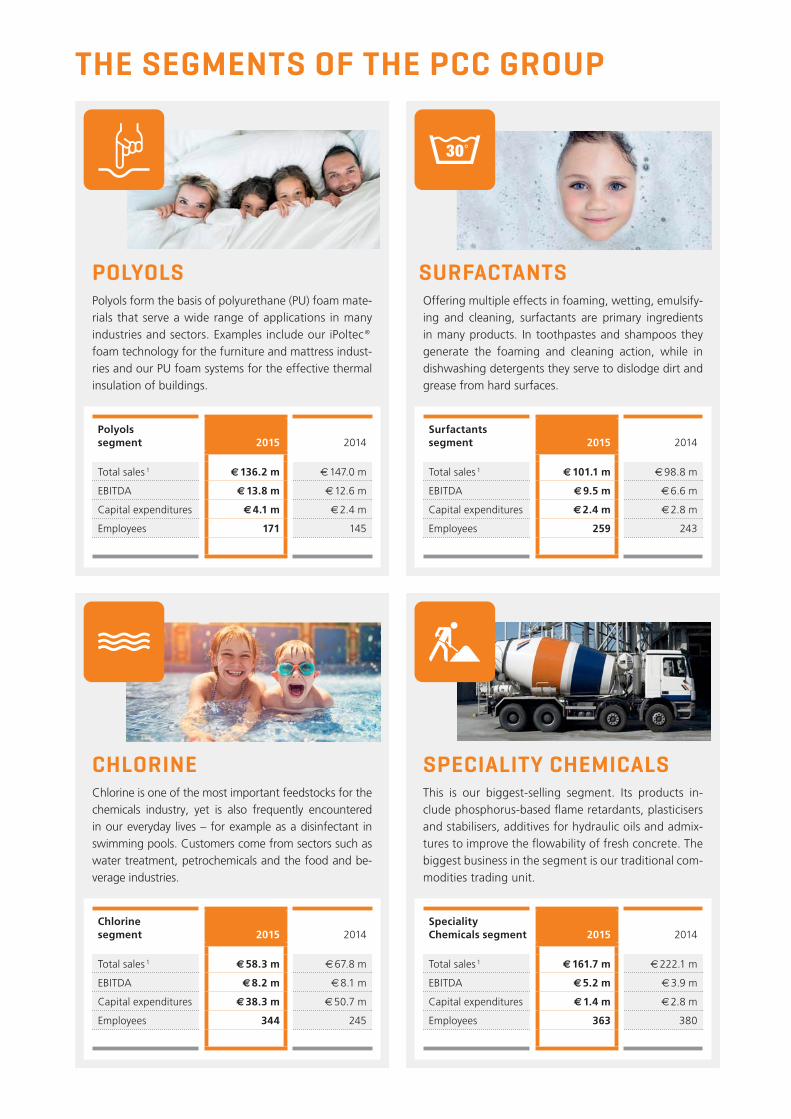
THE SEGMENTS OF THE PCC GROUP
POLYOLS SURFACTANTSPolyols form the basis of polyurethane (PU) foam mate-rials that serve a wide range of applications in many industries and sectors. Examples include our iPoltec® foam technology for the furniture and mattress indust-ries and our PU foam systems for the effective thermal insulation of buildings.
Offering multiple effects in foaming, wetting, emulsify-ing and cleaning, surfactants are primary ingredients in many products. In toothpastes and shampoos they generate the foaming and cleaning action, while in dishwashing detergents they serve to dislodge dirt and grease from hard surfaces.
Polyols segment 2015 2014
Total sales 1 € 136.2 m € 147.0 m
EBITDA € 13.8 m € 12.6 m
Capital expenditures € 4.1 m € 2.4 m
Employees 171 145
Surfactants segment 2015 2014
Total sales 1 € 101.1 m € 98.8 m
EBITDA € 9.5 m € 6.6 m
Capital expenditures € 2.4 m € 2.8 m
Employees 259 243
CHLORINE SPECIALITY CHEMICALS This is our biggest-selling segment. Its products in-clude phosphorus-based fl ame retardants, plasticisers and stabilisers, additives for hydraulic oils and admix-tures to improve the fl owability of fresh concrete. The biggest business in the segment is our traditional com-modities trading unit.
Chlorine is one of the most important feedstocks for the chemicals industry, yet is also frequently encountered in our everyday lives – for example as a disinfectant in swimming pools. Customers come from sectors such as water treatment, petrochemicals and the food and be-verage industries.
Chlorine segment 2015 2014
Total sales 1 € 58.3 m € 67.8 m
EBITDA € 8.2 m € 8.1 m
Capital expenditures € 38.3 m € 50.7 m
Employees 344 245
Speciality Chemicals segment 2015 2014
Total sales 1 € 161.7 m € 222.1 m
EBITDA € 5.2 m € 3.9 m
Capital expenditures € 1.4 m € 2.8 m
Employees 363 380
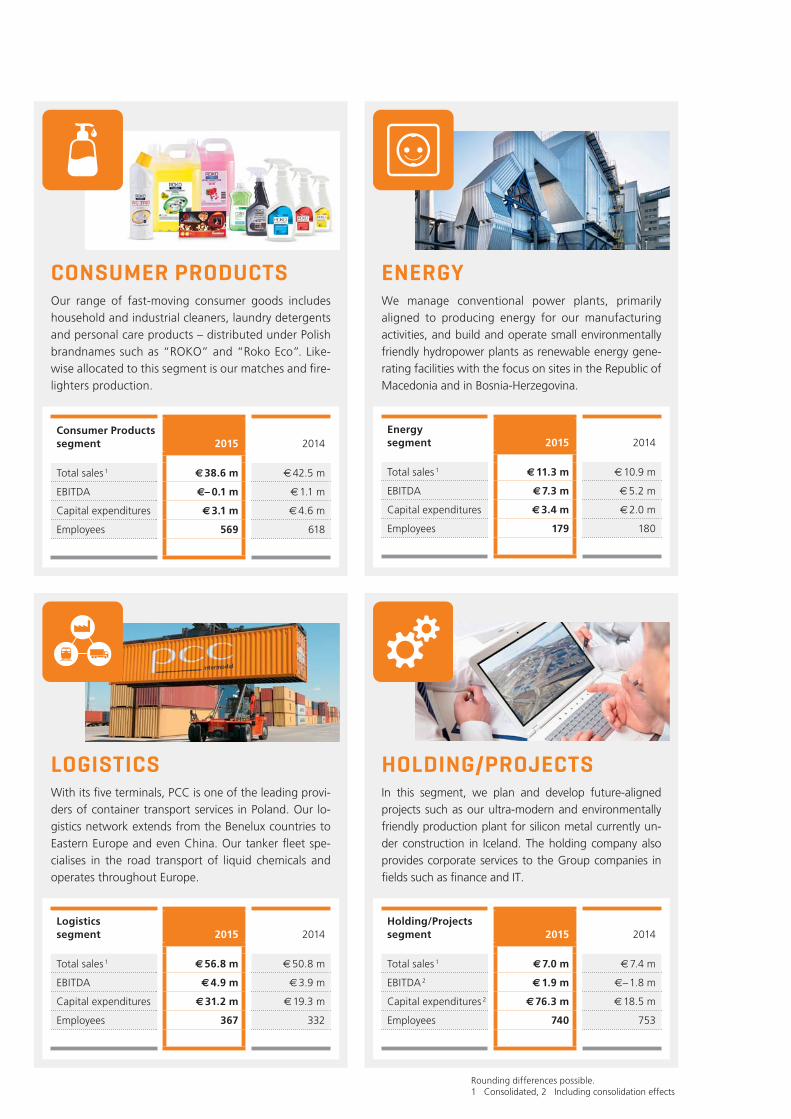
With its fi ve terminals, PCC is one of the leading provi-ders of container transport services in Poland. Our lo-gistics network extends from the Benelux countries to Eastern Europe and even China. Our tanker fl eet spe-cialises in the road transport of liquid chemicals and operates throughout Europe.
In this segment, we plan and develop future-aligned projects such as our ultra-modern and environmentally friendly production plant for silicon metal currently un-der construction in Iceland. The holding company also provides corporate services to the Group companies in fi elds such as fi nance and IT.
LOGISTICS HOLDING/PROJECTS
Rounding differences possible.1 Consolidated, 2 Including consolidation effects
Logistics segment 2015 2014
Total sales 1 € 56.8 m € 50.8 m
EBITDA € 4.9 m € 3.9 m
Capital expenditures € 31.2 m € 19.3 m
Employees 367 332
Holding/Projects segment 2015 2014
Total sales 1 € 7.0 m € 7.4 m
EBITDA 2 € 1.9 m €– 1.8 m
Capital expenditures 2 € 76.3 m € 18.5 m
Employees 740 753
Our range of fast-moving consumer goods includes household and industrial cleaners, laundry detergents and personal care products – distributed under Polish brandnames such as “ROKO” and “Roko Eco”. Like-wise allocated to this segment is our matches and fi re-lighters production.
We manage conventional power plants, primarily aligned to producing energy for our manufacturing activities, and build and operate small environmentally friendly hydropower plants as renewable energy gene-rating facilities with the focus on sites in the Republic of Macedonia and in Bosnia-Herzegovina.
ENERGYCONSUMER PRODUCTS
Consumer Products segment 2015 2014
Total sales 1 € 38.6 m € 42.5 m
EBITDA €– 0.1 m € 1.1 m
Capital expenditures € 3.1 m € 4.6 m
Employees 569 618
Energy segment 2015 2014
Total sales 1 € 11.3 m € 10.9 m
EBITDA € 7.3 m € 5.2 m
Capital expenditures € 3.4 m € 2.0 m
Employees 179 180
IN A WORD
3Annual Report 2015 Δ PCC Group
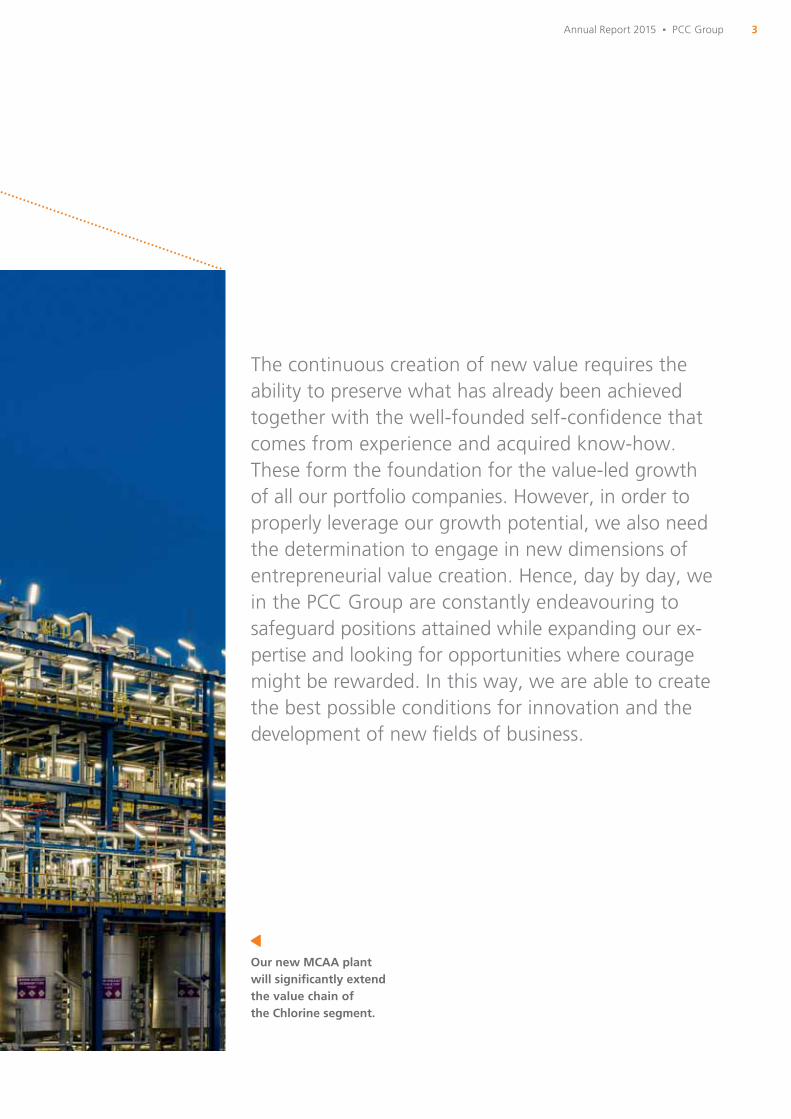
The continuous creation of new value requires the ability to preserve what has already been achieved together with the well-founded self-confi dence that comes from experience and acquired know-how. These form the foundation for the value-led growth of all our portfolio companies. However, in order to properly leverage our growth potential, we also need the determination to engage in new dimensions of entrepreneurial value creation. Hence, day by day, we in the PCC Group are constantly endeavouring to safeguard positions attained while expanding our ex-pertise and looking for opportunities where courage might be rewarded. In this way, we are able to create the best possible conditions for innovation and the development of new fi elds of business.
Our new MCAA plant will signifi cantly extend the value chain of the Chlorine segment.
CONTENTS
The corporate philosophy of PCC
The guiding principles of PCCBasic values and Code of Ethics and Conduct
The Group strategy of PCC
The strategy of the Group divisions and segments
Development of selected Group indicators
Preface by the Chairman of the Administrative Board of PCC SE
Corporate bodies
The Direktinvest unit of PCC SE
Financial reporting at PCC SE in accordance with IFRS
7
8
12
14
18
23
2426
30
31
2 PHILOSOPHY AND STRATEGY
1 INFORMATION FOR OUR INVESTORS
The sustainability strategy of PCC
Chemicals: Sustainability through innovation
Energy: Environmentally friendly power plants
Logistics: Ecologically effi cient container transport
Projects: Sustainable silicon metal production in Iceland
Risk management
35
37
40
42
44
48
3 SUSTAINABILITY AT PCC
The segments of the PCC GroupPolyolsSurfactantsChlorineSpeciality ChemicalsConsumer ProductsEnergyLogisticsHolding/Projects
PCC Group sites
The structure of the PCC Group
515458606266687276
78
80
4 GROUP SEGMENTS
5Contents Δ Annual Report 2015 Δ PCC Group
Auditor’s opinion
Consolidated statement of income
Consolidated statement of comprehensive income
Consolidated balance sheet
Consolidated statement of cash fl ows
Consolidated statement of changes in equity
Notes to the consolidated fi nancial statements
117
118
119
120
122
124
126
Glossary
Credits
PCC on the internet
186
188
190
PCC Investments
Investments in the Chemicals divisionSwitch of chlorine production to environmentally friendly membrane technologyConstruction of a production plant for ultra-pure monochloroacetic acid Increase in capacity of the propylene oxide plantEstablishment of a polyols joint venture in ThailandModernisation and expansion of consumer goods production
Investments in the Energy divisionModernisation of the CHP plant in Brzeg Dolny
Investments in the Logistics divisionExpansion of the PCC terminals in Kutno, Gliwice and Brzeg Dolny
Investments in the Holding/Projects division Construction of a silicon metal production plant in Iceland
83
8484
86
888888
9090
9090
9393
5 INVESTMENTS
7 CONSOLIDATED FINANCIAL STATEMENTS
Organisation of the PCC Group
Core business activities
Business performance by segment
Business development and fi nancial performance
PCC SE – Condensed report per HGB (German Commercial Code)
Opportunities for and risks to future development
Internal control system and risk management related to the Group accounting process
Events after the balance sheet date
Outlook for 2016
97
99
99
104
108
111
112
113
114
6 GROUP MANAGEMENT REPORT

6
1INFORMATION FOR OUR INVESTORS
DEVELOPMENT OF SELECTED GROUP INDICATORS
PREFACE BY THE CHAIRMAN OF THE ADMINISTRATIVE BOARD OF PCC SE
CORPORATE BODIES
THE DIREKTINVEST UNIT OF PCC SE
FINANCIAL REPORTING AT PCC SE IN ACCORDANCE WITH IFRS
7
8
12
14
18
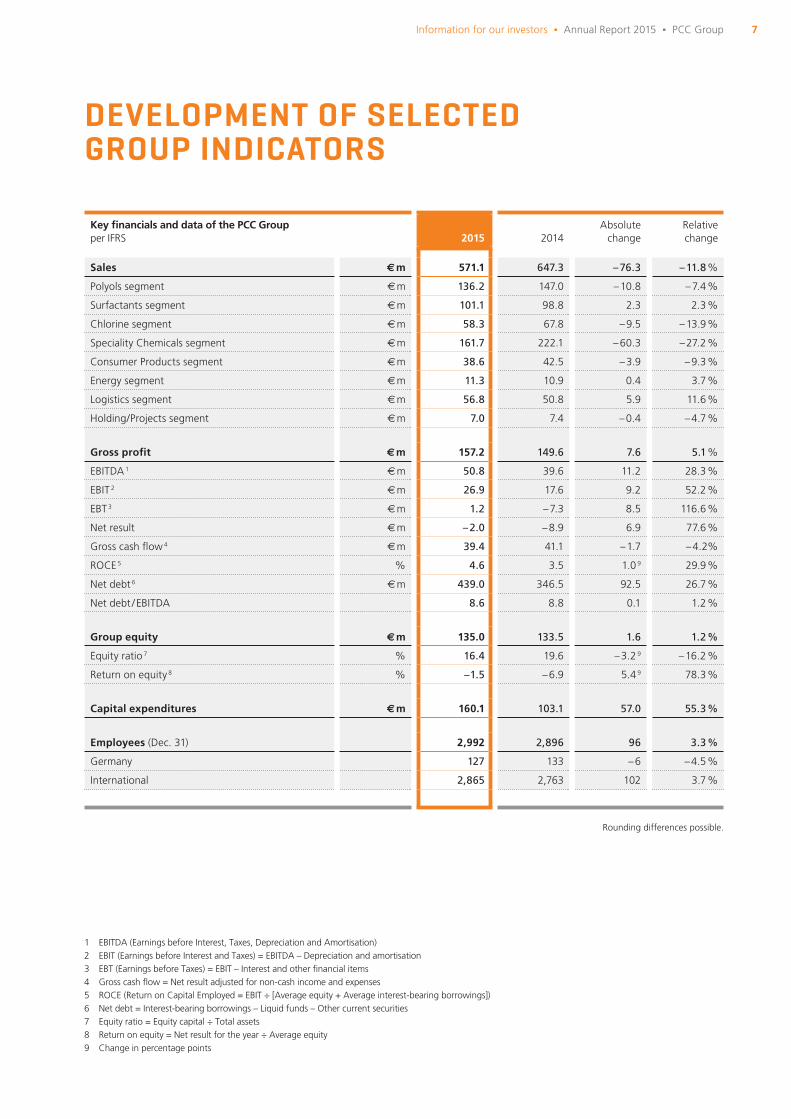
In fi scal 2015, low commodity prices and a weaker Polish zloty resulted in consol-idated sales decreasing by 11.8 % from € 647.3 million to € 571.1 million. On the purchasing side, however, this decline was more than offset. Gross profi t came in at € 157.2 million and earnings before interest, taxes, depreciation and amortisation (EBITDA) amounted to € 50.8 million.
7Information for our investors Δ Annual Report 2015 Δ PCC Group
DEVELOPMENT OF SELECTED GROUP INDICATORS
1 EBITDA (Earnings before Interest, Taxes, Depreciation and Amortisation) 2 EBIT (Earnings before Interest and Taxes) = EBITDA – Depreciation and amortisation 3 EBT (Earnings before Taxes) = EBIT – Interest and other fi nancial items 4 Gross cash fl ow = Net result adjusted for non-cash income and expenses 5 ROCE (Return on Capital Employed = EBIT ÷ [Average equity + Average interest-bearing borrowings]) 6 Net debt = Interest-bearing borrowings – Liquid funds – Other current securities 7 Equity ratio = Equity capital ÷ Total assets 8 Return on equity = Net result for the year ÷ Average equity 9 Change in percentage points
Rounding differences possible.
Key fi nancials and data of the PCC Group per IFRS 2015 2014
Absolutechange
Relativechange
Sales € m 571.1 647.3 – 76.3 – 11.8 %
Polyols segment € m 136.2 147.0 – 10.8 – 7.4 %
Surfactants segment € m 101.1 98.8 2.3 2.3 %
Chlorine segment € m 58.3 67.8 – 9.5 – 13.9 %
Speciality Chemicals segment € m 161.7 222.1 – 60.3 – 27.2 %
Consumer Products segment € m 38.6 42.5 – 3.9 – 9.3 %
Energy segment € m 11.3 10.9 0.4 3.7 %
Logistics segment € m 56.8 50.8 5.9 11.6 %
Holding/Projects segment € m 7.0 7.4 – 0.4 – 4.7 %
Gross profi t € m 157.2 149.6 7.6 5.1 %
EBITDA 1 € m 50.8 39.6 11.2 28.3 %
EBIT 2 € m 26.9 17.6 9.2 52.2 %
EBT 3 € m 1.2 – 7.3 8.5 116.6 %
Net result € m – 2.0 – 8.9 6.9 77.6 %
Gross cash fl ow 4 € m 39.4 41.1 – 1.7 – 4.2%
ROCE 5 % 4.6 3.5 1.0 9 29.9 %
Net debt 6 € m 439.0 346.5 92.5 26.7 %
Net debt / EBITDA 8.6 8.8 0.1 1.2 %
Group equity € m 135.0 133.5 1.6 1.2 %
Equity ratio 7 % 16.4 19.6 – 3.2 9 – 16.2 %
Return on equity 8 % – 1.5 – 6.9 5.4 9 78.3 %
Capital expenditures € m 160.1 103.1 57.0 55.3 %
Employees (Dec. 31) 2,992 2,896 96 3.3 %
Germany 127 133 – 6 – 4.5 %
International 2,865 2,763 102 3.7 %
8
Waldemar Preussner, Chairman of the Administrative Board of PCC SE
PREFACE BY THE CHAIRMAN OF THE ADMINISTRATIVE BOARD OF PCC SE
9Preface by the Chairman of the Administrative Board of PCC SE Δ Information for our investors Δ Annual Report 2015 Δ PCC Group
Waldemar Preussner Chairman of the Administrative Board of PCC SE
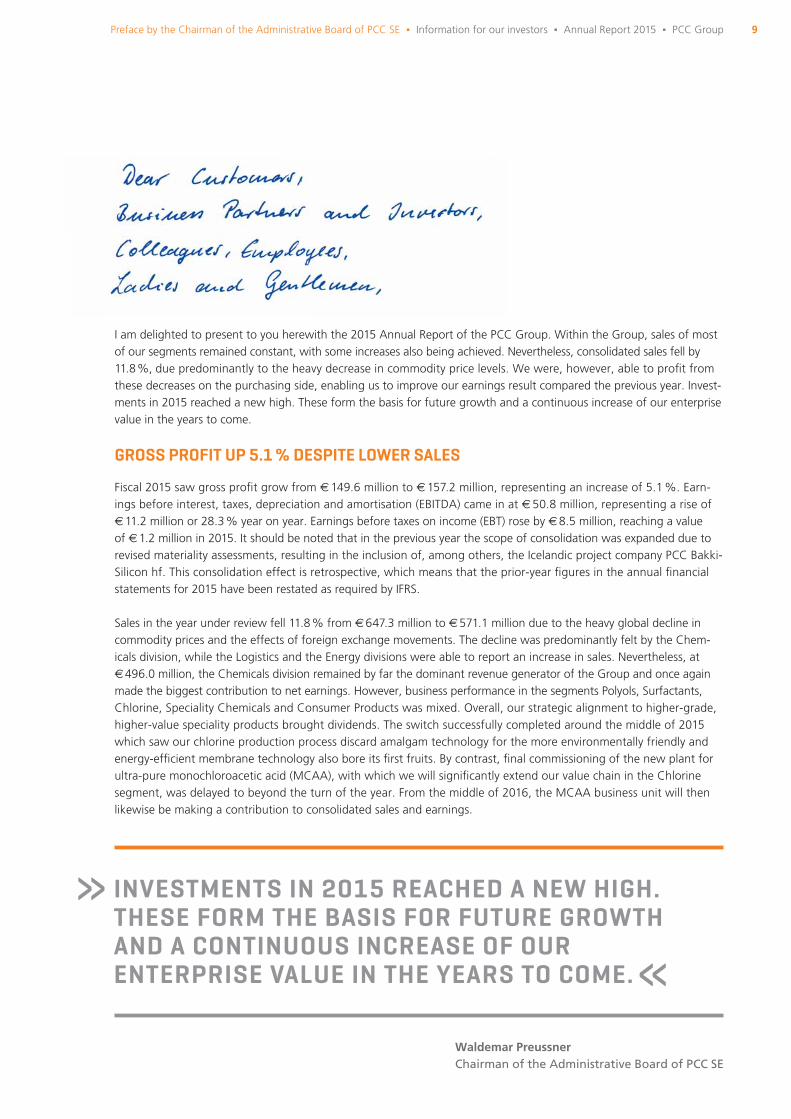
I am delighted to present to you herewith the 2015 Annual Report of the PCC Group. Within the Group, sales of most of our segments remained constant, with some increases also being achieved. Nevertheless, consolidated sales fell by 11.8 %, due predominantly to the heavy decrease in commodity price levels. We were, however, able to profi t from these decreases on the purchasing side, enabling us to improve our earnings result compared the previous year. Invest-ments in 2015 reached a new high. These form the basis for future growth and a continuous increase of our enterprise value in the years to come.
GROSS PROFIT UP 5.1 % DESPITE LOWER SALES
Fiscal 2015 saw gross profi t grow from € 149.6 million to € 157.2 million, representing an increase of 5.1 %. Earn-ings before interest, taxes, depreciation and amortisation (EBITDA) came in at € 50.8 million, representing a rise of € 11.2 million or 28.3 % year on year. Earnings before taxes on income (EBT) rose by € 8.5 million, reaching a value of € 1.2 million in 2015. It should be noted that in the previous year the scope of consolidation was expanded due to revised materiality assessments, resulting in the inclusion of, among others, the Icelandic project company PCC Bakki-Silicon hf. This consolidation effect is retrospective, which means that the prior-year fi gures in the annual fi nancial statements for 2015 have been restated as required by IFRS.
Sales in the year under review fell 11.8 % from € 647.3 million to € 571.1 million due to the heavy global decline in commodity prices and the effects of foreign exchange movements. The decline was predominantly felt by the Chem-icals division, while the Logistics and the Energy divisions were able to report an increase in sales. Nevertheless, at € 496.0 million, the Chemicals division remained by far the dominant revenue generator of the Group and once again made the biggest contribution to net earnings. However, business performance in the segments Polyols, Surfactants, Chlorine, Speciality Chemicals and Consumer Products was mixed. Overall, our strategic alignment to higher-grade, higher-value speciality products brought dividends. The switch successfully completed around the middle of 2015 which saw our chlorine production process discard amalgam technology for the more environmentally friendly and energy-effi cient membrane technology also bore its fi rst fruits. By contrast, fi nal commissioning of the new plant for ultra-pure monochloroacetic acid (MCAA), with which we will signifi cantly extend our value chain in the Chlorine segment, was delayed to beyond the turn of the year. From the middle of 2016, the MCAA business unit will then likewise be making a contribution to consolidated sales and earnings.
» INVESTMENTS IN 2015 REACHED A NEW HIGH. THESE FORM THE BASIS FOR FUTURE GROWTH AND A CONTINUOUS INCREASE OF OUR ENTERPRISE VALUE IN THE YEARS TO COME.«
10 PCC Group Δ Annual Report 2015 Δ Information for our investors
The Logistics division of the PCC Group was once again able to improve its year-on-year performance due in particular to increasing sales and profi ts generated by the Intermodal Transport business unit. With the completion of several container handling terminals in Poland in 2015, this division has successfully created a major platform for future growth.
Within the Energy division, the Conventional Energies business unit encompassing the power plant at our site in Brzeg Dolny and the combined heat and power generator PCC Energetyka Blachownia Sp. z o.o. remains the stronger per-former. For the fi rst time in 2015, however, the Renewable Energies business unit benefi ted from a total of fi ve small hydropower plants being in operation throughout the year. The start of construction of a sixth power plant is planned for 2016.
In the Holding/Projects division, divestment of our telecommunications and data centre activities had a positive effect on earnings. The sale of these marginal operations represented a continuation of our strategy to steadily optimise our investment portfolio. In this division particularly, however, there were earnings-relevant changes in the prior-year fi g-ures due to the already mentioned inclusion of the Icelandic company PCC BakkiSilicon hf in the consolidated fi nancial statements and other retrospective restatements in compliance with IFRS. The construction work on the silicon metal production plant in Iceland has been progressing to schedule since its inception around the middle of 2015. Income generation by this business unit is expected to start in 2018.
MARKET CAPITALISATION OF PCC COMPANIES REACHES € 353 MILLION
The market value of affi liates successfully listed on the Warsaw Stock Exchange in recent years has developed well. The market capitalisation of PCC Rokita SA, PCC Exol SA and PCC Intermodal S.A. as of December 31, 2015 amounted to a total of € 353 million, representing a year-on-year increase of € 20 million or 5.9 %. PCC SE is the clear majority shareholder in respect of each of these portfolio companies. The market value of the share package held as of year end was € 289 million.
EXPECTATIONS FOR 2016
As in previous years, the strategy adopted by the PCC Group will continue to be aligned to sustainable investments and business development with respect to our portfolio companies, with our focus fi rmly fi xed on continually increasing our enterprise value. As a growth-led investor, the holding company PCC SE intends to continue supporting its affi liates in the expansion and extension of their particular strengths over the long term – while also optimising and diversifying its investment portfolio along the way. The investments made in 2015 will, for the fi rst time, make a full-year contribution to the Group earnings of fi scal 2016. In addition, further facilities are due to become operational in the course of the year, with the MCAA plant coming on stream and various expansion investments undertaken, for example, in the Poly-ols segment. Thus, once again in the current fi scal year, we will be consolidating our foundations for further growth with prospects for a continued increase in both enterprise value and operating profi t. Taken overall, we anticipate that 2016 will end with a satisfactory, positive earnings result above that of the prior year.
A WORD OF THANKS
As is the case every year, I would like to extend my particular thanks to you, our employees. It constantly gives me pride and delight to witness your commitment, your motivation and your creativity as you make your indispensable contribu-tion to the achievements of PCC, helping to drive it forward to a sustainable, profi table future. My Administrative Board colleagues, the Group management and I know that these promising prospects owe much to your immense dedication, on which we continue to rely as an essential basis for our business development.
Again in 2015, the mod-ernisation and expansion
of our chemical production facilities was at the focus
of our investment activity.
I would also like to extend my gratitude to our several thousand investors. As our fi nancial backers, your confi dence in and commitment to us are, of course, also essential to our success. By subscribing to our bonds, a large number of you have supported our progress over many years; indeed, many of you have accompanied us on our journey since our fi rst bond issuance in 1998. The confi dence you place in us means we bear a great responsibility, of which we are constantly conscious. Please be assured, therefore, that we will continue to dedicate our efforts to maintaining your faith in us as your partner.
I trust that PCC SE can look forward to enjoying your confi dence and support as we pursue our long-term business goals aligned to creating and increasing enterprise value.
Duisburg, June 2016
Waldemar PreussnerChairman of the Administrative Board of PCC SE
CORPORATE BODIES ADMINISTRATIVE BOARD AND
MANAGING DIRECTORS OF PCC SE
WALDEMAR PREUSSNER
Chairman of the Administrative Board of PCC SE
In 1993, Waldemar Preussner (57) established the company Petro Carbo Chem Rohstoffhandelsgesellschaft mbH (to-day: PCC Trade & Services GmbH) in order to take advan-tage of the new opportunities arising from market liberali-sation in Eastern Europe. The company remains at the core of the current PCC Group. 1998 saw the carve-out of the holding company PCC AG, and in 2007 its corporate form was changed to that of a European corporation. Waldemar Preussner is the sole shareholder of PCC SE and is Chairman of its Administrative Board. He also holds a number of su-pervisory board mandates within the PCC Group.
REINHARD QUINT
Member of the Administrative Board of PCC SE
Reinhard Quint (73) began supporting PCC in an advisory, non-executive role in 2002. Since the transformation of the Group in 2007 into a European corporation (Societas Euro-paea, abbreviated: SE), he has been a member of the Ad-ministrative Board of PCC SE. He also holds the following mandate: he is a member of the Corporate Development Council of Duisburger Hafen AG. Prior to that he was for many years Chairman of ThyssenKrupp Services AG (known today as ThyssenKrupp Materials International GmbH).

13
The Administrative Board of PCC SE is made up of three members:
∂ Waldemar Preussner, Dipl.-Volkswirt (Chairman)
∂ Dr. rer. oec. (BY) Alfred Pelzer (Vice Chairman)
∂ Reinhard Quint
PCC SE is headed by its two Managing Directors:
∂ Ulrike Warnecke
∂ Dr. Alfred Pelzer
ULRIKE WARNECKE
Managing Director of PCC SE
Ulrike Warnecke (54) has held directorships with PCC since the company was established. As Managing Director of PCC SE, she is primarily responsible for Finance, Human Re-sources and Public Relations. Her operational responsibilities extend to the segments Speciality Chemicals and Consumer Products. She is the Managing Director of our most important trading company, the founding entity PCC Trade & Servic-es GmbH, and is a member inter alia of the supervisory board of PCC Consumer Products S.A.
DR. RER. OEC. (BY) ALFRED PELZER
Vice Chairman of the Administrative Board and Managing Director of PCC SE
Dr. rer. oec. (BY) Alfred Pelzer (56) has been in managerial positions with PCC since 1995. In 2007, he was appointed Vice Chairman of the Administrative Board of PCC SE. He is also a Managing Director of PCC SE with primary respon-sibility for the operational areas of chemical production, logistics, sales and distribution. He holds a number of su-pervisory board mandates within the PCC Group, includ-ing at PCC Rokita SA, PCC Exol SA, PCC Synteza S.A. and PCC Intermodal S.A.
Corporate bodies Δ Information for our investors Δ Annual Report 2015 Δ PCC Group

14
ISIN Fixed coupon p. a. Start of tenor End of tenor ListingNominal value in € k
as of Dec. 31, 2015
DE000A11P9V6 4.75 % Apr.1, 2014 Apr. 1, 2016 1 Frankfurt 7,311
DE000A1PGNR8 7.25 % Jun. 1, 2012 Jul. 1, 2016 Frankfurt 12,968
DE000A12T7C5 4.25 % Oct. 1, 2014 Oct. 1, 2016 Frankfurt 9,177
DE000A1PGS32 7.25 % Oct. 1, 2012 Dec. 1, 2016 Frankfurt 29,995
DE000A1EWB67 6.50 % Oct. 1, 2010 2012 – 2016 2 – 1,351
DE000A1EWRT6 6.50 % Feb. 15, 2011 2012 – 2016 2 – 269
DE000A13R7R4 4.00 % Dec. 1, 2014 Jan. 1, 2017 Frankfurt 10,000
DE000A14KJR0 4.00 % May 1, 2015 Jul. 1, 2017 Frankfurt 12,005
DE000A1R1AN5 7.25 % Feb. 1, 2013 Oct. 1, 2017 Frankfurt 29,768
DE000A162AN1 3.50 % Oct. 1, 2015 Dec. 1, 2017 Frankfurt 9,378
DE000A1TM979 7.00 % Jul. 1, 2013 Apr. 1, 2018 Frankfurt 15,654
DE000A1YCSY4 7.00 % Dec. 1, 2013 Oct. 1, 2018 Frankfurt 19,996
DE000A13R5K3 6.50 % Oct. 15, 2014 Jan. 1, 2019 Frankfurt 13,949
DE000A11QFD1 6.75 % May 15, 2014 Apr. 1, 2019 Frankfurt 8,909
DE000A13R7S2 6.25 % Dec. 1, 2014 Oct. 1, 2019 Frankfurt 20,000
DE000A14KJ35 6.00 % May 1, 2015 Apr. 1, 2020 Frankfurt 19,278
DE000A162AP6 5.00 % Oct. 1, 2015 Oct. 1, 2020 Frankfurt 8,591
DE000A13SH30 6.75 % Dec. 1, 2014 Oct. 1, 2021 Frankfurt 20,000
DE000A14KJ43 6.50 % May 1, 2015 Apr. 1, 2022 Frankfurt 16,261
DE000A162AQ4 6.00 % Oct. 1, 2015 Oct. 1, 2022 Frankfurt 13,678
THE DIREKTINVEST UNIT OF PCC SE
1 This bond was redeemed on maturity as of April 1, 2016.
2 The two redeemable bonds DE000A1EWB67 and DE000A1EWRT6 will be amortised from January 1, 2012 through to maturity on October 1, 2016 in regular quarterly instalments equating to 5 % of the nominal value of the issue at 100 %.
PCC SE bonds as of December 31, 2015
PCC SE CORPORATE BONDS – SINCE 1998 AN ESSENTIAL INSTRUMENT IN FINANCING OUR GROWTH
The Group holding company PCC SE fi nances itself through a combination of equity funds and borrowings, whereby the issuance of corporate bonds (bearer debentures) consti-tutes an essential fi nancing instrument. These enable us to respond promptly to newly emerging markets or investment opportunities and allow us to fl exibly fi nance business pur-chases and also the organic growth of our Group without undue reliance on the banks.
Consequently, the issuance of bonds – primarily to a wide circle of private investors, but also and increasingly to institu-tional investors – will remain a central component of our fi -nancing strategy. At the same time, we are endeavouring to expand our funding platform in tandem with this approach through specifi c project-related and loan-based fi nancing packages, and also through partial fl otations of individual Group entities.
In keeping with our conservative business philosophy, we only create funds through our security emissions to the ex-tent needed by us as a growth-led investor to promote the further development of the PCC Group.
PCC Group Δ Annual Report 2015 Δ Information for our investors
15
1 Callable with one year’s notice, fi rst date of redemption: December 31, 2017, thereafter to the end of each quarter.
2 The redemption volumes of the two redeemable bonds DE000A1EWB67 and DE000A1EWRT6 have not been included in this table. They are being amortised from January 1, 2012 through to maturity on October 1, 2016 in regular quarterly instalments equating to 5 % of the nominal value of the issue at 100 %.
PCC SE profi t participation certifi cate as of December 31, 2015
PCC SE bond redemptions 2015 2
ISIN Fixed coupon p. a. Start of tenor End of tenor ListingRedemption volume
in € k
DE000A1RE798 5.00 % Apr. 1, 2013 Apr. 1, 2015 Frankfurt 14,999
DE000A1H3MS7 6.875 % Apr. 1, 2011 Jul. 1, 2015 Frankfurt 26,665
DE000A1YCSX6 4.75 % Dec. 1, 2013 Oct. 1, 2015 Frankfurt 10,000
DE000A1K0U02 7.25 % Oct. 1, 2011 Dec. 1, 2015 Frankfurt 21,903
ISINBasic interest rate
p. a. Start of tenor End of tenor ListingNominal value in € k
as of Dec. 31, 2015
DE000A0MZC31 8.75 % Oct. 1, 2007 Unlimited 1 Frankfurt 10,997
Relatively small issuance volumes ranging up to € 40 mil-lion afford us the necessary fl exibility to cover our fi nanc-ing needs. In addition, spreading our liabilities over a larger number of relatively small issuances prevents the occur-rence of sudden fi nancial burdens and creates a smoother process of fund generation and debt repayment.
PCC is one of Germany’s most experienced issuers of cor-porate bonds: since the fi rst issuance on October 1, 1998, PCC has – as of December 31, 2015 – issued 52 corporate bonds and one profi t participation certifi cate. Of these in-struments, we have redeemed 32 bonds as of the reporting date, with all interest payments made and debt servicing requirements satisfi ed to schedule.
PCC SE SECURITIES IN CIRCULATION
As of December 31, 2015, there were a total of 20 bonds and one profi t participation certifi cate in circulation, representing a combined nominal volume of around € 289.5 million. Since the reporting date, the 4.75 % bond DE000A11P9V6 with a placed volume of € 7.3 million was redeemed on maturity as of April 1, 2016. A new bond was issued on May 1, 2016. The corporate bonds of PCC SE currently available for subscrip-tion can be found on the internet at www.pcc-direktinvest.eu.
The Direktinvest unit of PCC SE Δ Information for our investors Δ Annual Report 2015 Δ PCC Group
16
PLN
3.0
2.0
1.0
0.0
PCC Intermodal S.A.
Jan. 2, 2015
Price performance of PCC shares on the Warsaw Stock Exchange (GPW)
PLN
4.0
3.0
2.0
1.0
PLN
60.0
55.0
50.0
45.0
40.0
35.0
30.0
PCC Exol SA
PCC Rokita SA
Mar. 31, 2016
Dec. 31, 2015
+ 24.3 %
− 26.9 %
+ 26.5 %
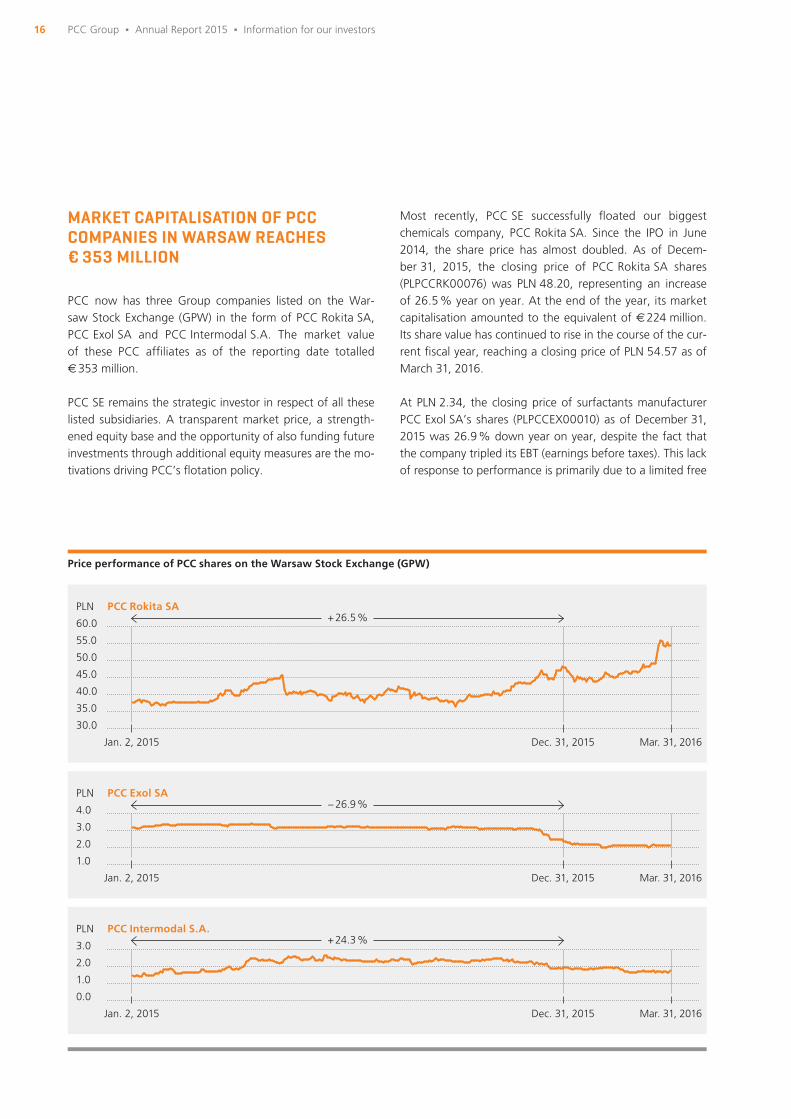
MARKET CAPITALISATION OF PCC COMPANIES IN WARSAW REACHES € 353 MILLION
PCC now has three Group companies listed on the War-saw Stock Exchange (GPW) in the form of PCC Rokita SA, PCC Exol SA and PCC Intermodal S.A. The market value of these PCC affi liates as of the reporting date totalled € 353 million.
PCC SE remains the strategic investor in respect of all these listed subsidiaries. A transparent market price, a strength-ened equity base and the opportunity of also funding future investments through additional equity measures are the mo-tivations driving PCC’s fl otation policy.
Most recently, PCC SE successfully fl oated our biggest chemicals company, PCC Rokita SA. Since the IPO in June 2014, the share price has almost doubled. As of Decem-ber 31, 2015, the closing price of PCC Rokita SA shares (PLPCCRK00076) was PLN 48.20, representing an increase of 26.5 % year on year. At the end of the year, its market capitalisation amounted to the equivalent of € 224 million. Its share value has continued to rise in the course of the cur-rent fi scal year, reaching a closing price of PLN 54.57 as of March 31, 2016.
At PLN 2.34, the closing price of surfactants manufacturer PCC Exol SA’s shares (PLPCCEX00010) as of December 31, 2015 was 26.9 % down year on year, despite the fact that the company tripled its EBT (earnings before taxes). This lack of response to performance is primarily due to a limited free
Mar. 31, 2016
Mar. 31, 2016
Dec. 31, 2015
Dec. 31, 2015
Jan. 2, 2015
Jan. 2, 2015
PCC Group Δ Annual Report 2015 Δ Information for our investors
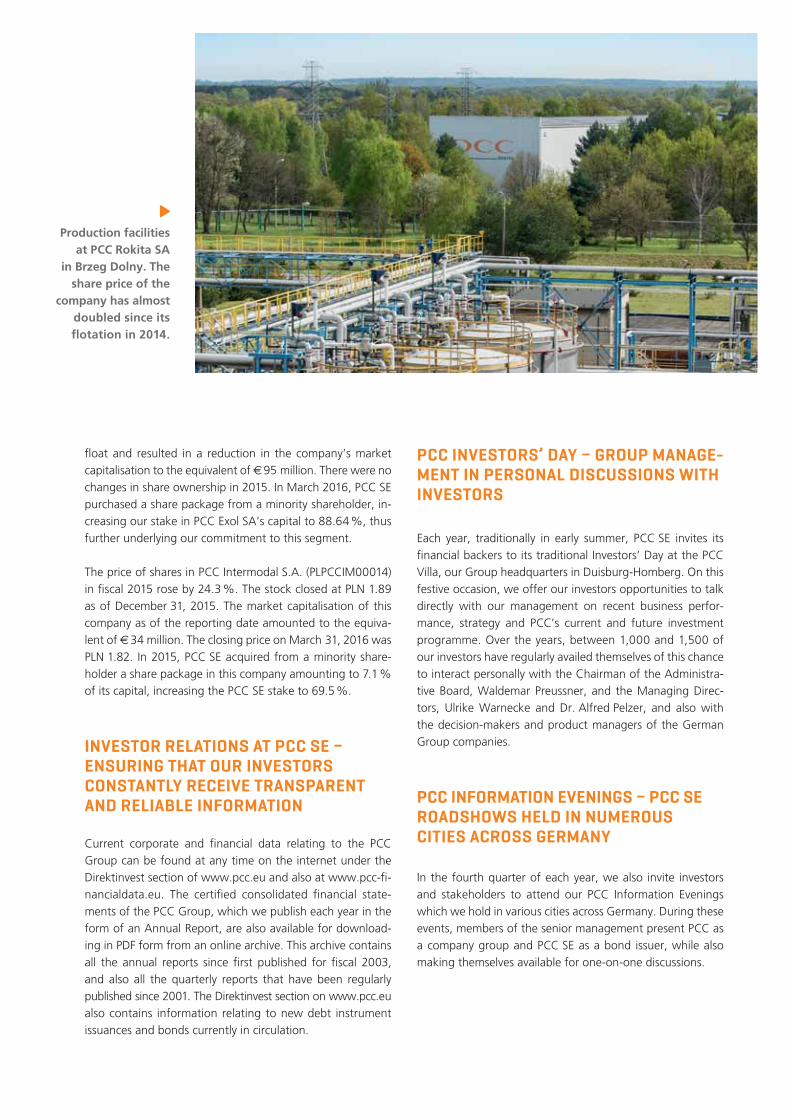
Production facilities at PCC Rokita SA
in Brzeg Dolny. The share price of the
company has almost doubled since its fl otation in 2014.
fl oat and resulted in a reduction in the company’s market capitalisation to the equivalent of € 95 million. There were no changes in share ownership in 2015. In March 2016, PCC SE purchased a share package from a minority shareholder, in-creasing our stake in PCC Exol SA’s capital to 88.64 %, thus further underlying our commitment to this segment.
The price of shares in PCC Intermodal S.A. (PLPCCIM00014) in fi scal 2015 rose by 24.3 %. The stock closed at PLN 1.89 as of December 31, 2015. The market capitalisation of this company as of the reporting date amounted to the equiva-lent of € 34 million. The closing price on March 31, 2016 was PLN 1.82. In 2015, PCC SE acquired from a minority share-holder a share package in this company amounting to 7.1 % of its capital, increasing the PCC SE stake to 69.5 %.
INVESTOR RELATIONS AT PCC SE – ENSURING THAT OUR INVESTORS CONSTANTLY RECEIVE TRANSPARENT AND RELIABLE INFORMATION
Current corporate and fi nancial data relating to the PCC Group can be found at any time on the internet under the Direktinvest section of www.pcc.eu and also at www.pcc-fi -nancialdata.eu. The certifi ed consolidated fi nancial state-ments of the PCC Group, which we publish each year in the form of an Annual Report, are also available for download-ing in PDF form from an online archive. This archive contains all the annual reports since fi rst published for fi scal 2003, and also all the quarterly reports that have been regularly published since 2001. The Direktinvest section on www.pcc.eu also contains information relating to new debt instrument issuances and bonds currently in circulation.
PCC INVESTORS’ DAY – GROUP MANAGE-MENT IN PERSONAL DISCUSSIONS WITH INVESTORS
Each year, traditionally in early summer, PCC SE invites its fi nancial backers to its traditional Investors’ Day at the PCC Villa, our Group headquarters in Duisburg-Homberg. On this festive occasion, we offer our investors opportunities to talk directly with our management on recent business perfor-mance, strategy and PCC’s current and future investment programme. Over the years, between 1,000 and 1,500 of our investors have regularly availed themselves of this chance to interact personally with the Chairman of the Administra-tive Board, Waldemar Preussner, and the Managing Direc-tors, Ulrike Warnecke and Dr. Alfred Pelzer, and also with the decision-makers and product managers of the German Group companies.
PCC INFORMATION EVENINGS – PCC SE ROADSHOWS HELD IN NUMEROUS CITIES ACROSS GERMANY
In the fourth quarter of each year, we also invite investors and stakeholders to attend our PCC Information Evenings which we hold in various cities across Germany. During these events, members of the senior management present PCC as a company group and PCC SE as a bond issuer, while also making themselves available for one-on-one discussions.
18
FINANCIAL REPORTING AT PCC SE IN ACCORDANCE WITH IFRS
PCC SE is the holding company of the PCC Group. The focus of its activities is on the sustainable investment management of its portfolio of majority and minority interests. One of our primary objectives in this regard is to create and continuously increase enterprise value.
The consolidated fi nancial statements of the PCC Group are prepared in accordance with International Financial Reporting Standards (IFRS) as adopted and endorsed by the European Union. The following condensed fi nancial information relating to PCC SE has likewise been prepared in accordance with IFRS.
The IFRS fi nancial statements of PCC SE differ from those prepared according to the German Commercial Code (HGB, aka German GAAP) primarily in the valuation of fi nancial as-sets. Several investments of PCC SE are listed on stock ex-changes for which there are regular market prices available. These form the basis for determining their fair value. In the case of investments for which there are no market prices publicly available, the valuation basis is provided either by recent transactions or valuation models. Changes in the val-uation of investments are recognised per IFRS in equity under other comprehensive income.
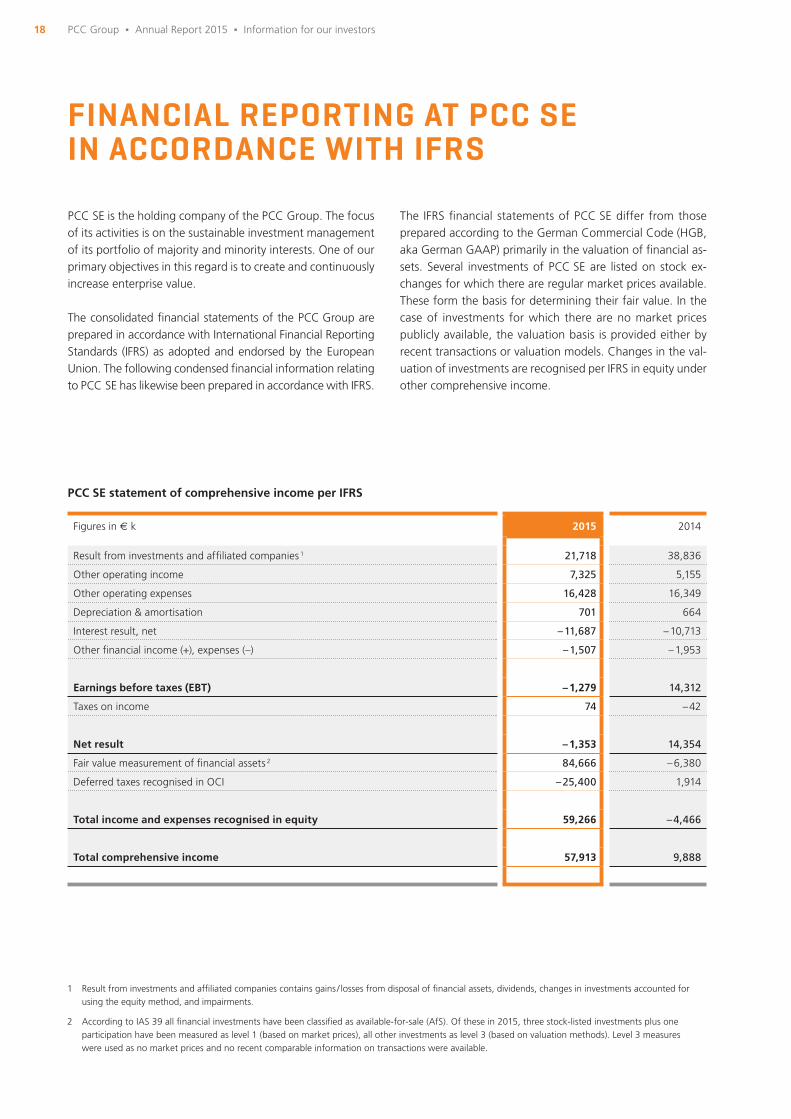
PCC SE statement of comprehensive income per IFRS
1 Result from investments and affi liated companies contains gains / losses from disposal of fi nancial assets, dividends, changes in investments accounted for using the equity method, and impairments.
2 According to IAS 39 all fi nancial investments have been classifi ed as available-for-sale (AfS). Of these in 2015, three stock-listed investments plus one participation have been measured as level 1 (based on market prices), all other investments as level 3 (based on valuation methods). Level 3 measures were used as no market prices and no recent comparable information on transactions were available.
PCC Group Δ Annual Report 2015 Δ Information for our investors
Figures in € k 2015 2014
Result from investments and affi liated companies 1 21,718 38,836
Other operating income 7,325 5,155
Other operating expenses 16,428 16,349
Depreciation & amortisation 701 664
Interest result, net – 11,687 – 10,713
Other fi nancial income (+), expenses (–) – 1,507 – 1,953
Earnings before taxes (EBT) – 1,279 14,312
Taxes on income 74 – 42
Net result – 1,353 14,354
Fair value measurement of fi nancial assets 2 84,666 – 6,380
Deferred taxes recognised in OCI – 25,400 1,914
Total income and expenses recognised in equity 59,266 – 4,466
Total comprehensive income 57,913 9,888
19
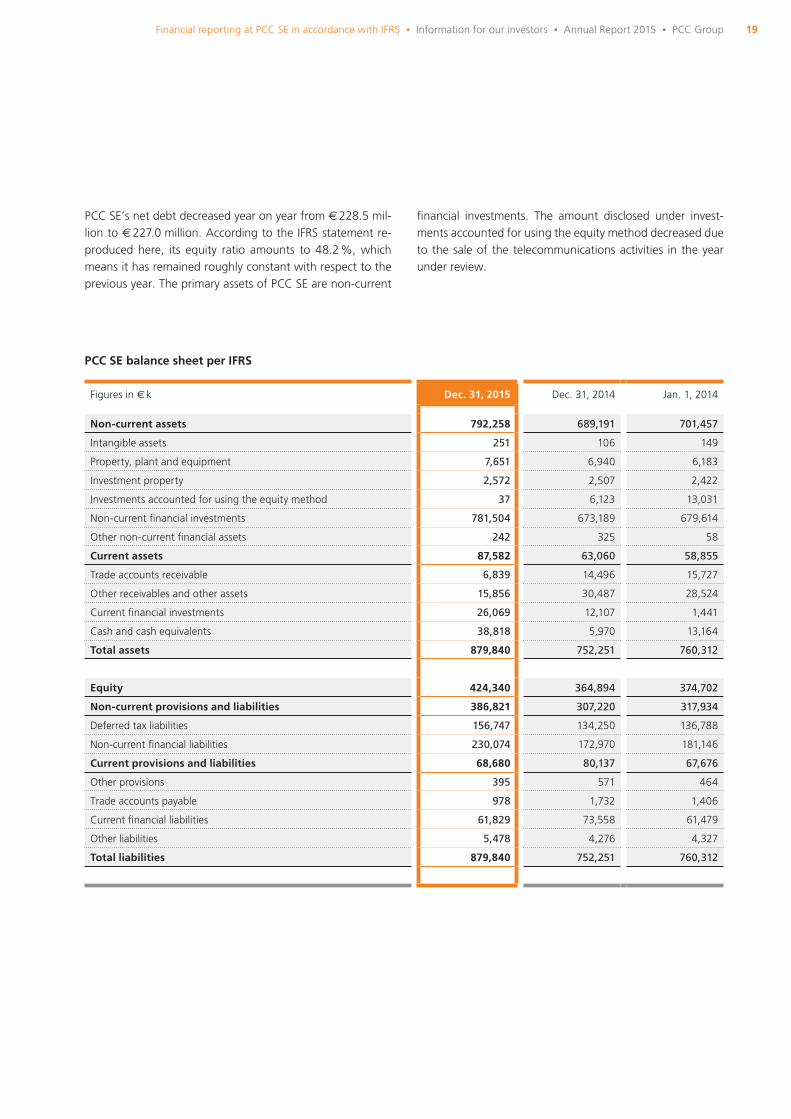
PCC SE’s net debt decreased year on year from € 228.5 mil-lion to € 227.0 million. According to the IFRS statement re-produced here, its equity ratio amounts to 48.2 %, which means it has remained roughly constant with respect to the previous year. The primary assets of PCC SE are non-current
fi nancial investments. The amount disclosed under invest-ments accounted for using the equity method decreased due to the sale of the telecommunications activities in the year under review.
PCC SE balance sheet per IFRS
Figures in € k Dec. 31, 2015 Dec. 31, 2014 Jan. 1, 2014
Non-current assets 792,258 689,191 701,457
Intangible assets 251 106 149
Property, plant and equipment 7,651 6,940 6,183
Investment property 2,572 2,507 2,422
Investments accounted for using the equity method 37 6,123 13,031
Non-current fi nancial investments 781,504 673,189 679,614
Other non-current fi nancial assets 242 325 58
Current assets 87,582 63,060 58,855
Trade accounts receivable 6,839 14,496 15,727
Other receivables and other assets 15,856 30,487 28,524
Current fi nancial investments 26,069 12,107 1,441
Cash and cash equivalents 38,818 5,970 13,164
Total assets 879,840 752,251 760,312
Equity 424,340 364,894 374,702
Non-current provisions and liabilities 386,821 307,220 317,934
Deferred tax liabilities 156,747 134,250 136,788
Non-current fi nancial liabilities 230,074 172,970 181,146
Current provisions and liabilities 68,680 80,137 67,676
Other provisions 395 571 464
Trade accounts payable 978 1,732 1,406
Current fi nancial liabilities 61,829 73,558 61,479
Other liabilities 5,478 4,276 4,327
Total liabilities 879,840 752,251 760,312
Financial reporting at PCC SE in accordance with IFRS Δ Information for our investors Δ Annual Report 2015 Δ PCC Group
20
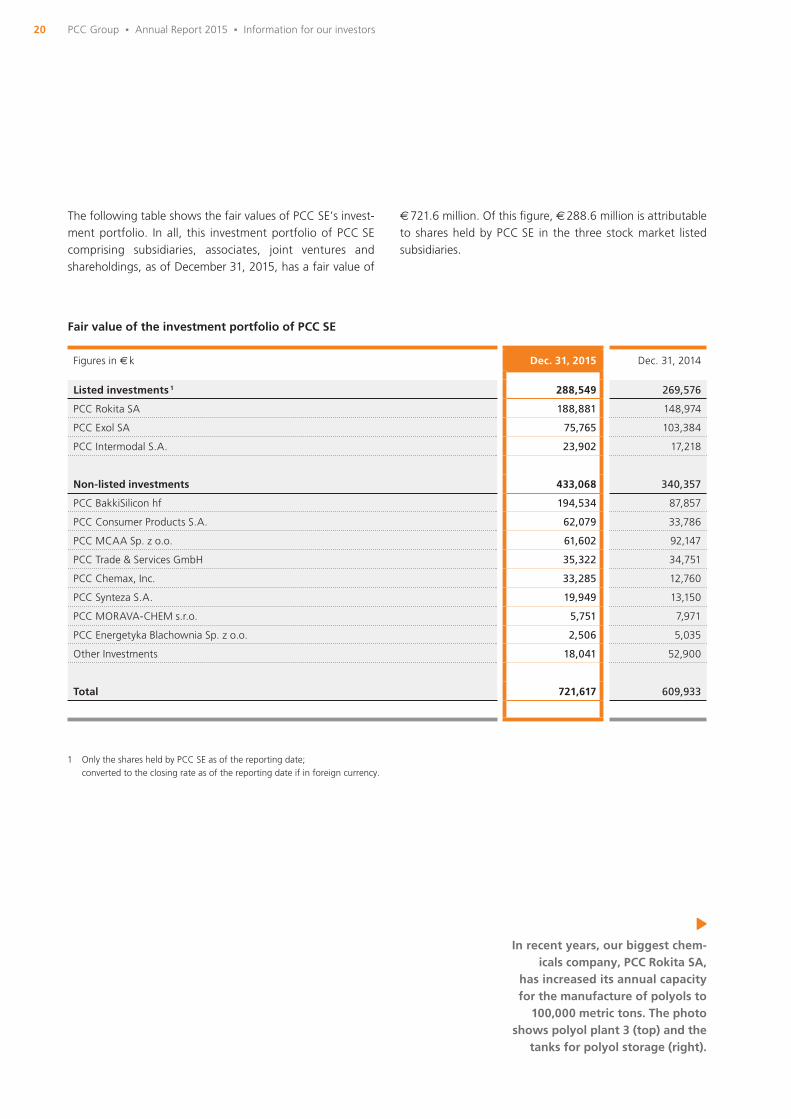
The following table shows the fair values of PCC SE’s invest-ment portfolio. In all, this investment portfolio of PCC SE comprising subsidiaries, associates, joint ventures and shareholdings, as of December 31, 2015, has a fair value of
€ 721.6 million. Of this fi gure, € 288.6 million is attributable to shares held by PCC SE in the three stock market listed subsidiaries.
Figures in € k Dec. 31, 2015 Dec. 31, 2014
Listed investments 1 288,549 269,576
PCC Rokita SA 188,881 148,974
PCC Exol SA 75,765 103,384
PCC Intermodal S.A. 23,902 17,218
Non-listed investments 433,068 340,357
PCC BakkiSilicon hf 194,534 87,857
PCC Consumer Products S.A. 62,079 33,786
PCC MCAA Sp. z o.o. 61,602 92,147
PCC Trade & Services GmbH 35,322 34,751
PCC Chemax, Inc. 33,285 12,760
PCC Synteza S.A. 19,949 13,150
PCC MORAVA-CHEM s.r.o. 5,751 7,971
PCC Energetyka Blachownia Sp. z o.o. 2,506 5,035
Other Investments 18,041 52,900
Total 721,617 609,933
Fair value of the investment portfolio of PCC SE
1 Only the shares held by PCC SE as of the reporting date; converted to the closing rate as of the reporting date if in foreign currency.
In recent years, our biggest chem-icals company, PCC Rokita SA,
has increased its annual capacity for the manufacture of polyols to
100,000 metric tons. The photo shows polyol plant 3 (top) and the
tanks for polyol storage (right).
PCC Group Δ Annual Report 2015 Δ Information for our investors


22
2 PHILOSOPHY AND STRATEGY
The core objective of our Group strategy is to establish new corpo-rate values and to constantly enhance those already in place, thereby strengthening our investors’ confi dence in us. Consistent with this, our corporate philosophy is founded on values such as dependability and continuity with respect to all of our stakeholders, and we rely in particular on the know-how and dedication of our employees.
23Philosophy and strategy Δ Annual Report 2015 Δ PCC Group
As an investor, PCC looks to the long term and our entire group of companies is aligned to sustain-able growth. The common goal of management and the workforce is to continually increase the value of our investments through hard work, dynamism and innovative strength and to constantly generate new added value.
Our actions are defi ned at all times by both business acu-men and awareness of our responsibilities. This is expressed in an array of basic values such as credibility and dependabil-ity, honesty and a cooperative approach, which as a whole constitute to a certain extent the DNA of our corporate phi-losophy and our Group strategy. We regard these values as the basis essential for the success and long-term positioning of PCC in global markets characterised by increasingly rapid change. This is because they serve as a point of reference as we strive to sustainably occupy lucrative niches in a rising number of sectors and industries, to generate higher profi ts by enhancing our effectiveness and to continually optimise our portfolio. The clear guidelines that result from our values are set out below.
Our values enable us to resolutely exploit new business and product areas as soon as they arise. In this context, we constantly assess the current market situation and adopt a conservative and risk-aware approach to analysing profi t potential. When selecting our investments, we always align our decision-making processes to the likelihood of sustaina-ble growth and stable cash fl ows. We are fi rmly focused on generating synergies and achieving economies of scale, pur-suing opportunities for horizontal and vertical integration, and also the consolidation of our activities, whenever these become available.
We only enter new areas of activity once we have a thorough understanding of the business and its risks. We also hive off
operations where opportunities for this appear lucrative or the long-term returns expected are no longer achievable – and also where the released resources can be utilised more effi ciently elsewhere. The inexorable globalisation of markets entails risks, but also – and especially – opportunities for further sustainable growth. The dedication and initiative of our employees, as well as their cultural diversity most importantly, are espe-cially helpful in enabling us to seize these opportunities. On the one hand this is because our most important production and sales markets are traditionally in the still rapidly emerg-ing economies of Central, Eastern and South-East Europe, and on the other hand, because we are committed to mon-itoring new geographic regions for possibilities of business development.
Against this background, we are steadily improving our busi-ness processes, our performance culture and our fl exibility in order to be able to respond at all times quickly to market changes. At the same time, to pursue our strategic align-ment, we have defi ned clear sustainability guidelines which we are constantly adapting and refi ning. These include, for example, further enhancing plant safety and complying with the latest environmental standards in our Group companies, improving our products – including their ecological creden-tials – through ongoing research and development, offering ever more effi cient programmes for workforce training and qualifi cation, and intensifying open and honest communica-
THE CORPORATE PHILOSOPHY OF PCC
THE CORPORATE PHILOSOPHY OF PCC
THE GUIDING PRINCIPLES OF PCCBasic values and Code of Ethics and Conduct
THE GROUP STRATEGY OF PCC
THE STRATEGY OF THE GROUP DIVISIONS AND SEGMENTS
23
2426
30
31
24 PCC Group Δ Annual Report 2015 Δ Philosophy and strategy
THE GUIDING PRINCIPLES OF PCC
CORPORATE MISSION
PCC is a value-led, internationally operating management and investment company. Through the largely long-term, sustainable development and optimisation of our investment portfolio, our goal is to continually enhance our existing cor-porate values and to establish new values, thus ensuring that we are a trusted partner for all our stakeholders.
EMPLOYEE GUIDE
Our employees are our most important assets and the pri-mary factor for our success. As a growth-oriented, interna-tionally structured corporation, PCC requires committed and competent people in order to be able to operate successfully on its various markets. We place great value on cultural and technical diversity, conscious of the benefi ts accruing from the interchange and knowledge transfer that this promotes. We regard our ability to harness this diversity anew and on a daily basis – and from it to create a corporate whole – as one of our greatest strengths. Our dealings with one another within the corporation are also characterised by apprecia-tion, mutual understanding, openness and fairness – irre-spective of the individual position of each employee within the organisation. In particular, we attach much importance to open and transparent communication, which makes our work even more effective and furthers the development of our corporate group.
We achieve our corporate targets through a shared dyna-mism and the personal commitment of each individual. The fl exibility of our employees and their willingness to develop their skills enable us to successfully meet the challenges we encounter. We afford our people scope to pursue their own profi t-aligned initiatives, and opportunities to assume task or project ownership under their own responsibility. We sup-port them in their further personal development by properly preparing them for new duties and ensuring that they re-ceive the appropriate training.
LEADERSHIP GUIDE
For us, leadership means defi ning consistently profi t-orient-ed targets and devising appropriate strategies and concepts to enable their achievement. At the same time, leadership also means providing our people with the motivation to work together with management so that we can realise our shared objectives. And even though it is management that ultimately bears the responsibility for the business results of PCC, individual initiative and creativity among our employees are specifi cally encouraged to the full extent possible. Our people are given decision-making competences on the basis of the principle of “as much managerial guidance as neces-sary, as much individual responsibility as possible”.
In employee meetings, management systematically identifi es the strengths of our high-performers and plans their indi-vidual careers within the corporation. In regular dialogues, we reappraise the development possibilities of managerial staff and co-workers, agreeing on this basis, and with the individuals concerned, appropriate development targets and actions.
PCC SE pays wages and salaries in conformity with market standards. Enshrined in our employment guidelines is the commitment that men and women shall receive the same compensation for the same work. Should variations never-theless occur in individual cases, we will make every endeav-our to quickly rebalance the situation.
BASIC VALUES AND CODE OF ETHICS AND CONDUCT
We have summarised our general behavioural rules in the form of our basic values and a Code of Ethics and Conduct which each and every employee is expected to acknowledge and recognise with their signature.
tion with stakeholder groups. These groups are given equal consideration and include our customers, employees, inves-tors, suppliers and lenders as well as the communities and ecological environment in which we operate.
At all times, we link this holistic approach to sustainability to our quality and cost awareness so as to ensure an endur-ing balance between the interests of all stakeholders while
effectively fulfi lling our economic, ecological and social re-sponsibilities. In this Annual Report, we have dedicated an entire section to our sustainability strategy and the initia-tives pursued by our individual Group companies (see page 34). First, however, we would like to set out our guiding principles upon which we base our business activities, and also the content of our basic values and our Code of Ethics and Conduct.
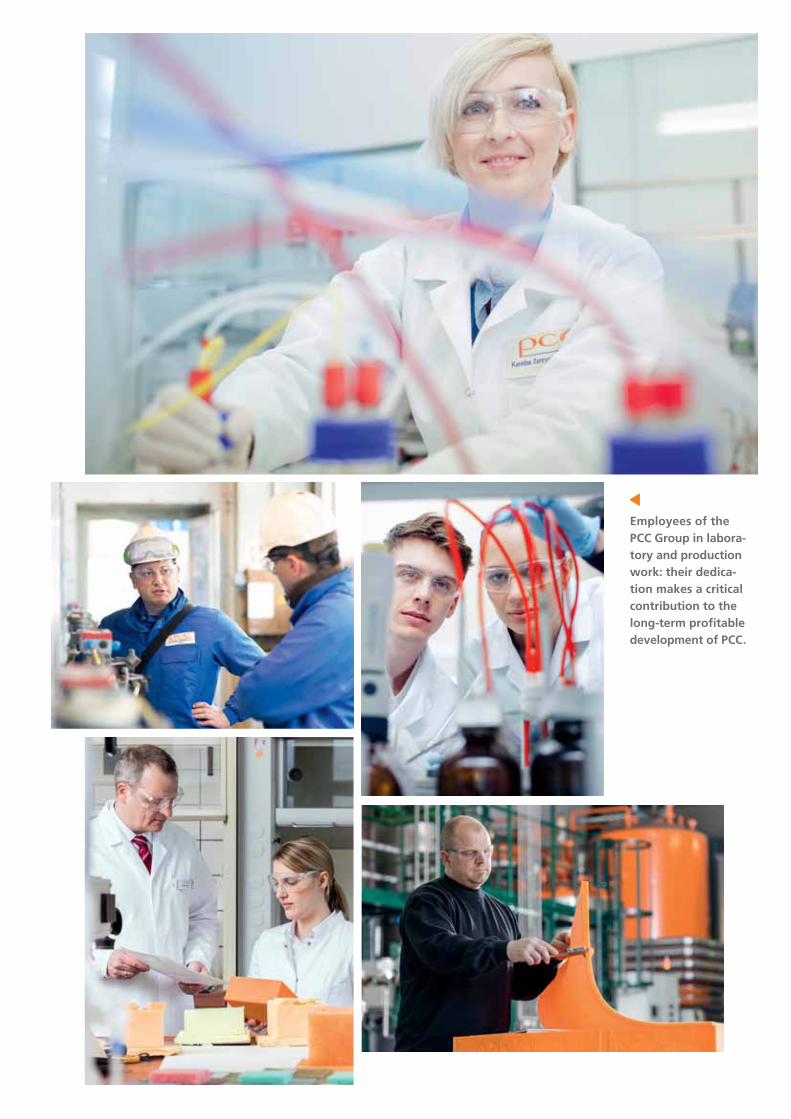
Employees of the PCC Group in labora-tory and production work: their dedica-tion makes a critical contribution to the long-term profi table development of PCC.
26
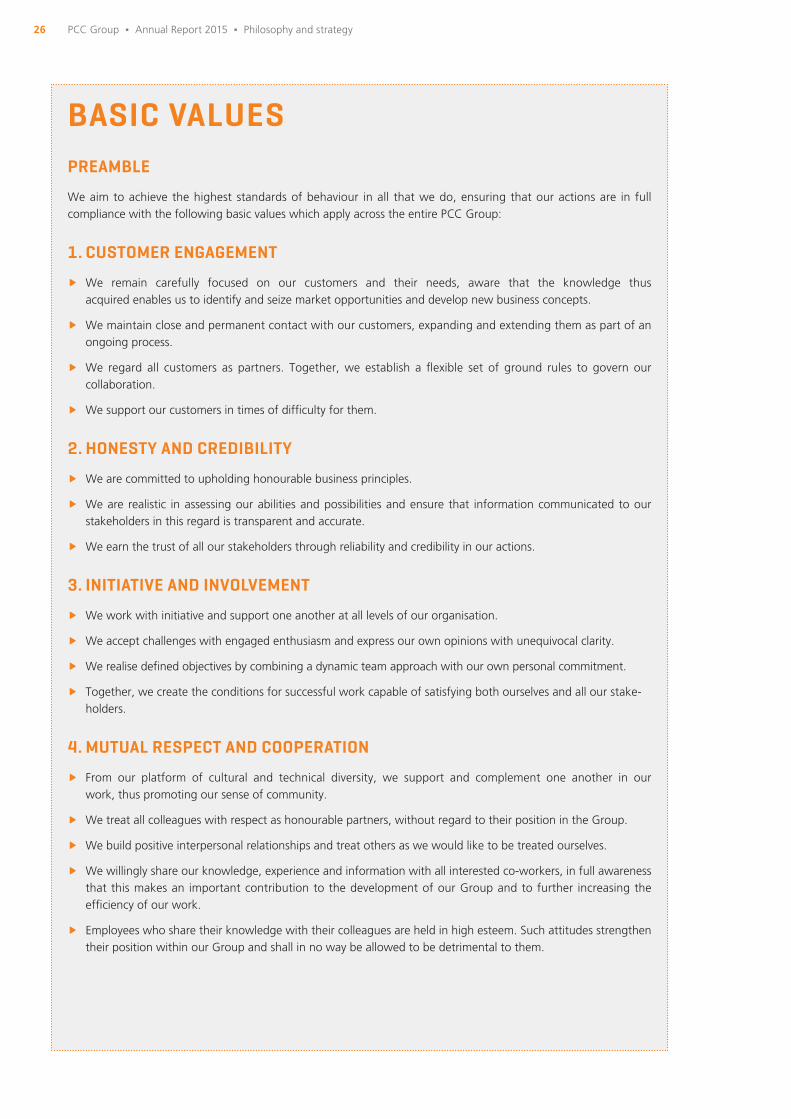
BASIC VALUESPREAMBLE
We aim to achieve the highest standards of behaviour in all that we do, ensuring that our actions are in full compliance with the following basic values which apply across the entire PCC Group:
1. CUSTOMER ENGAGEMENT
∂ We remain carefully focused on our customers and their needs, aware that the knowledge thus acquired enables us to identify and seize market opportunities and develop new business concepts.
∂ We maintain close and permanent contact with our customers, expanding and extending them as part of an ongoing process.
∂ We regard all customers as partners. Together, we establish a fl exible set of ground rules to govern our collaboration.
∂ We support our customers in times of diffi culty for them.
2. HONESTY AND CREDIBILITY
∂ We are committed to upholding honourable business principles.
∂ We are realistic in assessing our abilities and possibilities and ensure that information communicated to our stakeholders in this regard is transparent and accurate.
∂ We earn the trust of all our stakeholders through reliability and credibility in our actions.
3. INITIATIVE AND INVOLVEMENT
∂ We work with initiative and support one another at all levels of our organisation.
∂ We accept challenges with engaged enthusiasm and express our own opinions with unequivocal clarity.
∂ We realise defi ned objectives by combining a dynamic team approach with our own personal commitment.
∂ Together, we create the conditions for successful work capable of satisfying both ourselves and all our stake- holders.
4. MUTUAL RESPECT AND COOPERATION
∂ From our platform of cultural and technical diversity, we support and complement one another in our work, thus promoting our sense of community.
∂ We treat all colleagues with respect as honourable partners, without regard to their position in the Group.
∂ We build positive interpersonal relationships and treat others as we would like to be treated ourselves.
∂ We willingly share our knowledge, experience and information with all interested co-workers, in full awareness that this makes an important contribution to the development of our Group and to further increasing the effi ciency of our work.
∂ Employees who share their knowledge with their colleagues are held in high esteem. Such attitudes strengthen their position within our Group and shall in no way be allowed to be detrimental to them.
PCC Group Δ Annual Report 2015 Δ Philosophy and strategy
27The guiding principles of PCC Δ Philosophy and strategy Δ Annual Report 2015 Δ PCC Group
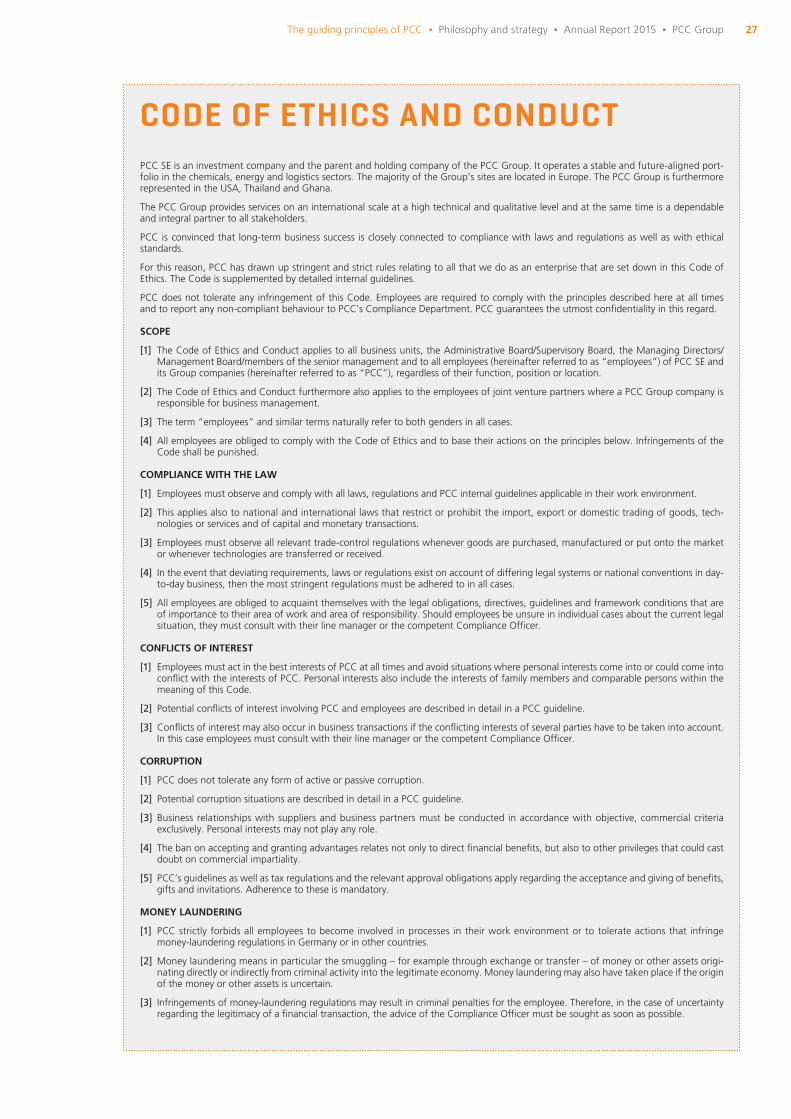
CODE OF ETHICS AND CONDUCTPCC SE is an investment company and the parent and holding company of the PCC Group. It operates a stable and future-aligned port-folio in the chemicals, energy and logistics sectors. The majority of the Group’s sites are located in Europe. The PCC Group is furthermore represented in the USA, Thailand and Ghana.
The PCC Group provides services on an international scale at a high technical and qualitative level and at the same time is a dependable and integral partner to all stakeholders.
PCC is convinced that long-term business success is closely connected to compliance with laws and regulations as well as with ethical standards.
For this reason, PCC has drawn up stringent and strict rules relating to all that we do as an enterprise that are set down in this Code of Ethics. The Code is supplemented by detailed internal guidelines.
PCC does not tolerate any infringement of this Code. Employees are required to comply with the principles described here at all times and to report any non-compliant behaviour to PCC’s Compliance Department. PCC guarantees the utmost confi dentiality in this regard.
SCOPE
[1] The Code of Ethics and Conduct applies to all business units, the Administrative Board/Supervisory Board, the Managing Directors/Management Board/members of the senior management and to all employees (hereinafter referred to as “employees”) of PCC SE and its Group companies (hereinafter referred to as “PCC”), regardless of their function, position or location.
[2] The Code of Ethics and Conduct furthermore also applies to the employees of joint venture partners where a PCC Group company is responsible for business management.
[3] The term “employees” and similar terms naturally refer to both genders in all cases.
[4] All employees are obliged to comply with the Code of Ethics and to base their actions on the principles below. Infringements of the Code shall be punished.
COMPLIANCE WITH THE LAW
[1] Employees must observe and comply with all laws, regulations and PCC internal guidelines applicable in their work environment.
[2] This applies also to national and international laws that restrict or prohibit the import, export or domestic trading of goods, tech-nologies or services and of capital and monetary transactions.
[3] Employees must observe all relevant trade-control regulations whenever goods are purchased, manufactured or put onto the market or whenever technologies are transferred or received.
[4] In the event that deviating requirements, laws or regulations exist on account of differing legal systems or national conventions in day-to-day business, then the most stringent regulations must be adhered to in all cases.
[5] All employees are obliged to acquaint themselves with the legal obligations, directives, guidelines and framework conditions that are of importance to their area of work and area of responsibility. Should employees be unsure in individual cases about the current legal situation, they must consult with their line manager or the competent Compliance Offi cer.
CONFLICTS OF INTEREST
[1] Employees must act in the best interests of PCC at all times and avoid situations where personal interests come into or could come into confl ict with the interests of PCC. Personal interests also include the interests of family members and comparable persons within the meaning of this Code.
[2] Potential confl icts of interest involving PCC and employees are described in detail in a PCC guideline.
[3] Confl icts of interest may also occur in business transactions if the confl icting interests of several parties have to be taken into account. In this case employees must consult with their line manager or the competent Compliance Offi cer.
CORRUPTION
[1] PCC does not tolerate any form of active or passive corruption.
[2] Potential corruption situations are described in detail in a PCC guideline.
[3] Business relationships with suppliers and business partners must be conducted in accordance with objective, commercial criteria exclusively. Personal interests may not play any role.
[4] The ban on accepting and granting advantages relates not only to direct fi nancial benefi ts, but also to other privileges that could cast doubt on commercial impartiality.
[5] PCC’s guidelines as well as tax regulations and the relevant approval obligations apply regarding the acceptance and giving of benefi ts, gifts and invitations. Adherence to these is mandatory.
MONEY LAUNDERING
[1] PCC strictly forbids all employees to become involved in processes in their work environment or to tolerate actions that infringe money-laundering regulations in Germany or in other countries.
[2] Money laundering means in particular the smuggling – for example through exchange or transfer – of money or other assets origi-nating directly or indirectly from criminal activity into the legitimate economy. Money laundering may also have taken place if the origin of the money or other assets is uncertain.
[3] Infringements of money-laundering regulations may result in criminal penalties for the employee. Therefore, in the case of uncertainty regarding the legitimacy of a fi nancial transaction, the advice of the Compliance Offi cer must be sought as soon as possible.

28
SOCIAL ENGAGEMENT
[1] Business activities are closely connected with social responsibility. Within PCC, this responsibility is refl ected in its engagement in the areas of social welfare, education and science, sport and culture.
[2] Sponsorship monies are awarded only if a valid legal basis exists. Moreover, the approval of the Managing Directors of PCC SE or of the Management Board or the members of the senior management in the given Group companies is required for the awarding of sponsorship monies.
[3] Monetary payments and other non-cash benefi ts granted to politicians, political parties, political associations or other political organi-sations are strictly prohibited.
INSIDER INFORMATION
[1] Employees who possess insider information about PCC or other companies with which PCC is considering a strategic alliance, acqui-sition, disposal or fusion may not purchase or sell securities or other derivatives in PCC or said companies while this information is not available to the general public.
[2] Insider information includes all information that is not known to the public and that an investor would consider important with respect to the decision for or against the purchase or sale of securities or derivatives.
[3] Insider information may not be passed on to third parties. Within PCC and elsewhere, insider information may only be passed on if the recipient of the information requires that information in order to carry out their role at PCC.
[4] The use of insider information may have consequences under criminal law. In the event that employees are uncertain whether they possess insider information, they must consult with their line manager or the competent Compliance Offi cer.
CONFIDENTIALITY
[1] Both during their employment relationship with PCC and after its termination, employees of PCC are obliged to maintain absolute confi dentiality with regard to all business secrets and all other confi dential information about PCC of which they have become aware in connection with performance of their duties.
[2] Confi dential information includes information about PCC’s business activities, technology, intellectual property, fi nancial position and workforce as well as all information about PCC’s customers, suppliers and business partners.
[3] Confi dential information may not be passed on to third parties. Within PCC and elsewhere, confi dential information may only be passed on if the recipient of the information requires that information in order to carry out their role at PCC.
[4] Confi dential information and business documents must be appropriately protected against access by third parties and co-workers who are not party to said information and documents. In addition, e-mails sent internally by electronic means must, if necessary, be marked as “confi dential” or “strictly confi dential”.
[5] Moreover, confi dential information may only be made public if the related information is known to the public, its publication has been approved by PCC or publication is required on account of a legal obligation.
[6] Data and information relating to customers, business partners and market participants must be treated as strictly confi dential. All employees are obliged to use data and information of which they become aware in the course of their work within the permitted limits only. If said information is passed within or outside the company, the employee must check whether the addressee is entitled to receipt of the information.
[7] Data and information about the above-mentioned groups of persons and companies may only be collected, processed and used within the scope of its intended purpose, the principle of necessity and legal justifi cation.
[8] Employees’ personal details are treated with the utmost care within the scope of workforce data-privacy legislation.
INFORMATION SYSTEMS/SOFTWARE
[1] The provision of e-mail and internet access is for business purposes. The use of e-mail as a means of business communication is subject to the same archiving rules as correspondence on paper. When e-mails are sent, the same duties of care and modes of conduct as for correspondence on paper must be adhered to.
[2] PCC has purchased software compliant with the applicable licence terms for all workstations. Employees are not permitted to copy the software protected by licence agreements for private use, nor are they permitted to install private software at their workstation.
[3] Employees may, to a limited extent, utilise PCC’s internet connection and e-mail infrastructure for personal use, provided that this does not impair their work performance, pose or increase a security risk or make use of signifi cant resources. In this case, all e-mails shall be considered business e-mails.
[4] Employees must not under any circumstances misuse PCC’s information and communications media for illegal or unethical purposes.
REPORTING
[1] PCC attaches the greatest importance to complete, accurate, timely, detailed and comprehensible fi nancial statements and the cor-responding fi nancial reporting and communication. All employees in PCC’s Finance Department are, within the context of their work tasks, responsible for ensuring that effective procedures and internal controls for fi nancial reporting and the publication of information that is subject to the duty of disclosure are in place and adhered to.
[2] The statutory regulations, in particular the accounting principles, and PCC’s internal accounting procedure must be strictly adhered to. Dishonest reporting within the company or concerning other organisations or persons is prohibited.
PCC Group Δ Annual Report 2015 Δ Philosophy and strategy
29
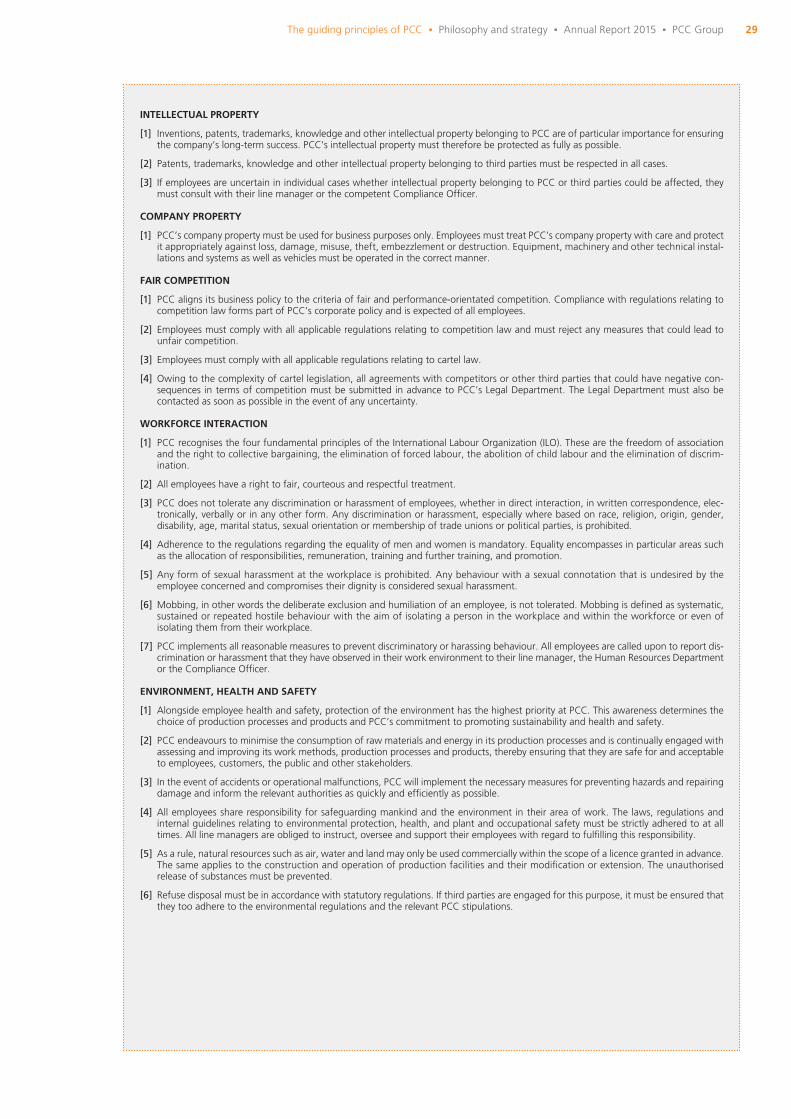
INTELLECTUAL PROPERTY
[1] Inventions, patents, trademarks, knowledge and other intellectual property belonging to PCC are of particular importance for ensuring the company’s long-term success. PCC’s intellectual property must therefore be protected as fully as possible.
[2] Patents, trademarks, knowledge and other intellectual property belonging to third parties must be respected in all cases.
[3] If employees are uncertain in individual cases whether intellectual property belonging to PCC or third parties could be affected, they must consult with their line manager or the competent Compliance Offi cer.
COMPANY PROPERTY
[1] PCC’s company property must be used for business purposes only. Employees must treat PCC’s company property with care and protect it appropriately against loss, damage, misuse, theft, embezzlement or destruction. Equipment, machinery and other technical instal-lations and systems as well as vehicles must be operated in the correct manner.
FAIR COMPETITION
[1] PCC aligns its business policy to the criteria of fair and performance-orientated competition. Compliance with regulations relating to competition law forms part of PCC’s corporate policy and is expected of all employees.
[2] Employees must comply with all applicable regulations relating to competition law and must reject any measures that could lead to unfair competition.
[3] Employees must comply with all applicable regulations relating to cartel law.
[4] Owing to the complexity of cartel legislation, all agreements with competitors or other third parties that could have negative con-sequences in terms of competition must be submitted in advance to PCC’s Legal Department. The Legal Department must also be contacted as soon as possible in the event of any uncertainty.
WORKFORCE INTERACTION
[1] PCC recognises the four fundamental principles of the International Labour Organization (ILO). These are the freedom of association and the right to collective bargaining, the elimination of forced labour, the abolition of child labour and the elimination of discrim-ination.
[2] All employees have a right to fair, courteous and respectful treatment.
[3] PCC does not tolerate any discrimination or harassment of employees, whether in direct interaction, in written correspondence, elec-tronically, verbally or in any other form. Any discrimination or harassment, especially where based on race, religion, origin, gender, disability, age, marital status, sexual orientation or membership of trade unions or political parties, is prohibited.
[4] Adherence to the regulations regarding the equality of men and women is mandatory. Equality encompasses in particular areas such as the allocation of responsibilities, remuneration, training and further training, and promotion.
[5] Any form of sexual harassment at the workplace is prohibited. Any behaviour with a sexual connotation that is undesired by the employee concerned and compromises their dignity is considered sexual harassment.
[6] Mobbing, in other words the deliberate exclusion and humiliation of an employee, is not tolerated. Mobbing is defi ned as systematic, sustained or repeated hostile behaviour with the aim of isolating a person in the workplace and within the workforce or even of isolating them from their workplace.
[7] PCC implements all reasonable measures to prevent discriminatory or harassing behaviour. All employees are called upon to report dis-crimination or harassment that they have observed in their work environment to their line manager, the Human Resources Department or the Compliance Offi cer.
ENVIRONMENT, HEALTH AND SAFETY
[1] Alongside employee health and safety, protection of the environment has the highest priority at PCC. This awareness determines the choice of production processes and products and PCC’s commitment to promoting sustainability and health and safety.
[2] PCC endeavours to minimise the consumption of raw materials and energy in its production processes and is continually engaged with assessing and improving its work methods, production processes and products, thereby ensuring that they are safe for and acceptable to employees, customers, the public and other stakeholders.
[3] In the event of accidents or operational malfunctions, PCC will implement the necessary measures for preventing hazards and repairing damage and inform the relevant authorities as quickly and effi ciently as possible.
[4] All employees share responsibility for safeguarding mankind and the environment in their area of work. The laws, regulations and internal guidelines relating to environmental protection, health, and plant and occupational safety must be strictly adhered to at all times. All line managers are obliged to instruct, oversee and support their employees with regard to fulfi lling this responsibility.
[5] As a rule, natural resources such as air, water and land may only be used commercially within the scope of a licence granted in advance. The same applies to the construction and operation of production facilities and their modifi cation or extension. The unauthorised release of substances must be prevented.
[6] Refuse disposal must be in accordance with statutory regulations. If third parties are engaged for this purpose, it must be ensured that they too adhere to the environmental regulations and the relevant PCC stipulations.
The guiding principles of PCC Δ Philosophy and strategy Δ Annual Report 2015 Δ PCC Group
30
THE GROUP STRATEGY OF PCCD
ivis
ion
sB
usi
nes
s u
nit
s
Chemicals
Seg
men
ts
∂ Polyols
∂ Polyurethane Systems
Polyols
∂ Anionic Surfactants
∂ Non-ionic Surfactants
∂ Amphoteric Surfactants (Betaines)
Surfactants
∂ Chlorine
∂ MCAA
∂ Other Chlorine Downstream Products
Chlorine
∂ Phosphorus and Naphthalene Derivatives
∂ Alkylphenols
∂ Chemicals and Commodities Trading
∂ Quartzite
SpecialityChemicals
∂ Household and Industrial Cleaners, Detergents and Personal Care Products
∂ Matches and Firelighters
ConsumerProducts
∂ Renewable Energies
∂ Conventional Energies
Energy
Energy
∂ Intermodal Transport
∂ Road Haulage
∂ Rail Transport
Logistics
Logistics
∂ Portfolio Manage- ment
∂ Projects
∂ Services
Holding/Projects
Holding/Projects
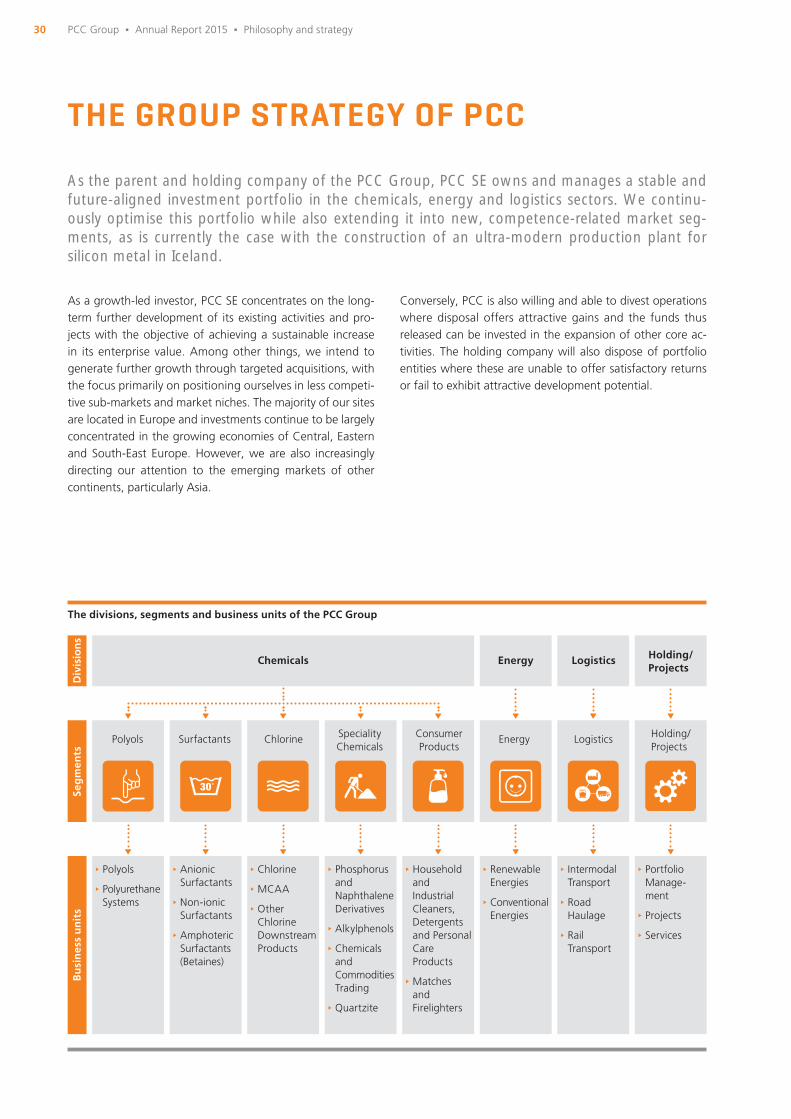
The divisions, segments and business units of the PCC Group
As a growth-led investor, PCC SE concentrates on the long-term further development of its existing activities and pro-jects with the objective of achieving a sustainable increase in its enterprise value. Among other things, we intend to generate further growth through targeted acquisitions, with the focus primarily on positioning ourselves in less competi-tive sub-markets and market niches. The majority of our sites are located in Europe and investments continue to be largely concentrated in the growing economies of Central, Eastern and South-East Europe. However, we are also increasingly directing our attention to the emerging markets of other continents, particularly Asia.
Conversely, PCC is also willing and able to divest operations where disposal offers attractive gains and the funds thus released can be invested in the expansion of other core ac-tivities. The holding company will also dispose of portfolio entities where these are unable to offer satisfactory returns or fail to exhibit attractive development potential.
As the parent and holding company of the PCC Group, PCC SE owns and manages a stable and future-aligned investment portfolio in the chemicals, energy and logistics sectors. We continu-ously optimise this portfolio while also extending it into new, competence-related market seg-ments, as is currently the case with the construction of an ultra-modern production plant for silicon metal in Iceland.
PCC Group Δ Annual Report 2015 Δ Philosophy and strategy
31
THE STRATEGY OF THE GROUP DIVISIONS AND SEGMENTSTHE CHEMICALS DIVISION WITH ITS SEGMENTS POLYOLS, SURFACTANTS, CHLORINE, SPECIALITY CHEMICALS AND CONSUMER PRODUCTS
The strategic objective of our Chemicals division is to further consolidate our, in part, market-leading positions in Central Europe and to expand these wherever possible. With our strategic investments, we focus in this division, which is led by the chemicals concern PCC Rokita SA headquartered in Brzeg Dolny (Poland), on selected product categories in the segments Polyols, Surfactants, Chlorine and Speciality Chem-icals, and in the latter case particularly on fl ame retardants. In the Polyols and Surfactants segments especially, we are increasingly switching to the development of higher-grade speciality products, applications and system solutions. In the Chlorine segment, we are extending our value chain through the construction of a production plant for the manufacture of ultra-pure monochloroacetic acid (MCAA) at our chemi-cals site in Brzeg Dolny. The chlorine we produce ourselves will be used as a feedstock for this facility. The priority within the segments responsible for chemicals production is specif-
ically on investing in our existing sites and facilities. Upgrad-ing our existing plants aligned to future environmental and cost-effi ciency standards is given the same level of priority as expanding our capabilities with new production facilities. In keeping with this policy, we were able to complete the tech-nology switch in our chlorine production facilities to the en-vironmentally friendly membrane process in April 2015, with a signifi cant reduction in energy consumption also ensuing.
The original core business of PCC, namely trading with pe-troleum- and carbon-based commodities, is assigned to the Speciality Chemicals segment. Beyond commodities trading, this operation is also responsible for supporting our produc-tion companies – on both the procurement and the sales and distribution sides – in those markets in which our trading companies have acquired expertise over the last two decades of activity. Over the next few years, we plan to turn around the Con-sumer Products segment, also referred to as the “PCC Con-sumer Products” subgroup, with a view to returning it to success and driving its further expansion. The future growth of this subgroup is to be generated not just from the further
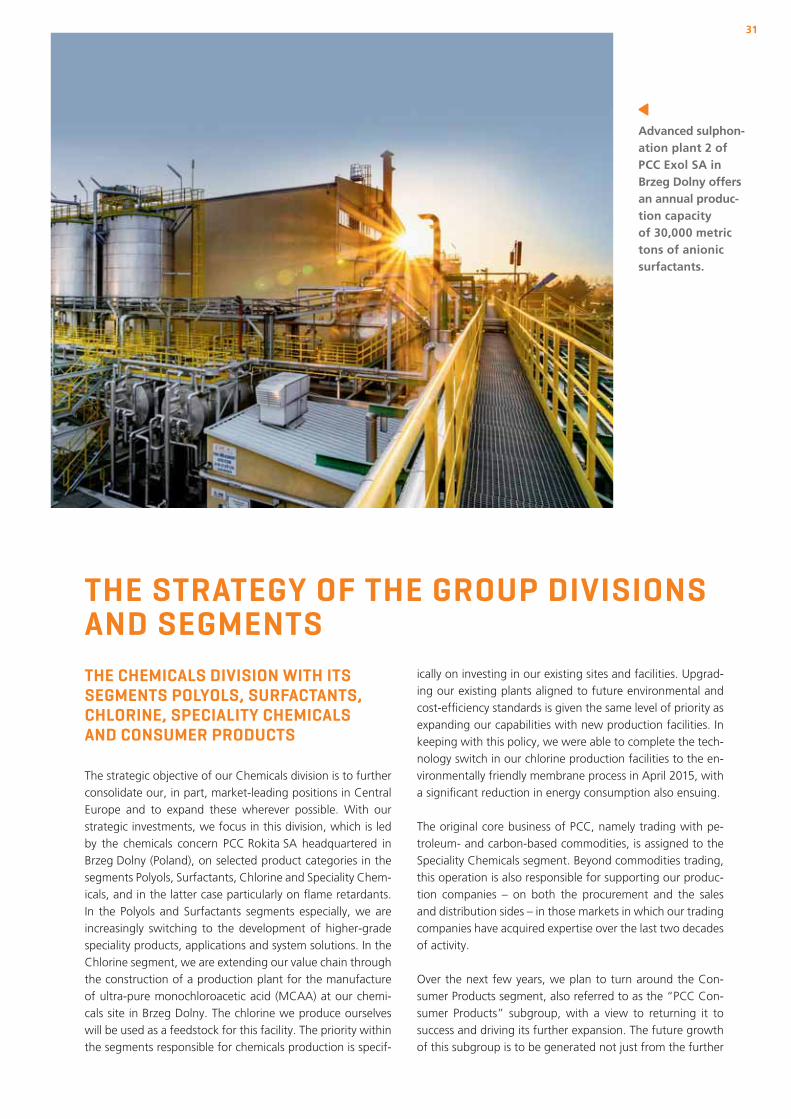
Advanced sulphon-ation plant 2 of PCC Exol SA in Brzeg Dolny offers an annual produc-tion capacity of 30,000 metric tons of anionic surfactants.
32
development of the existing product portfolio but also from entry into new sales markets outside Poland, particularly in Western Europe. The long-term goal is to fl oat the subgroup on the Warsaw Stock Exchange (GPW).
THE ENERGY DIVISION
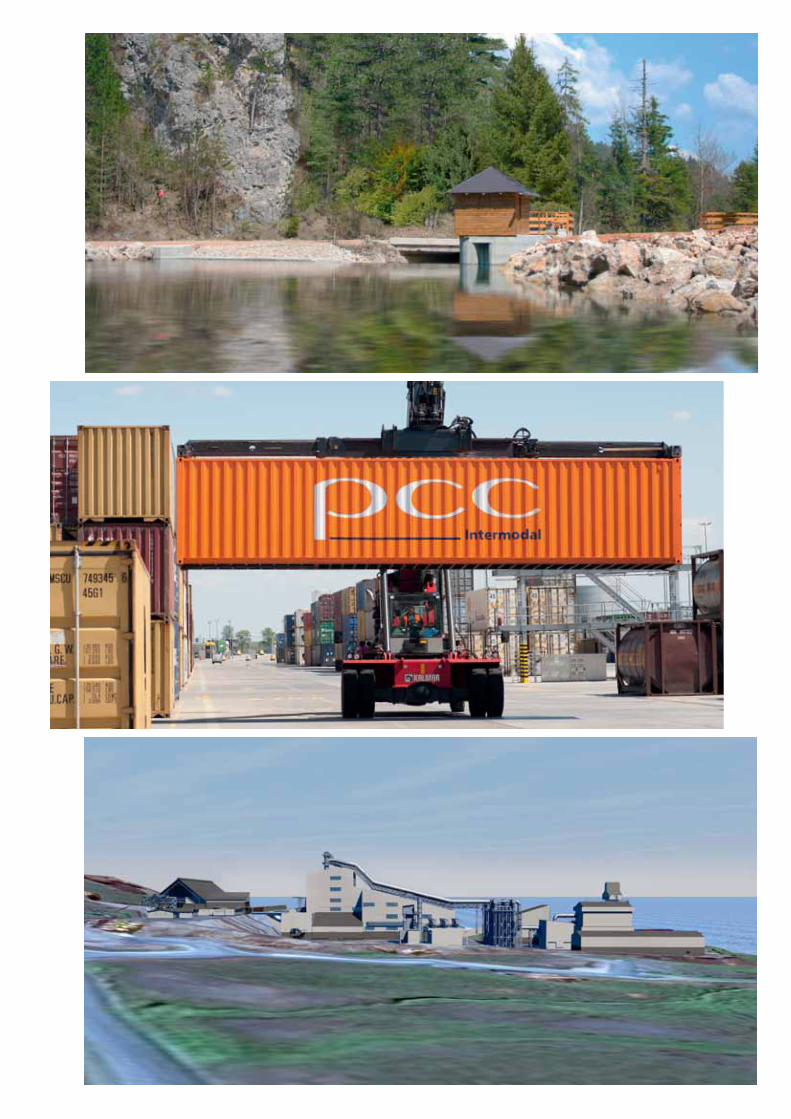
Our focus in the Energy division is on the construction and operation of power generating facilities. The development, planning, implementation and also the selling-on of projects, particularly in the Renewable Energies fi eld, are also integral to our strategic focus. The project company acting on our behalf in such endeavours is our subsidiary PCC DEG Renew-ables, a joint venture with KfW subsidiary DEG – Deutsche Investitions- und Entwicklungsgesellschaft mbH, Cologne (Germany). We have so far commissioned one small hydro-power plant in Central Bosnia and four in the Republic of Macedonia. 2016 sees us start construction work on a fi fth site there. This will take us a further step closer to our objec-tive of operating a portfolio of power plants that may even-tually be sold en bloc to a strategic investor.
THE LOGISTICS DIVISION
Within the Logistics division, the focus of our growth and ambitions is on the expansion of the container terminals and the network of transport links operated by the Group sub-sidiary PCC Intermodal S.A. We successfully commissioned the fi rst combined transport terminal in Central Poland at the end of September 2011. We now operate fi ve wholly owned terminals, four of which were substantially expanded in recent years: the end of 2015 witnessed the on-schedule expansion and modernisation of the handling terminal in Gliwice (Poland). Shortly before that, in September, the ex-panded terminal in Brzeg Dolny was opened, preceded in June by the extended terminal in Kutno (Poland) and, in December 2014, the upgraded terminal in Frankfurt (Oder) (Germany). We are also planning to build a sixth terminal near Gdynia, the site of the headquarters of PCC Intermodal S.A. in the coming years. Already today, this Group entity offers container transport services within Poland and also between Poland and the major European ports of Rotterdam, Antwerp, Hamburg and Bremerhaven. At the beginning of this year, we also opened a direct link between the industrial Ruhr district in Germany and Central Poland, and in May, this was followed by intermodal services eastwards as far as China. In this market and with our base in Poland, we can look for-ward to enormous growth opportunities, the exploitation of which is a strategic core objective of PCC.
Through its road haulage arm PCC Autochem Sp. z o.o., Brzeg Dolny, PCC is also active on the international market for hazardous goods haulage, as it is on the Russian rail transport market through its portfolio company ZAO PCC Rail, Moscow.
THE HOLDING/PROJECTS DIVISION
In addition to PCC SE, our parent and holding company, the Holding/Projects division also incorporates a number of entities including the IT unit, our research and development activities, and undertakings still at the start-up phase. One such is our project in Iceland where we are in the process of constructing one of the world’s most modern and environmentally friendly production plants for silicon metal. Due for completion in 2018, a major objective of this project – which accounts for an investment volume of around US$ 300 million – is to signifi -cantly extend our value chain, with the quartzite feedstock for the plant being taken from our Group-owned quarry in Zagórze (Poland). The construction of the plant began in June 2015 following the initial development in the spring of that year of the new Bakki industrial park near Húsavík in the north of Iceland. The offi cial inauguration of the site took place in the presence of renowned representatives from the world of politics and business in September 2015. In a further project under the management of the Holding seg-ment, we are planning to construct – through a joint venture with a long-standing Russian partner – a plant for the produc-tion of dimethyl ether (DME), which is predominantly used as an odourless and environmentally compatible aerosol propellant.
The PCC hydropower plant Mujada in Bosnia-Herze-govina has been hooked up to the local grid since
2009 and by the end of 2015 had generated a total of around 42 million kWh of electricity, saving approxi-
mately 45,500 metric tons of CO2 emissions.
The PCC container terminals have been upgraded and signifi cantly expanded in recent years. Together, all
fi ve terminals account today for a handling capacity of 660,000 TEU.
In Iceland, we are building one of the world’s most advanced and environmentally friendly silicon metal
production plants. Scheduled for commissioning in 2018, it will offer an annual capacity of 32,000 metric
tons (shown in the picture: computer image).
PCC Group Δ Annual Report 2015 Δ Philosophy and strategy

34
Economic, social and ecological sustainability is fi rmly rooted in the corporate philosophy and Group strategy of PCC. We are committed to pursuing dynamic and value-adding growth in full compliance with the imperative of sustainable and ethically responsible develop-ment within the PCC Group.
3 SUSTAINABILITY AT PCC

35Sustainability at PCC Δ Annual Report 2015 Δ PCC Group
Far beyond being a marginal obligation to blindly follow “zeitgeist” trends, sustainability constitutes an essential core component of the long-term strategy of PCC SE and all its Group entities. We regard all aspects of sustainability in its eco-nomic, ecological, social and ethical sense as mutually bene-fi cial components in value-adding growth. Numerous awards and high scores in sustainability rankings, achieved particu-larly by our subsidiaries PCC Exol SA and PCC Rokita SA, fur-ther strengthen our commitment to this strategic alignment.
Taking the example of ecological sustainability, we pursue all our investment projects through the use of advanced, en-
vironmentally friendly and thus energy-saving and cost-effi -cient technologies. For us, preserving and protecting the en-vironment is assigned the same high priority as ensuring the safety of our employees. We therefore regard sustainability not as a growth inhibitor but rather the opposite – as a plat-form for earnings generation and long-term corporate suc-cess. Nor is it a static aspiration which, once achieved, can be ticked off and sidelined. Instead we regard it as a continuous, dynamic process, as vibrant and vital as the growth process pursued by the Group as a whole. Sustainability guidelines promote our creativity and inspire innovation, enabling us, for example, to utilise natural resources more effi ciently and
–162,000METRIC TONS CO2 EMISSIONS PER YEAR
These are the total savings that have resulted from the technology switch implemented in respect of our chlor-alkali electrolysis facilities and operation of environmentally friendly small hydropower plants.
The energy required to operate our silicon metal plant, currently under construction, will be taken 100 %from renewable sources such as those exploited by geothermal generating facilities.
35
37
40
42
44
48
THE SUSTAINABILITY STRATEGY OF PCC
CHEMICALS: SUSTAINABILITY THROUGH INNOVATION
ENERGY: ENVIRONMENTALLY FRIENDLY POWER PLANTS
LOGISTICS: ECOLOGICALLY EFFICIENT CONTAINER TRANSPORT
PROJECTS: SUSTAINABLE SILICON METAL PRODUCTION IN ICELAND
RISK MANAGEMENT
THE SUSTAINABILITY STRATEGY OF PCC
The management of our international investment portfolio is rigorously aligned to the continuous creation of new and added enterprise value. This is at the core of our growth strategy and under-pins our entire sustainability policy.

36 PCC Group Δ Annual Report 2015 Δ Sustainability at PCC
to apply new technologies that reduce the energy consump-tion and emissions of our facilities. Thus, progress in sustain-ability both cuts costs and benefi ts the world around us.
One example of this approach is the complete switchover – culminating in the spring of the year under review – of our chlorine manufacturing technology to the environmentally friendly membrane electrolysis process. Among other things, this has reduced CO2 emissions by 140,000 metric tons per year, with electricity costs also exhibiting a substantial de-crease. And then there is our silicon metal production plant in Iceland, the site of which was offi cially opened in Septem-ber 2015. This will be one of the most advanced facilities of its kind worldwide, both from an economic point of view and also in respect of its environmental protection creden-tials. The energy supplied to the plant will come entirely from renewable geothermal and hydropower sources, while the installation of ultra-modern fi lters will keep the plant virtual-ly free from dust emissions. The main pillar of our Logistics segment is provided by our intermodal container transport operation in which road and rail transportation are effi cient-ly combined to the benefi t of the environment. And in the Energy segment, our new projects focus on power plant designed to harness regenerative energy sources, and par-ticularly the construction and operation of small hydropower facilities which, because of their minimal intervention in na-ture, can be regarded as particularly environmentally com-patible. So far, we have connected fi ve of these hydroelectric power plants to their respective grids, with the ensuing CO2 savings amounting to over 22,000 metric tons per year.
This commitment to sustainability is embedded in our strate-gy and our guidelines on corporate social responsibility (CSR). We are giving ever greater priority to socially responsible cor-porate management throughout the Group. But sustainabil-ity goes far beyond environmental protection. For us it also means nurturing a long-term relationship of trust based on partnership with all our stakeholders – from our employees, customers and investors through to residents that make up the social environment of our sites.
By extension, we of the PCC Group also promote the contin-uous personal development of our employees, encouraging their creativity and embracing their diversity, thus creating the right spirit for advancing innovation. Our relationship with our suppliers and business partners is characterised by a belief in fairness. Through transparency and reliability, we develop sustainable relationships with our investors and lenders. With this approach and in harness with our fi nanc-ing partner, the Frankfurt-based KfW IPEX-Bank, and a con-
sortium of Icelandic investors, we have – after several years of preparatory work – brought into being what is to date PCC’s largest individual project, namely the construction of a silicon metal plant in Iceland. This too proves that CSR, interpreted as the responsible treatment of all stakeholders, is not a luxury but actually a prerequisite to the creation of enterprise value.
Our portfolio companies are also dedicated to improving the social environment of their sites. Our most important chemicals plants in Poland, those of PCC Rokita SA and PCC Exol SA, are an important factor of life for the inhab-itants of the small town of Brzeg Dolny in Poland’s Lower Silesia. PCC is one of the biggest employers in the region; and we supply Brzeg Dolny with water, clean the municipal sewage and provide distance heating. Through this, we are able to acquire what might be called a “social licence” for our economic activities. It is not just that these are pursued within all the relevant legal and regulatory frameworks, they are also regarded as desirable by the people populating the environs concerned. We also found this to be the case in Iceland recently where the construction of our silicon metal plant is providing growth momentum for an entire region.
Yet our social engagement extends even further. PCC SE and its subsidiaries are patrons of several children’s homes and promote local and regional sport and cultural events. We are the name sponsor of the PCC Stadium in Duisburg-Homberg close to our Group headquarters, and in Tanzania, PCC SE supports the Amani AIDS orphans’ Home in Mbigili (AOHM), sponsoring the construction of a house and also providing study scholarships.
Taken together, these initiatives aligned to sustainable de-velopment in our industries enable us to generate growth within our Group in line with the vaulted values that make up our corporate ethos.
On the following pages, we offer more detail of how our Group segments pursue and achieve sustainable develop-ment. After that, we familiarise you with our risk manage-ment system.
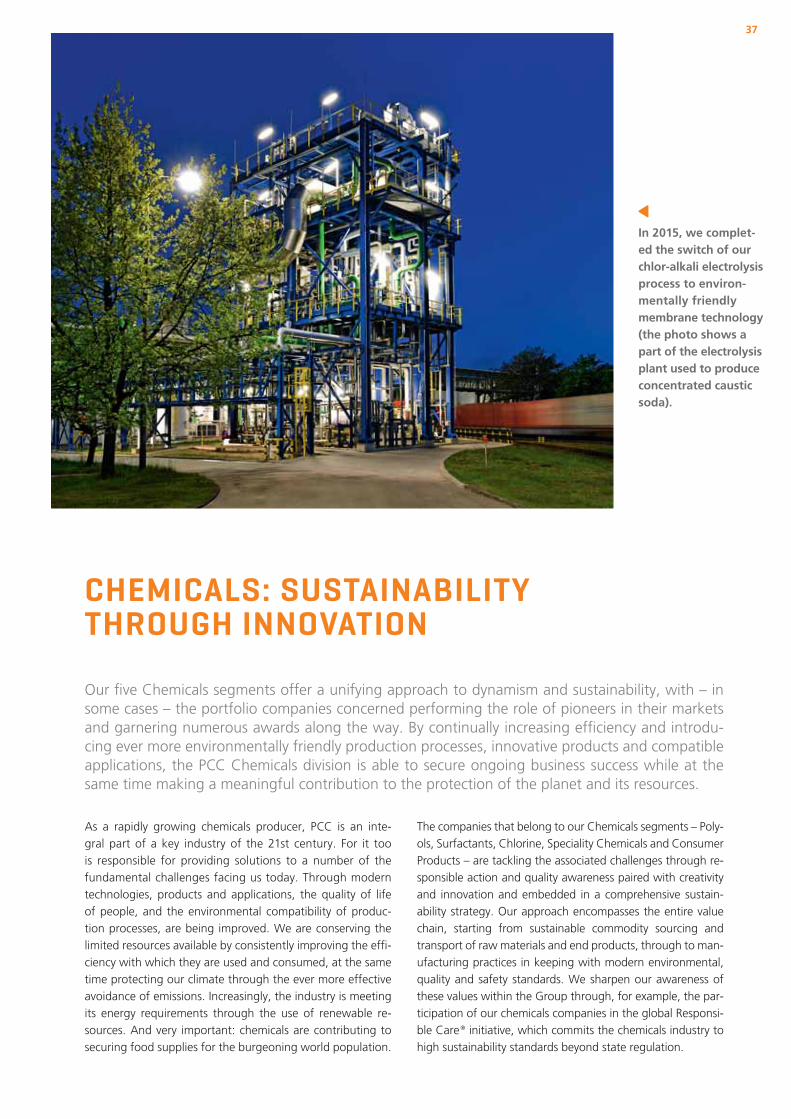
37
As a rapidly growing chemicals producer, PCC is an inte-gral part of a key industry of the 21st century. For it too is responsible for providing solutions to a number of the fundamental challenges facing us today. Through modern technologies, products and applications, the quality of life of people, and the environmental compatibility of produc-tion processes, are being improved. We are conserving the limited resources available by consistently improving the effi -ciency with which they are used and consumed, at the same time protecting our climate through the ever more effective avoidance of emissions. Increasingly, the industry is meeting its energy requirements through the use of renewable re-sources. And very important: chemicals are contributing to securing food supplies for the burgeoning world population.
CHEMICALS: SUSTAINABILITY THROUGH INNOVATION
Our fi ve Chemicals segments offer a unifying approach to dynamism and sustainability, with – in some cases – the portfolio companies concerned performing the role of pioneers in their markets and garnering numerous awards along the way. By continually increasing effi ciency and introdu-cing ever more environmentally friendly production processes, innovative products and compatible applications, the PCC Chemicals division is able to secure ongoing business success while at the same time making a meaningful contribution to the protection of the planet and its resources.
The companies that belong to our Chemicals segments – Poly-ols, Surfactants, Chlorine, Speciality Chemicals and Consumer Products – are tackling the associated challenges through re-sponsible action and quality awareness paired with creativity and innovation and embedded in a comprehensive sustain-ability strategy. Our approach encompasses the entire value chain, starting from sustainable commodity sourcing and transport of raw materials and end products, through to man-ufacturing practices in keeping with modern environmental, quality and safety standards. We sharpen our awareness of these values within the Group through, for example, the par-ticipation of our chemicals companies in the global Responsi-ble Care® initiative, which commits the chemicals industry to high sustainability standards beyond state regulation.
In 2015, we complet-ed the switch of our chlor-alkali electrolysis process to environ-mentally friendly membrane technology (the photo shows a part of the electrolysis plant used to produce concentrated caustic soda).

38
Various awards, particularly for our two major Polish production companies PCC Rokita SA and PCC Exol SA, strengthen our resolve in focusing on sustainability. Both companies, for example, submit to the renowned inter-national sustainability audits carried out by EcoVadis. At the beginning of the year, our surfactants manufactur-er PCC Exol received the EcoVadis Gold certifi cate for its performance in the fi eld of corporate social responsibility (CSR), thus achieving the highest status available within the 2016 rankings. Overall, PCC Exol thus counts among the top 2 % of the globally highest scoring suppliers assessed by EcoVadis across all CSR categories. PCC Exol had already participated in the CSR audit in the previous year, immedi-ately achieving Silver status. Since that time, it has signifi -cantly further increased its ratings in a number of key cate-gories, such as employee working conditions, fair business practices and sustainability across its entire supply chain. PCC Rokita submitted to the challenge of an EcoVadis au-dit for the fi rst time in 2015, and was likewise awarded a Silver certifi cate to match the achievement of its sister company in the previous year. This means that our largest Group company already counts among the top 30 % of the most sustainable companies audited by EcoVadis around the world.
In their home market of Poland, both chemicals companies are pioneers in submitting to audits of external rankings to assess the sustainability of their production systems and also their CSR performance. This is underlined by a number of awards in recognition of both their social importance and their sustainability credentials within the economic context. For example, PCC Rokita was among the award-winners of the competition entitled “2015’s Employers of Tomorrow” organised by the Polish Agency for Enterprise Development. It garnered honours as a socially responsible company for its particular focus on the practical training of schoolchildren and students. In the previous year, the chemicals company was recognised as “Lower Silesia’s Best Exporter in 2014” and was nominated for the title “Pearl of the Polish Econo-my”, as was PCC Exol. At the beginning of the year under review, the latter received the award “Economic Driver of 2015”, placing it among a select group of innovative Polish companies recognised for strengthening the industrial and economic competitiveness of their country.
Within our group of companies, PCC Exol developed a series of initiatives last year, enabling it to assume a kind of pio-neering role in the fi eld of sustainability:
∂ In 2014, for example, PCC Exol joined the Global Com-pact initiative of the United Nations, thus committing to compliance with ten universal principles of sustainable development. In the same year, it implemented the corre-sponding code of ethics for employees, a similar code for suppliers, an anti-corruption policy and a series of regula-tions governing respect for human rights, environmental protection and process safety.
∂ PCC Exol has also been a member of the international Carbon Disclosure Project (CDP) since 2012, making it an active proponent in combating climate change. In 2015, the associated audit report gave it a CDP score of 93 out of 100 (2014: 81 points), thus placing it well above the average score of 53 points for all companies assessed.
∂ In 2014, PCC Exol was also the very fi rst Polish compa-ny to implement the system of Good Manufacturing Practice in compliance with the guidelines issued by the European Federation for Cosmetic Ingredients (EFfCI). Certifi cation provides PCC Exol with a major compe-titive edge, as it confi rms to cosmetics manufacturers around the world that it reliably satisfi es the highest stan-dards imposed at each phase of production.
∂ PCC Exol is also a certifi ed member of the Roundtable on Sustainable Palm Oil (RSPO), which means that it is actively engaged in the sustainable production of palm kernel oil, an important raw material in the manufacture of surfactants. However, our Group commitment actually goes further: in Ghana, West Africa, PCC Organic Oils Ghana Ltd., Accra, has started the development of a sourcing position desig-ned to secure over the long term renewable raw materials such as palm kernel oil – extracted from palm kernels which we collect from smallholders – for the surfactant production operations of PCC Exol. This is an example of sustainability on the procurement side.
∂ In the social domain of sustainability, PCC Exol has, for example, signed the Diversity Charter, an instrument de-signed to promote diversity among employees as a po-sitive factor in companies and institutions and thus to combat workplace discrimination.
The following page offers a list of further initiatives implement-ed by these and also our other chemicals companies.
PCC Group Δ Annual Report 2015 Δ Sustainability at PCC
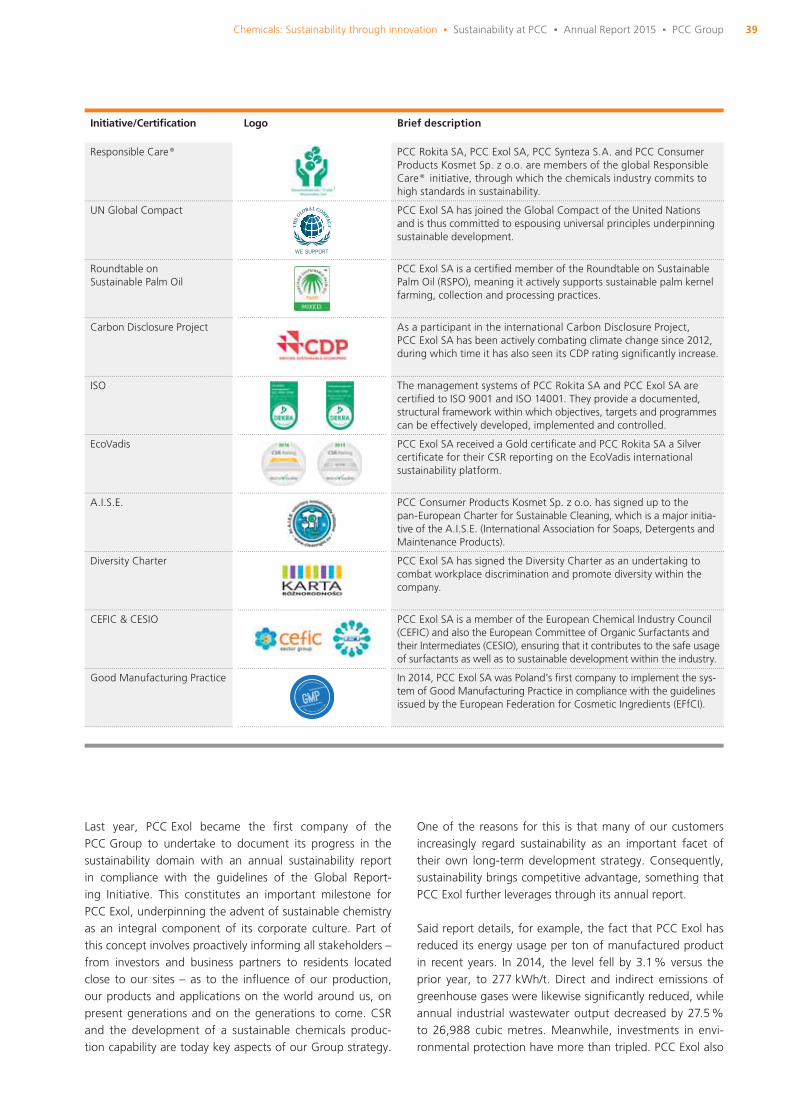
39
Last year, PCC Exol became the fi rst company of the PCC Group to undertake to document its progress in the sustainability domain with an annual sustainability report in compliance with the guidelines of the Global Report-ing Initiative. This constitutes an important milestone for PCC Exol, underpinning the advent of sustainable chemistry as an integral component of its corporate culture. Part of this concept involves proactively informing all stakeholders – from investors and business partners to residents located close to our sites – as to the infl uence of our production, our products and applications on the world around us, on present generations and on the generations to come. CSR and the development of a sustainable chemicals produc-tion capability are today key aspects of our Group strategy.
One of the reasons for this is that many of our customers increasingly regard sustainability as an important facet of their own long-term development strategy. Consequently, sustainability brings competitive advantage, something that PCC Exol further leverages through its annual report.
Said report details, for example, the fact that PCC Exol has reduced its energy usage per ton of manufactured product in recent years. In 2014, the level fell by 3.1 % versus the prior year, to 277 kWh/t. Direct and indirect emissions of greenhouse gases were likewise signifi cantly reduced, while annual industrial wastewater output decreased by 27.5 % to 26,988 cubic metres. Meanwhile, investments in envi-ronmental protection have more than tripled. PCC Exol also
Initiative/Certifi cation Logo Brief description
Responsible Care® PCC Rokita SA, PCC Exol SA, PCC Synteza S.A. and PCC Consumer Products Kosmet Sp. z o.o. are members of the global Responsible Care® initiative, through which the chemicals industry commits to high standards in sustainability.
UN Global Compact PCC Exol SA has joined the Global Compact of the United Nations and is thus committed to espousing universal principles underpinning sustainable development.
Roundtable on Sustainable Palm Oil
PCC Exol SA is a certifi ed member of the Roundtable on Sustainable Palm Oil (RSPO), meaning it actively supports sustainable palm kernel farming, collection and processing practices.
Carbon Disclosure Project As a participant in the international Carbon Disclosure Project, PCC Exol SA has been actively combating climate change since 2012, during which time it has also seen its CDP rating signifi cantly increase.
ISO The management systems of PCC Rokita SA and PCC Exol SA are certifi ed to ISO 9001 and ISO 14001. They provide a documented, structural framework within which objectives, targets and programmes can be effectively developed, implemented and controlled.
EcoVadis PCC Exol SA received a Gold certifi cate and PCC Rokita SA a Silver certifi cate for their CSR reporting on the EcoVadis international sustainability platform.
A.I.S.E. PCC Consumer Products Kosmet Sp. z o.o. has signed up to the pan-European Charter for Sustainable Cleaning, which is a major initia-tive of the A.I.S.E. (International Association for Soaps, Detergents and Maintenance Products).
Diversity Charter PCC Exol SA has signed the Diversity Charter as an undertaking to combat workplace discrimination and promote diversity within the company.
CEFIC & CESIO PCC Exol SA is a member of the European Chemical Industry Council (CEFIC) and also the European Committee of Organic Surfactants and their Intermediates (CESIO), ensuring that it contributes to the safe usage of surfactants as well as to sustainable development within the industry.
Good Manufacturing Practice In 2014, PCC Exol SA was Poland’s fi rst company to implement the sys-tem of Good Manufacturing Practice in compliance with the guidelines issued by the European Federation for Cosmetic Ingredients (EFfCI).
Chemicals: Sustainability through innovation Δ Sustainability at PCC Δ Annual Report 2015 Δ PCC Group
Good m
a n u f a c t u r i n g p r a c t i c e
D o b r e p r a k t y k i p r o d u k
c
yjne
GMPwg EFfC
I
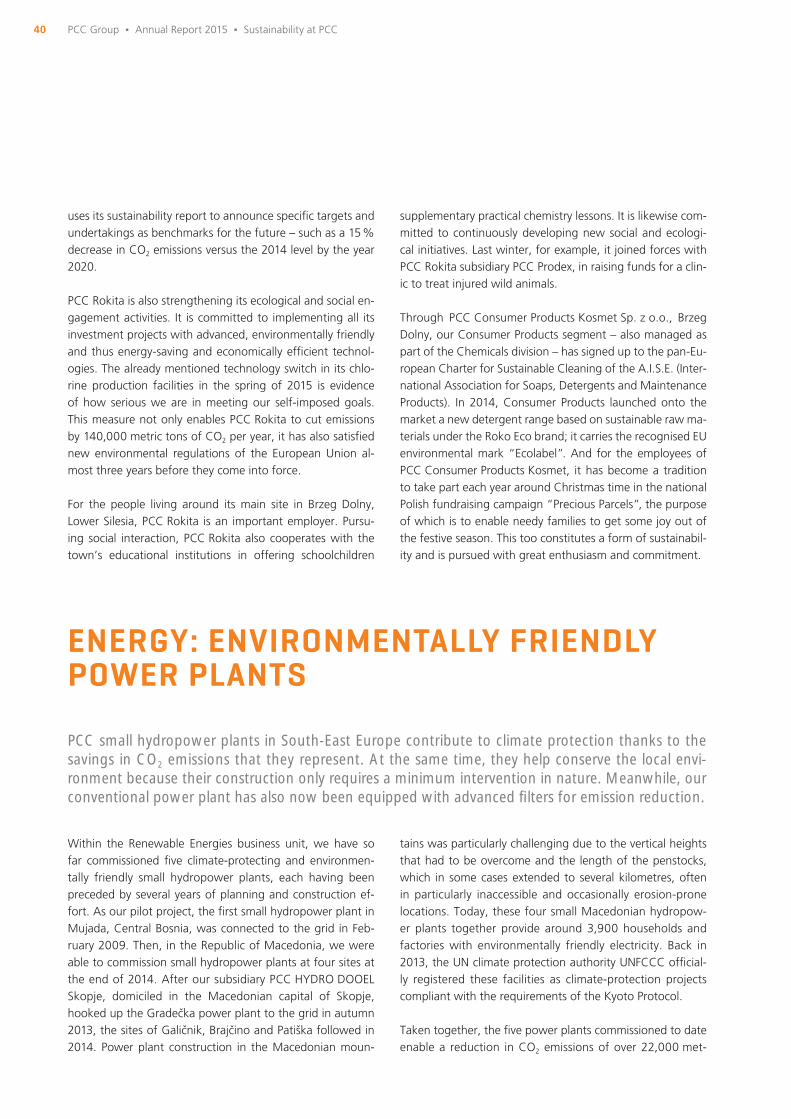
40
uses its sustainability report to announce specifi c targets and undertakings as benchmarks for the future – such as a 15 % decrease in CO2 emissions versus the 2014 level by the year 2020.
PCC Rokita is also strengthening its ecological and social en-gagement activities. It is committed to implementing all its investment projects with advanced, environmentally friendly and thus energy-saving and economically effi cient technol-ogies. The already mentioned technology switch in its chlo-rine production facilities in the spring of 2015 is evidence of how serious we are in meeting our self-imposed goals. This measure not only enables PCC Rokita to cut emissions by 140,000 metric tons of CO2 per year, it has also satisfi ed new environmental regulations of the European Union al-most three years before they come into force.
For the people living around its main site in Brzeg Dolny, Lower Silesia, PCC Rokita is an important employer. Pursu-ing social interaction, PCC Rokita also cooperates with the town’s educational institutions in offering schoolchildren
supplementary practical chemistry lessons. It is likewise com-mitted to continuously developing new social and ecologi-cal initiatives. Last winter, for example, it joined forces with PCC Rokita subsidiary PCC Prodex, in raising funds for a clin-ic to treat injured wild animals.
Through PCC Consumer Products Kosmet Sp. z o.o., Brzeg Dolny, our Consumer Products segment – also managed as part of the Chemicals division – has signed up to the pan-Eu-ropean Charter for Sustainable Cleaning of the A.I.S.E. (Inter-national Association for Soaps, Detergents and Maintenance Products). In 2014, Consumer Products launched onto the market a new detergent range based on sustainable raw ma-terials under the Roko Eco brand; it carries the recognised EU environmental mark “Ecolabel”. And for the employees of PCC Consumer Products Kosmet, it has become a tradition to take part each year around Christmas time in the national Polish fundraising campaign “Precious Parcels”, the purpose of which is to enable needy families to get some joy out of the festive season. This too constitutes a form of sustainabil-ity and is pursued with great enthusiasm and commitment.
ENERGY: ENVIRONMENTALLY FRIENDLY POWER PLANTS
PCC small hydropower plants in South-East Europe contribute to climate protection thanks to the savings in CO2 emissions that they represent. At the same time, they help conserve the local envi-ronment because their construction only requires a minimum intervention in nature. Meanwhile, our conventional power plant has also now been equipped with advanced fi lters for emission reduction.
Within the Renewable Energies business unit, we have so far commissioned fi ve climate-protecting and environmen-tally friendly small hydropower plants, each having been preceded by several years of planning and construction ef-fort. As our pilot project, the fi rst small hydropower plant in Mujada, Central Bosnia, was connected to the grid in Feb-ruary 2009. Then, in the Republic of Macedonia, we were able to commission small hydropower plants at four sites at the end of 2014. After our subsidiary PCC HYDRO DOOEL Skopje, domiciled in the Macedonian capital of Skopje, hooked up the Gradečka power plant to the grid in autumn 2013, the sites of Galičnik, Brajčino and Patiška followed in 2014. Power plant construction in the Macedonian moun-
tains was particularly challenging due to the vertical heights that had to be overcome and the length of the penstocks, which in some cases extended to several kilometres, often in particularly inaccessible and occasionally erosion-prone locations. Today, these four small Macedonian hydropow-er plants together provide around 3,900 households and factories with environmentally friendly electricity. Back in 2013, the UN climate protection authority UNFCCC offi cial-ly registered these facilities as climate-protection projectscompliant with the requirements of the Kyoto Protocol.
Taken together, the fi ve power plants commissioned to date enable a reduction in CO2 emissions of over 22,000 met-
PCC Group Δ Annual Report 2015 Δ Sustainability at PCC

Waterfalls such as this one here in the Macedo-nian mountains can be harnessed for environ-mentally compatible electricity generation with only a minimum of intervention in nature.
Brajčino small hydropower plant
in the Republic of Macedonia
serves an aver-age of around
1,200 households.
Our CHP plant in Brzeg Dolny
not only supplies energy to our chemicals site
but also to many households in
the town.
ric tons per year while producing more than 22.5 million kWh (kilowatt-hours) of electricity as a long-term annual aver-age. In addition, we are beginning this year, 2016, with the construction of a further power plant in Macedonia and have another three such facilities at the planning phase in Bosnia-Herzegovina. The overall management of these projects is the responsibility of PCC DEG Re-newables GmbH, Duisburg (Germany), a joint venture that we operate together with the KfW subsidiary DEG – Deutsche Investitions- und Entwicklungsgesellschaft mbH.
But it is not only with respect to the avoidance of climate-damaging emissions that these power plants based on water pressure as a renewable source of energy offer an outstand-ing example of sustainable electricity generation. Their other advantage is that they only require a minimum intervention
in nature. Once completed, they blend naturally into their environment. Moreover, we are able to meet our social responsibility in the implementation of these projects. For example, in Galičnik in Macedonia, we sponsored the pav-ing of important access roads serving the village of Janche nearby, and we are also providing a plastic pipeline to en-able the surrounding fi elds to be irrigated without loss of water. This and other social and environmental projects at the other locations were co-fi nanced by our joint venture partner DEG from public funds provided by the Federal Ministry for Economic Cooperation and Development.
We have received external recognition for the high quality of our power plant projects: at the end of 2014, the fi nancing bank EBRD (European Bank for Reconstruction and Devel-opment) recognised the successful commissioning of three

42
LOGISTICS: ECOLOGICALLY EFFICIENT CONTAINER TRANSPORT
PCC Intermodal S.A., the largest Group company of our Logistics segment, is one of Poland’s leading providers of intermodal container transport services, offering effi cien-cy and environmental compatibility achieved through the combination of road and rail haulage. With a platform comprising its own, advanced container terminals in Ku-tno, Brzeg Dolny, Gliwice and Frankfurt (Oder), together with a further terminal in Dębica, PCC Intermodal operates a network of scheduled services of container block trains running through several international transport corridors that link Germany and the Benelux countries with Poland and other economic zones in Eastern Europe.
Transporting all sorts of cargo, these regular, daily block train services offer customers of PCC Intermodal the fl ex-ibility of being able to book a container place in the same way that passengers reserve their seats on the public rail-ways. At our handling terminals, the containers are quickly
Our Logistics segment offers a smart combination of international container transport on road and rail. This intermodal form of haulage is exceptionally sustainable. Through the use of goods trains on long-distance railway routes, CO2 emissions are kept to about a third of what they would be. At the same time, the number of heavy trucks driving on the motorways is reduced, rendering our highways safer.
loaded from our wagons to trucks with the aid of heavy-duty gantry cranes or the more fl exible reach-stackers. Road transport is thus only performed for the so-called “last mile”, the fi nal short distance to the destination – precisely that part of the journey for which the ecologically more sustainable rail form of transport is unsuitable. The advantages of both modes of conveyance are thus opti-mally combined. Customers profi t from a tailored and fl exible logistics service, while we are able to meet our responsibility with respect to climate protection and intelligent resource utilisation, as illustrated by the fact that, last year, PCC Inter-modal provided 4,500 train services across all its routes. This resulted in emissions of around 55,000 metric tons of CO2. If the same cargo had been carried in trucks instead, the CO2 emission levels would have been almost three times as high – or more than 155,000 metric tons. The total savings each year are therefore around 100,000 metric tons of CO2 emissions.
power plants in Macedonia with a cash award that reduced the € 6 million loan taken out with the EBRD by around € 670,000. And for another power plant, we received an additional award of around € 160,000 in May 2015.
We are also committed to sustainability with respect to our conventional energy generating plants. In 2008, we commis-sioned our co-generation plant EC-3, a modern CHP (com-bined heat and power) facility at our biggest production site, that of Brzeg Dolny, in Poland’s Lower Silesia region.
This CHP plant not only supplies the production facilities of, in particular, the chemicals companies PCC Rokita SA and PCC Exol SA, it also serves many people in the small town of
Brzeg Dolny which has no power plant of its own. Indeed, this cogeneration unit supplies almost 80 % of the house-holds with heat produced under environmentally compatible conditions. In many towns in Poland, homes are still heated predominantly with coal. The pollutants and greenhouse gas emissions produced as a result are avoided in Brzeg Dolny. In order to further improve the air quality in the locality, PCC Rokita began in 2015 to install state-of-the-art elec-trostatic precipitators in its CHP plant as a means to reduc-ing dust emission. Although lower EU limits do not come into force until 2020 because of a national transition plan, PCC Rokita has, as a result, already cut its dust concentration from 50 to 20 milligrams per cubic metre, thus falling even further below the current limit of 100 mg/m3.
PCC Group Δ Annual Report 2015 Δ Sustainability at PCC
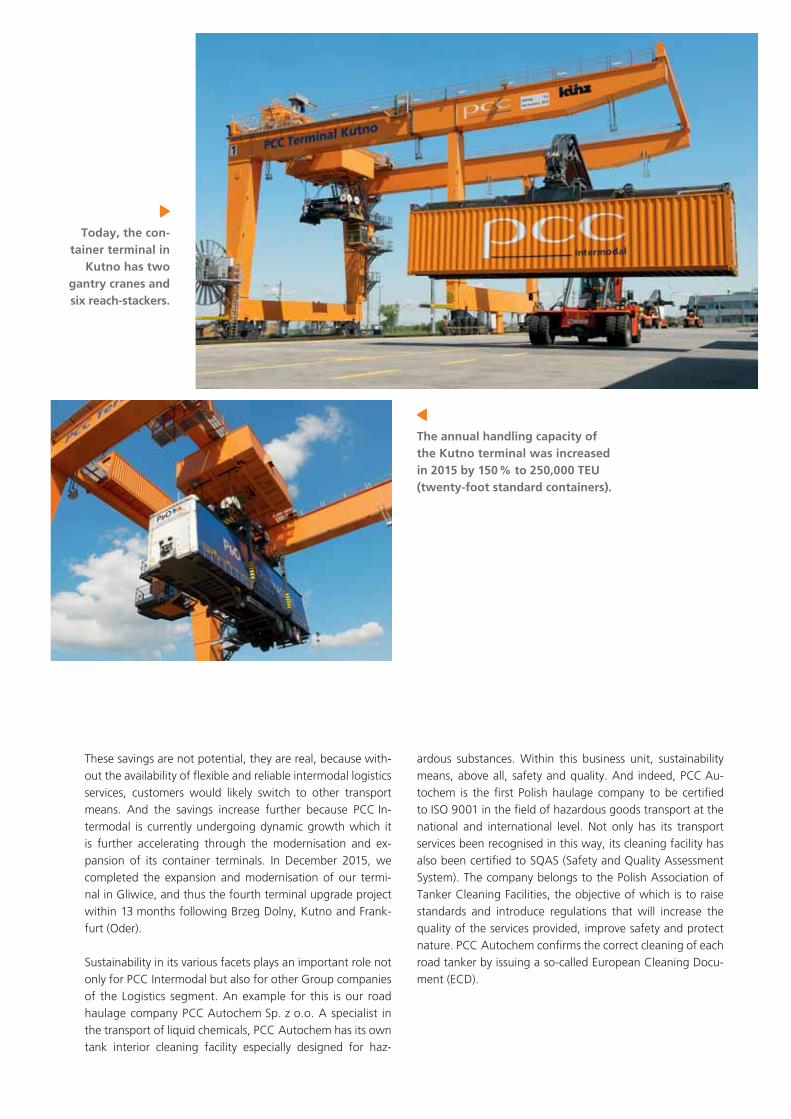
These savings are not potential, they are real, because with-out the availability of fl exible and reliable intermodal logistics services, customers would likely switch to other transport means. And the savings increase further because PCC In-termodal is currently undergoing dynamic growth which it is further accelerating through the modernisation and ex-pansion of its container terminals. In December 2015, we completed the expansion and modernisation of our termi-nal in Gliwice, and thus the fourth terminal upgrade project within 13 months following Brzeg Dolny, Kutno and Frank-furt (Oder).
Sustainability in its various facets plays an important role not only for PCC Intermodal but also for other Group companies of the Logistics segment. An example for this is our road haulage company PCC Autochem Sp. z o.o. A specialist in the transport of liquid chemicals, PCC Autochem has its own tank interior cleaning facility especially designed for haz-
ardous substances. Within this business unit, sustainability means, above all, safety and quality. And indeed, PCC Au-tochem is the fi rst Polish haulage company to be certifi ed to ISO 9001 in the fi eld of hazardous goods transport at the national and international level. Not only has its transport services been recognised in this way, its cleaning facility has also been certifi ed to SQAS (Safety and Quality Assessment System). The company belongs to the Polish Association of Tanker Cleaning Facilities, the objective of which is to raise standards and introduce regulations that will increase the quality of the services provided, improve safety and protect nature. PCC Autochem confi rms the correct cleaning of each road tanker by issuing a so-called European Cleaning Docu-ment (ECD).
The annual handling capacity of the Kutno terminal was increased in 2015 by 150 % to 250,000 TEU (twenty-foot standard containers).
Today, the con-tainer terminal in
Kutno has two gantry cranes and six reach-stackers.

44
PROJECTS: SUSTAINABLE SILICON METAL PRODUCTION IN ICELAND
The construction of an ultra-modern production plant for silicon metal in Iceland is an excellent example of sustainable innovation: it is to be powered entirely from renewable energy sources, the emissions will be reduced to a minimum, the entire regional economy is being boosted through the creation of new jobs, and the long-term relationship with our fi nancing partners also refl ects an important aspect of sustainability.
Húsavík, a harbour town in the north of Iceland, and its en-virons are well known for their natural beauty – whales are often spotted in the waters offshore, the birdlife is charac-terised by an enormous variety of species, and geologically the area is famed for its many hot geysers and the almost magical air they impart to the landscape. So to choose such a location for the construction of a production plant for silicon metal with an annual capacity of 32,000 metric tons may, at fi rst sight, not appear to be particularly environmentally friendly. And the fact that we are extracting the feedstock for our plant from the PCC-owned quartzite quarry in Poland may also appear to be economically risky, given that the two locations are 2,500 kilometres apart as the crow fl ies. How-ever, the converse is true.
For there is hardly a land better suited to the environmentally compatible operation of a silicon metal production plant than Iceland. In terms of sustainability, the project is of model character. The facility, the construction site of which we inaugurated in September 2015 in a ceremony attended by members of the Icelandic government and high-ranking rep-resentatives of trade and industry, is to be one of the world’s most advanced of its kind. On completion, which is envisaged by the beginning of 2018, it will be able to meet the highest sustainability standards in all the essential aspects – ecologi-cally, socially and economically. This project is sustainable in relation to all its stakeholders: from investors, employees and residents to the customers purchasing the product.
The manufacture of silicon metal is energy-intensive. This is a critical cost factor, which means that the availability of inexpensive electricity, ideally produced in the most sustain-able way possible, is essential. Iceland as a production site is unique in the world in this regard due to the wealth of regenerative energy sources that it offers. Power production can be achieved here entirely through renewable energy sources, ensuring that there are absolutely no emissions aris-ing from the electricity generating process. The power pro-duced is not only particularly clean but also inexpensive – an aspect that has been guaranteed over the long term. Added to this, only 20 to 50 kilometres from Húsavík is located a large geothermal area with potential for up to 400 MW in new power generating capacity. A further power plant with
a rated output of 90 MW, which is being built by others in Iceland, will provide the silicon plant with electricity beyond the usual grid source. This means that the power supplied will be cheap even by Icelandic standards. These conditions have been secured for 15 years and there is an extension option.
The logistical disadvantage of supplying the quartzite raw material from our quarry in Poland is outweighed by far by the low cost of the clean electricity produced in Iceland. In addition, the logistical chain involving the long land distances will be restricted to rail transport with block trains bringing the bulk cargo to the port of Szczecin. From the harbour in Húsavík, it will be transported on road by so-called trailer trains to the production plant nearby. And then the reverse journey involving the silicon metal end product will follow the same route to our customers.
Highly effi cient core components, and in particular the 3 metre high smelting furnaces, each with a diameter of 7 metres, ensure the environmentally friendly operation of the production plant and avoidance of emissions. The dis-charge of fi ne dust will be minimised by an advanced sys-tem serving the entire plant designed to ensure that the vast majority of the fi ne dust is precipitated out and collected in a fi lter house. The complex is being built on a turnkey basis by plant constructor SMS group GmbH, Düsseldorf (Germany), the world market leader in this fi eld. Our joint objective is to make our plant one of the most effi cient and advanced in the world. As part of this remit, the commitment to environ-mental protection and sustainability in the plant design has gone as far as to ensure that the buildings are arranged so that they blend to optimum effect within the landscape and are invisible from, for example, Húsavík.
The region around Húsavík is particularly dependent on tour-ism, that is to say the attraction of its natural beauty and landscape. The high acceptance of the PCC project by the local population also derives from the fact that our plant will not jeopardise this source of income. Above all, however, the silicon metal plant is creating new economic opportunities for the people in the region whose traditional industries such as fi shing and agriculture have lost ground compared to ear-
PCC Group Δ Annual Report 2015 Δ Sustainability at PCC
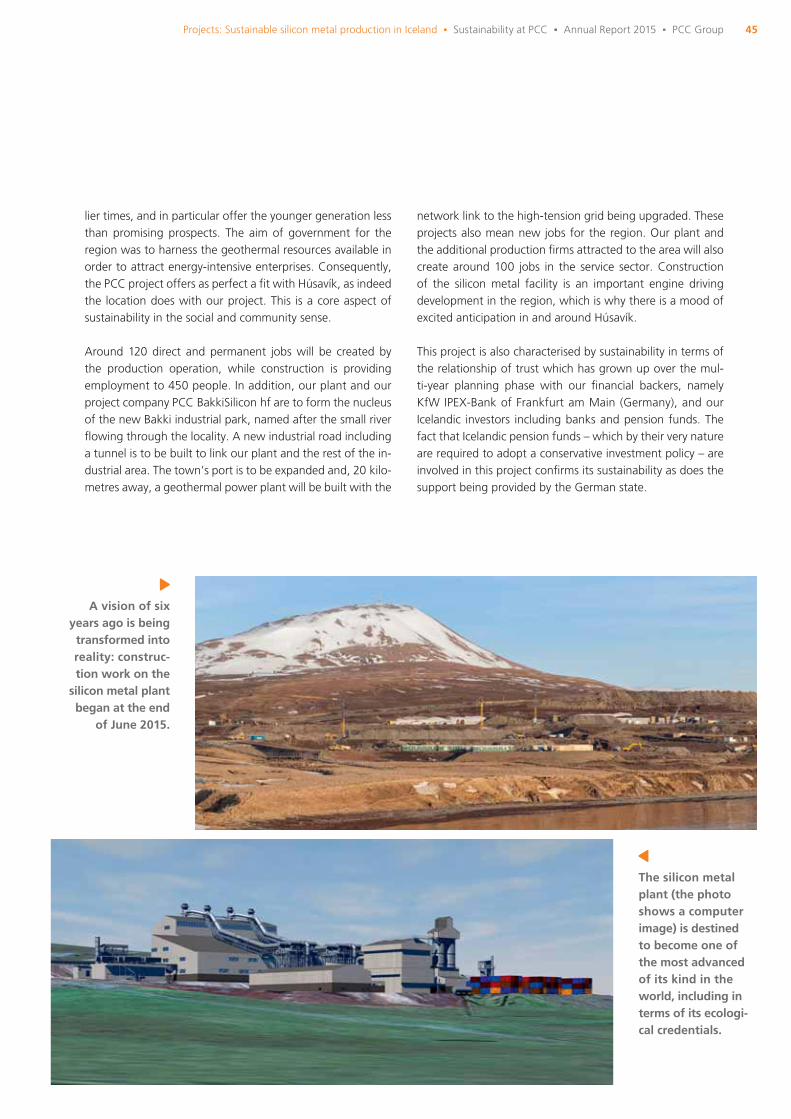
45
A vision of six years ago is being
transformed into reality: construc-tion work on the
silicon metal plant began at the end
of June 2015.
The silicon metal plant (the photo shows a computer image) is destined to become one of the most advanced of its kind in the world, including in terms of its ecologi-cal credentials.
lier times, and in particular offer the younger generation less than promising prospects. The aim of government for the region was to harness the geothermal resources available in order to attract energy-intensive enterprises. Consequently, the PCC project offers as perfect a fi t with Húsavík, as indeed the location does with our project. This is a core aspect of sustainability in the social and community sense.
Around 120 direct and permanent jobs will be created by the production operation, while construction is providing employment to 450 people. In addition, our plant and our project company PCC BakkiSilicon hf are to form the nucleus of the new Bakki industrial park, named after the small river fl owing through the locality. A new industrial road including a tunnel is to be built to link our plant and the rest of the in-dustrial area. The town’s port is to be expanded and, 20 kilo-metres away, a geothermal power plant will be built with the
network link to the high-tension grid being upgraded. These projects also mean new jobs for the region. Our plant and the additional production fi rms attracted to the area will also create around 100 jobs in the service sector. Construction of the silicon metal facility is an important engine driving development in the region, which is why there is a mood of excited anticipation in and around Húsavík.
This project is also characterised by sustainability in terms of the relationship of trust which has grown up over the mul-ti-year planning phase with our fi nancial backers, namely KfW IPEX-Bank of Frankfurt am Main (Germany), and our Icelandic investors including banks and pension funds. The fact that Icelandic pension funds – which by their very nature are required to adopt a conservative investment policy – are involved in this project confi rms its sustainability as does the support being provided by the German state.
Projects: Sustainable silicon metal production in Iceland Δ Sustainability at PCC Δ Annual Report 2015 Δ PCC Group
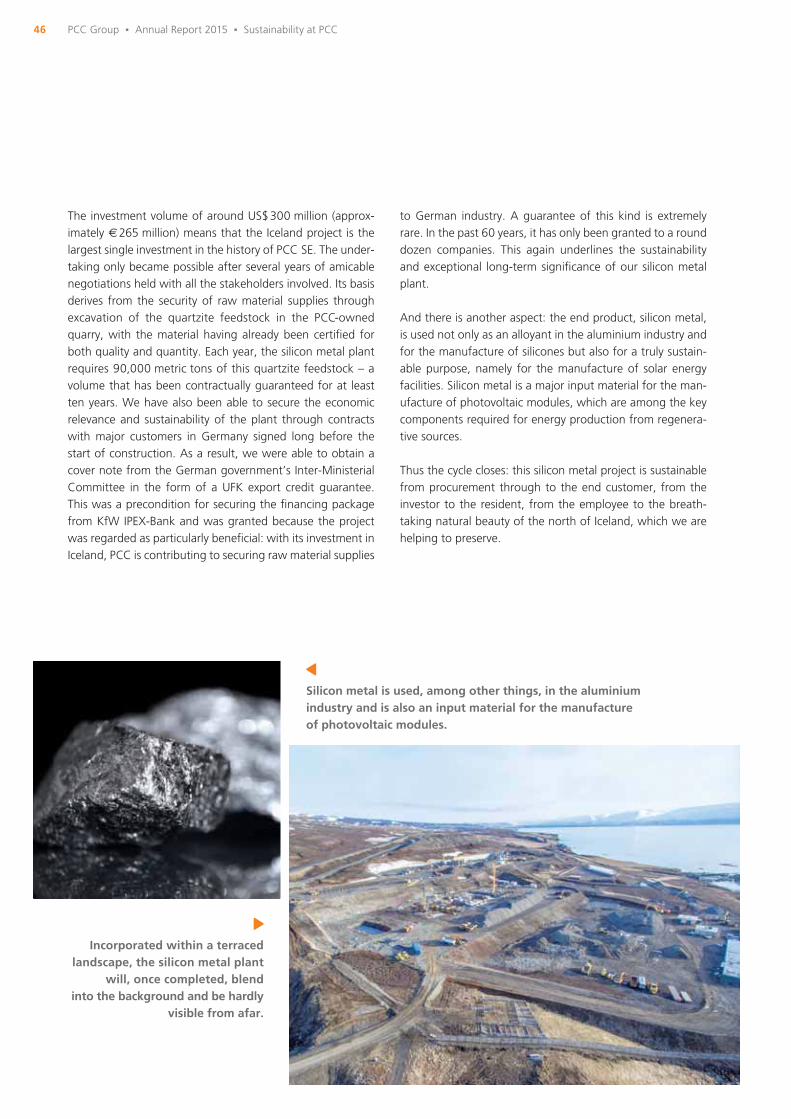
46
The investment volume of around US$ 300 million (approx-imately € 265 million) means that the Iceland project is the largest single investment in the history of PCC SE. The under-taking only became possible after several years of amicable negotiations held with all the stakeholders involved. Its basis derives from the security of raw material supplies through excavation of the quartzite feedstock in the PCC-owned quarry, with the material having already been certifi ed for both quality and quantity. Each year, the silicon metal plant requires 90,000 metric tons of this quartzite feedstock – a volume that has been contractually guaranteed for at least ten years. We have also been able to secure the economic relevance and sustainability of the plant through contracts with major customers in Germany signed long before the start of construction. As a result, we were able to obtain a cover note from the German government’s Inter-Ministerial Committee in the form of a UFK export credit guarantee. This was a precondition for securing the fi nancing package from KfW IPEX-Bank and was granted because the project was regarded as particularly benefi cial: with its investment in Iceland, PCC is contributing to securing raw material supplies
to German industry. A guarantee of this kind is extremely rare. In the past 60 years, it has only been granted to a round dozen companies. This again underlines the sustainability and exceptional long-term signifi cance of our silicon metal plant.
And there is another aspect: the end product, silicon metal, is used not only as an alloyant in the aluminium industry and for the manufacture of silicones but also for a truly sustain-able purpose, namely for the manufacture of solar energy facilities. Silicon metal is a major input material for the man-ufacture of photovoltaic modules, which are among the key components required for energy production from regenera-tive sources.
Thus the cycle closes: this silicon metal project is sustainable from procurement through to the end customer, from the investor to the resident, from the employee to the breath-taking natural beauty of the north of Iceland, which we are helping to preserve.
Incorporated within a terraced landscape, the silicon metal plant
will, once completed, blend into the background and be hardly
visible from afar.
Silicon metal is used, among other things, in the aluminium industry and is also an input material for the manufacture of photovoltaic modules.
PCC Group Δ Annual Report 2015 Δ Sustainability at PCC
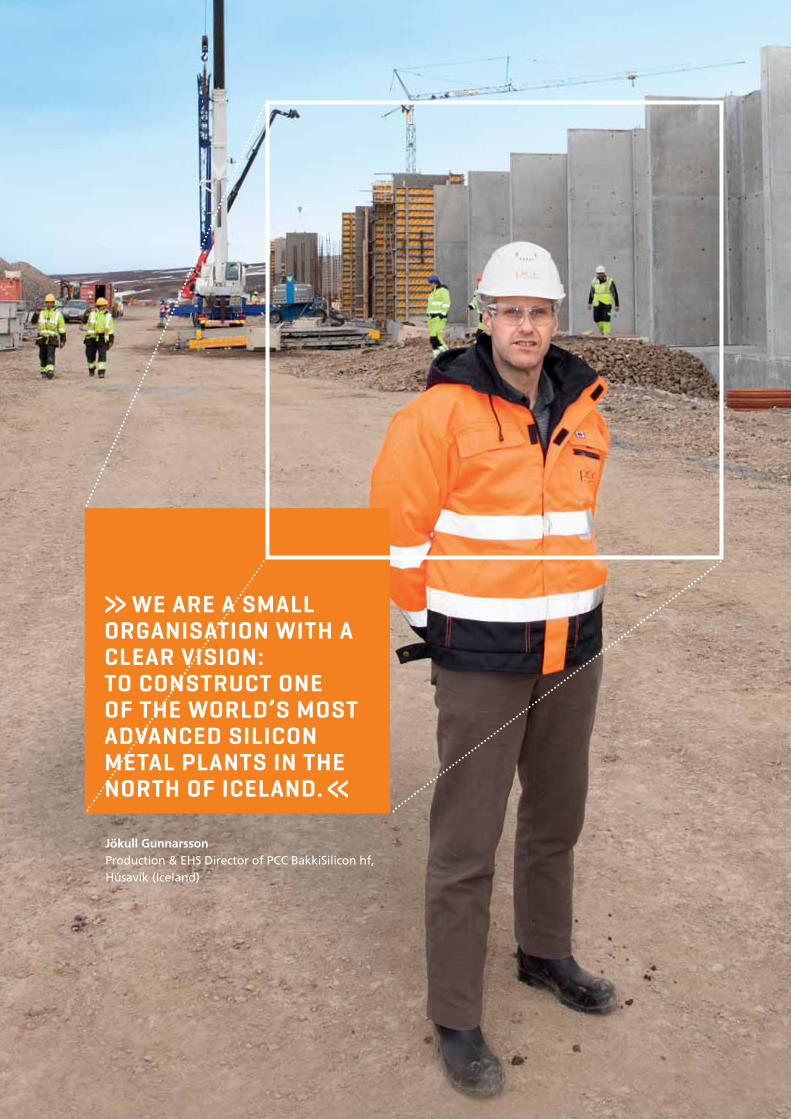
47Nachhaltigkeit bei der PCC Δ Philosophie und Strategie Δ Geschäftsbericht 2015 Δ PCC SE
Jökull GunnarssonProduction & EHS Director of PCC BakkiSilicon hf, Húsavík (Iceland)
»WE ARE A SMALL ORGANISATION WITH A CLEAR VISION: TO CONSTRUCT ONE OF THE WORLD’S MOST ADVANCED SILICON METAL PLANTS IN THE NORTH OF ICELAND.«
48
RISK MANAGEMENT
The engine driving our sustainable growth is fuelled by our commitment to grasp market opportu-nities as they arise. However, this approach is not without its risks, which can have negative effects on our business development and also our stakeholders. Consequently, risk management is a cen-tral component of a robust sustainability strategy.
The Group risk management system adopted by PCC SE, en-compassing the recognition, collation and control of risks, is of central importance to the sustainable development of the PCC Group. Taking no risks inevitably leads to standstill and stagnation. Consequently, for a group of companies such as the PCC organisation aligned to dynamic and sustainable growth, the complete elimination of all risks is not an option. Our focus therefore is on the management of entrepreneur-ial, ecological and social risks based on their earliest possible identifi cation, categorisation according to threat and urgen-cy, and the introduction of specifi c countermeasures in order to limit and mitigate them – that is to say to actively control them rather than being controlled by them. Thus, risk man-agement contributes to the continuous optimisation of our corporate management capability while also creating an in-novation-friendly environment.
Structured as a multi-stage procedure, our Group risk man-agement system serves to establish exposure levels and op-timisation potential, at the same time promoting entrepre-neurship within the Group. As part of this process, the Risk Management team assesses the opportunities and threats, gauges these against the short- and medium-term targets defi ned by the Administrative Board, and checks the result-ant analyses for relevance, consistency and accuracy. Deci-sions are made on this basis pertaining to possible optimi-sation measures. The risk assessment exercise is performed annually and supplemented as required by quarterly updates and interim reporting activities. It is also ensured that the Managing Directors and the Administrative Board remain informed of all major risks. Risk Management is, moreover, tasked with informing employees, motivating them and pro-viding them with necessary further training in all aspects of relevance.
While conscious of the constant need to monitor and analyse business risks, PCC SE applies the same watching brief to all areas and activities that may give rise to impairment of the environment and the ineffi cient utilisation of resources.
These areas include:
∂ Raw material consumption related to product manufactured
∂ Handling and transportation of hazardous substances
∂ Energy consumption and water usage
∂ Wastewater contamination
∂ Emission of air pollutants
∂ Waste for disposal
∂ Noise
∂ Hazardous sites and soil contamination
∂ Accidents and incidents
∂ Potential environmental aspects arising from planned activities
PCC also gives careful consideration to information or com-plaints from all stakeholders, particularly local residents. The local group companies are responsible for conducting this dialogue with their immediate stakeholders, while Group-wide risk management is the responsibility of the holding company PCC SE.
PCC Group Δ Annual Report 2015 Δ Sustainability at PCC

49
Beata GruśMarketing & Sustainable Development Manager of PCC Exol SA, Brzeg Dolny (Poland)
»OUR SUCCESS DERIVES FROM ALWAYS BEING ON THE LOOKOUT FOR NEW KNOWLEDGE AND OUR DETERMINATION TO MEET WHATEVER CHALLENGE COMES OUR WAY.«
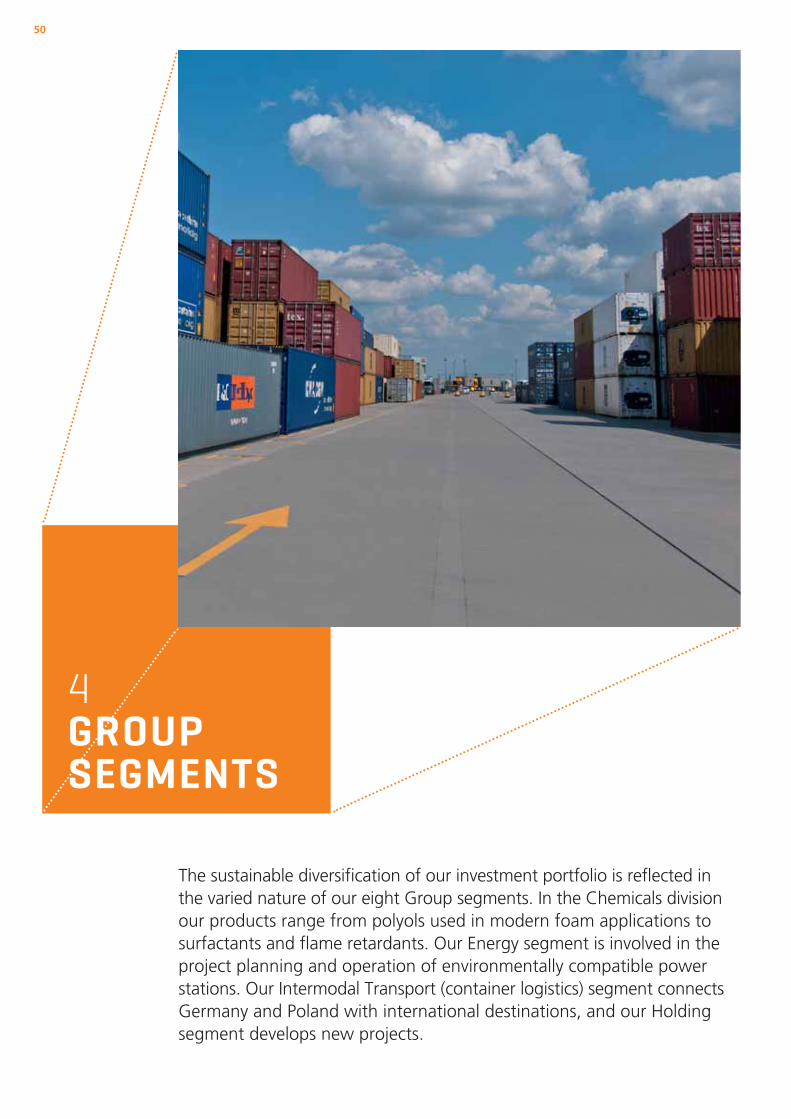
50
4 GROUPSEGMENTS
The sustainable diversifi cation of our investment portfolio is refl ected inthe varied nature of our eight Group segments. In the Chemicals division our products range from polyols used in modern foam applications to surfactants and fl ame retardants. Our Energy segment is involved in the project planning and operation of environmentally compatible power stations. Our Intermodal Transport (container logistics) segment connects Germany and Poland with international destinations, and our Holding segment develops new projects.

51Group segments Δ Annual Report 2015 Δ PCC Group
Our product portfolio includes surfactants used, for instance, as feedstock in cleaning agents and laundry detergents, polyols for the manufacture of comfortable mattresses, environment-ally friendly small hydropower plants, international container logistics and future projects in the Holding/Projects segment.
The eight segments as a whole achieved consolidated sales in fi scal 2015 of € 571.1 million. As in previous years, the big-gest share of this revenue, 86.9 %, was generated in our fi ve Chemicals segments: Polyols (23.9 %), Surfactants (17.7 %), Chlorine (10.2 %), Speciality Chemicals (28.3 %) and Con-sumer Products (6.8 %). The Logistics segment contributed 9.9 %, the Energy segment 2.0 % and the Holding/Projects segment 1.2 % to Group sales.
Our EBITDA totalled € 50.8 million with the biggest contri-bution coming from the Polyols segment, followed by the Surfactants and Chlorine segments.
The primary sales markets of the PCC Group remain Germany and Poland. Because of our strong position in the chemicals in-dustry and the logistics sector, Poland continues to be our most important national market. PCC is a market leader there and also in parts of Central and Eastern Europe with sales covering a wide range of products from the Polyols, Chlorine, Surfactants and Speciality Chemicals segments. Our main production site is
located in the Lower Silesia region in the south-west of Poland. The chemicals plant of PCC Rokita SA in Brzeg Dolny, about 40 kilometres north-west of Wrocław (Breslau), is one of the leading facilities of its kind in the country.
There we mainly produce polyether polyols, which are the feedstock for polyurethane foams used in the manufacture, for example, of mattresses, furniture upholstery, car seats, impact-cushioning shoe soles and even fl oor coverings for sports facilities. PCC Rokita is Poland’s only manufacturer of these speciality polyols. Its portfolio also includes chlorine and downstream chlorine products.
We likewise hold a unique position in Poland with our Sur-factants segment. These surface-active agents are indis-pensable components of, for example, shampoos, cleaning products and laundry detergents. They are produced by PCC Exol SA in Brzeg Dolny and Płock (Poland).
In Speciality Chemicals, the largest of our eight segments, we pursue our original core business, commodities trading. PCC Rokita’s Phosphorus and Naphthalene Derivatives businessunit is also part of this segment. In addition, PCC Synteza S.A. in Kędzierzyn-Koźle near Gliwice (Poland) manufactures nonylphenol and dodecylphenol. Our quartzite quarry in Zagórze (Poland) is also allocated to this segment.
THE SEGMENTS OF THE PCC GROUP
THE SEGMENTS OF THE PCC GROUPPolyolsSurfactantsChlorineSpeciality ChemicalsConsumer ProductsEnergyLogisticsHolding/Projects
PCC GROUP SITES
THE STRUCTURE OF THE PCC GROUP
51545860626668 7276
78
80
The portfolio of our affi liate companies and their products and applications are spread across differ-ent segments. With this diversity, interlinked with internal synergies combining chemicals, energy and logistics, we are constantly creating new enterprise value.
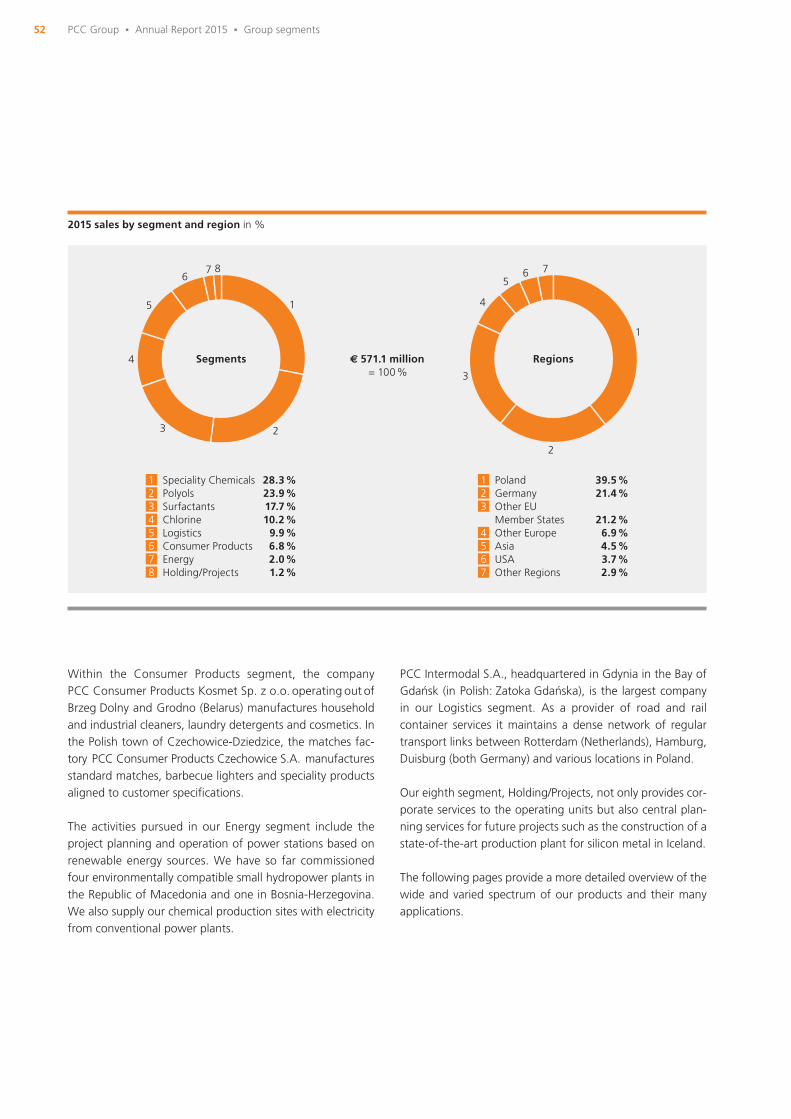
52 PCC Group Δ Annual Report 2015 Δ Group segments
Within the Consumer Products segment, the company PCC Consumer Products Kosmet Sp. z o.o. operating out of Brzeg Dolny and Grodno (Belarus) manufactures household and industrial cleaners, laundry detergents and cosmetics. In the Polish town of Czechowice-Dziedzice, the matches fac-tory PCC Consumer Products Czechowice S.A. manufacturesstandard matches, barbecue lighters and speciality products aligned to customer specifi cations.
The activities pursued in our Energy segment include the project planning and operation of power stations based on renewable energy sources. We have so far commissioned four environmentally compatible small hydropower plants in the Republic of Macedonia and one in Bosnia-Herzegovina. We also supply our chemical production sites with electricity from conventional power plants.
PCC Intermodal S.A., headquartered in Gdynia in the Bay of Gdańsk (in Polish: Zatoka Gdańska), is the largest company in our Logistics segment. As a provider of road and rail container services it maintains a dense network of regular transport links between Rotterdam (Netherlands), Hamburg, Duisburg (both Germany) and various locations in Poland.
Our eighth segment, Holding/Projects, not only provides cor-porate services to the operating units but also central plan-ning services for future projects such as the construction of a state-of-the-art production plant for silicon metal in Iceland.
The following pages provide a more detailed overview of the wide and varied spectrum of our products and their many applications.
2015 sales by segment and region in %
5
1
678
234
Speciality Chemicals 28.3 %Polyols 23.9 %Surfactants 17.7 %Chlorine 10.2 %Logistics 9.9 %Consumer Products 6.8 %Energy 2.0 %Holding/Projects 1.2 %
€ 571.1 million = 100 %
4
1
5
23
Poland 39.5 %Germany 21.4 %Other EUMember States 21.2 %Other Europe 6.9 %Asia 4.5 %USA 3.7 %Other Regions 2.9 %
67
8
5
6
1
2
7
3
4 Segments
5
1
2
3
4
6 7
Regions
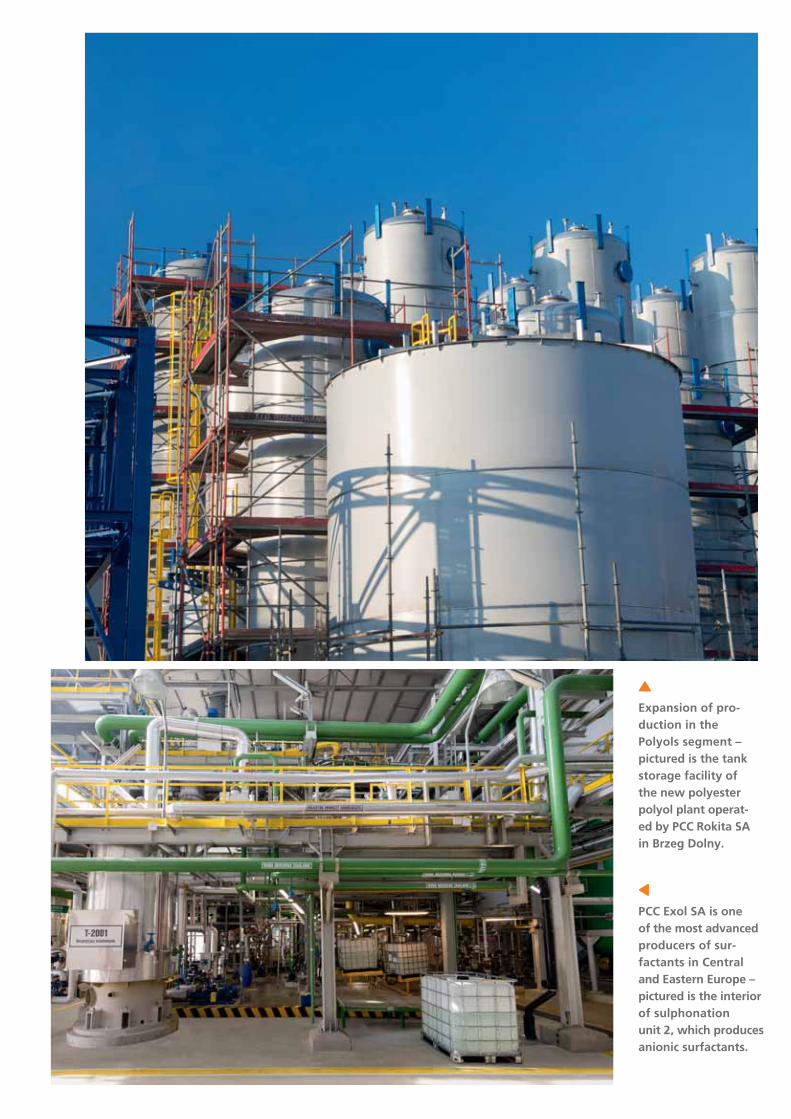
PCC Exol SA is one of the most advanced producers of sur-factants in Central and Eastern Europe – pictured is the interior of sulphonation unit 2, which produces anionic surfactants.
Expansion of pro-duction in the Polyols segment – pictured is the tank storage facility of the new polyester polyol plant operat-ed by PCC Rokita SA in Brzeg Dolny.
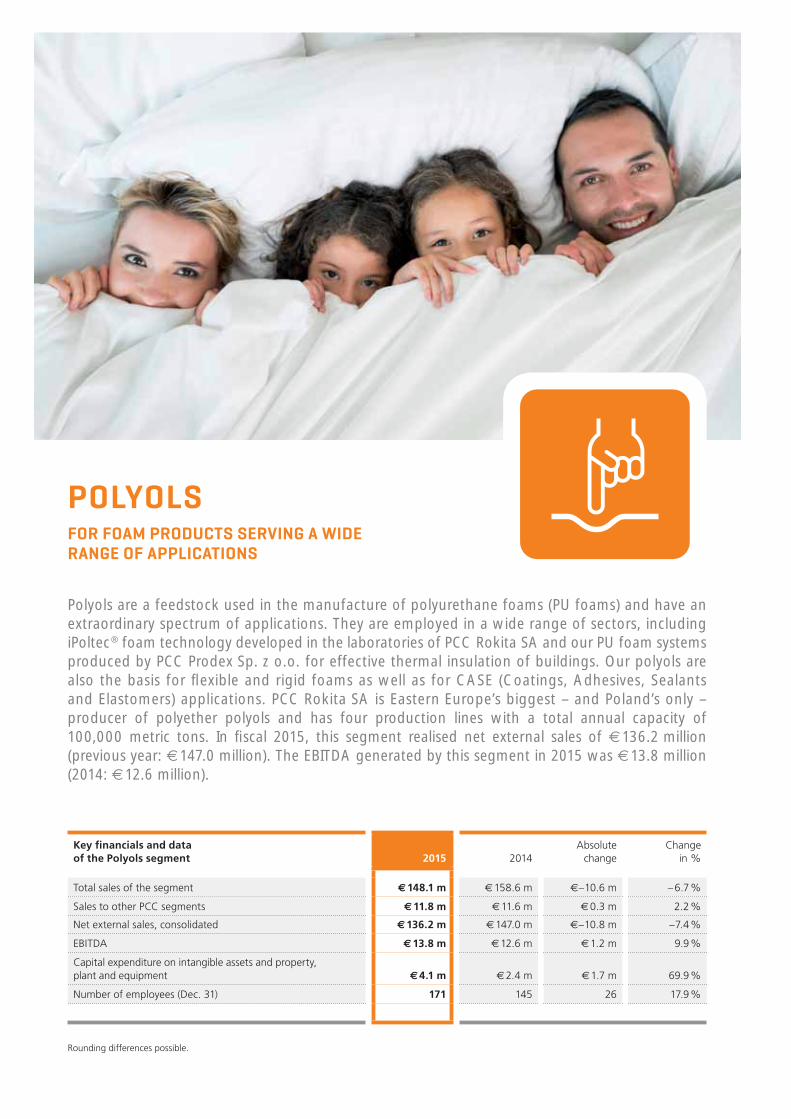
POLYOLSFOR FOAM PRODUCTS SERVING A WIDE RANGE OF APPLICATIONS
Polyols are a feedstock used in the manufacture of polyurethane foams (PU foams) and have an extraordinary spectrum of applications. They are employed in a wide range of sectors, including iPoltec® foam technology developed in the laboratories of PCC Rokita SA and our PU foam systems produced by PCC Prodex Sp. z o.o. for effective thermal insulation of buildings. Our polyols are also the basis for fl exible and rigid foams as well as for CASE (Coatings, Adhesives, Sealants and Elastomers) applications. PCC Rokita SA is Eastern Europe’s biggest – and Poland’s only – producer of polyether polyols and has four production lines with a total annual capacity of 100,000 metric tons. In fi scal 2015, this segment realised net external sales of € 136.2 million (previous year: € 147.0 million). The EBITDA generated by this segment in 2015 was € 13.8 million (2014: € 12.6 million).
Key fi nancials and data of the Polyols segment 2015 2014
Absolute change
Change in %
Total sales of the segment € 148.1 m € 158.6 m €– 10.6 m – 6.7 %
Sales to other PCC segments € 11.8 m € 11.6 m € 0.3 m 2.2 %
Net external sales, consolidated € 136.2 m € 147.0 m €– 10.8 m – 7.4 %
EBITDA € 13.8 m € 12.6 m € 1.2 m 9.9 %
Capital expenditure on intangible assets and property, plant and equipment € 4.1 m € 2.4 m € 1.7 m 69.9 %
Number of employees (Dec. 31) 171 145 26 17.9 %
Rounding differences possible.
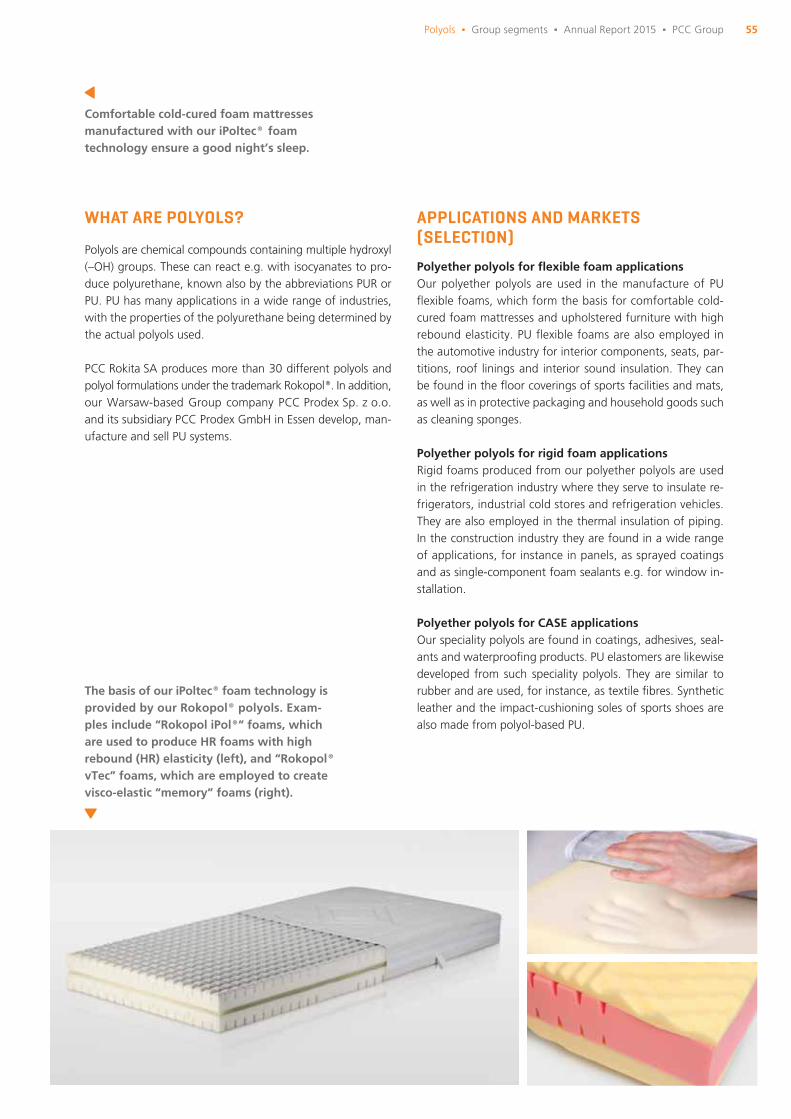
55Polyols Δ Group segments Δ Annual Report 2015 Δ PCC Group
WHAT ARE POLYOLS?
Polyols are chemical compounds containing multiple hydroxyl (–OH) groups. These can react e.g. with isocyanates to pro-duce polyurethane, known also by the abbreviations PUR or PU. PU has many applications in a wide range of industries, with the properties of the polyurethane being determined by the actual polyols used.
PCC Rokita SA produces more than 30 different polyols and polyol formulations under the trademark Rokopol®. In addition, our Warsaw-based Group company PCC Prodex Sp. z o.o. and its subsidiary PCC Prodex GmbH in Essen develop, man-ufacture and sell PU systems.
APPLICATIONS AND MARKETS (SELECTION)
Polyether polyols for fl exible foam applicationsOur polyether polyols are used in the manufacture of PU fl exible foams, which form the basis for comfortable cold-cured foam mattresses and upholstered furniture with high rebound elasticity. PU fl exible foams are also employed in the automotive industry for interior components, seats, par-titions, roof linings and interior sound insulation. They can be found in the fl oor coverings of sports facilities and mats, as well as in protective packaging and household goods such as cleaning sponges.
Polyether polyols for rigid foam applicationsRigid foams produced from our polyether polyols are used in the refrigeration industry where they serve to insulate re-frigerators, industrial cold stores and refrigeration vehicles. They are also employed in the thermal insulation of piping. In the construction industry they are found in a wide range of applications, for instance in panels, as sprayed coatings and as single-component foam sealants e.g. for window in-stallation.
Polyether polyols for CASE applicationsOur speciality polyols are found in coatings, adhesives, seal-ants and waterproofi ng products. PU elastomers are likewise developed from such speciality polyols. They are similar to rubber and are used, for instance, as textile fi bres. Synthetic leather and the impact-cushioning soles of sports shoes are also made from polyol-based PU.
The basis of our iPoltec® foam technology is provided by our Rokopol® polyols. Exam-ples include “Rokopol iPol®“ foams, which are used to produce HR foams with high rebound (HR) elasticity (left), and “Rokopol® vTec” foams, which are employed to create visco-elastic “memory” foams (right).
Comfortable cold-cured foam mattresses manufactured with our iPoltec® foam technology ensure a good night’s sleep.
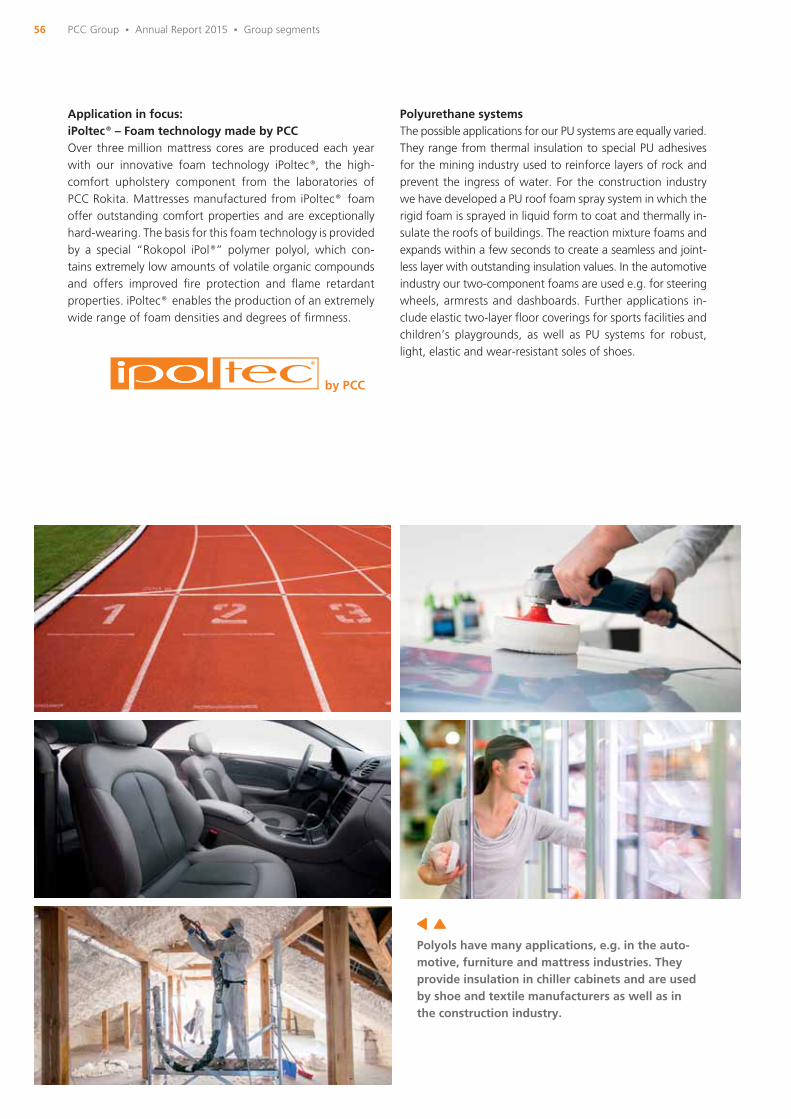
56
Polyurethane systemsThe possible applications for our PU systems are equally varied. They range from thermal insulation to special PU adhesives for the mining industry used to reinforce layers of rock and prevent the ingress of water. For the construction industry we have developed a PU roof foam spray system in which the rigid foam is sprayed in liquid form to coat and thermally in-sulate the roofs of buildings. The reaction mixture foams and expands within a few seconds to create a seamless and joint-less layer with outstanding insulation values. In the automotive industry our two-component foams are used e.g. for steering wheels, armrests and dashboards. Further applications in-clude elastic two-layer fl oor coverings for sports facilities and children’s playgrounds, as well as PU systems for robust, light, elastic and wear-resistant soles of shoes.
by PCC
Application in focus:iPoltec® – Foam technology made by PCCOver three million mattress cores are produced each year with our innovative foam technology iPoltec®, the high-comfort upholstery component from the laboratories of PCC Rokita. Mattresses manufactured from iPoltec® foam offer outstanding comfort properties and are exceptionally hard-wearing. The basis for this foam technology is provided by a special “Rokopol iPol®” polymer polyol, which con-tains extremely low amounts of volatile organic compounds and offers improved fi re protection and fl ame retardant properties. iPoltec® enables the production of an extremely wide range of foam densities and degrees of fi rmness.
Polyols have many applications, e.g. in the auto-motive, furniture and mattress industries. They provide insulation in chiller cabinets and are used by shoe and textile manufacturers as well as in the construction industry.
PCC Group Δ Annual Report 2015 Δ Group segments
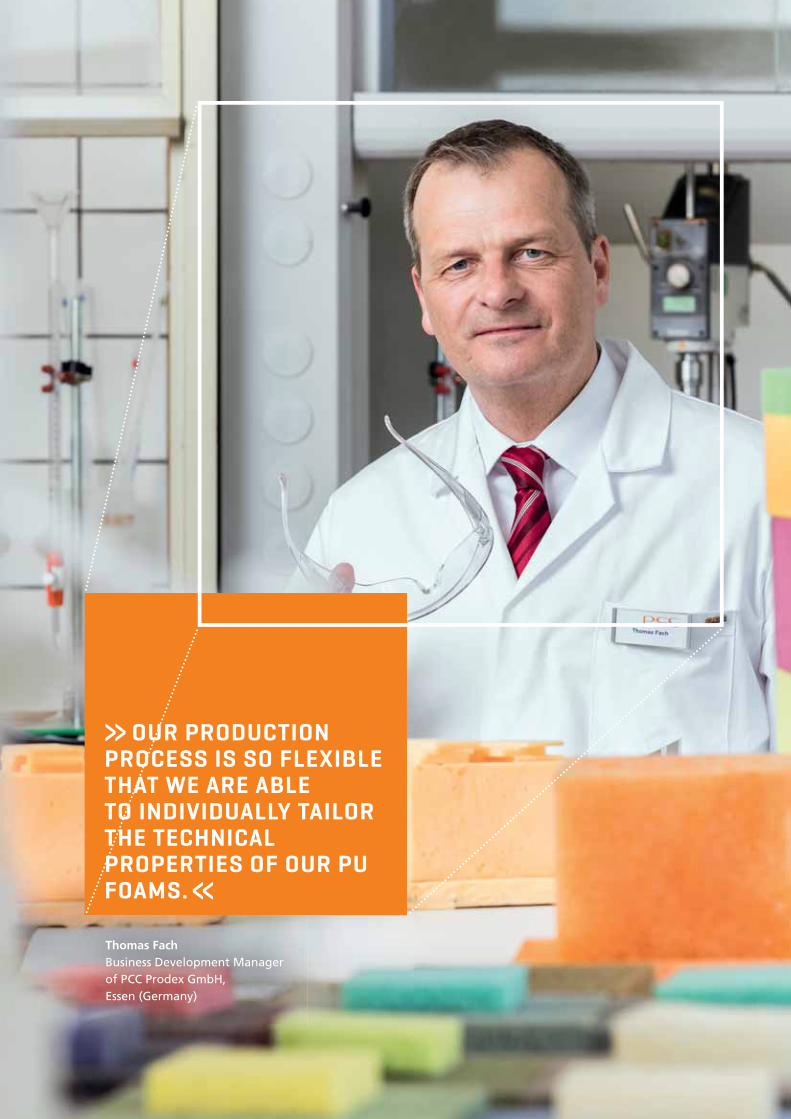
57
Thomas FachBusiness Development Manager of PCC Prodex GmbH, Essen (Germany)
»OUR PRODUCTION PROCESS IS SO FLEXIBLE THAT WE ARE ABLE TO INDIVIDUALLY TAILOR THE TECHNICAL PROPERTIES OF OUR PU FOAMS.«
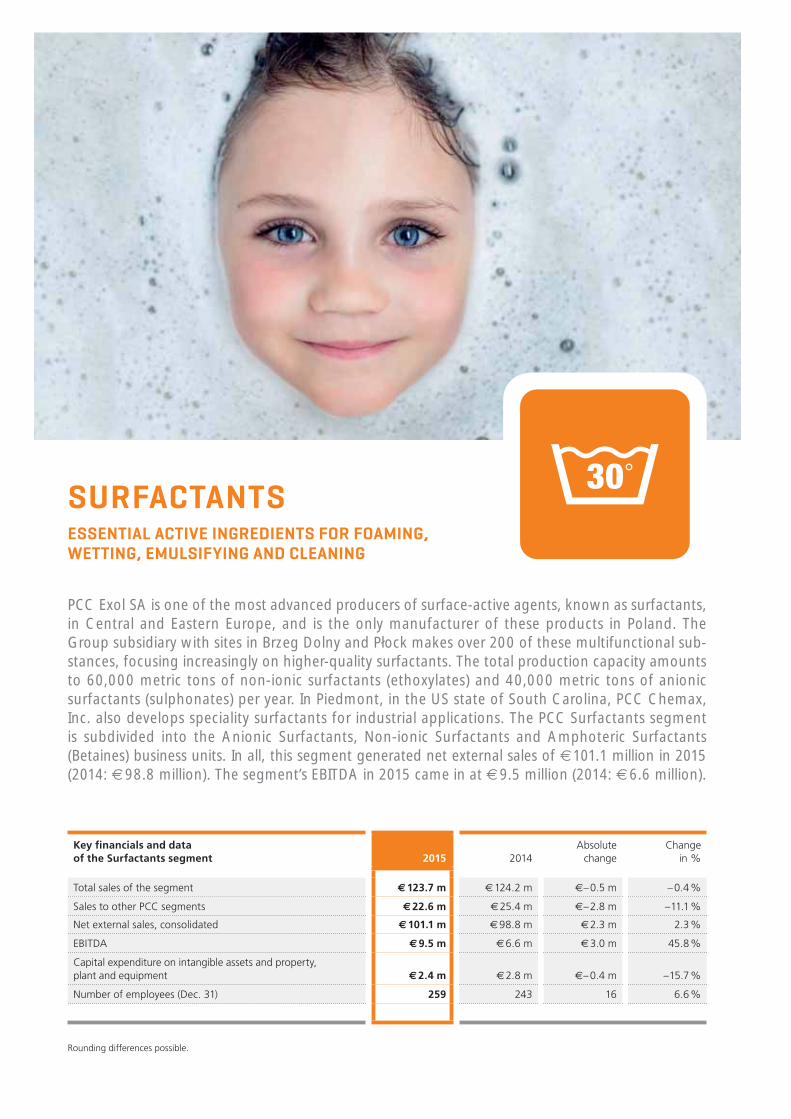
SURFACTANTSESSENTIAL ACTIVE INGREDIENTS FOR FOAMING, WETTING, EMULSIFYING AND CLEANING
PCC Exol SA is one of the most advanced producers of surface-active agents, known as surfactants, in Central and Eastern Europe, and is the only manufacturer of these products in Poland. The Group subsidiary with sites in Brzeg Dolny and Płock makes over 200 of these multifunctional sub-stances, focusing increasingly on higher-quality surfactants. The total production capacity amounts to 60,000 metric tons of non-ionic surfactants (ethoxylates) and 40,000 metric tons of anionic surfactants (sulphonates) per year. In Piedmont, in the US state of South Carolina, PCC Chemax, Inc. also develops speciality surfactants for industrial applications. The PCC Surfactants segment is subdivided into the Anionic Surfactants, Non-ionic Surfactants and Amphoteric Surfactants (Betaines) business units. In all, this segment generated net external sales of € 101.1 million in 2015 (2014: € 98.8 million). The segment’s EBITDA in 2015 came in at € 9.5 million (2014: € 6.6 million).
Key fi nancials and data of the Surfactants segment 2015 2014
Absolute change
Change in %
Total sales of the segment € 123.7 m € 124.2 m €– 0.5 m – 0.4 %
Sales to other PCC segments € 22.6 m € 25.4 m €– 2.8 m – 11.1 %
Net external sales, consolidated € 101.1 m € 98.8 m € 2.3 m 2.3 %
EBITDA € 9.5 m € 6.6 m € 3.0 m 45.8 %
Capital expenditure on intangible assets and property, plant and equipment € 2.4 m € 2.8 m €– 0.4 m – 15.7 %
Number of employees (Dec. 31) 259 243 16 6.6 %
Rounding differences possible.
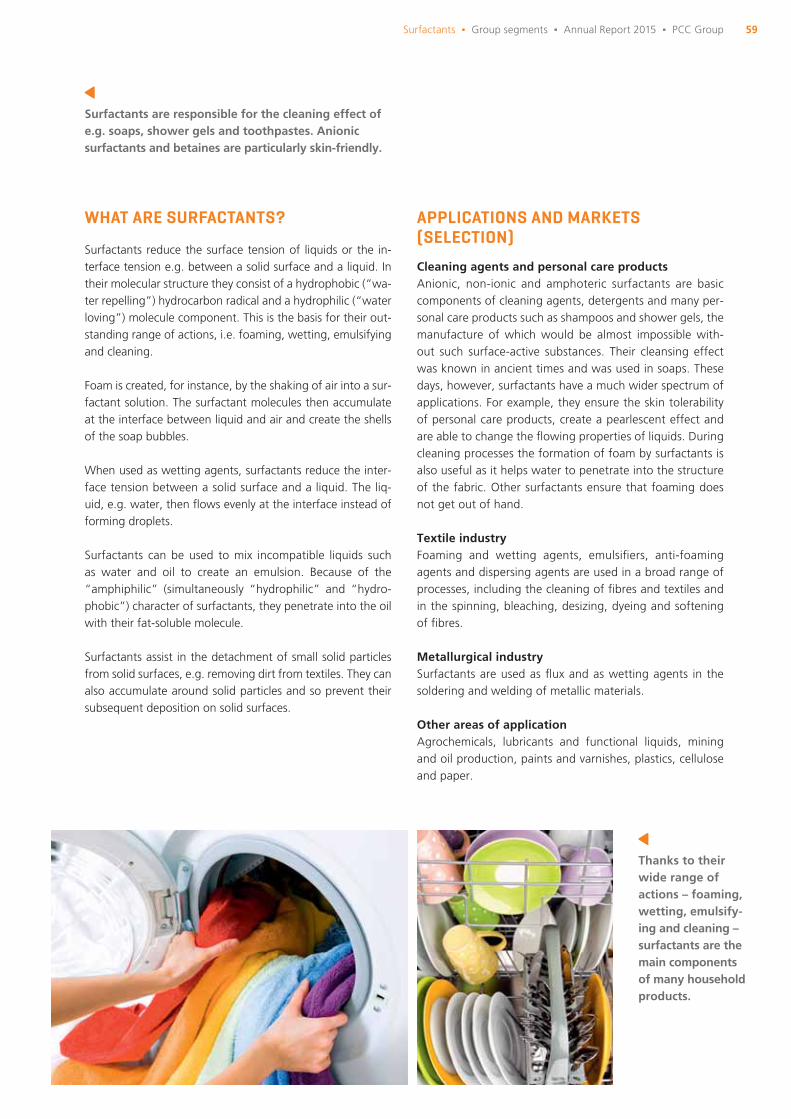
59
WHAT ARE SURFACTANTS?
Surfactants reduce the surface tension of liquids or the in-terface tension e.g. between a solid surface and a liquid. In their molecular structure they consist of a hydrophobic (“wa-ter repelling”) hydrocarbon radical and a hydrophilic (“water loving”) molecule component. This is the basis for their out-standing range of actions, i.e. foaming, wetting, emulsifying and cleaning.
Foam is created, for instance, by the shaking of air into a sur-factant solution. The surfactant molecules then accumulate at the interface between liquid and air and create the shells of the soap bubbles.
When used as wetting agents, surfactants reduce the inter-face tension between a solid surface and a liquid. The liq-uid, e.g. water, then fl ows evenly at the interface instead of forming droplets.
Surfactants can be used to mix incompatible liquids such as water and oil to create an emulsion. Because of the “amphiphilic” (simultaneously “hydrophilic” and “hydro-phobic”) character of surfactants, they penetrate into the oil with their fat-soluble molecule.
Surfactants assist in the detachment of small solid particles from solid surfaces, e.g. removing dirt from textiles. They can also accumulate around solid particles and so prevent their subsequent deposition on solid surfaces.
APPLICATIONS AND MARKETS (SELECTION)
Cleaning agents and personal care productsAnionic, non-ionic and amphoteric surfactants are basic components of cleaning agents, detergents and many per-sonal care products such as shampoos and shower gels, the manufacture of which would be almost impossible with-out such surface-active substances. Their cleansing effect was known in ancient times and was used in soaps. These days, however, surfactants have a much wider spectrum of applications. For example, they ensure the skin tolerability of personal care products, create a pearlescent effect and are able to change the fl owing properties of liquids. During cleaning processes the formation of foam by surfactants is also useful as it helps water to penetrate into the structure of the fabric. Other surfactants ensure that foaming does not get out of hand.
Textile industryFoaming and wetting agents, emulsifi ers, anti-foaming agents and dispersing agents are used in a broad range of processes, including the cleaning of fi bres and textiles and in the spinning, bleaching, desizing, dyeing and softening of fi bres.
Metallurgical industrySurfactants are used as fl ux and as wetting agents in the soldering and welding of metallic materials.
Other areas of application Agrochemicals, lubricants and functional liquids, mining and oil production, paints and varnishes, plastics, cellulose and paper.
Thanks to their wide range of actions – foaming, wetting, emulsify-ing and cleaning – surfactants are the main components of many household products.
Surfactants are responsible for the cleaning effect of e.g. soaps, shower gels and toothpastes. Anionic surfactants and betaines are particularly skin-friendly.
Surfactants Δ Group segments Δ Annual Report 2015 Δ PCC Group
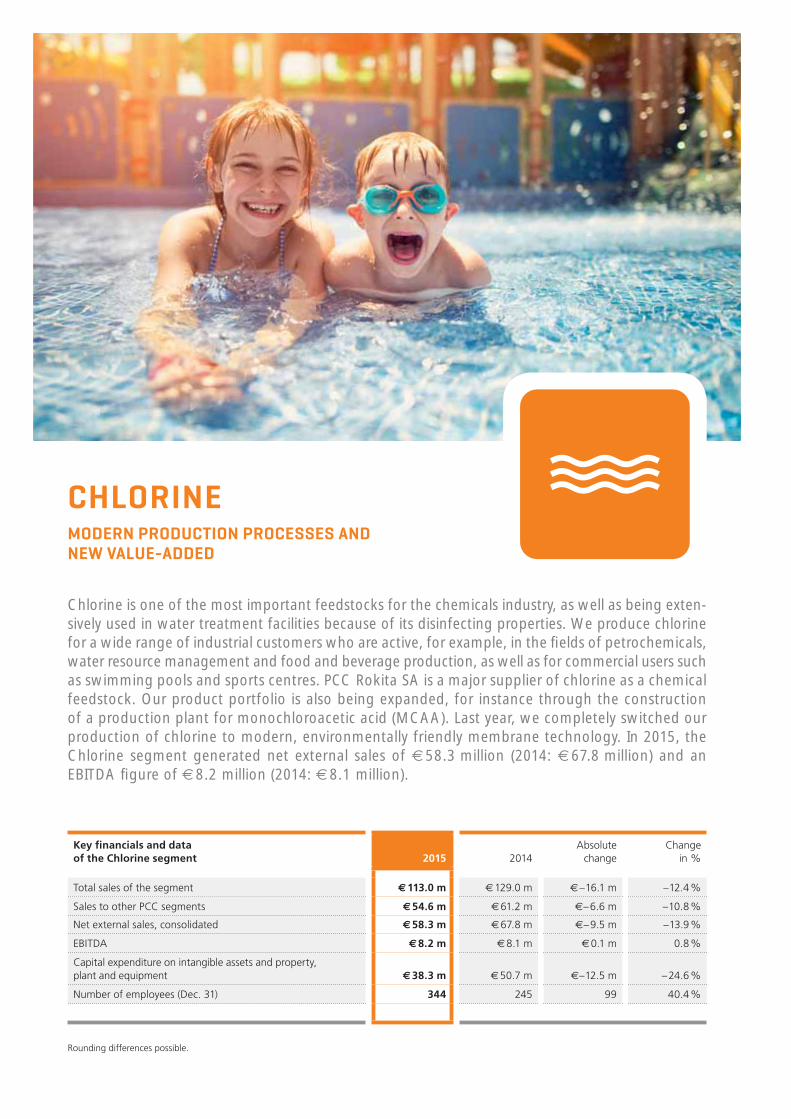
CHLORINEMODERN PRODUCTION PROCESSES AND NEW VALUE-ADDED
Chlorine is one of the most important feedstocks for the chemicals industry, as well as being exten-sively used in water treatment facilities because of its disinfecting properties. We produce chlorine for a wide range of industrial customers who are active, for example, in the fi elds of petrochemicals, water resource management and food and beverage production, as well as for commercial users such as swimming pools and sports centres. PCC Rokita SA is a major supplier of chlorine as a chemical feedstock. Our product portfolio is also being expanded, for instance through the construction of a production plant for monochloroacetic acid (MCAA). Last year, we completely switched our production of chlorine to modern, environmentally friendly membrane technology. In 2015, the Chlorine segment generated net external sales of € 58.3 million (2014: € 67.8 million) and an EBITDA fi gure of € 8.2 million (2014: € 8.1 million).
Key fi nancials and data of the Chlorine segment 2015 2014
Absolute change
Change in %
Total sales of the segment € 113.0 m € 129.0 m € – 16.1 m – 12.4 %
Sales to other PCC segments € 54.6 m € 61.2 m €– 6.6 m – 10.8 %
Net external sales, consolidated € 58.3 m € 67.8 m €– 9.5 m – 13.9 %
EBITDA € 8.2 m € 8.1 m € 0.1 m 0.8 %
Capital expenditure on intangible assets and property, plant and equipment € 38.3 m € 50.7 m €– 12.5 m – 24.6 %
Number of employees (Dec. 31) 344 245 99 40.4 %
Rounding differences possible.

61
WHAT IS CHLORINE?
Chlorine (Cl) is a chemical element with the atomic number 17. Chlorine does not really exist as a single independent element in nature. It is only found in combination with other elements, for instance in chlorides in which chlorine is present as an anion. The best-known chloride is sodium chloride (common salt). Chlorine is normally manufactured using chlor-alkali electrolysis from an aqueous sodium chloride solution. As from April 2015, chlorine production at PCC Rokita SA was switched completely to energy-effi cient and environmentally friendly membrane electrolysis technology. In this process the end product, i.e. principally chlorine, has the same purity as achieved with the former amalgam process. However, signifi -cantly less energy input is required. As a result, PCC Rokita has been able to reduce its CO2 emissions by some 140,000 metric tons per year.
APPLICATIONS AND MARKETS (SELECTION)
Chlorine is not just a widely used feedstock for the chemicals industry, it is also an almost indispensable part of our daily lives. With its disinfecting properties, its use is essential in swimming pools to protect bathers from the threat of germs. The Chlorine production unit at PCC Rokita also manufac-tures chlorobenzene, hydrochloric acid, sodium hydroxide (i.e. caustic soda, the aqueous solution of sodium hydroxide) and sodium hypochlorite.
Hydrochloric acid is used, for instance, in the food and bev-erage industry. Caustic soda serves as a degreasing agent and also a rinsing aid for bottles and apparatus. Sodium hypochlorite is an antiseptic used to boost the antibacterial properties of disinfectants. Chlorine is also employed within PCC Rokita, both for the manufacture of propylene oxide (PO) used in polyol production, and in the Phosphorus De-rivatives business unit of our Speciality Chemicals segment. There, chlorine is processed in the production of phosphorus trichloride and phosphorus oxychloride.
2016 will see us taking into service a production facility for the manufacture of monochloroacetic acid (MCAA) at our chemicals plant in Brzeg Dolny. MCAA is employed in the food and beverage industry and in the manufacture of phar-maceuticals, personal care products, cosmetics, dyestuffs and pesticides.
Chlorine protects us from germs in the swimming pool thanks to its disinfecting properties.
Chlorine is used in water treatment facilities. Caustic soda is employed, for instance, in rinsing and fi lling opera-tions in bottling plants.
Chlorine Δ Group segments Δ Annual Report 2015 Δ PCC Group
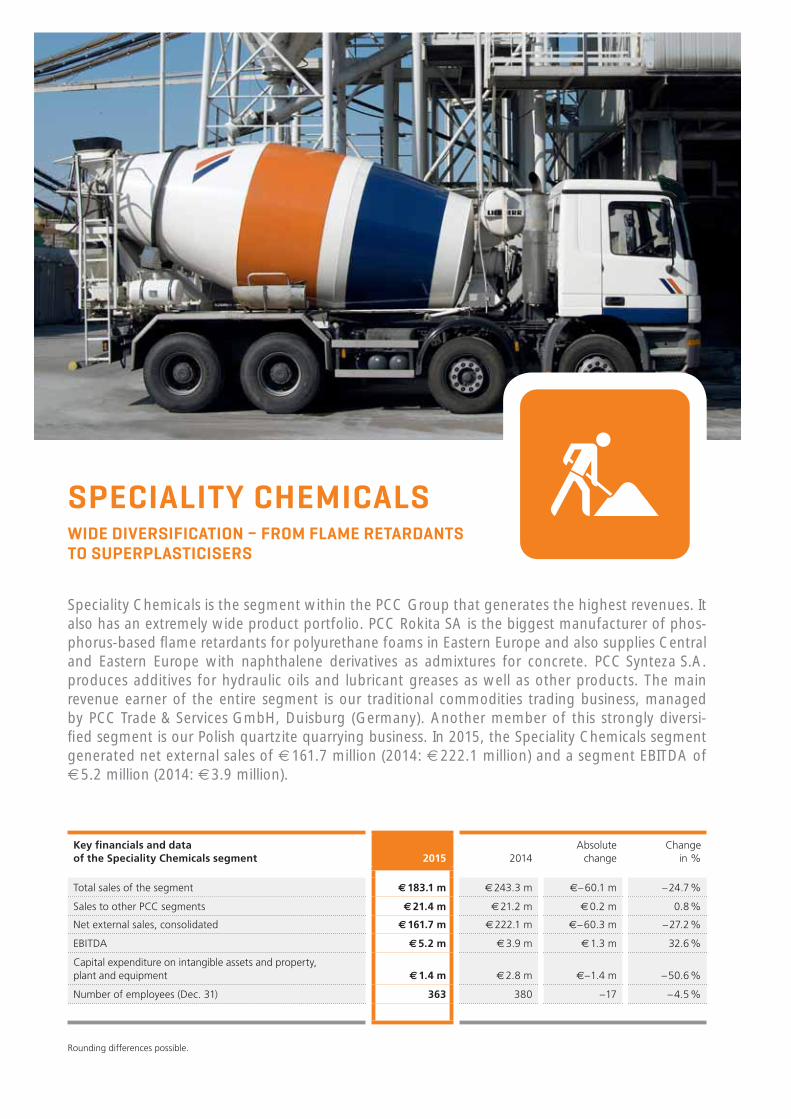
SPECIALITY CHEMICALSWIDE DIVERSIFICATION – FROM FLAME RETARDANTS TO SUPERPLASTICISERS
Speciality Chemicals is the segment within the PCC Group that generates the highest revenues. It also has an extremely wide product portfolio. PCC Rokita SA is the biggest manufacturer of phos-phorus-based fl ame retardants for polyurethane foams in Eastern Europe and also supplies Central and Eastern Europe with naphthalene derivatives as admixtures for concrete. PCC Synteza S.A.produces additives for hydraulic oils and lubricant greases as well as other products. The main revenue earner of the entire segment is our traditional commodities trading business, managed by PCC Trade & Services GmbH, Duisburg (Germany). Another member of this strongly diversi-fi ed segment is our Polish quartzite quarrying business. In 2015, the Speciality Chemicals segment generated net external sales of € 161.7 million (2014: € 222.1 million) and a segment EBITDA of € 5.2 million (2014: € 3.9 million).
Key fi nancials and data of the Speciality Chemicals segment 2015 2014
Absolute change
Change in %
Total sales of the segment € 183.1 m € 243.3 m €– 60.1 m – 24.7 %
Sales to other PCC segments € 21.4 m € 21.2 m € 0.2 m 0.8 %
Net external sales, consolidated € 161.7 m € 222.1 m €– 60.3 m – 27.2 %
EBITDA € 5.2 m € 3.9 m € 1.3 m 32.6 %
Capital expenditure on intangible assets and property, plant and equipment € 1.4 m € 2.8 m €– 1.4 m – 50.6 %
Number of employees (Dec. 31) 363 380 – 17 – 4.5 %
Rounding differences possible.
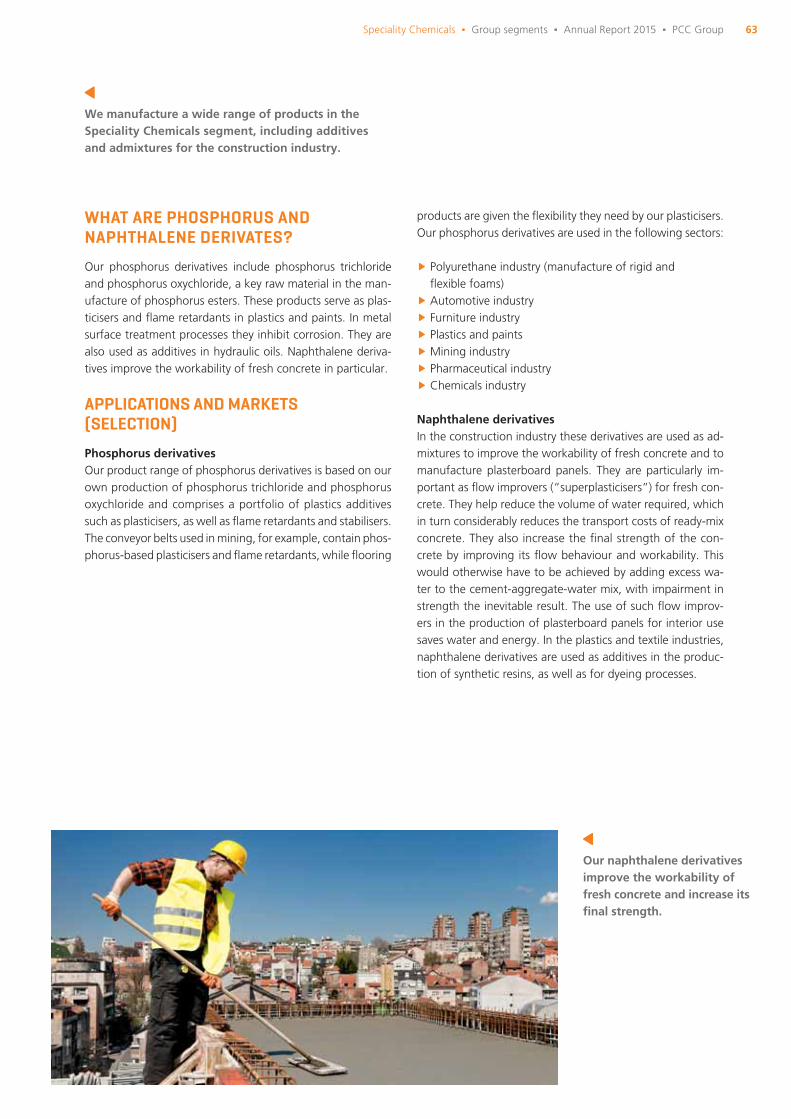
63
WHAT ARE PHOSPHORUS AND NAPHTHALENE DERIVATES?
Our phosphorus derivatives include phosphorus trichloride and phosphorus oxychloride, a key raw material in the man-ufacture of phosphorus esters. These products serve as plas-ticisers and fl ame retardants in plastics and paints. In metal surface treatment processes they inhibit corrosion. They are also used as additives in hydraulic oils. Naphthalene deriva-tives improve the workability of fresh concrete in particular.
APPLICATIONS AND MARKETS (SELECTION)
Phosphorus derivativesOur product range of phosphorus derivatives is based on our own production of phosphorus trichloride and phosphorus oxychloride and comprises a portfolio of plastics additives such as plasticisers, as well as fl ame retardants and stabilisers. The conveyor belts used in mining, for example, contain phos-phorus-based plasticisers and fl ame retardants, while fl ooring
products are given the fl exibility they need by our plasticisers. Our phosphorus derivatives are used in the following sectors:
∂ Polyurethane industry (manufacture of rigid and fl exible foams)
∂ Automotive industry
∂ Furniture industry
∂ Plastics and paints
∂ Mining industry
∂ Pharmaceutical industry
∂ Chemicals industry
Naphthalene derivativesIn the construction industry these derivatives are used as ad-mixtures to improve the workability of fresh concrete and to manufacture plasterboard panels. They are particularly im-portant as fl ow improvers (“superplasticisers”) for fresh con-crete. They help reduce the volume of water required, which in turn considerably reduces the transport costs of ready-mix concrete. They also increase the fi nal strength of the con-crete by improving its fl ow behaviour and workability. This would otherwise have to be achieved by adding excess wa-ter to the cement-aggregate-water mix, with impairment in strength the inevitable result. The use of such fl ow improv-ers in the production of plasterboard panels for interior use saves water and energy. In the plastics and textile industries, naphthalene derivatives are used as additives in the produc-tion of synthetic resins, as well as for dyeing processes.
Our naphthalene derivatives improve the workability of fresh concrete and increase its fi nal strength.
We manufacture a wide range of products in the Speciality Chemicals segment, including additives and admixtures for the construction industry.
Speciality Chemicals Δ Group segments Δ Annual Report 2015 Δ PCC Group
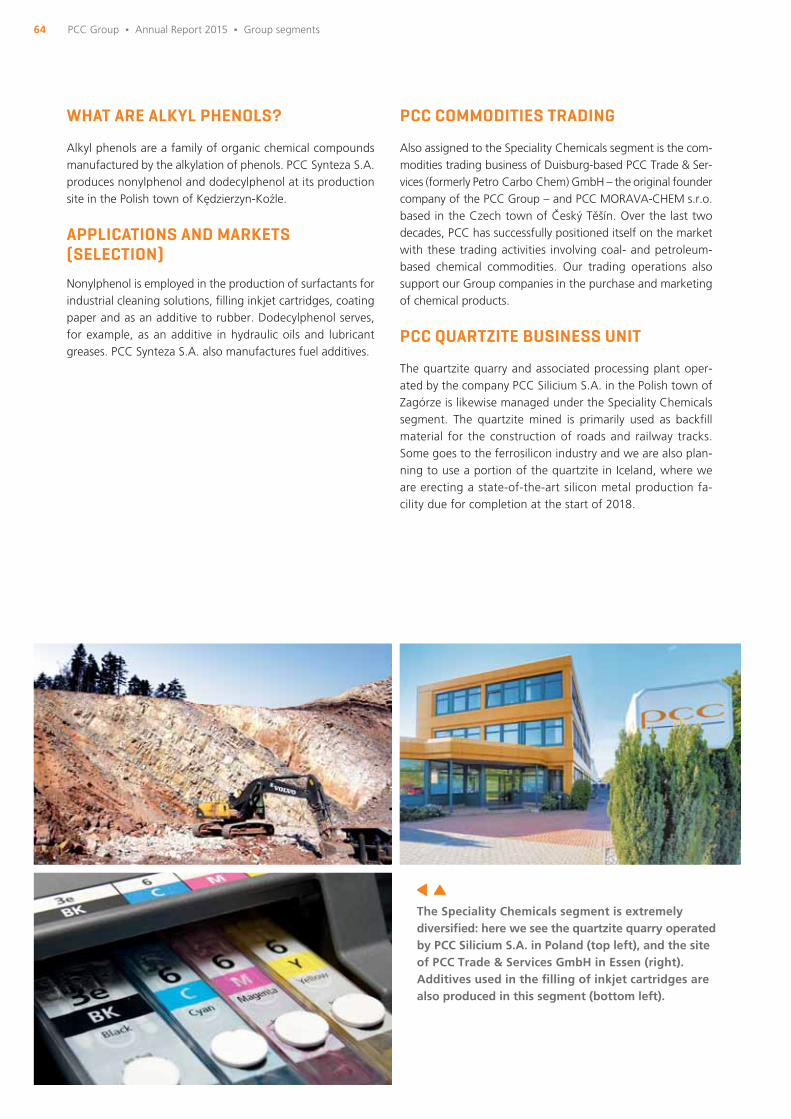
64
WHAT ARE ALKYL PHENOLS?
Alkyl phenols are a family of organic chemical compounds manufactured by the alkylation of phenols. PCC Synteza S.A. produces nonylphenol and dodecylphenol at its production site in the Polish town of Kędzierzyn-Koźle.
APPLICATIONS AND MARKETS (SELECTION)
Nonylphenol is employed in the production of surfactants for industrial cleaning solutions, fi lling inkjet cartridges, coating paper and as an additive to rubber. Dodecylphenol serves, for example, as an additive in hydraulic oils and lubricant greases. PCC Synteza S.A. also manufactures fuel additives.
PCC COMMODITIES TRADING
Also assigned to the Speciality Chemicals segment is the com-modities trading business of Duisburg-based PCC Trade & Ser-vices (formerly Petro Carbo Chem) GmbH – the original founder company of the PCC Group – and PCC MORAVA-CHEM s.r.o. based in the Czech town of Český Těšín. Over the last two decades, PCC has successfully positioned itself on the market with these trading activities involving coal- and petroleum-based chemical commodities. Our trading operations also support our Group companies in the purchase and marketing of chemical products.
PCC QUARTZITE BUSINESS UNIT
The quartzite quarry and associated processing plant oper-ated by the company PCC Silicium S.A. in the Polish town of Zagórze is likewise managed under the Speciality Chemicals segment. The quartzite mined is primarily used as backfi ll material for the construction of roads and railway tracks. Some goes to the ferrosilicon industry and we are also plan-ning to use a portion of the quartzite in Iceland, where we are erecting a state-of-the-art silicon metal production fa-cility due for completion at the start of 2018.
The Speciality Chemicals segment is extremely diversifi ed: here we see the quartzite quarry operated by PCC Silicium S.A. in Poland (top left), and the site of PCC Trade & Services GmbH in Essen (right). Additives used in the fi lling of inkjet cartridges are also produced in this segment (bottom left).
PCC Group Δ Annual Report 2015 Δ Group segments
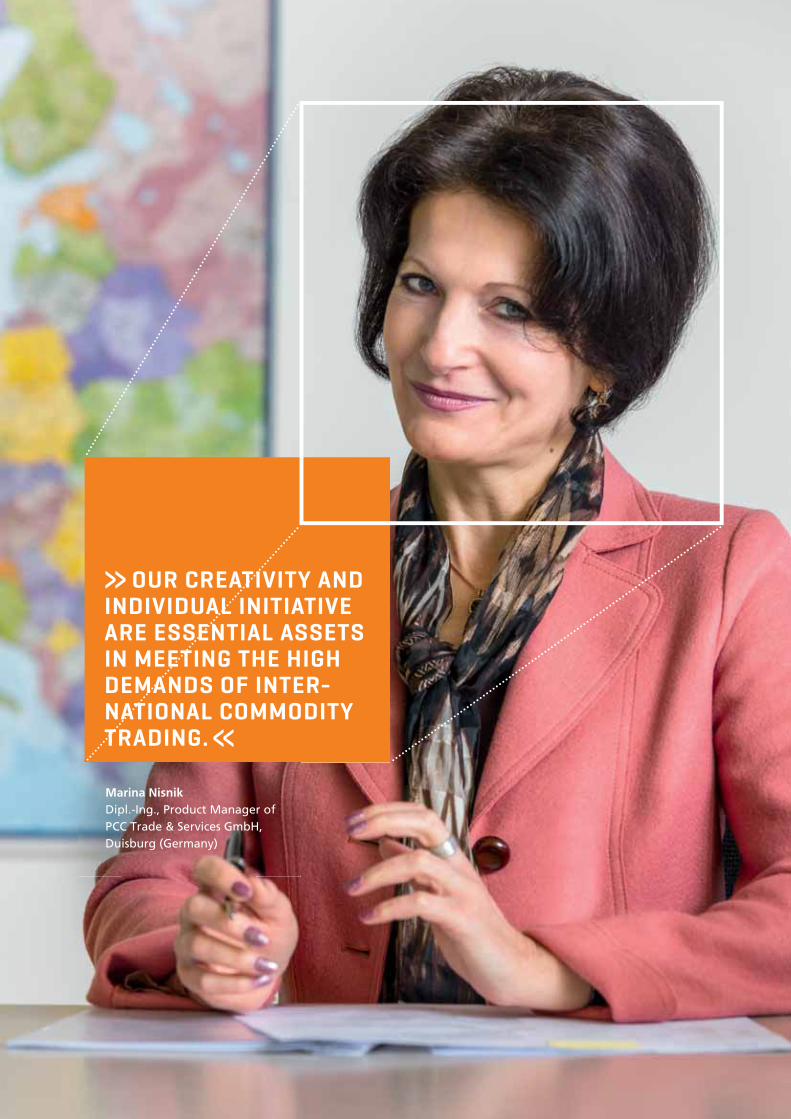
65Spezialchemie Δ Konzernsegmente Δ Geschäftsbericht 2015 Δ PCC SE
Marina NisnikDipl.-Ing., Product Manager of PCC Trade & Services GmbH, Duisburg (Germany)
»OUR CREATIVITY AND INDIVIDUAL INITIATIVE ARE ESSENTIAL ASSETS IN MEETING THE HIGH DEMANDS OF INTER-NATIONAL COMMODITY TRADING.«
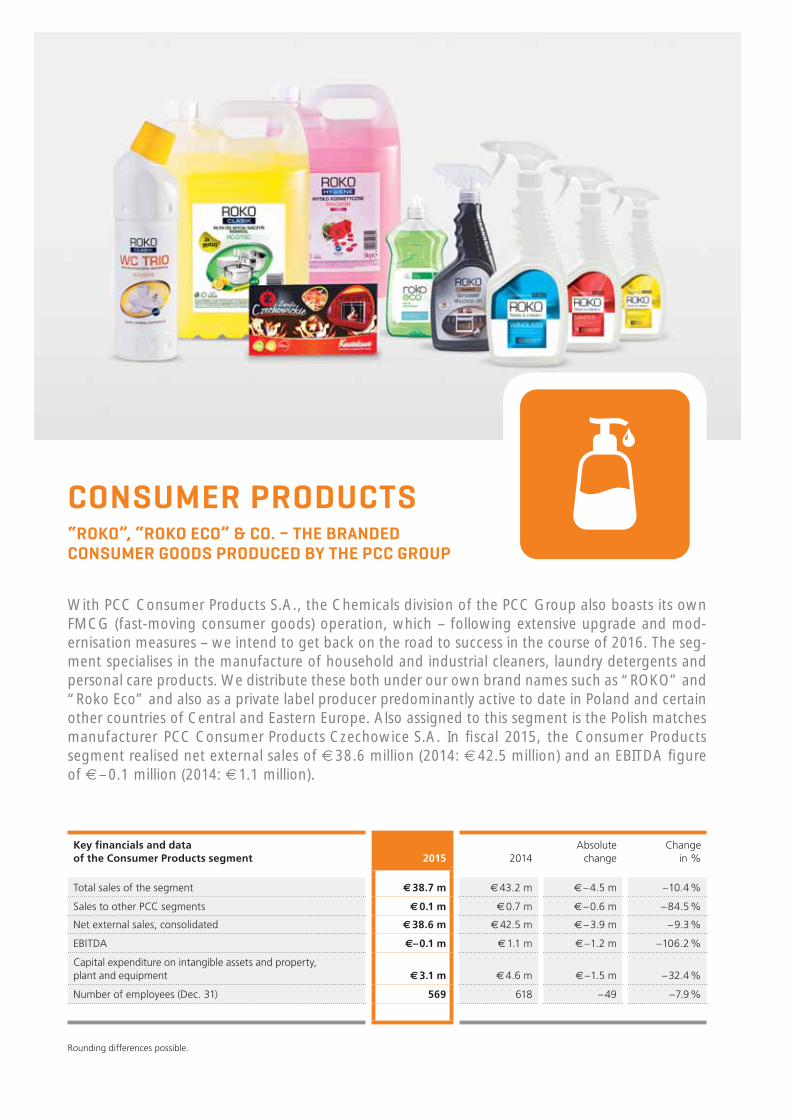
“ROKO”, “ROKO ECO” & CO. – THE BRANDED CONSUMER GOODS PRODUCED BY THE PCC GROUP
With PCC Consumer Products S.A., the Chemicals division of the PCC Group also boasts its own FMCG (fast-moving consumer goods) operation, which – following extensive upgrade and mod-ernisation measures – we intend to get back on the road to success in the course of 2016. The seg-ment specialises in the manufacture of household and industrial cleaners, laundry detergents and personal care products. We distribute these both under our own brand names such as “ROKO” and “Roko Eco” and also as a private label producer predominantly active to date in Poland and certain other countries of Central and Eastern Europe. Also assigned to this segment is the Polish matches manufacturer PCC Consumer Products Czechowice S.A. In fi scal 2015, the Consumer Products segment realised net external sales of € 38.6 million (2014: € 42.5 million) and an EBITDA fi gure of € – 0.1 million (2014: € 1.1 million).
CONSUMER PRODUCTS
Key fi nancials and data of the Consumer Products segment 2015 2014
Absolute change
Change in %
Total sales of the segment € 38.7 m € 43.2 m € – 4.5 m – 10.4 %
Sales to other PCC segments € 0.1 m € 0.7 m € – 0.6 m – 84.5 %
Net external sales, consolidated € 38.6 m € 42.5 m € – 3.9 m – 9.3 %
EBITDA €– 0.1 m € 1.1 m € – 1.2 m – 106.2 %
Capital expenditure on intangible assets and property, plant and equipment € 3.1 m € 4.6 m € – 1.5 m – 32.4 %
Number of employees (Dec. 31) 569 618 – 49 – 7.9 %
Rounding differences possible.
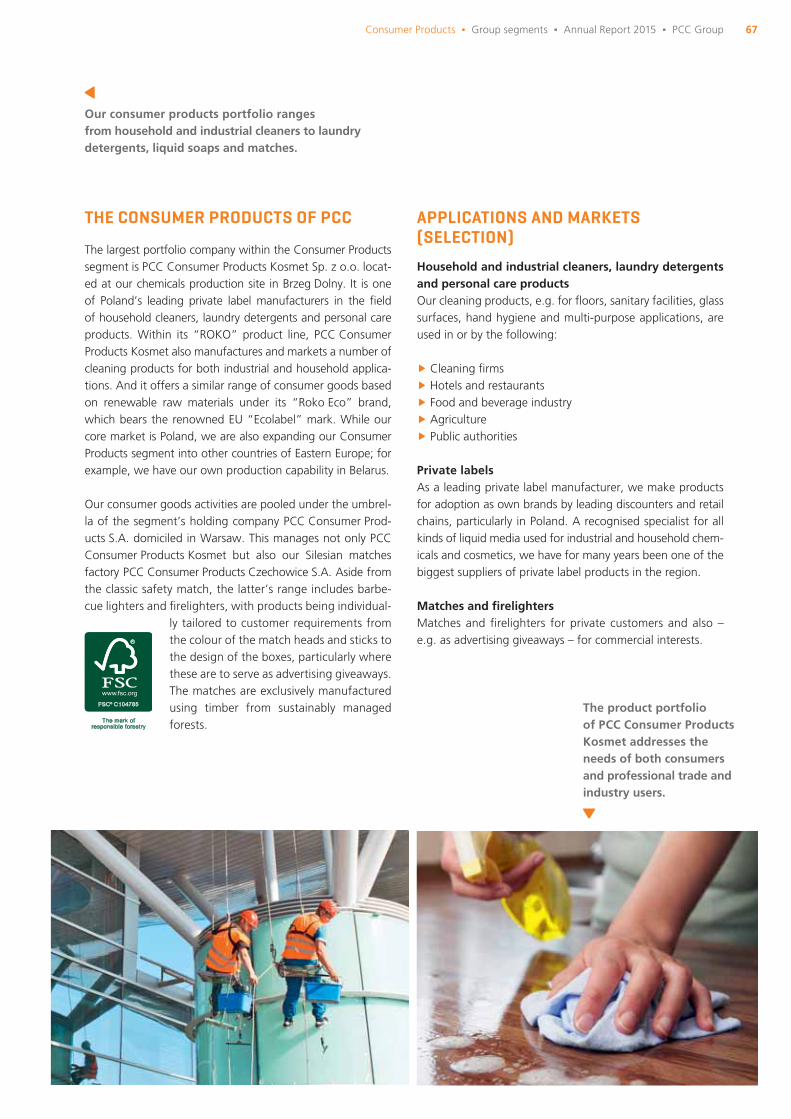
67
THE CONSUMER PRODUCTS OF PCC
The largest portfolio company within the Consumer Products segment is PCC Consumer Products Kosmet Sp. z o.o. locat-ed at our chemicals production site in Brzeg Dolny. It is one of Poland’s leading private label manufacturers in the fi eld of household cleaners, laundry detergents and personal care products. Within its “ROKO” product line, PCC Consumer Products Kosmet also manufactures and markets a number of cleaning products for both industrial and household applica-tions. And it offers a similar range of consumer goods based on renewable raw materials under its “Roko Eco” brand, which bears the renowned EU “Ecolabel” mark. While our core market is Poland, we are also expanding our Consumer Products segment into other countries of Eastern Europe; for example, we have our own production capability in Belarus.
Our consumer goods activities are pooled under the umbrel-la of the segment’s holding company PCC Consumer Prod-ucts S.A. domiciled in Warsaw. This manages not only PCC Consumer Products Kosmet but also our Silesian matches factory PCC Consumer Products Czechowice S.A. Aside from the classic safety match, the latter’s range includes barbe-cue lighters and fi relighters, with products being individual-
ly tailored to customer requirements from the colour of the match heads and sticks to the design of the boxes, particularly where these are to serve as advertising giveaways. The matches are exclusively manufactured using timber from sustainably managed forests.
APPLICATIONS AND MARKETS (SELECTION)
Household and industrial cleaners, laundry detergents and personal care productsOur cleaning products, e.g. for fl oors, sanitary facilities, glass surfaces, hand hygiene and multi-purpose applications, are used in or by the following:
∂ Cleaning fi rms
∂ Hotels and restaurants
∂ Food and beverage industry
∂ Agriculture
∂ Public authorities
Private labelsAs a leading private label manufacturer, we make products for adoption as own brands by leading discounters and retail chains, particularly in Poland. A recognised specialist for all kinds of liquid media used for industrial and household chem-icals and cosmetics, we have for many years been one of the biggest suppliers of private label products in the region.
Matches and fi relightersMatches and fi relighters for private customers and also – e.g. as advertising giveaways – for commercial interests.
The product portfolio of PCC Consumer Products Kosmet addresses theneeds of both consumers and professional trade and industry users.
Our consumer products portfolio ranges from household and industrial cleaners to laundry detergents, liquid soaps and matches.
Consumer Products Δ Group segments Δ Annual Report 2015 Δ PCC Group

EFFICIENT, CLEAN, MODERN: OUR POWER PLANTS
Our Energy segment is responsible for the project planning and operation of small hydropower plants, fi ve of which have already been connected to the grid by the Renewable Energies business unit in South-East Europe, chiefl y in the Republic of Macedonia. The construction of a sixth will commence this year. Owing to their minimal intervention in nature, these power plants are seen as especially environmentally compatible. The Conventional Energies business unit primarily supplies electricity to our own production facilities in Poland. We also provide effi ciently generated heat, for example to the small town of Brzeg Dolny, which is the location of our largest chemicals site. In 2015, the segment as a whole realised net external sales of € 11.3 million (2014: € 10.9 million) and reported a divisional EBITDA of € 7.3 million (2014: € 5.2 million).
Rounding differences possible.
ENERGY
Key fi nancials and data of the Energy segment 2015 2014
Absolute change
Change in %
Total sales of the segment € 28.4 m € 26.0 m € 2.4 m 9.2 %
Sales to other PCC segments € 17.1 m € 15.1 m € 2.0 m 13.1 %
Net external sales, consolidated € 11.3 m € 10.9 m € 0.4 m 3.7 %
EBITDA € 7.3 m € 5.2 m € 2.1 m 40.4 %
Capital expenditure on intangible assets and property, plant and equipment € 3.4 m € 2.0 m € 1.4 m 68.0 %
Number of employees (Dec. 31) 179 180 – 1 – 0.6 %
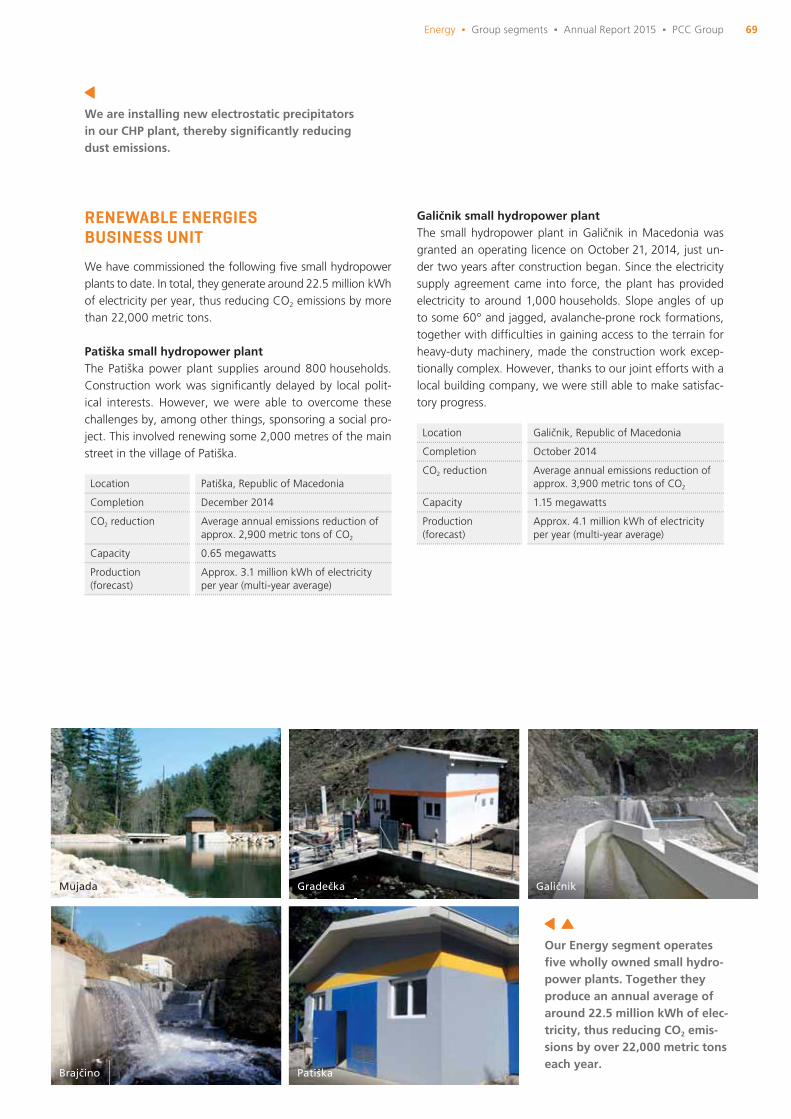
69
RENEWABLE ENERGIES BUSINESS UNIT
We have commissioned the following fi ve small hydropower plants to date. In total, they generate around 22.5 million kWh of electricity per year, thus reducing CO2 emissions by more than 22,000 metric tons.
Patiška small hydropower plantThe Patiška power plant supplies around 800 households. Construction work was signifi cantly delayed by local polit-ical interests. However, we were able to overcome these challenges by, among other things, sponsoring a social pro-ject. This involved renewing some 2,000 metres of the main street in the village of Patiška.
Galičnik small hydropower plantThe small hydropower plant in Galičnik in Macedonia was granted an operating licence on October 21, 2014, just un-der two years after construction began. Since the electricity supply agreement came into force, the plant has provided electricity to around 1,000 households. Slope angles of up to some 60° and jagged, avalanche-prone rock formations, together with diffi culties in gaining access to the terrain for heavy-duty machinery, made the construction work excep-tionally complex. However, thanks to our joint efforts with a local building company, we were still able to make satisfac-tory progress.
Location Patiška, Republic of Macedonia
Completion December 2014
CO2 reduction Average annual emissions reduction of approx. 2,900 metric tons of CO2
Capacity 0.65 megawatts
Production(forecast)
Approx. 3.1 million kWh of electricity per year (multi-year average)
Location Galičnik, Republic of Macedonia
Completion October 2014
CO2 reduction Average annual emissions reduction of approx. 3,900 metric tons of CO2
Capacity 1.15 megawatts
Production(forecast)
Approx. 4.1 million kWh of electricity per year (multi-year average)
Our Energy segment operates fi ve wholly owned small hydro-power plants. Together they produce an annual average of around 22.5 million kWh of elec-tricity, thus reducing CO2 emis-sions by over 22,000 metric tons each year.
PatiškaBrajčino
Mujada Gradečka Galičnik
We are installing new electrostatic precipitators in our CHP plant, thereby signifi cantly reducing dust emissions.
Energy Δ Group segments Δ Annual Report 2015 Δ PCC Group
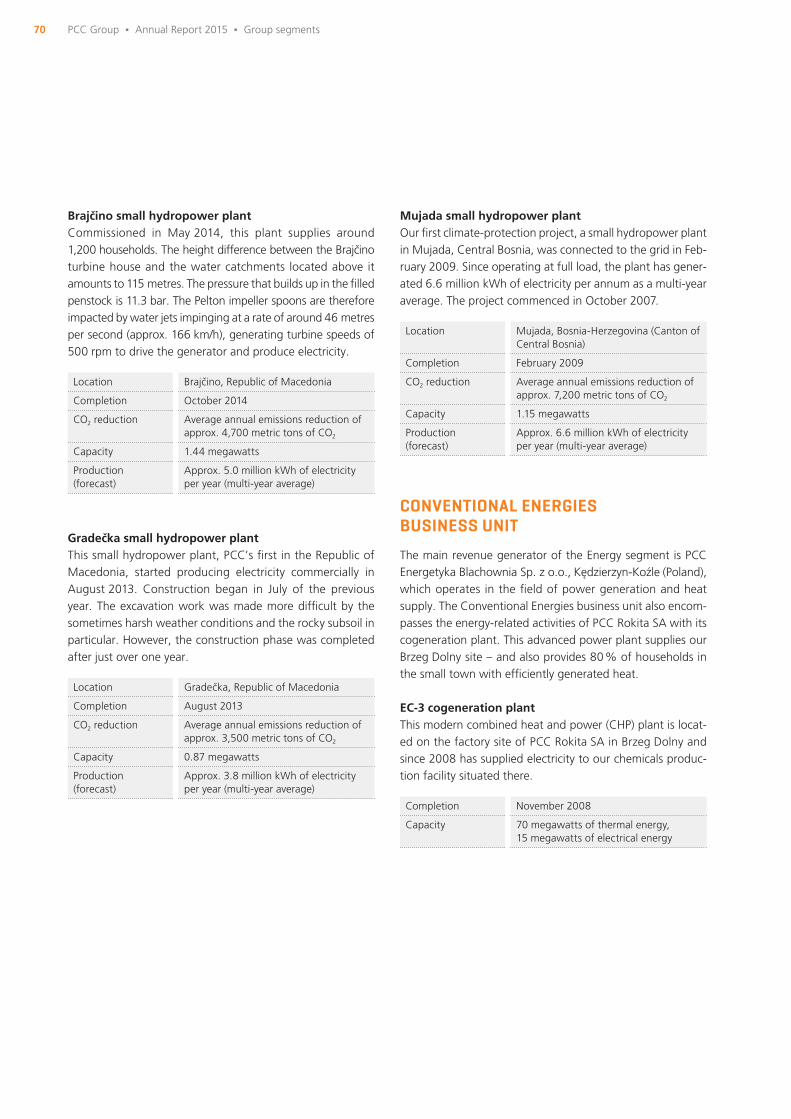
70
Brajčino small hydropower plantCommissioned in May 2014, this plant supplies around 1,200 households. The height difference between the Brajčino turbine house and the water catchments located above it amounts to 115 metres. The pressure that builds up in the fi lled penstock is 11.3 bar. The Pelton impeller spoons are therefore impacted by water jets impinging at a rate of around 46 metres per second (approx. 166 km/h), generating turbine speeds of 500 rpm to drive the generator and produce electricity.
Gradečka small hydropower plantThis small hydropower plant, PCC’s fi rst in the Republic of Macedonia, started producing electricity commercially in August 2013. Construction began in July of the previous year. The excavation work was made more diffi cult by the sometimes harsh weather conditions and the rocky subsoil in particular. However, the construction phase was completed after just over one year.
Mujada small hydropower plantOur fi rst climate-protection project, a small hydropower plant in Mujada, Central Bosnia, was connected to the grid in Feb-ruary 2009. Since operating at full load, the plant has gener-ated 6.6 million kWh of electricity per annum as a multi-year average. The project commenced in October 2007.
CONVENTIONAL ENERGIES BUSINESS UNIT
The main revenue generator of the Energy segment is PCC Energetyka Blachownia Sp. z o.o., Kędzierzyn-Koźle (Poland), which operates in the fi eld of power generation and heat supply. The Conventional Energies business unit also encom-passes the energy-related activities of PCC Rokita SA with its cogeneration plant. This advanced power plant supplies our Brzeg Dolny site – and also provides 80 % of households in the small town with effi ciently generated heat.
EC-3 cogeneration plantThis modern combined heat and power (CHP) plant is locat-ed on the factory site of PCC Rokita SA in Brzeg Dolny and since 2008 has supplied electricity to our chemicals produc-tion facility situated there.
Location Brajčino, Republic of Macedonia
Completion October 2014
CO2 reduction Average annual emissions reduction of approx. 4,700 metric tons of CO2
Capacity 1.44 megawatts
Production(forecast)
Approx. 5.0 million kWh of electricity per year (multi-year average)
Location Gradečka, Republic of Macedonia
Completion August 2013
CO2 reduction Average annual emissions reduction of approx. 3,500 metric tons of CO2
Capacity 0.87 megawatts
Production(forecast)
Approx. 3.8 million kWh of electricity per year (multi-year average)
Location Mujada, Bosnia-Herzegovina (Canton of Central Bosnia)
Completion February 2009
CO2 reduction Average annual emissions reduction of approx. 7,200 metric tons of CO2
Capacity 1.15 megawatts
Production(forecast)
Approx. 6.6 million kWh of electricity per year (multi-year average)
Completion November 2008
Capacity 70 megawatts of thermal energy,15 megawatts of electrical energy
PCC Group Δ Annual Report 2015 Δ Group segments
Kristian GligorovskiB. Sc. Mech. Eng., Operation and Maintenance Manager of PCC HYDRO DOOEL Skopje (Macedonia)
»SMALL HYDROPOWER PLANTS PRODUCING ENVIRONMENTALLY FRIENDLY ELECTRICITY ARE VERY IMPORTANT IN MACEDONIA – AND PCC HYDRO IS PLAYING A MAJOR ROLE IN THEIR ESTABLISHMENT.«

SAFE, RELIABLE AND FLEXIBLE ON ROAD AND RAIL
The main revenue generator of our Logistics segment is PCC Intermodal S.A. This counts among Poland’s leading providers of combined road and rail container transport services and operates fi ve wholly owned container terminals. We have signifi cantly expanded and upgraded four of these terminals in recent years; a sixth is at the planning stage. They allow us to offer regular scheduled freight services connecting Germany and the Benelux countries with Poland and the countries of Eastern Europe. The segment also encompasses the Polish company PCC Autochem Sp. z o.o., which specialises in the road transport of liquid chemicals, and hazardous substances in particular, and the Moscow rail transport company ZAO PCC Rail. In 2015, our Logistics segment generated net external sales of € 56.8 million (2014: € 50.8 million) and reported a divisional EBITDA of € 4.9 million (2014: € 3.9 million).
Rounding differences possible.
LOGISTICS
Key fi nancials and data of the Logistics segment 2015 2014
Absolute change
Change in %
Total sales of the segment € 66.8 m € 59.9 m € 6.9 m 11.5 %
Sales to other PCC segments € 10.0 m € 9.0 m € 1.0 m 10.9 %
Net external sales, consolidated € 56.8 m € 50.8 m € 5.9 m 11.6 %
EBITDA € 4.9 m € 3.9 m € 0.9 m 24.0 %
Capital expenditure on intangible assets and property, plant and equipment € 31.2 m € 19.3 m € 11.9 m 61.8 %
Number of employees (Dec. 31) 367 332 35 10.5 %
73
PCC terminal in Brzeg DolnyThis terminal is located on the factory site of PCC Rokita SA in Brzeg Dolny and promotes the fl ow of goods in the region of Lower Silesia. The expansion project, which was offi cially completed in September 2015, more than doubled the an-nual handling capacity from around 50,000 TEU to around 110,000 TEU. In addition, the storage capacity was increased and the fl eet expanded.
PCC terminal in Frankfurt (Oder)This terminal is located on the German-Polish border and handles goods fl ows primarily from the Berlin/Brandenburg region. The Frankfurt (Oder) facility is further enabling us to develop our intermodal transport network westwards towards France and Spain. This combined transport termi-nal, which has undergone signifi cant expansion in recent years, has been operated by PCC Intermodal S.A. since April 2012. Its current annual handling capacity is in excess of 100,000 TEU.
INTERMODAL TRANSPORT BUSINESS UNIT
PCC terminal in KutnoThe Kutno PCC terminal is today one of Poland’s most mod-ern combined transport terminals. It enables the rapid and effi cient transfer of cargo along both an east-west axis from Western to Eastern Europe and vice versa, and a north-south axis from the Baltic ports of Gdańsk and Gdynia to the ports of Koper and Trieste on the Adriatic. In 2015, the annual handling capacity was increased considerably by 150 % to 250,000 TEU (the unit of measurement for twenty-foot standard containers). The terminal was the fi rst advanced logistics and handling facility in Central Poland and was com-missioned by PCC Intermodal S.A. in 2011 as the company’s fi rst investment project of this scale. All expansion phases were completed by July 2015.
PCC terminal in GliwiceThe Gliwice PCC terminal, approximately 35 kilometres away from Katowice, handles cargo from Upper Silesia. It benefi ts from an excellent location, close to the intersection of two trans-European traffi c corridors: Berlin/Dresden-Wrocław-Lviv-Kiev and Gdańsk-Katowice-Žilina. The site area of the facility in Gliwice was signifi cantly increased by an expansion project in the fourth quarter of 2015, rising from 30,000 m2 to 50,000 m2.
Location Kutno, Central Poland
Site area 80,000 m2
Handling capacity per year
250,000 TEU
Storage capacity 4,000 TEU
Infrastructure/facilities
∂ 6 reach-stackers∂ 2 gantry cranes∂ 9,000 m2 railway area∂ 4 block-train spur tracks, each 700 m long∂ Entrance and exit gates with four lanes∂ Offi ce and staff building∂ Workshop for container repairs
Location Gliwice, Upper Silesia (Poland)
Site area 50,000 m2
Handling capacity per year
More than 150,000 TEU
Storage capacity 2,900 TEU
Infrastructure/facilities
∂ 2 gantry cranes∂ 4 reach-stackers ∂ 4 spur tracks, each 650 m long∂ 50 parking spaces for trucks
Location Brzeg Dolny, Lower Silesia (Poland)
Site area 28,000 m2
Handling capacity per year
110,000 TEU
Storage capacity 2,700 TEU
Infrastructure/facilities
∂ 4 reach-stackers∂ 4 block-train spur tracks, each 650 m long∂ Goods wagon repair facility with an area of 335 m2
∂ 20 parking spaces for trailers
Location Frankfurt (Oder)
Site area 30,000 m2
Handling capacity per year
More than 100,000 TEU
Storage capacity 1,000 TEU
Infrastructure/facilities
∂ 2 reach-stackers∂ 1 gantry crane (speed: 120 m/min, span: 70 m, load-lifting capacity: 41 t)∂ 4 block-train spur tracks, each 600 m long
In 2015, the freight transport volume of PCC Intermodal was some 175,000 TEU (twenty-foot equivalent units) or around 110,000 containers.
Logistics Δ Group segments Δ Annual Report 2015 Δ PCC Group

74
PCC terminal in DębicaThe PCC terminal in Dębica is a highly effi cient facility that handles cargo transiting to and from South-East Poland. It is situated in the administrative district of Podkarpackie and has a site area of 15,000 m2. The Dębica terminal currently has a storage capacity of 1,200 TEU. There are several cities, for example Rzeszów, Nowy Sącz, Tarnów and Stalowa Wola, within a radius of 100 to 150 kilometres of the terminal.
ROAD HAULAGE BUSINESS UNIT
The road haulage company PCC Autochem runs a fl eet of around 110 road tankers which operate on behalf of cus-tomers throughout Europe from a hub on the factory site of PCC Rokita in Brzeg Dolny. Specialising in the transpor-tation of liquid chemicals, PCC Autochem also has its own tank cleaning facility especially designed for hazardous sub-stances.
RAIL TRANSPORT BUSINESS UNIT
Our Russian subsidiary ZAO PCC Rail operates a fl eet of currently around 600 goods wagons designed to run on the wide gauge railways of Russia and the adjoining CIS states, carrying in particular construction materials, metals and coal.
Location Dębica (Poland)
Site area 15,000 m2
Handling capacity per year
50,000 TEU
Storage capacity 1,200 TEU
Infrastructure/facilities
∂ 1 block-train spur track∂ 2 reach-stackers∂ 10 parking spaces for trailers
PCC Autochem Sp. z o.o. specialises in the transport of liquid chemicals and also has its own tank cleaning facility.
PCC Group Δ Annual Report 2015 Δ Group segments

Germany
Belgium
Netherlands
Frankfurt (Oder)
HamburgBremerhaven
Rotterdam
Antwerp Duisburg
Brest
Gdynia
Poland
Brzeg Dolny
KutnoWarsaw
Amsterdam
Brussels
Berlin
GliwiceDębica
1 2
3
4 5
Poznań
Gdańsk
The network of routes operated by PCC Intermodal S.A. has been contin-ually extended and consolidated in recent years. We operate fi ve wholly owned terminals; a sixth is at the planning stage.
1 Frankfurt (Oder) 2 Kutno 3 Brzeg Dolny
4 Gliwice 5 Dębica
PCC terminals
Destinations (seaports and inland terminals)
Current routes operated by PCC Intermodal S.A.
NETWORK OF ROUTES OPERATED BY PCC INTERMODAL S.A.
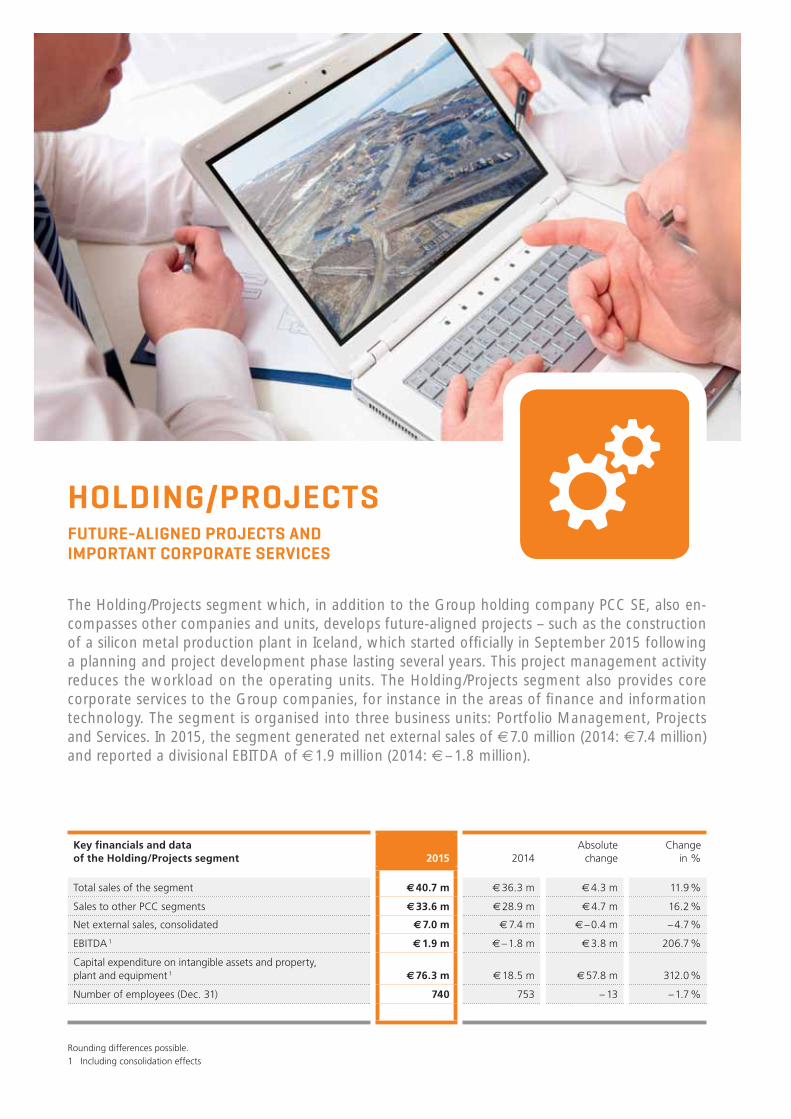
The Holding/Projects segment which, in addition to the Group holding company PCC SE, also en-compasses other companies and units, develops future-aligned projects – such as the construction of a silicon metal production plant in Iceland, which started offi cially in September 2015 following a planning and project development phase lasting several years. This project management activity reduces the workload on the operating units. The Holding/Projects segment also provides core corporate services to the Group companies, for instance in the areas of fi nance and information technology. The segment is organised into three business units: Portfolio Management, Projects and Services. In 2015, the segment generated net external sales of € 7.0 million (2014: € 7.4 million) and reported a divisional EBITDA of € 1.9 million (2014: € – 1.8 million).
Rounding differences possible.1 Including consolidation effects
HOLDING/PROJECTSFUTURE-ALIGNED PROJECTS AND IMPORTANT CORPORATE SERVICES
Key fi nancials and data of the Holding/Projects segment 2015 2014
Absolute change
Change in %
Total sales of the segment € 40.7 m € 36.3 m € 4.3 m 11.9 %
Sales to other PCC segments € 33.6 m € 28.9 m € 4.7 m 16.2 %
Net external sales, consolidated € 7.0 m € 7.4 m € – 0.4 m – 4.7 %
EBITDA 1 € 1.9 m € – 1.8 m € 3.8 m 206.7 %
Capital expenditure on intangible assets and property, plant and equipment 1 € 76.3 m € 18.5 m € 57.8 m 312.0 %
Number of employees (Dec. 31) 740 753 – 13 – 1.7 %
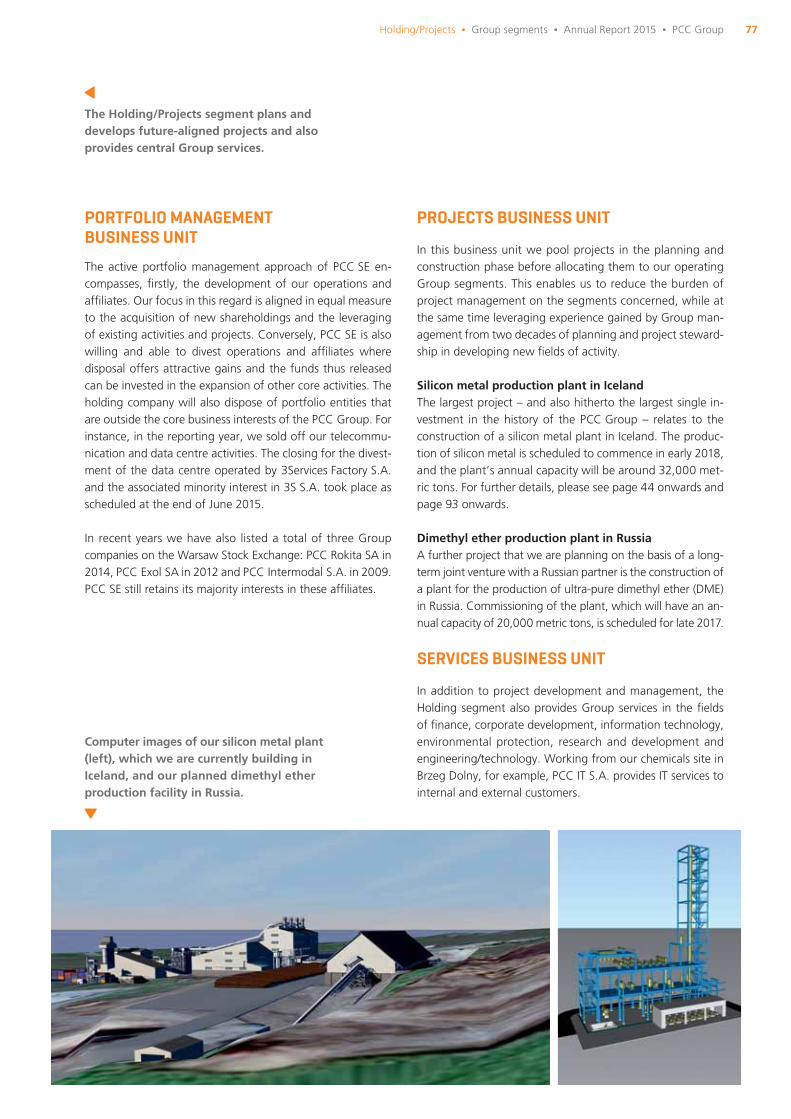
77
PORTFOLIO MANAGEMENT BUSINESS UNIT
The active portfolio management approach of PCC SE en-compasses, fi rstly, the development of our operations and affi liates. Our focus in this regard is aligned in equal measure to the acquisition of new shareholdings and the leveraging of existing activities and projects. Conversely, PCC SE is also willing and able to divest operations and affi liates where disposal offers attractive gains and the funds thus released can be invested in the expansion of other core activities. The holding company will also dispose of portfolio entities that are outside the core business interests of the PCC Group. For instance, in the reporting year, we sold off our telecommu-nication and data centre activities. The closing for the divest-ment of the data centre operated by 3Services Factory S.A. and the associated minority interest in 3S S.A. took place as scheduled at the end of June 2015.
In recent years we have also listed a total of three Group companies on the Warsaw Stock Exchange: PCC Rokita SA in 2014, PCC Exol SA in 2012 and PCC Intermodal S.A. in 2009. PCC SE still retains its majority interests in these affi liates.
PROJECTS BUSINESS UNIT
In this business unit we pool projects in the planning and construction phase before allocating them to our operating Group segments. This enables us to reduce the burden of project management on the segments concerned, while at the same time leveraging experience gained by Group man-agement from two decades of planning and project steward-ship in developing new fi elds of activity.
Silicon metal production plant in IcelandThe largest project – and also hitherto the largest single in-vestment in the history of the PCC Group – relates to the construction of a silicon metal plant in Iceland. The produc-tion of silicon metal is scheduled to commence in early 2018, and the plant’s annual capacity will be around 32,000 met-ric tons. For further details, please see page 44 onwards and page 93 onwards.
Dimethyl ether production plant in RussiaA further project that we are planning on the basis of a long-term joint venture with a Russian partner is the construction of a plant for the production of ultra-pure dimethyl ether (DME) in Russia. Commissioning of the plant, which will have an an-nual capacity of 20,000 metric tons, is scheduled for late 2017.
SERVICES BUSINESS UNIT
In addition to project development and management, the Holding segment also provides Group services in the fi elds of fi nance, corporate development, information technology, environmental protection, research and development and engineering/technology. Working from our chemicals site in Brzeg Dolny, for example, PCC IT S.A. provides IT services to internal and external customers.
The Holding/Projects segment plans and develops future-aligned projects and also provides central Group services.
NEU
Computer images of our silicon metal plant (left), which we are currently building in Iceland, and our planned dimethyl ether production facility in Russia.
Holding/Projects Δ Group segments Δ Annual Report 2015 Δ PCC Group

38
37
39
USAPiedmontSouth Carolina
GhanaAccra
IcelandHúsavík
78
PCC GROUP SITES
3,000 employees – 40 sites – 17 countries The PCC Group companies operate at 40 sites in 17 countries (status as of December 31, 2015). Most of our approximately 3,000 employees are active within Europe. However, the PCC Group is also represented in America, Asia and Africa.
PCC CHEMICALS PRODUCTION SITES
Essen (D)2
Żółwin (PL) 10
Płock (PL)8
Mysłowice (PL) 13
Czechowice-Dziedzice (PL) 17
Brzeg Dolny (PL)6
Kędzierzyn-Koźle (PL)11
Zagórze (PL) 14
Grodno (BY) 22
Piedmont, South Carolina (USA)37
PCC Group Δ Annual Report 2015 Δ Group segments
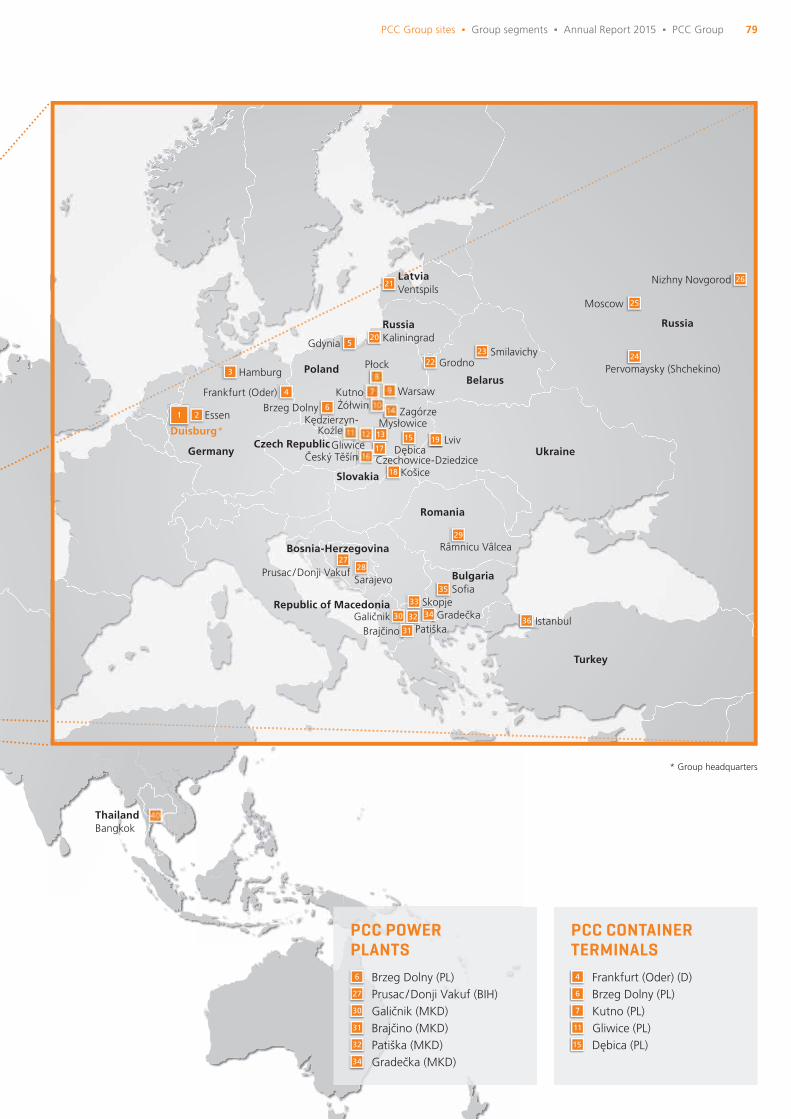
40
33
3230
31
34
35
36
28
29
27
21
3
4
520
26
25
2423
22
6
8
9
113232 19 15 12 13
17 16
18
21
7
10
Czechowice-Dziedzice
Prusac / Donji Vakuf
ThailandBangkok
Duisburg *
Germany
Frankfurt (Oder)
Hamburg
Latvia Ventspils
Turkey
LvivUkraine
Romania
Râmnicu Vâlcea
BulgariaSofi a
Český TěšínCzech Republic
Slovakia
Republic of Macedonia SkopjeGradečka
Moscow
RussiaKaliningrad
Russia
Belarus
SmilavichyGrodno
Sarajevo
Bosnia-Herzegovina
Nizhny Novgorod
Pervomaysky (Shchekino)Poland
Kutno Warsaw
Płock
Zagórze
Gliwice
Mysłowice
ŻółwinKędzierzyn- Koźle
Essen
PatiškaGaličnik
Brajčino
Košice
Istanbul
Dębica
Gdynia
Brzeg Dolny
79
* Group headquarters
PCC CONTAINER TERMINALS
Frankfurt (Oder) (D)4
Gliwice (PL)11
Kutno (PL)7
Brzeg Dolny (PL)6
PCC POWER PLANTS
Brzeg Dolny (PL)6
Brajčino (MKD)31
Galičnik (MKD)30
Gradečka (MKD)34
Prusac / Donji Vakuf (BIH)27
Patiška (MKD) 32 Dębica (PL) 15
PCC Group sites Δ Group segments Δ Annual Report 2015 Δ PCC Group
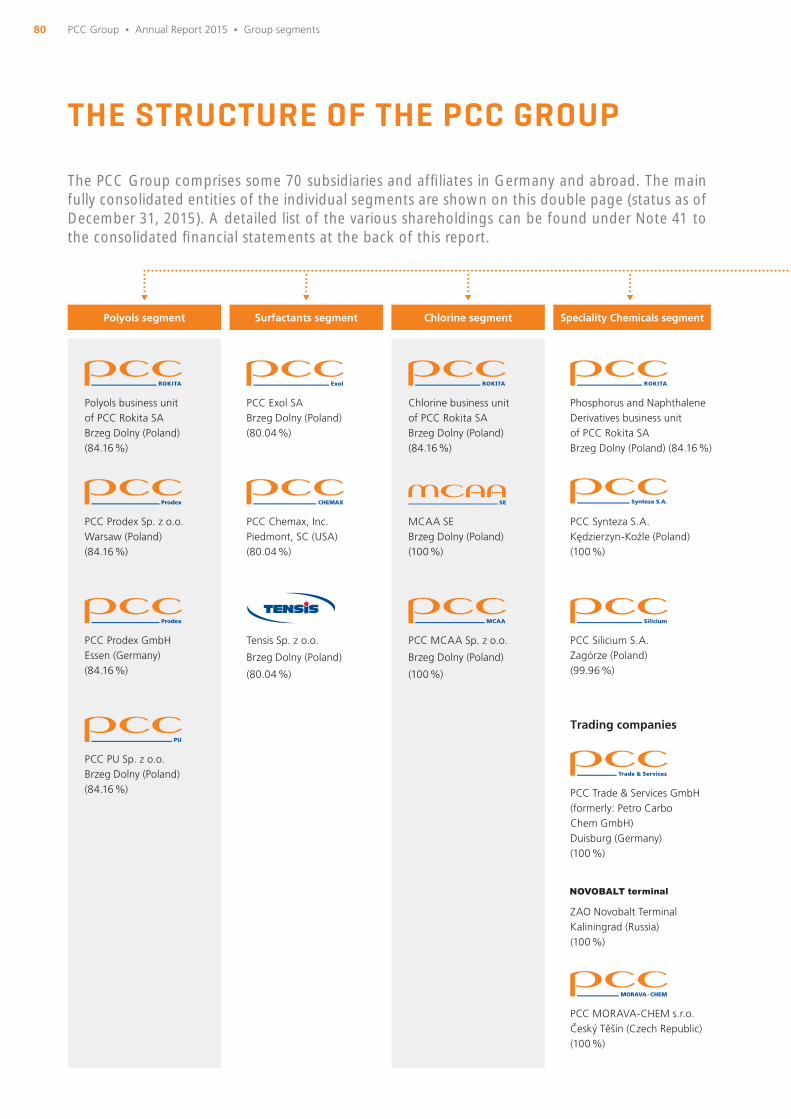
80
THE STRUCTURE OF THE PCC GROUP
The PCC Group comprises some 70 subsidiaries and affi liates in Germany and abroad. The main fully consolidated entities of the individual segments are shown on this double page (status as of December 31, 2015). A detailed list of the various shareholdings can be found under Note 41 to the consolidated fi nancial statements at the back of this report.
Polyols segment Surfactants segment Chlorine segment Speciality Chemicals segment
PCC Exol SA Brzeg Dolny (Poland) (80.04 %)
PCC Chemax, Inc. Piedmont, SC (USA) (80.04 %)
Tensis Sp. z o.o.
Brzeg Dolny (Poland)
(80.04 %)
PCC MCAA Sp. z o.o.
Brzeg Dolny (Poland)
(100 %)
Chlorine business unit of PCC Rokita SABrzeg Dolny (Poland) (84.16 %)
MCAA SE Brzeg Dolny (Poland) (100 %)
Polyols business unit of PCC Rokita SABrzeg Dolny (Poland) (84.16 %)
PCC Prodex Sp. z o.o. Warsaw (Poland) (84.16 %)
PCC Prodex GmbHEssen (Germany) (84.16 %)
PCC PU Sp. z o.o.Brzeg Dolny (Poland)(84.16 %)
Phosphorus and Naphthalene Derivatives business unit of PCC Rokita SABrzeg Dolny (Poland) (84.16 %)
PCC Synteza S.A.Kędzierzyn-Koźle (Poland) (100 %)
PCC Silicium S.A.Zagórze (Poland) (99.96 %)
Trading companies
PCC Trade & Services GmbH(formerly: Petro Carbo Chem GmbH)Duisburg (Germany) (100 %)
PCC MORAVA-CHEM s.r.o.Český Těšín (Czech Republic) (100 %)
ZAO Novobalt TerminalKaliningrad (Russia) (100 %)
PCC Group Δ Annual Report 2015 Δ Group segments

81
Consumer Products segment Energy segment Logistics segment Holding/Projects segment
PCC SE, holding company of the PCC Group, Duisburg (Germany)
PCC Intermodal S.A.Gdynia (Poland) (69.52 %)
PCC Autochem Sp. z o.o.Brzeg Dolny (Poland) (84.16 %)
ZAO PCC RailMoscow (Russia)(100 %)
PCC Intermodal GmbHDuisburg (Germany) (69.52 %)
PCC DEG Renewables GmbHDuisburg (Germany) (60 %)
PCC Energetyka BlachowniaSp. z o.o.Kędzierzyn-Koźle (Poland) (84.46 %)
GRID BH d.o.o.Sarajevo (Bosnia-Herzegovina) (51.37 %)
Energy business unit of PCC Rokita SABrzeg Dolny (Poland) (84.16 %)
PCC HYDRO DOOEL SkopjeSkopje (Republic of Macedonia) (60 %)
PCC Consumer Products S.A.Warsaw (Poland) (100 %)
Kosmet Sp. z o.o.Brzeg Dolny (Poland) (100 %)
OOO PCC Consumer ProductsMoscow (Russia)(100 %)
OOO PCC ConsumerProducts Navigator (formerly: OOO NPK Navigator)Grodno (Belarus)(100 %)
PCC Consumer ProductsKosmet Sp. z o.o.Brzeg Dolny (Poland) (100 %)
PCC Consumer ProductsCzechowice S.A.Czechowice-Dziedzice (Poland) (99.74 %)
PCC Apakor Sp. z o.o.Brzeg Dolny (Poland)(83.81 %)
Ekologistyka Sp. z o.o.Brzeg Dolny (Poland)(84.16 %)
LabMatic Sp. z o.o.Brzeg Dolny (Poland)(83.94 %)
PCC IT S.A.Brzeg Dolny (Poland) (100 %)
The structure of the PCC group Δ Group segments Δ Annual Report 2015 Δ PCC Group
PCC BakkiSilicon hfHúsavík (Iceland) (86.50 %)
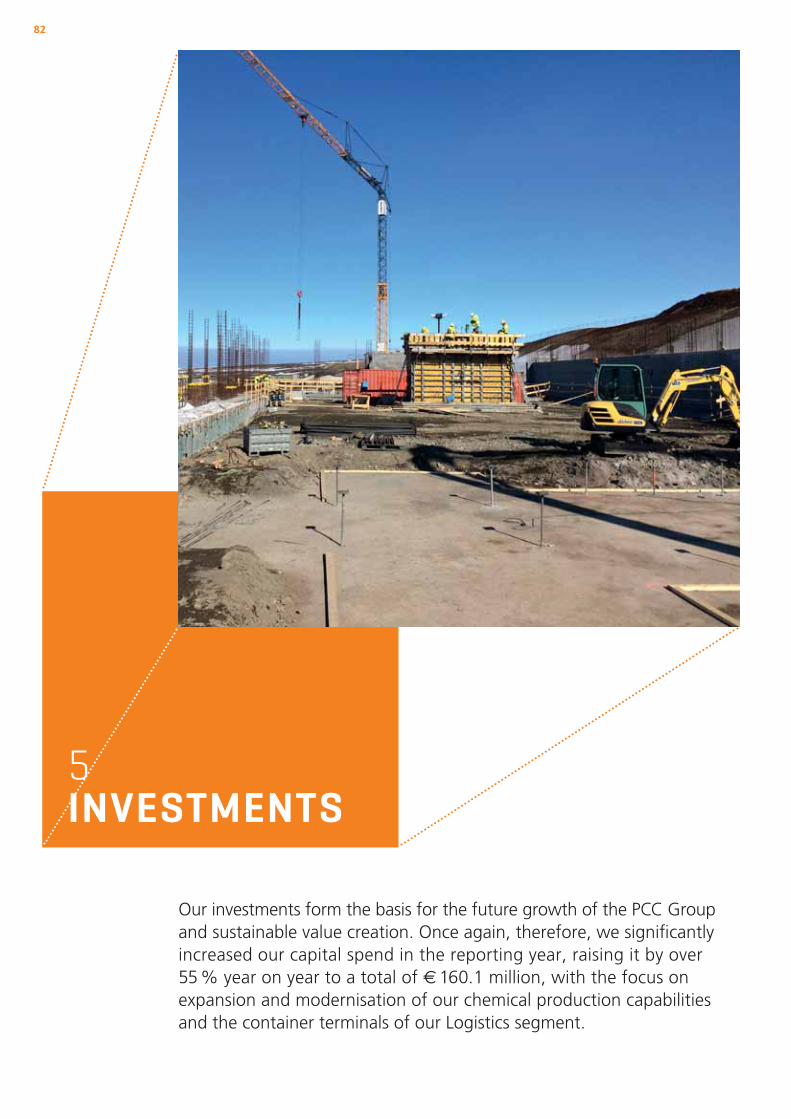
82
5 INVESTMENTS
Our investments form the basis for the future growth of the PCC Group and sustainable value creation. Once again, therefore, we signifi cantly increased our capital spend in the reporting year, raising it by over 55 % year on year to a total of € 160.1 million, with the focus on expansion and modernisation of our chemical production capabilities and the container terminals of our Logistics segment.
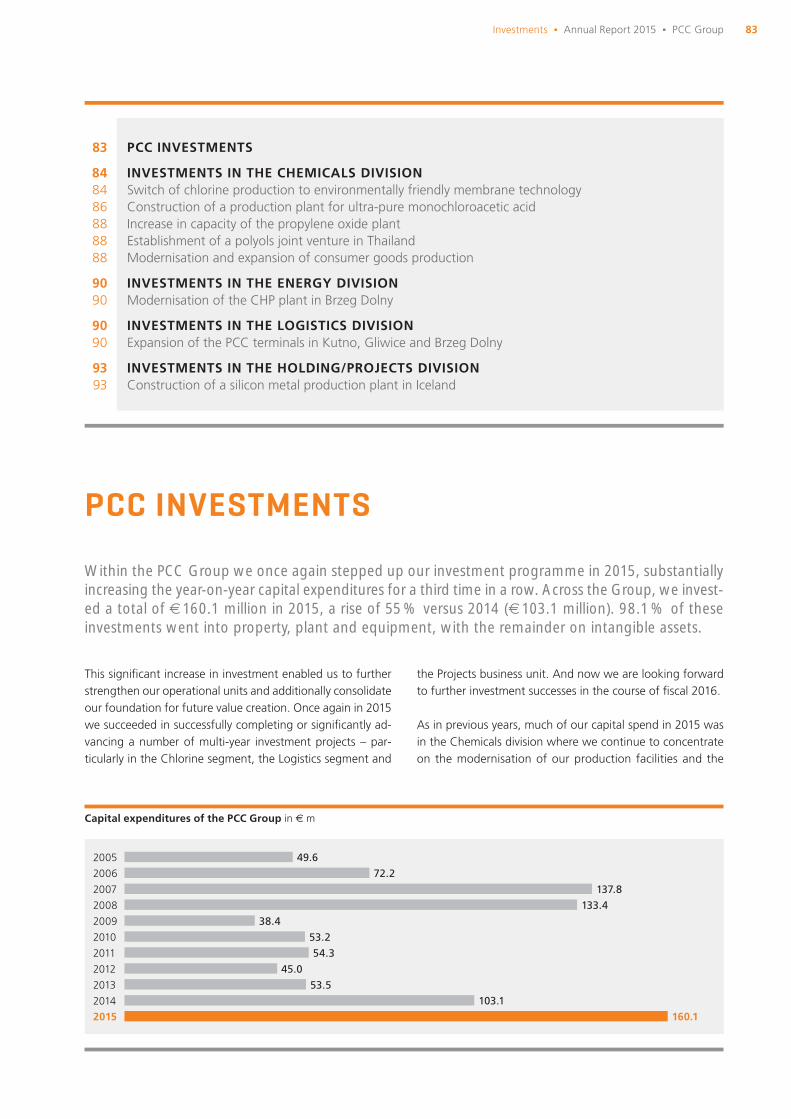
83Investments Δ Annual Report 2015 Δ PCC Group
This signifi cant increase in investment enabled us to further strengthen our operational units and additionally consolidate our foundation for future value creation. Once again in 2015 we succeeded in successfully completing or signifi cantly ad-vancing a number of multi-year investment projects – par-ticularly in the Chlorine segment, the Logistics segment and
the Projects business unit. And now we are looking forward to further investment successes in the course of fi scal 2016.
As in previous years, much of our capital spend in 2015 was in the Chemicals division where we continue to concentrate on the modernisation of our production facilities and the
PCC INVESTMENTS
PCC INVESTMENTS
INVESTMENTS IN THE CHEMICALS DIVISIONSwitch of chlorine production to environmentally friendly membrane technologyConstruction of a production plant for ultra-pure monochloroacetic acid Increase in capacity of the propylene oxide plantEstablishment of a polyols joint venture in ThailandModernisation and expansion of consumer goods production
INVESTMENTS IN THE ENERGY DIVISIONModernisation of the CHP plant in Brzeg Dolny
INVESTMENTS IN THE LOGISTICS DIVISIONExpansion of the PCC terminals in Kutno, Gliwice and Brzeg Dolny
INVESTMENTS IN THE HOLDING/PROJECTS DIVISION Construction of a silicon metal production plant in Iceland
83
848486888888
9090
9090
9393
Within the PCC Group we once again stepped up our investment programme in 2015, substantially increasing the year-on-year capital expenditures for a third time in a row. Across the Group, we invest- ed a total of € 160.1 million in 2015, a rise of 55 % versus 2014 (€ 103.1 million). 98.1 % of these investments went into property, plant and equipment, with the remainder on intangible assets.
137.82007
72.22006
38.42009
49.62005
133.42008
53.22010
54.32011
45.02012
53.52013
103.12014
160.12015
Capital expenditures of the PCC Group in € m
84 PCC Group Δ Annual Report 2015 Δ Investments
development of new capacities. For example, we made major progress in 2015 with the construction of a production plant for MCAA (monochloroacetic acid) at our largest chemicals site in Brzeg Dolny, Lower Silesia (Poland). The fi nal commis-sioning of this facility, with which we will signifi cantly extend our value chain in the Chlorine segment, is scheduled for the middle of 2016. A further focus of investment activity in this segment in recent years has been the switch of our chlor-alkali electrolysis process to environmentally friendly and energy-effi cient membrane technology. The second and therefore last phase of this modernisation project was com-pleted in the fi rst quarter of 2015, enabling us to commission the complete membrane electrolysis complex in April 2015.
Among the projects being undertaken in the Polyols segment is that of expanding the Polyurethane Systems business unit. The associated products, for example our roof-insulating spray foam system, are being marketed in the German-speaking countries of Europe and the Benelux union by PCC Prodex GmbH out of its offi ces in Essen (Germany). This subsidiary has also started to manufacture specialised fl exible foam systems for these markets at its Essen site. Within the Consumer Products seg-ment, PCC Consumer Products Kosmet Sp. z o.o. completed the modernisation and expansion work on its production facilities for laundry and home care detergent products in Brzeg Dolny.
Once again in the year under review, the Logistics segment un-dertook a number of strategic investments involving our con-tainer terminals. Following expansion of the handling facility in Frankfurt (Oder) in December 2014, last year we completed expansion and modernisation investments at another three ter-minals: in June we completed provisionally the last expansion phase at the terminal in Kutno, Poland; September saw com-pletion of the expansion work on the terminal at our chemicals site in Brzeg Dolny, and in December 2015 we also fi nished upgrading the terminal in Gliwice, with Kutno and Gliwice also each benefi ting from the installation of two new gantry cranes.
Within the Holding/Projects segment, we began in June 2015 with the construction of a production plant for silicon metal in Iceland. The building work has so far remained on schedule and within budget. Overall, the investment volume for this project amounts to around US$ 300 million (approx. € 265 million). We expect the plant to be up and running in 2018.
For 2016, we also anticipate positive developments with respect to our project involving the construction of a plant for the man-ufacture of ultra-pure dimethyl ether (DME) in Russia which we are pursuing together with a long-standing Russian partner. Also in the Chemicals division, further production lines for the Polyols segment are likewise expected to be completed. For more details on these and other projects, please read on.
INVESTMENTS IN THE CHEMICALS DIVISION
SWITCH OF CHLORINE PRODUCTION TO ENVIRONMENTALLY FRIENDLY MEMBRANE TECHNOLOGY
In April 2015, PCC Rokita SA was able to complete the tech-nological switch of its chlorine production process to mod-ern, environmentally friendly and energy-effi cient membrane technology. This initially involved shutting down, at the be-ginning of March, the entire plant operating on the basis of the conventional amalgam process. Following this brief standstill, the new facilities were commissioned at the end of March, with all four electrolysers successively started up. First came the recommissioning of the two electrolysers serv-ing membrane electrolysis plant 1 which had already been in productive service since 2010. Then, at the beginning of
April, the two recently installed and completed electrolysers of membrane electrolysis plant 2 also went into operation to conclude the switch-over.
Subsequently, as scheduled in mid-July 2015, PCC Rokita further increased the capacity of its chlorine production plant. Marking the fi nal phase of installation of the new chlor-alkali electrolysis capability, this involved adding a fi fth electrolyser to the new membrane electrolysis complex. In all, this new technology has enabled PCC Rokita to increase its annual capacity from 120,000 metric tons of chlorine to 135,000 metric tons, and from 135,000 metric tons of caustic soda to 152,000 metric tons, that is to say by more than 12 % in each case. Further process optimisations are planned for 2016, and these are expected to further increase capacity by more than 10 % in respect of each of the two products.

Rafał BoguckiPlant Manager of the Chlorine Business Unit of PCC Rokita SA, Brzeg Dolny (Poland)
»THE BIGGEST STRENGTH OF OUR CHLORINE SEGMENT LIES IN THE PEOPLE WHO WORK HERE. THEIR COMMITMENT AND KNOWLEDGE AREINDISPENSABLE TO OUR OPERATION.«
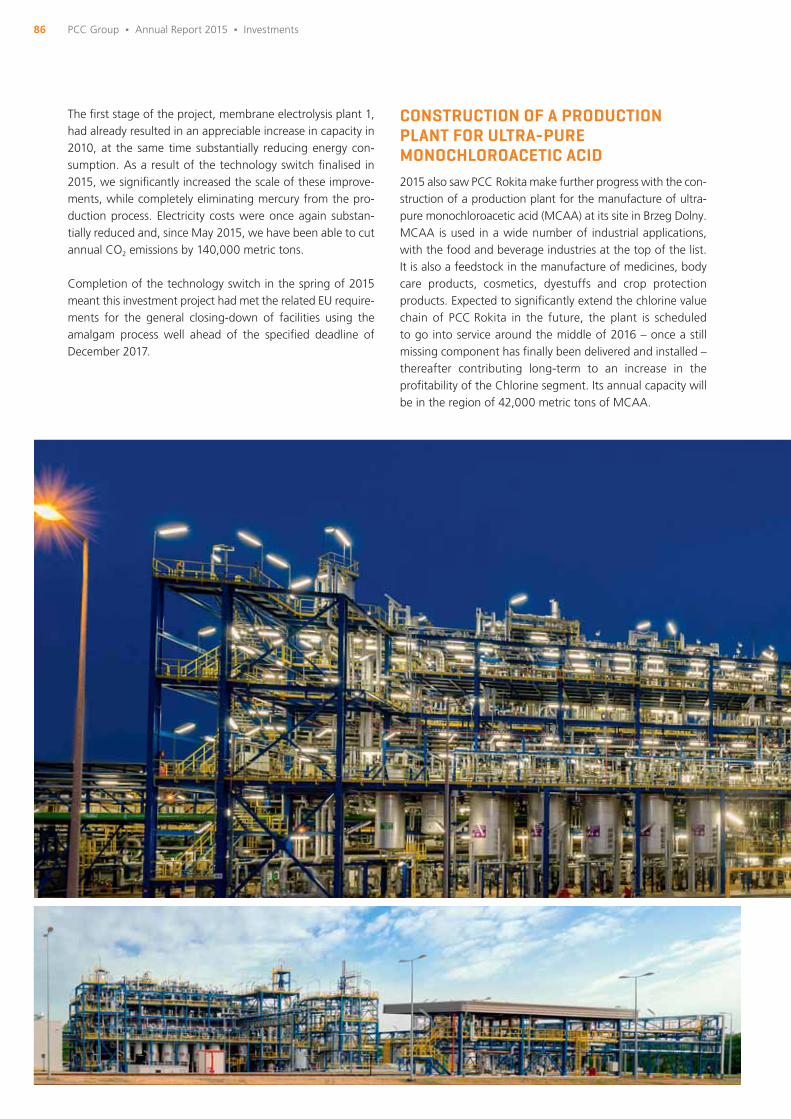
86
The fi rst stage of the project, membrane electrolysis plant 1, had already resulted in an appreciable increase in capacity in 2010, at the same time substantially reducing energy con-sumption. As a result of the technology switch fi nalised in 2015, we signifi cantly increased the scale of these improve-ments, while completely eliminating mercury from the pro-duction process. Electricity costs were once again substan-tially reduced and, since May 2015, we have been able to cut annual CO2 emissions by 140,000 metric tons.
Completion of the technology switch in the spring of 2015 meant this investment project had met the related EU require-ments for the general closing-down of facilities using the amalgam process well ahead of the specifi ed deadline of December 2017.
CONSTRUCTION OF A PRODUCTION PLANT FOR ULTRA-PURE MONOCHLOROACETIC ACID2015 also saw PCC Rokita make further progress with the con-struction of a production plant for the manufacture of ultra-pure monochloroacetic acid (MCAA) at its site in Brzeg Dolny. MCAA is used in a wide number of industrial applications, with the food and beverage industries at the top of the list. It is also a feedstock in the manufacture of medicines, body care products, cosmetics, dyestuffs and crop protection products. Expected to signifi cantly extend the chlorine value chain of PCC Rokita in the future, the plant is scheduled to go into service around the middle of 2016 – once a still missing component has fi nally been delivered and installed – thereafter contributing long-term to an increase in the profi tability of the Chlorine segment. Its annual capacity will be in the region of 42,000 metric tons of MCAA.
PCC Group Δ Annual Report 2015 Δ Investments
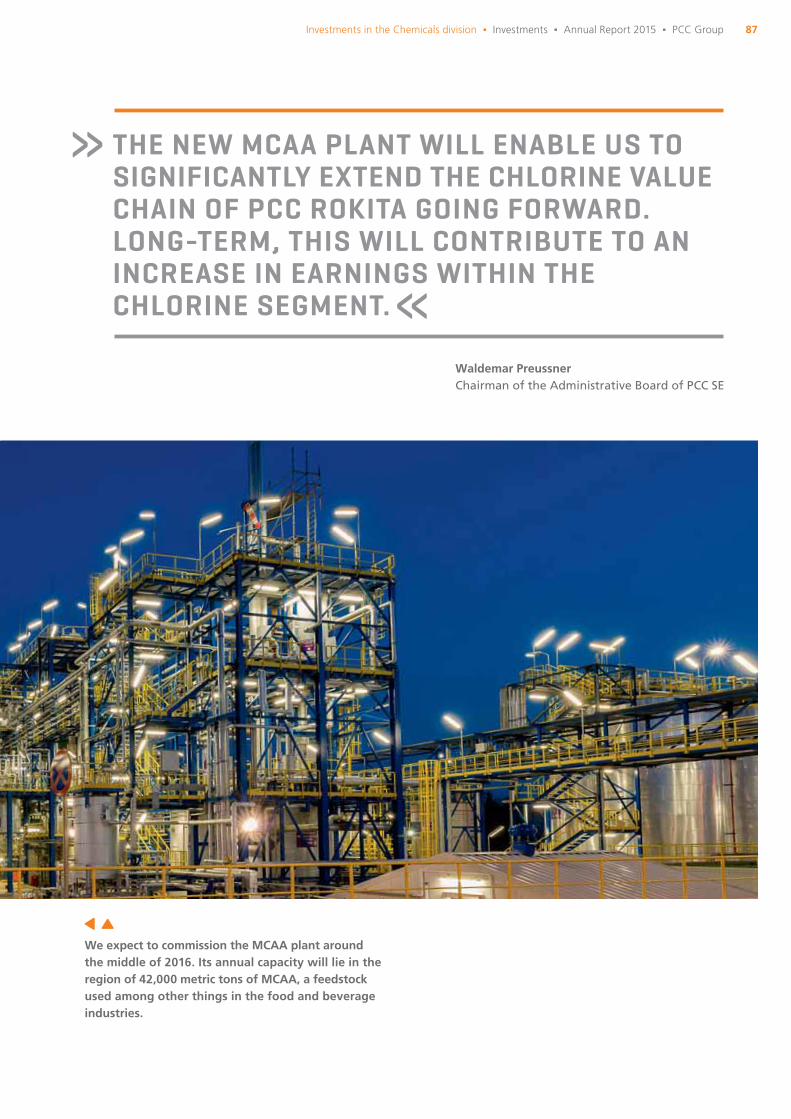
87Investments in the Chemicals division Δ Investments Δ Annual Report 2015 Δ PCC Group
» THE NEW MCAA PLANT WILL ENABLE US TO SIGNIFICANTLY EXTEND THE CHLORINE VALUE CHAIN OF PCC ROKITA GOING FORWARD. LONG-TERM, THIS WILL CONTRIBUTE TO AN INCREASE IN EARNINGS WITHIN THE CHLORINE SEGMENT.«
Waldemar Preussner Chairman of the Administrative Board of PCC SE
We expect to commission the MCAA plant around the middle of 2016. Its annual capacity will lie in the region of 42,000 metric tons of MCAA, a feedstock used among other things in the food and beverage industries.
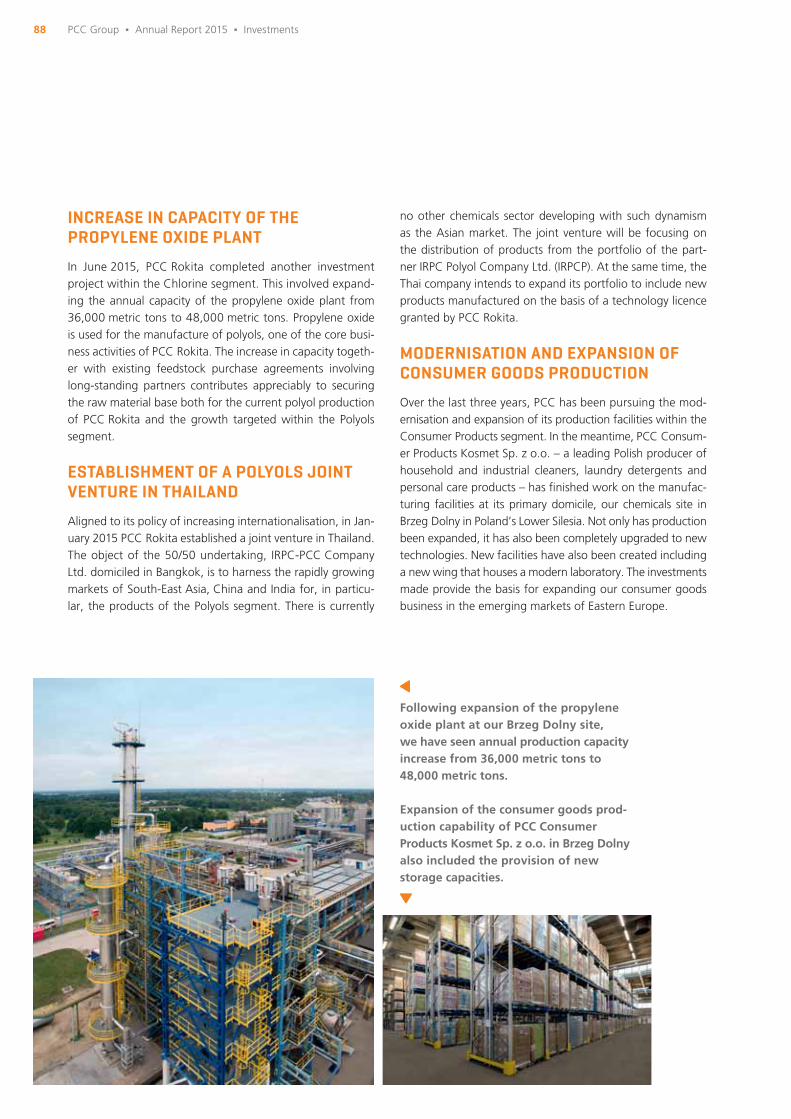
88
INCREASE IN CAPACITY OF THE PROPYLENE OXIDE PLANT
In June 2015, PCC Rokita completed another investment project within the Chlorine segment. This involved expand-ing the annual capacity of the propylene oxide plant from 36,000 metric tons to 48,000 metric tons. Propylene oxide is used for the manufacture of polyols, one of the core busi-ness activities of PCC Rokita. The increase in capacity togeth-er with existing feedstock purchase agreements involving long-standing partners contributes appreciably to securing the raw material base both for the current polyol production of PCC Rokita and the growth targeted within the Polyols segment.
ESTABLISHMENT OF A POLYOLS JOINT VENTURE IN THAILAND
Aligned to its policy of increasing internationalisation, in Jan-uary 2015 PCC Rokita established a joint venture in Thailand. The object of the 50/50 undertaking, IRPC-PCC Company Ltd. domiciled in Bangkok, is to harness the rapidly growing markets of South-East Asia, China and India for, in particu-lar, the products of the Polyols segment. There is currently
no other chemicals sector developing with such dynamism as the Asian market. The joint venture will be focusing on the distribution of products from the portfolio of the part-ner IRPC Polyol Company Ltd. (IRPCP). At the same time, the Thai company intends to expand its portfolio to include new products manufactured on the basis of a technology licence granted by PCC Rokita.
MODERNISATION AND EXPANSION OF CONSUMER GOODS PRODUCTION
Over the last three years, PCC has been pursuing the mod-ernisation and expansion of its production facilities within the Consumer Products segment. In the meantime, PCC Consum-er Products Kosmet Sp. z o.o. – a leading Polish producer of household and industrial cleaners, laundry detergents and personal care products – has fi nished work on the manufac-turing facilities at its primary domicile, our chemicals site in Brzeg Dolny in Poland’s Lower Silesia. Not only has production been expanded, it has also been completely upgraded to new technologies. New facilities have also been created including a new wing that houses a modern laboratory. The investments made provide the basis for expanding our consumer goods business in the emerging markets of Eastern Europe.
Following expansion of the propylene oxide plant at our Brzeg Dolny site, we have seen annual production capacity increase from 36,000 metric tons to 48,000 metric tons.
Expansion of the consumer goods prod-uction capability of PCC Consumer Products Kosmet Sp. z o.o. in Brzeg Dolny also included the provision of new storage capacities.
PCC Group Δ Annual Report 2015 Δ Investments
Soh Bee HongGeneral Manager of IRPC-PCC Co. Ltd., Bangkok (Thailand)
»I AM FASCINATED BY THE WAY WE SUCCEED IN DIFFERENTIATING OURSELVES FROM LARGER COMPETITORS ON THE GLOBAL MARKET.«

INVESTMENTS IN THE LOGISTICS DIVISION
EXPANSION OF THE PCC TERMINALS IN KUTNO, GLIWICE AND BRZEG DOLNY
As in the previous year, PCC Intermodal S.A., headquartered in Gdynia (Poland) and the largest company of our Logistics division, was able to make signifi cant progress in 2015 with the expansion of its container terminals. Following comple-tion of the terminal upgrade project in Frankfurt (Oder) in December 2014, three further terminal expansion and mod-
ernisation projects have been successfully concluded at our Polish sites in Kutno, Brzeg Dolny and Gliwice. PCC Intermodalis one of the leading combined transport service-providers in Poland and is excellently positioned within this fast-growing logistics market. The four investment projects completed in just 13 months mean that we are now able to once again accelerate the already high growth rate of this affi liate, with our Polish terminals counting among the most advanced in the country.
INVESTMENTS IN THE ENERGY DIVISION
MODERNISATION OF THE CHP PLANT IN BRZEG DOLNY
The combined heat and power plant of PCC Rokita SA is an advanced example of cogeneration technology. Managed under the Conventional Energies business unit, it is located at our chemicals site in Brzeg Dolny. This unit not only supplies our own production facilities but also provides the majority of households in Brzeg Dolny with heat. At the beginning of this year, PCC Rokita continued its modernisation with the installation of a further advanced electrostatic precipitator
to fi lter dust emanating from the plant. One such fi lter had already been installed in 2015 with the fi rst phase of con-struction. The dust emissions were signifi cantly reduced as a result and are already below the new EU limits which will come into force in Poland as from 2020.
Within the Renewable Energies business unit, we expect to start construction in 2016 of a further environmentally friendlysmall hydropower plant in the Republic of Macedonia where four such facilities have already been commissioned in the course of 2013 and 2014.
The advanced CHP plant EC-3 is equipped with two steam generators.

Wojciech SkrzypińskiTerminal Director of PCC Intermodal S.A., Kutno (Poland)
»WITH KUTNO HAVING GROWN SO FAST, TODAY WE CAN SAY WE OPERATE THE MOST ADVANCED INLAND CONTAINER TERMINAL IN POLAND.«
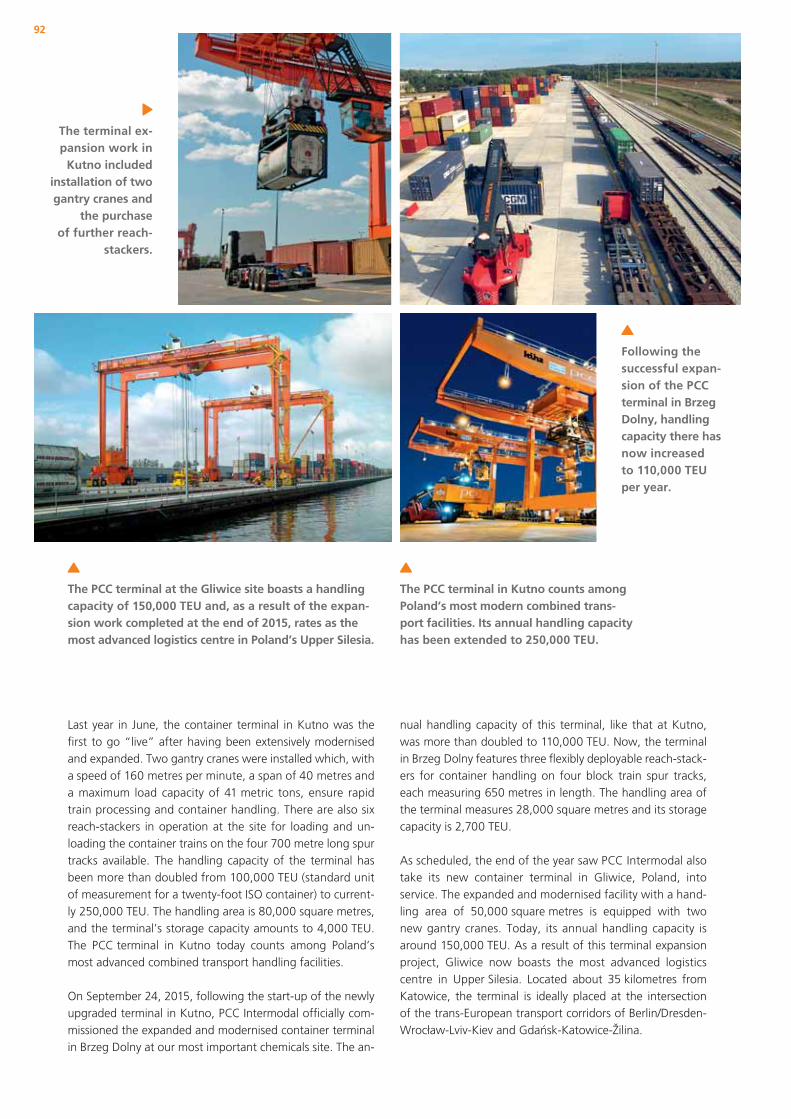
92
Last year in June, the container terminal in Kutno was the fi rst to go “live” after having been extensively modernised and expanded. Two gantry cranes were installed which, with a speed of 160 metres per minute, a span of 40 metres and a maximum load capacity of 41 metric tons, ensure rapid train processing and container handling. There are also six reach-stackers in operation at the site for loading and un-loading the container trains on the four 700 metre long spur tracks available. The handling capacity of the terminal has been more than doubled from 100,000 TEU (standard unit of measurement for a twenty-foot ISO container) to current-ly 250,000 TEU. The handling area is 80,000 square metres, and the terminal’s storage capacity amounts to 4,000 TEU. The PCC terminal in Kutno today counts among Poland’s most advanced combined transport handling facilities.
On September 24, 2015, following the start-up of the newly upgraded terminal in Kutno, PCC Intermodal offi cially com-missioned the expanded and modernised container terminal in Brzeg Dolny at our most important chemicals site. The an-
nual handling capacity of this terminal, like that at Kutno, was more than doubled to 110,000 TEU. Now, the terminal in Brzeg Dolny features three fl exibly deployable reach-stack-ers for container handling on four block train spur tracks, each measuring 650 metres in length. The handling area of the terminal measures 28,000 square metres and its storage capacity is 2,700 TEU.
As scheduled, the end of the year saw PCC Intermodal also take its new container terminal in Gliwice, Poland, into service. The expanded and modernised facility with a hand-ling area of 50,000 square metres is equipped with two new gantry cranes. Today, its annual handling capacity is around 150,000 TEU. As a result of this terminal expansion project, Gliwice now boasts the most advanced logistics centre in Upper Silesia. Located about 35 kilometres from Katowice, the terminal is ideally placed at the intersection of the trans-European transport corridors of Berlin/Dresden-Wrocław-Lviv-Kiev and Gdańsk-Katowice-Žilina.
Following the successful expan-sion of the PCC terminal in Brzeg Dolny, handling capacity there has now increased to 110,000 TEU per year.
The PCC terminal at the Gliwice site boasts a handling capacity of 150,000 TEU and, as a result of the expan-sion work completed at the end of 2015, rates as the most advanced logistics centre in Poland’s Upper Silesia.
The PCC terminal in Kutno counts among Poland’s most modern combined trans-port facilities. Its annual handling capacity has been extended to 250,000 TEU.
The terminal ex-pansion work in
Kutno included installation of two gantry cranes and
the purchase of further reach-
stackers.
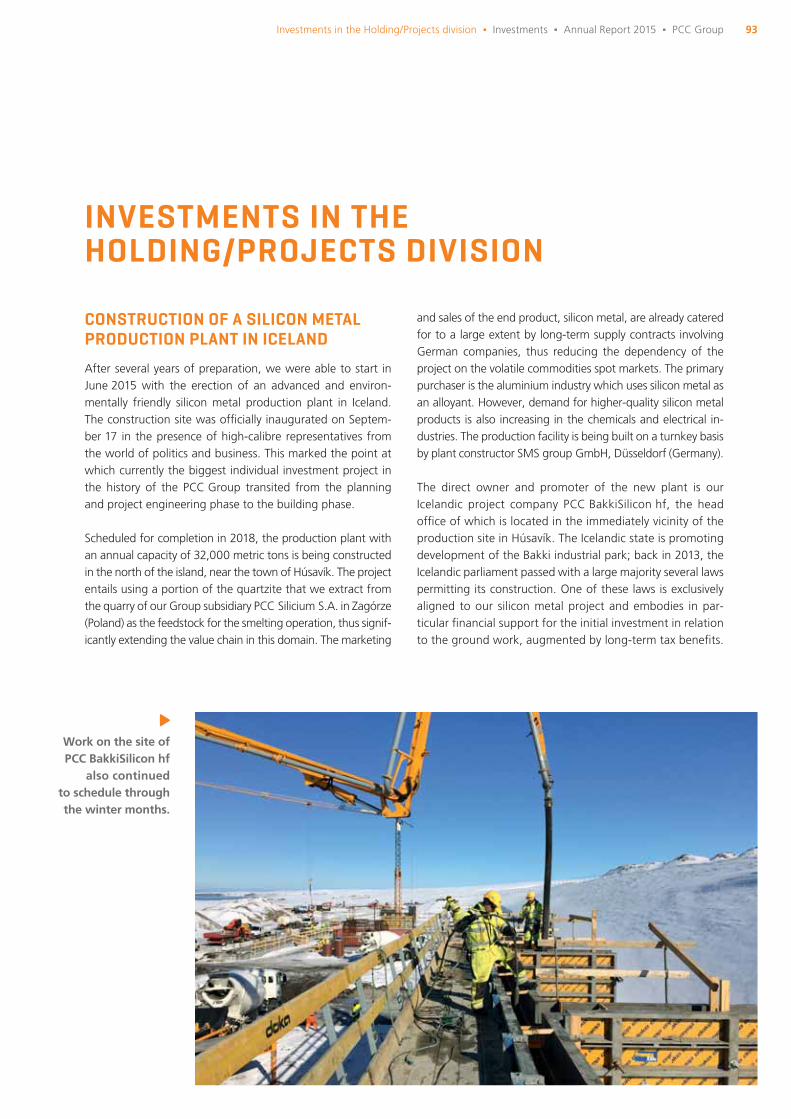
93
INVESTMENTS IN THE HOLDING/PROJECTS DIVISION
CONSTRUCTION OF A SILICON METAL PRODUCTION PLANT IN ICELAND
After several years of preparation, we were able to start in June 2015 with the erection of an advanced and environ-mentally friendly silicon metal production plant in Iceland. The construction site was offi cially inaugurated on Septem-ber 17 in the presence of high-calibre representatives from the world of politics and business. This marked the point at which currently the biggest individual investment project in the history of the PCC Group transited from the planning and project engineering phase to the building phase.
Scheduled for completion in 2018, the production plant with an annual capacity of 32,000 metric tons is being constructed in the north of the island, near the town of Húsavík. The project entails using a portion of the quartzite that we extract from the quarry of our Group subsidiary PCC Silicium S.A. in Zagórze (Poland) as the feedstock for the smelting operation, thus signif-icantly extending the value chain in this domain. The marketing
and sales of the end product, silicon metal, are already catered for to a large extent by long-term supply contracts involving German companies, thus reducing the dependency of the project on the volatile commodities spot markets. The primary purchaser is the aluminium industry which uses silicon metal as an alloyant. However, demand for higher-quality silicon metal products is also increasing in the chemicals and electrical in-dustries. The production facility is being built on a turnkey basis by plant constructor SMS group GmbH, Düsseldorf (Germany).
The direct owner and promoter of the new plant is our Icelandic project company PCC BakkiSilicon hf, the head offi ce of which is located in the immediately vicinity of the production site in Húsavík. The Icelandic state is promoting development of the Bakki industrial park; back in 2013, the Icelandic parliament passed with a large majority several laws permitting its construction. One of these laws is exclusively aligned to our silicon metal project and embodies in par-ticular fi nancial support for the initial investment in relation to the ground work, augmented by long-term tax benefi ts.
Work on the site of PCC BakkiSilicon hf
also continued to schedule through the winter months.
Investments in the Holding/Projects division Δ Investments Δ Annual Report 2015 Δ PCC Group
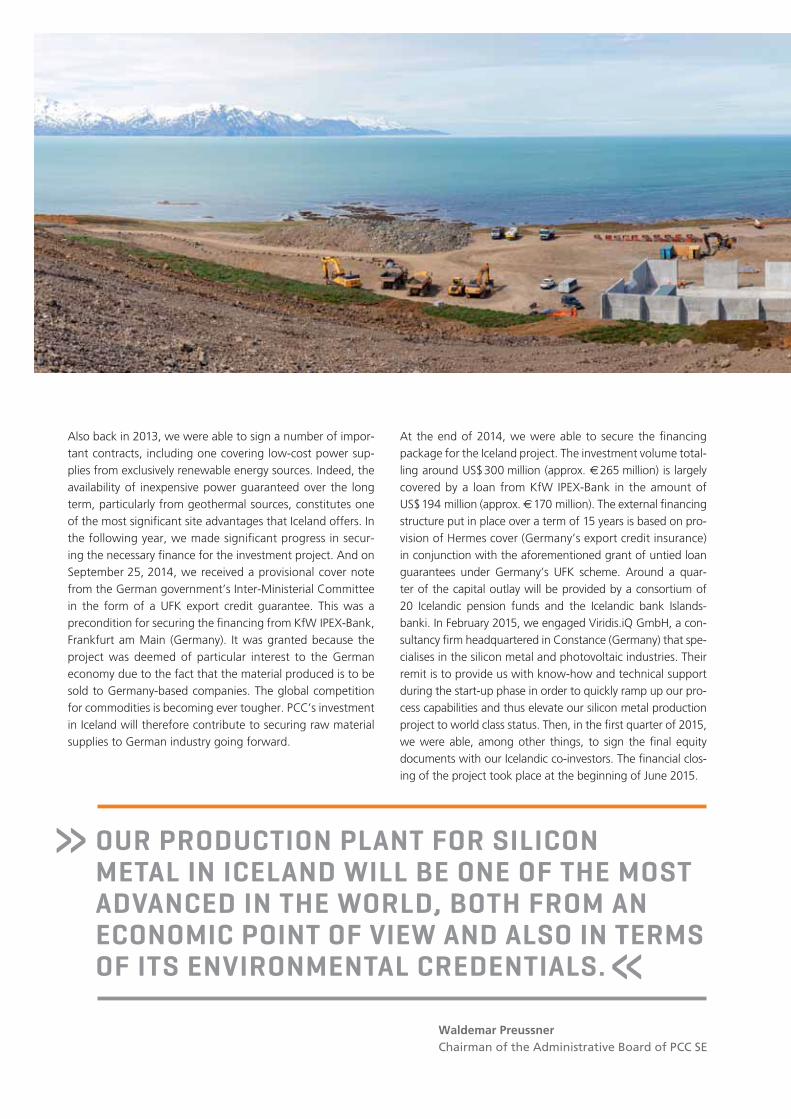
Also back in 2013, we were able to sign a number of impor-tant contracts, including one covering low-cost power sup-plies from exclusively renewable energy sources. Indeed, the availability of inexpensive power guaranteed over the long term, particularly from geothermal sources, constitutes one of the most signifi cant site advantages that Iceland offers. In the following year, we made signifi cant progress in secur-ing the necessary fi nance for the investment project. And on September 25, 2014, we received a provisional cover note from the German government’s Inter-Ministerial Committee in the form of a UFK export credit guarantee. This was a precondition for securing the fi nancing from KfW IPEX-Bank,Frankfurt am Main (Germany). It was granted because the project was deemed of particular interest to the German economy due to the fact that the material produced is to be sold to Germany-based companies. The global competition for commodities is becoming ever tougher. PCC’s investment in Iceland will therefore contribute to securing raw material supplies to German industry going forward.
At the end of 2014, we were able to secure the fi nancing package for the Iceland project. The investment volume total-ling around US$ 300 million (approx. € 265 million) is largely covered by a loan from KfW IPEX-Bank in the amount of US$ 194 million (approx. € 170 million). The external fi nancing structure put in place over a term of 15 years is based on pro-vision of Hermes cover (Germany’s export credit insurance) in conjunction with the aforementioned grant of untied loan guarantees under Germany’s UFK scheme. Around a quar-ter of the capital outlay will be provided by a consortium of 20 Icelandic pension funds and the Icelandic bank Islands-banki. In February 2015, we engaged Viridis.iQ GmbH, a con-sultancy fi rm headquartered in Constance (Germany) that spe-cialises in the silicon metal and photovoltaic industries. Their remit is to provide us with know-how and technical support during the start-up phase in order to quickly ramp up our pro-cess capabilities and thus elevate our silicon metal production project to world class status. Then, in the fi rst quarter of 2015, we were able, among other things, to sign the fi nal equity documents with our Icelandic co-investors. The fi nancial clos-ing of the project took place at the beginning of June 2015.
» OUR PRODUCTION PLANT FOR SILICON METAL IN ICELAND WILL BE ONE OF THE MOST ADVANCED IN THE WORLD, BOTH FROM AN ECONOMIC POINT OF VIEW AND ALSO IN TERMS OF ITS ENVIRONMENTAL CREDENTIALS.«
Waldemar Preussner Chairman of the Administrative Board of PCC SE
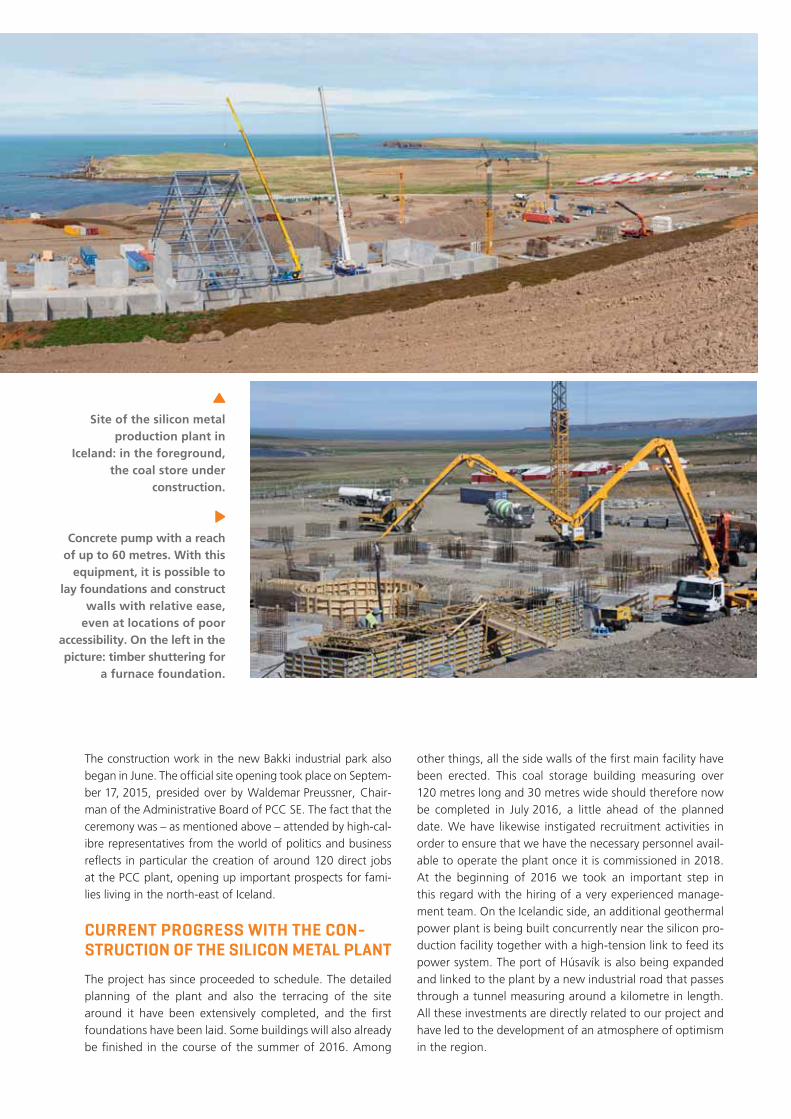
Site of the silicon metal production plant in
Iceland: in the foreground, the coal store under
construction.
The construction work in the new Bakki industrial park also began in June. The offi cial site opening took place on Septem-ber 17, 2015, presided over by Waldemar Preussner, Chair-man of the Administrative Board of PCC SE. The fact that the ceremony was – as mentioned above – attended by high-cal-ibre representatives from the world of politics and business refl ects in particular the creation of around 120 direct jobs at the PCC plant, opening up important prospects for fami-lies living in the north-east of Iceland.
CURRENT PROGRESS WITH THE CON-STRUCTION OF THE SILICON METAL PLANT
The project has since proceeded to schedule. The detailed planning of the plant and also the terracing of the site around it have been extensively completed, and the fi rst foundations have been laid. Some buildings will also already be fi nished in the course of the summer of 2016. Among
other things, all the side walls of the fi rst main facility have been erected. This coal storage building measuring over 120 metres long and 30 metres wide should therefore now be completed in July 2016, a little ahead of the planned date. We have likewise instigated recruitment activities in order to ensure that we have the necessary personnel avail-able to operate the plant once it is commissioned in 2018. At the beginning of 2016 we took an important step in this regard with the hiring of a very experienced manage-ment team. On the Icelandic side, an additional geothermal power plant is being built concurrently near the silicon pro-duction facility together with a high-tension link to feed its power system. The port of Húsavík is also being expanded and linked to the plant by a new industrial road that passes through a tunnel measuring around a kilometre in length. All these investments are directly related to our project and have led to the development of an atmosphere of optimism in the region.
Concrete pump with a reach of up to 60 metres. With this
equipment, it is possible to lay foundations and construct
walls with relative ease, even at locations of poor
accessibility. On the left in the picture: timber shuttering for
a furnace foundation.
96
6GROUP MANAGEMENT REPORT
In fi scal 2015, the PCC Group disposed of marginal activities in the telecommuni-cations sector. The resources released as a result and the proceeds from the divest-ment are now available for increasing investments in our core businesses, with the focus on developing new sales markets for existing products and transferring our know-how into new markets. Our aim is to consistently achieve further increases in gross profi t and, supported by strict cost management, improvements in earnings.
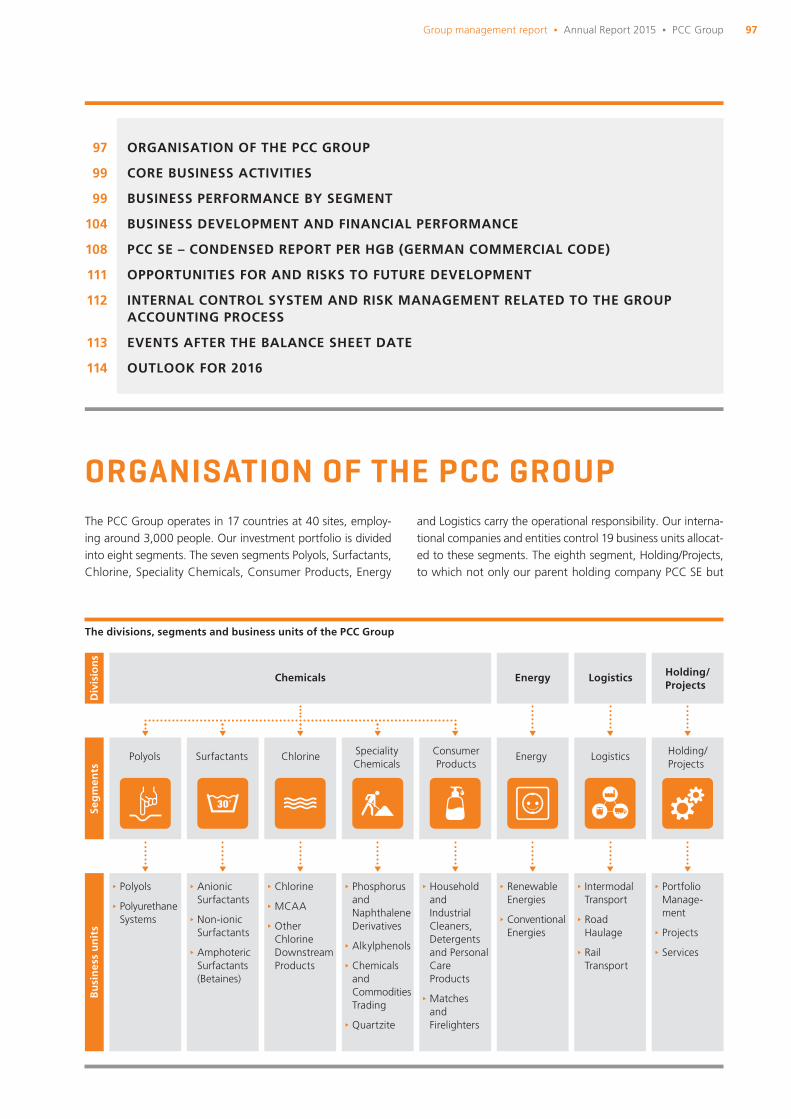
97Group management report Δ Annual Report 2015 Δ PCC Group
The PCC Group operates in 17 countries at 40 sites, employ-ing around 3,000 people. Our investment portfolio is divided into eight segments. The seven segments Polyols, Surfactants, Chlorine, Speciality Chemicals, Consumer Products, Energy
and Logistics carry the operational responsibility. Our interna-tional companies and entities control 19 business units allocat-ed to these segments. The eighth segment, Holding/Projects, to which not only our parent holding company PCC SE but
ORGANISATION OF THE PCC GROUP
ORGANISATION OF THE PCC GROUP
CORE BUSINESS ACTIVITIES
BUSINESS PERFORMANCE BY SEGMENT
BUSINESS DEVELOPMENT AND FINANCIAL PERFORMANCE
PCC SE – CONDENSED REPORT PER HGB (GERMAN COMMERCIAL CODE)
OPPORTUNITIES FOR AND RISKS TO FUTURE DEVELOPMENT
INTERNAL CONTROL SYSTEM AND RISK MANAGEMENT RELATED TO THE GROUP ACCOUNTING PROCESS
EVENTS AFTER THE BALANCE SHEET DATE
OUTLOOK FOR 2016
97
99
99
104
108
111
112
113
114
Div
isio
ns
Bu
sin
ess
un
its
Chemicals
Seg
men
ts
∂ Polyols
∂ Polyurethane Systems
Polyols
∂ Anionic Surfactants
∂ Non-ionic Surfactants
∂ Amphoteric Surfactants (Betaines)
Surfactants
∂ Chlorine
∂ MCAA
∂ Other Chlorine Downstream Products
Chlorine
∂ Phosphorus and Naphthalene Derivatives
∂ Alkylphenols
∂ Chemicals and Commodities Trading
∂ Quartzite
SpecialityChemicals
∂ Household and Industrial Cleaners, Detergents and Personal Care Products
∂ Matches and Firelighters
ConsumerProducts
∂ Renewable Energies
∂ Conventional Energies
Energy
Energy
∂ Intermodal Transport
∂ Road Haulage
∂ Rail Transport
Logistics
Logistics
∂ Portfolio Manage- ment
∂ Projects
∂ Services
Holding/Projects
Holding/Projects
The divisions, segments and business units of the PCC Group
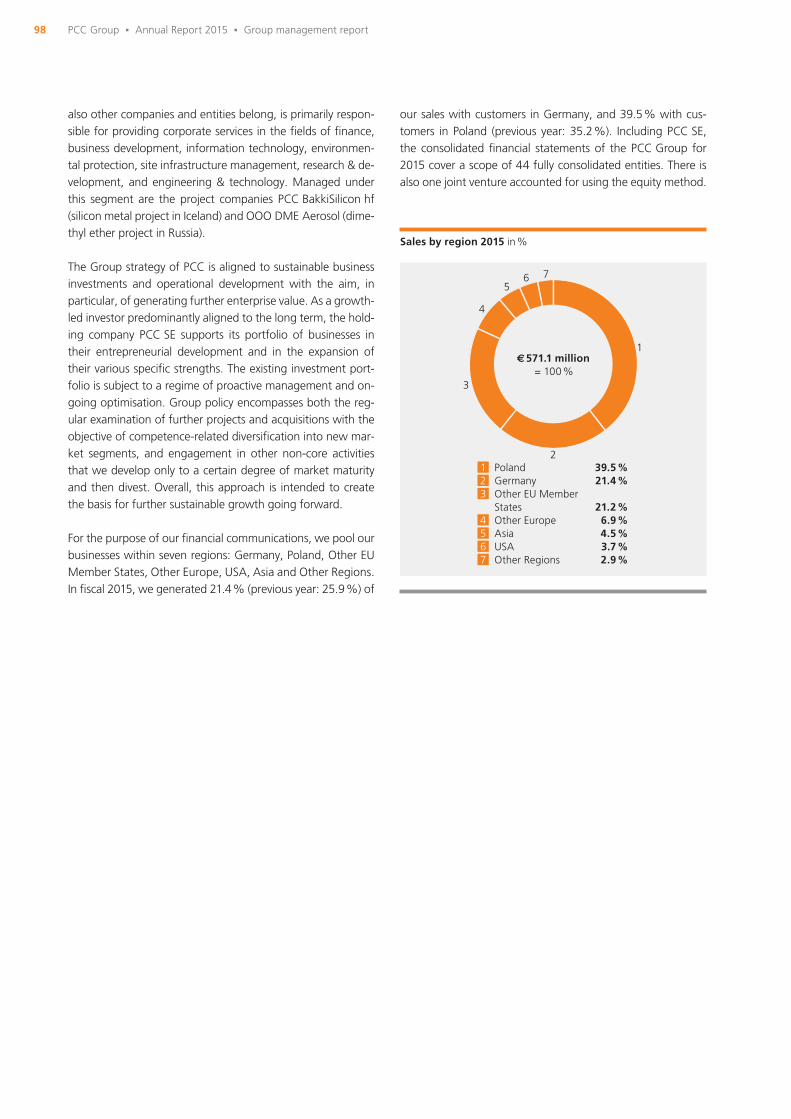
98 PCC Group Δ Annual Report 2015 Δ Group management report
also other companies and entities belong, is primarily respon-sible for providing corporate services in the fi elds of fi nance, business development, information technology, environmen-tal protection, site infrastructure management, research & de-velopment, and engineering & technology. Managed under this segment are the project companies PCC BakkiSilicon hf (silicon metal project in Iceland) and OOO DME Aerosol (dime-thyl ether project in Russia).
The Group strategy of PCC is aligned to sustainable business investments and operational development with the aim, in particular, of generating further enterprise value. As a growth-led investor predominantly aligned to the long term, the hold-ing company PCC SE supports its portfolio of businesses in their entrepreneurial development and in the expansion of their various specifi c strengths. The existing investment port-folio is subject to a regime of proactive management and on-going optimisation. Group policy encompasses both the reg-ular examination of further projects and acquisitions with the objective of competence-related diversifi cation into new mar-ket segments, and engagement in other non-core activities that we develop only to a certain degree of market maturity and then divest. Overall, this approach is intended to create the basis for further sustainable growth going forward.
For the purpose of our fi nancial communications, we pool our businesses within seven regions: Germany, Poland, Other EU Member States, Other Europe, USA, Asia and Other Regions. In fi scal 2015, we generated 21.4 % (previous year: 25.9 %) of
our sales with customers in Germany, and 39.5 % with cus-tomers in Poland (previous year: 35.2 %). Including PCC SE, the consolidated fi nancial statements of the PCC Group for 2015 cover a scope of 44 fully consolidated entities. There is also one joint venture accounted for using the equity method.
Sales by region 2015 in %
4
1
5
23
Poland 39.5 %Germany 21.4 %Other EU Member States 21.2 %Other Europe 6.9 %Asia 4.5 %USA 3.7 %Other Regions 2.9 %
67
5
1
2
3
4
6 7
571,1 Mio. € = 100 %
€ 571.1 million = 100 %
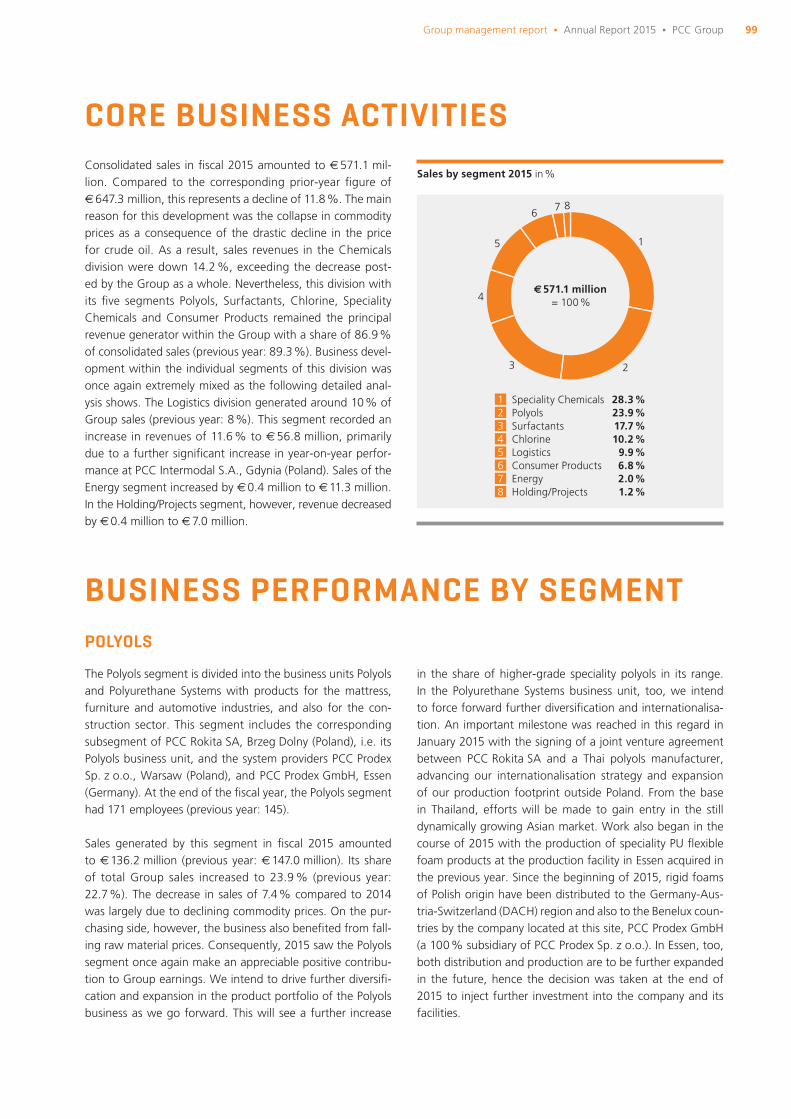
99Group management report Δ Annual Report 2015 Δ PCC Group
CORE BUSINESS ACTIVITIES Consolidated sales in fi scal 2015 amounted to € 571.1 mil-lion. Compared to the corresponding prior-year fi gure of € 647.3 million, this represents a decline of 11.8 %. The main reason for this development was the collapse in commodity prices as a consequence of the drastic decline in the price for crude oil. As a result, sales revenues in the Chemicals division were down 14.2 %, exceeding the decrease post-ed by the Group as a whole. Nevertheless, this division with its fi ve segments Polyols, Surfactants, Chlorine, Speciality Chemicals and Consumer Products remained the principal revenue generator within the Group with a share of 86.9 % of consolidated sales (previous year: 89.3 %). Business devel-opment within the individual segments of this division was once again extremely mixed as the following detailed anal-ysis shows. The Logistics division generated around 10 % of Group sales (previous year: 8 %). This segment recorded an increase in revenues of 11.6 % to € 56.8 million, primarily due to a further signifi cant increase in year-on-year perfor-mance at PCC Intermodal S.A., Gdynia (Poland). Sales of the Energy segment increased by € 0.4 million to € 11.3 million. In the Holding/Projects segment, however, revenue decreased by € 0.4 million to € 7.0 million.
BUSINESS PERFORMANCE BY SEGMENTPOLYOLS
The Polyols segment is divided into the business units Polyols and Polyurethane Systems with products for the mattress, furniture and automotive industries, and also for the con-struction sector. This segment includes the corresponding subsegment of PCC Rokita SA, Brzeg Dolny (Poland), i.e. its Polyols business unit, and the system providers PCC Prodex Sp. z o.o., Warsaw (Poland), and PCC Prodex GmbH, Essen (Germany). At the end of the fi scal year, the Polyols segment had 171 employees (previous year: 145).
Sales generated by this segment in fi scal 2015 amounted to € 136.2 million (previous year: € 147.0 million). Its share of total Group sales increased to 23.9 % (previous year: 22.7 %). The decrease in sales of 7.4 % compared to 2014 was largely due to declining commodity prices. On the pur-chasing side, however, the business also benefi ted from fall-ing raw material prices. Consequently, 2015 saw the Polyols segment once again make an appreciable positive contribu-tion to Group earnings. We intend to drive further diversifi -cation and expansion in the product portfolio of the Polyols business as we go forward. This will see a further increase
in the share of higher-grade speciality polyols in its range. In the Polyurethane Systems business unit, too, we intend to force forward further diversifi cation and internationalisa-tion. An important milestone was reached in this regard in January 2015 with the signing of a joint venture agreement between PCC Rokita SA and a Thai polyols manufacturer, advancing our internationalisation strategy and expansion of our production footprint outside Poland. From the base in Thailand, efforts will be made to gain entry in the still dynamically growing Asian market. Work also began in the course of 2015 with the production of speciality PU fl exible foam products at the production facility in Essen acquired in the previous year. Since the beginning of 2015, rigid foams of Polish origin have been distributed to the Germany-Aus-tria-Switzerland (DACH) region and also to the Benelux coun-tries by the company located at this site, PCC Prodex GmbH (a 100 % subsidiary of PCC Prodex Sp. z o.o.). In Essen, too, both distribution and production are to be further expanded in the future, hence the decision was taken at the end of 2015 to inject further investment into the company and its facilities.
Sales by segment 2015 in %
8
5
6
1
2
7
3
4
5
1
678
234
Speciality Chemicals 28.3 %Polyols 23.9 %Surfactants 17.7 %Chlorine 10.2 %Logistics 9.9 %Consumer Products 6.8 %Energy 2.0 %Holding/Projects 1.2 %
€ 571.1 million = 100 %
100 PCC Group Δ Annual Report 2015 Δ Group management report
SURFACTANTS
The Surfactants segment generated sales of € 101.1 million in 2015. Compared to the prior-year fi gure of € 98.8 mil-lion, this represents an increase of 2.3 %. As a result, the share of total sales revenues posted by the PCC Group rose year on year from 15.3 % to 17.7 %. The Surfactants segment comprises the business units Anionic Surfactants, Non-ionic Surfactants and Amphoteric Surfactants (Be-taines). These products are used in the manufacture of laundry and homecare detergents, household cleaners, cosmetics and body care products, and also paints, inks and coatings. Organised under this segment are the com-panies PCC Exol SA, Brzeg Dolny (Poland), PCC Chemax, Inc., Piedmont (South Carolina, USA), and Tensis Sp. z o.o., likewise domiciled in Brzeg Dolny. The latter affi liate was merged at the end of the year with PCC Exol SA. As of the end of 2015, the number of people working in the Sur-factants segment was 259 (previous year: 243).
Overall, the Surfactants product segment was able to signif-icantly improve its performance compared to the previous year. Although sales here also fell below our expectations due to the low commodity price levels prevailing, on the purchasing side this price drop had, in some cases, an even stronger infl uence. The increased share of higher-grade products in the portfolio of PCC Exol SA also exerted a positive effect on margin development. As a consequence, PCC Exol SA closed fi scal 2015 with a substantially positive result that exceeded our expectations. The US American subsidiary of PCC Exol SA, PCC Chemax, Inc., also made a positive contribution to earnings, albeit below plan due primarily to the signifi cant decline in sales of chemicals for the oil fi eld industry – the previous main customer sector of PCC Chemax, Inc. In 2015, therefore, this portfolio compa-ny switched its endeavour to the development of products for a broader range of applications. In addition, cooperation with PCC Exol SA (including in the distribution of PCC Exol products in the American market) was further expanded in 2015. Similar to the Polyols segment, the PCC Group is engaged in a strategy of increasing internationalisation for the Surfactants segment. Thus, collaborations and produc-tion projects are being pursued both in Eastern Europe and in the Asian market.
CHLORINE
We generated sales in the Chlorine segment of € 58.3 mil-lion, a decrease of 13.9 % year on year. This segment is di-vided into three business units: Chlorine, MCAA (monochlo-roacetic acid) and Other Downstream Chlorine Products, the latter serving primarily as a feedstock provider to other man-ufacturing business units within the Group. Allocated to the Chlorine segment is the corresponding Chlorine business unit of PCC Rokita SA, plus MCAA SE, likewise located in Brzeg Dolny, and PCC MCAA Sp. z o.o., again at the same site. At
the end of the year under review, there were 344 people working within this segment (previous year: 245).
The decline in sales in the Chlorine segment is essentially due to extended downtimes as a result of the switch of the second and thus last chlor-alkali electrolysis facility to envi-ronmentally friendly and signifi cantly more energy-effi cient membrane technology. The changeover process was suc-cessfully completed in the fi rst half of 2015. In addition, a fi fth electrolyser was incorporated into the plant in July 2015, increasing production capacity by more than 12 %. Further process optimisations are planned for 2016. The Chlorine segment nevertheless ended 2015 positively and above plan. However, as expected it was unable to reach the earnings fi gure of the previous year. Aside from the already men-tioned downtimes, a further cause lay in temporary interrup-tions in the power supply: an extreme heat wave meant that, in summer 2015, the Polish power plants were in some cases forbidden from discharging their cooling water into the riv-ers. As a result, there were power interruptions across all of Poland’s industry, with production outages ensuing.
The second major investment in this segment, namely the construction of a production plant for MCAA, was exten-sively completed in the course of 2015. However, fi nal commissioning was delayed due to delivery of an incorrect component. With this plant, the value chain of the Chlorine segment will, in future, be signifi cantly extended.
SPECIALITY CHEMICALS
The Speciality Chemicals segment realised sales of € 161.7 mil-lion in the year under review, representing a decrease of € 60.3 million or 27.2 % versus the prior-year fi gure. Never-theless, this segment remains the biggest revenue generator in the Group. It comprises the business units Phosphorus and Naphthalene Derivatives, Alkylphenols, and Chemicals and Commodities Trading. The Quartzite business unit also belongs to this segment as of the introduction of the new Group structure on January 1, 2013. Attributable to the Speciality Chemicals segment and business units is the cor-responding business subsegment of PCC Rokita SA, that is to say its Phosphorus and Naphthalene Derivatives business unit, together with the following companies: PCC Synteza S.A., Kędzierzyn-Koźle (Poland), PCC Trade & Services GmbH, Duisburg (Germany), PCC Morava-Chem s.r.o., Český Těšín (Czech Republic), ZAO Novobalt Terminal, Kaliningrad (Russia), PCC Silicium S.A., Zagórze (Poland), and S.C. Euro-Urethane S.R.L., Râmnicu Vâlcea (Romania). The Speciality Chemicals segment had 363 employees as of the end of the reporting year (previous year: 380).
The two trading companies PCC Trade & Services GmbH and PCC Morava-Chem s.r.o. had to absorb signifi cant decreases in sales in 2015, due primarily to the low commodity price levels prevailing. Increasing raw material imports from China
101Business performance by segment Δ Group management report Δ Annual Report 2015 Δ PCC Group
(particularly coke) and the continuing weakness of the steel industry due to existing overcapacities led to additional price pressure in the course of the year. Nevertheless, at least PCC Trade & Services GmbH was once again able to end fi s-cal 2015 with a positive result. PCC Morava-Chem s.r.o., on the other hand, closed the period under review with a loss, due among other things to one of its biggest customers de-claring insolvency. The alkylphenols manufacturer PCC Syn-teza S.A. and the Phosphorus and Naphthalene Derivatives business unit of PCC Rokita SA were able to benefi t from low prices for their raw materials in 2015 and – following losses in the previous period – succeeded in generating a positive earnings result for the year. In the case of PCC Syn-teza S.A., at least, this upward trend also continued through into the new fi scal year, with an additional boost coming from the expansion of alternative production facilities (in-cluding in cooperation with PCC Rokita SA) which is being progressed by PCC SE. In the Phosphorus and Naphthalene Derivatives business unit, on the other hand, competition became even stiffer at the beginning of the new fi scal year, with both Chinese and Russian suppliers having an impact.
As expected, PCC Silicium S.A. closed fi scal 2015 with anoth-er loss. The main cause of this has been the need to reserve a proportion of the quartzite quarry output of this affi liate so that higher-grade material is available for processing once the silicon metal project of PCC BakkiSilicon hf, Húsavík (Ice-land), comes to fruition. Hence certain rock strata have been set aside for PCC Silicium S.A., leading to more lower-quality quartzite grades also having to be excavated. This, in turn, gives rise to more spoil for disposal in landfi ll sites, increasing the costs that the affi liate has to bear. The long-term objec-tive remains to use certain, already defi ned quartzite grades for the manufacture of silicon metal in the production plant in Iceland that has been under construction since the middle of 2015. After a successful closing of this project, PCC SE therefore awarded a contract for the development of a cor-responding mining concept for PCC Silicium S.A., and has also now issued a commitment to fi nance the investments necessary for this.
The Speciality Chemicals segment also includes the affi liate S.C. Euro-Urethane S.R.L. In 2015 and on the initiative of PCC SE, this portfolio company began liquidation of all the assets that it no longer requires. As a result, S.C. Euro-Ure-thane was at least able to generate a degree of cash fl ow in the course of the year. However, the future of this affi liate remains heavily dependent on the further development of our second Romanian investment, S.C. Oltchim S.A., Râm-nicu Vâlcea (PCC SE shareholding: 32.34 %), which is also a shareholder of S.C. Euro-Urethane. The assets of S.C. Olt-chim S.A. were put into administered insolvency under Ro-manian law in January 2013. As a result, the book value of this shareholding amounting to around € 20 million was completely written off from the balance sheet of PCC SE as of December 31, 2012. In the meantime, the administrator
has presented a restructuring plan which was approved by a meeting of creditors in March 2015, with confi rmation from the Insolvency Court coming on April 22, 2015. The compa-ny has at least 36 months from that date to implement this plan. An extension of a further 12 months is possible and cur-rently appears probable. The debt level of the company was also cut back in 2015, as a result of which S.C. Oltchim S.A. was able to end 2015 with a positive result. The company primarily produces caustic soda, polyols and oxo alcohols. The published plan for the company envisages further pro-duction increases for 2016 together with another positive earnings result. As of September 30, 2015, the shares of S.C. Oltchim S.A. are also again being traded on the Bucha-rest Stock Exchange (BVB). The price curve shows an upward trend which also continued into the new fi scal year. Against this background, the share package of this company was val-ued in our consolidated fi nancial statements for 2015 at fair value in the amount of € 9.6 million as a write-back of the amount written off as of December 31, 2012.
CONSUMER PRODUCTS
In the year under review, the Consumer Products segment generated sales of € 38.6 million, representing a decrease of € 3.9 million year on year. Its share of consolidated sales amounted to 6.8 % (previous year: 6.6 %). The Consumer Products segment is divided into two business units, one being the Household and Industrial Cleaners, Detergents and Personal Care Products, and the other being Match-es and Firelighters. It is managed by the lead company PCC Consumer Products S.A., Warsaw (Poland). At the end of fi scal 2015, its workforce numbered 569 employees (pre-vious year: 618).
Fiscal 2015 saw further expansion and modernisation of our production facilities in this segment, particularly at PCC Consumer Products Kosmet Sp. z o.o., Brzeg Dolny (Po-land), which is active in the fi elds of household cleaners, laundry detergents and cosmetics. However, the upgrade work interfered with ongoing production at this portfolio company, impacting its results (and thus also the earnings performance of the entire segment). Business development was further negatively affected by the fact that the pre-viously biggest customer of PCC Consumer Products Kos-met Sp. z o.o. had started up its own production operation, causing some employees of our company to switch to this new and direct competitor. PCC Consumer Products Kosmet Sp. z o.o. therefore closed fi scal 2015 with another loss. Business performance at the portfolio companies of the “PCC Consumer Products” subgroup in Belarus and Russia also culminated in negative earnings fi gures. Problems with adaptation of packaging to the requirements of the Russian market, payment diffi culties of the customers there and the devaluation of the Belarusian ruble are among the causes of this development. The marginally positive performance of the matches factory PCC Consumer Products Czechow-
102 PCC Group Δ Annual Report 2015 Δ Group management report
ice S.A., Czechowice-Dziedzice (Poland), was only able to slightly offset the losses suffered by the other business units in the Consumer Products segment. The original intention of PCC SE to divest the matches factory due to a lack of suffi cient growth prospects was reviewed once again in 2015. With the aid of a new local management, attempts are now to be made to intensify the direct sale of standard matches and, for example, barbecue lighters. Sales and dis-tribution are also to be strengthened in the Household and Industrial Cleaners, Detergents and Personal Care Products business unit, with expansion plans focusing in particular on Western Europe. Following the positive conclusion of lengthy licensing procedures, initial successes are now be-ing recorded in Scandinavia. The GMP approval essential for the sale of large product volumes in Western Europe is expected to be issued shortly; GMP stands for Good Man-ufacturing Practice and comprises guidelines on quality as-surance in the processes and manufacturing environment applied in the production of pharmaceuticals, cosmetics, food, beverages and feedstuffs. With this as its extended basis, the Consumer Products segment should acquire suf-fi cient growth potential in 2016 and the years that follow.
ENERGY
The Energy segment encompasses the two business units Renewable Energies and Conventional Energies. In the year under review, this segment generated sales of € 11.3 mil-lion, an increase of 3.7 % above the prior-year fi gure of € 10.9 million. Within this segment, we control the corre-sponding Energy business unit of PCC Rokita SA comprising PCC Energetyka Blachownia Sp. z o.o., Kędzierzyn-Koźle (Po-land), and also PCC DEG Renewables GmbH, Duisburg (Ger-many), including its subsidiaries in Bosnia-Herzegovina, the Republic of Macedonia and Bulgaria. The company PCC En-ergy Trading GmbH, Duisburg, is likewise managed under the Energy segment, although this affi liate has not actively traded since 2012. At the end of the year, the number of employees within the Energy segment was 179 (previous year: 180).
The main sales and earnings generator of this segment re-mains the Conventional Energies business unit encompassing PCC Energetyka Blachownia Sp. z o.o., a combined heat and power generator, and the Energy business unit of PCC Rokita SA which operates its own power-generating plant to secure energy supplies to its local production site.
The aforementioned increase in sales is largely due to the Renewable Energies business unit. For the fi rst time, fi ve hy-dropower plants were in operation for a full year, one in Bosnia-Herzegovina and four others in the Republic of Mace-donia. The construction of a fi fth power plant in Macedonia, planned for 2015, was delayed through the turn of the year and is now scheduled for 2016. By contrast, certain approval processes are still outstanding with respect to the other three
sites in Bosnia-Herzegovina. There still appears to be no end in sight to this long, protracted process. The sale of the two portfolios in their respective countries, as pursued by PCC SE together with its joint venture partner, is proving to be diffi -cult due to their fragmentation. Because the power plants in operation are now delivering relatively stable cash fl ows, an attempt is therefore to be made to supplement at least the portfolio in Macedonia through the addition of further sites. PCC DEG Renewables GmbH is also currently thinking about refi nancing the existing external loans at more favourable conditions. These measures should help to make the port-folios in Bosnia and Macedonia more attractive to potential investors. PCC SE has further investments in hydroelectric and wind power projects in Bulgaria, all of which have now been placed on hold due to both the political and economic conditions rendering implementation unviable. The costs of the local portfolio companies were therefore reduced to an absolute minimum back in 2014, with still little sign of how the situation will develop going forward.
LOGISTICS
The Logistics segment was able to generate sales of € 56.8 million in 2015, an increase of 11.6 % above the prior-year fi gure of € 50.8 million. The segment is divided into three business units: Intermodal Transport, Road Haul-age and Rail Transport. These comprise the Polish company PCC Intermodal S.A., Gdynia (Poland), and its German sub-sidiary PCC Intermodal GmbH, Duisburg (Germany), together with PCC Autochem Sp. z o.o., Brzeg Dolny (Poland), and ZAO PCC Rail, Moscow (Russia). The number of employees at this segment at year end was 367 (previous year: 332).
The Logistics division was again dominated in 2015 by PCC Intermodal S.A., the portfolio of which encompasses regular combined container transport services both within Poland and on international routes. This affi liate was again able to signifi cantly improve its earnings situation year on year, ending fi scal 2015 well in profi t. Increasing utilisation of the routes offered by PCC Intermodal S.A., and also, in particular, the associated increase in the number of con-tainers handled at the company’s terminals contributed to this positive development. Important milestones for future growth in the business unit were passed with the expansion of the handling terminal in Kutno (second phase) and also the terminals in Brzeg Dolny and Gliwice, all in Poland. In the past, the liquid funds for these investments were large-ly provided to PCC Intermodal S.A. by PCC SE in the form of loans. Following completion of the individual terminals, PCC Intermodal S.A. engaged in further negotiations with Polish banks with respect to the refi nancing of these invest-ments. The liquid funds now likely to be released from one of these external fi nancing packages around mid-2016 are to be used both for further investments and also for the partial redemption of the loans received from PCC SE.

103
The road tanker haulage company PCC Autochem Sp. z o.o. again put in a positive business performance in 2015, con-tinuing its upward trend. Growth was generated by, for example, increasing activity in the tanker cleaning business, which is to be further expanded going forward. PCC Auto-chem Sp. z o.o. was therefore once more able to make a positive contribution to Group earnings in the reporting year.
By contrast, the business operations of our Russian rail transport affi liate ZAO PCC Rail, which completes the Logis-tics division of the PCC Group, encountered further diffi cul-ties in fi scal 2015 due to the continuing crisis impacting the Russian economy. In addition, ZAO PCC Rail has continued to be fi nanced by euro loans from PCC SE. The year-end valuations of these loans refl ect the exchange rate fl uctu-ations being suffered by the Russian currency which, after a phase of recovery in the fi rst few months of 2015, came under further pressure as the year progressed – with neg-ative effects on the overall results achieved by this portfo-lio company. ZAO PCC Rail therefore ended the fi scal year with another signifi cant loss. In the meantime, however, the market environment in which ZAO PCC Rail operates has changed. Many small suppliers have been taken over by the major Russian wagon operators or have rented their wagons to these larger companies. In consultation with PCC SE, therefore, ZAO PCC Rail followed this market trend in 2015 and rented out 550 of its approximately 600 wag-ons to a subsidiary of the Russian state railway company. The other wagons have been kept in service on behalf of a long-term customer. As a consequence, personnel levels have been signifi cantly decreased accompanied by a reduc-tion in rented offi ce space which will result in a signifi cant cut in costs in 2016. With this as its basis, we anticipate that ZAO PCC Rail will be able to generate potentially stable cash fl ows in 2016 and beyond, enabling it to at least par-tially reduce its liabilities to PCC SE. Because of the change in the market environment, PCC SE is also now considering a long-term plan which would involve the sale of the com-plete wagon fl eet of ZAO PCC Rail. A prerequisite for this is economic recovery in Russia, which in turn would lead to wagon tariffs and also the prices commanded by wagons rising again. Under such conditions, the disposal of these assets would represent a promising option, particularly as rail transport is destined to remain the most important form of carriage in Russia for the foreseeable future.
HOLDING/PROJECTS
Aside from the parent and Group holding company PCC SE, this segment also includes the following affi liates: PCC IT S.A., PCC Apakor Sp. z o.o., LabMatic Sp. z o.o. and Ekologistyka Sp. z o.o., each headquartered in Brzeg Dolny (Poland). The activities of all the portfolio companies indi-cated, supplemented by the Headquarters business unit of PCC Rokita SA, are essentially aligned to providing intercom-pany and Group-internal services, and have been managed
under the Holding segment since 2013. Since 2015, the pro-ject company PCC BakkiSilicon hf, Húsavík (Iceland), which is entrusted with the construction of a silicon metal production plant at this location, has also been consolidated within the Holding/Projects segment.
Earnings before interest, taxes, depreciation and amortisa-tion (EBITDA) of this segment came in at € 1.9 million in the reporting year. Segment results are made up primarily of the gains generated on disposal of the telecommunications and data centre activities of PCC to a Polish investment fund. The number of employees within this segment at the close of 2015 was 740 (previous year: 753).
Business performance by segment Δ Group management report Δ Annual Report 2015 Δ PCC Group
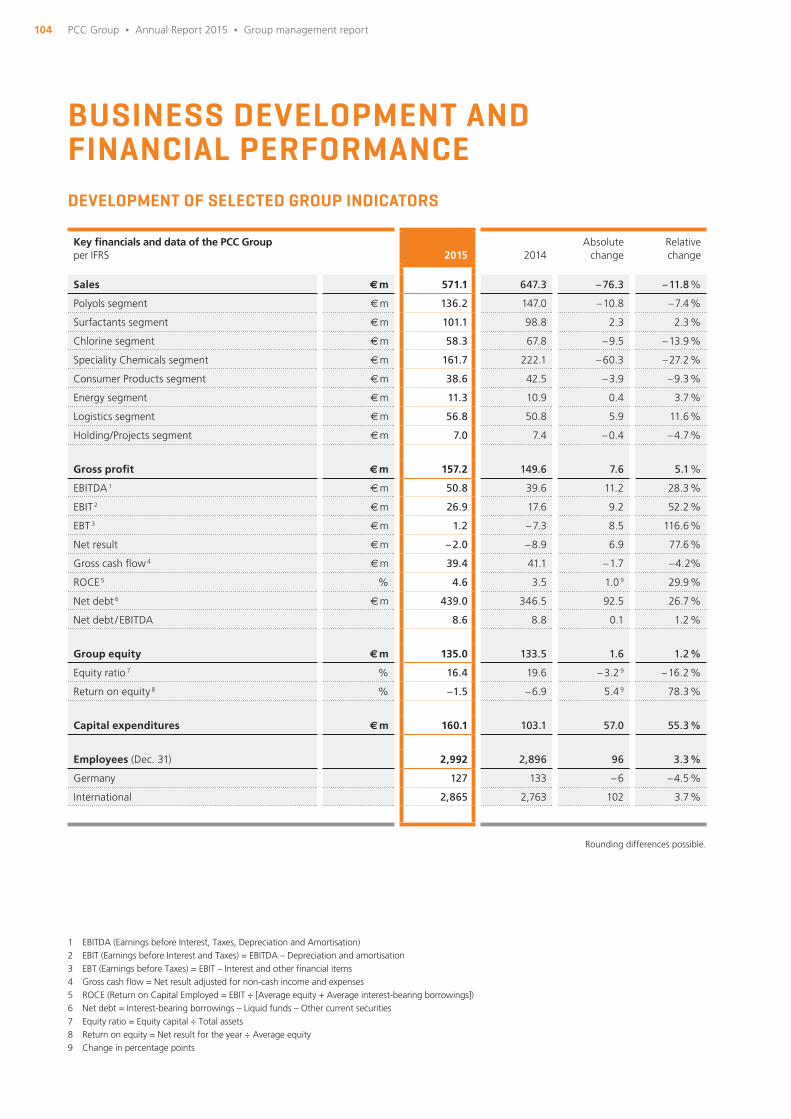
104 PCC Group Δ Annual Report 2015 Δ Group management report
BUSINESS DEVELOPMENT AND FINANCIAL PERFORMANCEDEVELOPMENT OF SELECTED GROUP INDICATORS
Key fi nancials and data of the PCC Group per IFRS 2015 2014
Absolutechange
Relativechange
Sales € m 571.1 647.3 – 76.3 – 11.8 %
Polyols segment € m 136.2 147.0 – 10.8 – 7.4 %
Surfactants segment € m 101.1 98.8 2.3 2.3 %
Chlorine segment € m 58.3 67.8 – 9.5 – 13.9 %
Speciality Chemicals segment € m 161.7 222.1 – 60.3 – 27.2 %
Consumer Products segment € m 38.6 42.5 – 3.9 – 9.3 %
Energy segment € m 11.3 10.9 0.4 3.7 %
Logistics segment € m 56.8 50.8 5.9 11.6 %
Holding/Projects segment € m 7.0 7.4 – 0.4 – 4.7 %
Gross profi t € m 157.2 149.6 7.6 5.1 %
EBITDA 1 € m 50.8 39.6 11.2 28.3 %
EBIT 2 € m 26.9 17.6 9.2 52.2 %
EBT 3 € m 1.2 – 7.3 8.5 116.6 %
Net result € m – 2.0 – 8.9 6.9 77.6 %
Gross cash fl ow 4 € m 39.4 41.1 – 1.7 – 4.2%
ROCE 5 % 4.6 3.5 1.0 9 29.9 %
Net debt 6 € m 439.0 346.5 92.5 26.7 %
Net debt / EBITDA 8.6 8.8 0.1 1.2 %
Group equity € m 135.0 133.5 1.6 1.2 %
Equity ratio 7 % 16.4 19.6 – 3.2 9 – 16.2 %
Return on equity 8 % – 1.5 – 6.9 5.4 9 78.3 %
Capital expenditures € m 160.1 103.1 57.0 55.3 %
Employees (Dec. 31) 2,992 2,896 96 3.3 %
Germany 127 133 – 6 – 4.5 %
International 2,865 2,763 102 3.7 %
Rounding differences possible.
1 EBITDA (Earnings before Interest, Taxes, Depreciation and Amortisation) 2 EBIT (Earnings before Interest and Taxes) = EBITDA – Depreciation and amortisation 3 EBT (Earnings before Taxes) = EBIT – Interest and other fi nancial items 4 Gross cash fl ow = Net result adjusted for non-cash income and expenses 5 ROCE (Return on Capital Employed = EBIT ÷ [Average equity + Average interest-bearing borrowings]) 6 Net debt = Interest-bearing borrowings – Liquid funds – Other current securities 7 Equity ratio = Equity capital ÷ Total assets 8 Return on equity = Net result for the year ÷ Average equity 9 Change in percentage points
105
EARNINGS POSITION
Overall, the PCC Group fi nished fi scal 2015 with an operat-ing profi t – expressed as earnings before interest, taxes, de-preciation and amortisation (EBITDA) – of € 50.8 million, an increase of € 11.2 million or 28.3 % over the prior-year fi g-ure of € 39.6 million. PCC Group sales in 2015 amounted to € 571.1 million, representing a decrease of € 76.3 million or 11.8 % year on year. This is due in the fi rst instance to the signifi cant decline in raw material prices. However, compared to the previous year, most of the Chemicals segments were able to either hold sales constant or post an increase. At 0.1 % of consolidated sales, the impact on revenue resulting from changes in the scope of consolidation was negligible.
Given that the euro is not the functional currency of most PCC companies, the foreign exchange rates at which sales and earnings are translated exert an infl uence on the consolidat-ed statement of income. If parities had remained unchanged versus the previous year, sales of the PCC Group would have amounted to € 568.5 million, representing a decrease of € 2.6 million or 0.5 %. Essentially, it is the foreign exchange rates against the US dollar that most impact sales revenue. Developments with respect to the Russian ruble, on the other hand, served to boost sales performance.
Gross profi t generated by the PCC Group increased by € 7.6 million or 5.1 % to € 157.2 million (previous year: € 149.6 million). The average gross margin was therefore 27.5 % (previous year: 23.1 %). The strategy of concentrat-ing more on high-margin products and speciality grades in selected business units within the Chemicals segment sup-ported this development. Added to this, the purchase price for raw materials paid by the segments of the Chemicals division decreased more than the selling prices they charged. The signifi cant increase in the container handling volumes at the terminals operated by the Intermodal Transport business unit of the Logistics segment likewise exerted a positive effect.
Personnel expenses rose year on year by 8.5 % from € 52.9 million to € 57.3 million. The number of employees grew by 3.3 % from 2,896 to 2,992 – due in particular to increased headcount in the segments Polyols, Chlorine and Logistics. In regional terms, 119 of the new jobs were created in Poland, while the number of permanent positions in the Other Europe region decreased by 20.
Redundancies were implemented in the Consumer Products segment and in the Rail Transport business unit. Following completion of the upgrade measures in the production facil-ities of the Consumer Products segment and in view of the need to adapt to the current market situation, its workforce was reduced by 49. The economic situation affecting our rail transport activities in Russia also meant that cost optimising measures had to be instituted, with the number of employees reduced by 12. As a result of the sale of 3Services Factory S.A.
and its deconsolidation, the number of employees in the Hold-ing/Projects segment fell by 13 versus the prior-year level.
At € 12.8 million, other operating income remained virtually unchanged versus the prior-year fi gure of € 12.9 million. This includes gains from the disposal of the two entities divest-ed in 2015, namely 3S S.A. and 3Services Factory S.A. Offer-ing telecommunication and data centre services, these two companies did not count among the core businesses of the PCC Group and were sold to a Polish offshoot of an inter-national investment fund. The liquid funds generated in the amount of € 14.1 million were used in part for other invest-ment projects and also for the purpose of debt repayment.
With a total of € 160.1 million, capital expenditures in 2015 reached a new high. In addition to ongoing renewal invest-ments and a number of relatively small projects, mention should also be made in particular of the following major pro-jects: construction of a silicon metal smelting plant; switch-over of the chlor-alkali electrolysis process to environmentally friendly membrane technology; construction of a production plant for monochloroacetic acid (MCAA); and the construc-tion and expansion of container terminals within the Inter-modal Transport business unit.
The investments completed should, as from 2016, make sig-nifi cant full-year contributions to the sales, gross profi t and the earnings of the PCC Group. At the same time, they also mean an increase in both depreciation/amortisation and net interest paid in the consolidated statement of income. The effect on the balance sheet was already largely refl ected in the 2015 consolidated fi nancial statements in the form of an increase in both non-current assets and non-current fi nancial liabilities (borrowings). In the year under review, depreciation of property, plant and equipment and amortisation of intan-gible assets increased from € 21.9 million to € 23.9 million (a rise of 9.0 %).
Interest and similar expenses arising from both bond and bank liabilities increased in the reporting year from € 19.8 million to € 22.0 million, representing a rise of 10.8 %. PCC SE and also other Group companies were able to fi nance their activities at better interest rates and conditions than in the previous year. However, fi nancial liabilities continued to rise with our invest-ment and capital expenditure activities. Interest attributable to qualifying assets of investment projects is now capitalised during the construction period.
Income and expenditures arising from foreign exchange dif-ferences are recognised as gains/losses on currency translation under fi nancial result. In fi scal 2015, these exerted a negative net effect of € – 3.6 million (previous year: € – 6.1 million).
Compared to fi scal 2014, earnings before taxes (EBT) in-creased by € 8.5 million from € – 7.3 million to € 1.2 million.
Business development and fi nancial performance Δ Group management report Δ Annual Report 2015 Δ PCC Group
106 PCC Group Δ Annual Report 2015 Δ Group management report
The consolidated net result of the PCC Group improved from € – 14.8 million to € 10.1 million. With approval of the re-structuring plan of S.C. Oltchim S.A., the shares in this com-pany are again being traded on the Romanian stock exchange as of the fourth quarter of 2015. Following the insolvency application in 2013, the shares were temporarily withdrawn from the market. The resumption of trading and the market price since commanded by the shares held by PCC SE resulted in a positive valuation at fair value of € 9.6 million as of the reporting date.
NET ASSETS
At the end of the year under review, total assets amount-ed to € 824.4 million, thus exceeding the prior-year fi gure by € 141.8 million or 20.8 %. At € 25.3 million, intangible assets remained virtually constant year on year. In particu-lar, the ongoing investment programme of the PCC Group in the segments Chlorine, Logistics and Holding/Projects re-sulted in a substantial increase in property, plant and equip-ment of € 128.3 million to € 542.7 million, representing a plus of 31.0 %. Major capital expenditures were allocated to the switch in the chlor-alkali electrolysis process to en-vironmentally friendly membrane technology, the continu-ation of the construction work on the MCAA plant located at the production site of PCC Rokita SA in Brzeg Dolny, start of construction of a silicon metal smelting facility in Iceland and expansion of the container handling terminal network in Poland. Following the fair value assessment of the shares held by PCC SE in S.C. Oltchim S.A., fi nancial assets rose by € 9.9 million to € 12.1 million.
The decline of € 7.0 million to zero in the value of invest-ments measured using the equity method is the result of the sale of the 46 % share in 3S S.A. in June 2015. The joint venture OOO DME Aerosol, Pervomaysky (Russia), which is responsible for the development and construction of a di-methyl ether plant, has a recognised balance of zero due to the usual losses incurred by companies at such a stage being invariably higher than the book values of the business. To-gether with a joint venture partner, PCC SE is providing 30 % of the investment volume, with the remaining 70 % being fi nanced by a Russian bank.
Current assets rose slightly by € 4.8 million to € 232.0 mil-lion. Inventories decreased by € 7.6 million to € 45.7 million. Other receivables and other assets fell by € 17.1 million to € 40.4 million, primarily due to the payment of a purchase price claim arising from the sale of shares in PCC BakkiSili-con hf in 2014.
The balance of cash and cash equivalents was € 80.4 million, an increase of € 34.3 million above the level reported on De-cember 31, 2014.
FINANCIAL POSITION
PCC Group equity grew slightly versus year end 2014, by € 1.6 million to € 135.0 million. Revenue reserves/other reserves decreased by € 9.6 million to € 98.6 million. At € 41.0 million, minority interests remained virtually constant year on year. Other comprehensive income increased by € 11.6 million from € – 21.2 million to € – 9.6 million. The main factors here were a reduction in foreign currency translation differences recognised in other comprehensive income in the amount of € + 4.9 million, and also positive effects aris-ing from the fair value measurement of fi nancial assets in the amount of € + 6.7 million. Remeasurement of defi ned benefi t pension obligations resulted in no material change compared to the previous year. Because of the balance sheet extension, the equity ratio decreased from 19.6 % to 16.4 %.
Non-current investments are fi nanced with non-current bor-rowings. Non-current provisions and liabilities rose in 2015 by € 145.3 million to € 477.0 million. Within this fi gure, de-ferred tax liabilities increased by € 3.5 million to € 10.9 mil-lion. Non-current fi nancial liabilities rose by € 128.5 million to € 419.9 million, due in the fi rst instance to the debt fi -nancing of capital expenditure projects. Other liabilities in-clude deferred income, which increased by € 10.3 million to € 35.6 million, primarily as a result of subsidies for the indi-vidual investment projects indicated above.
Of the bonds previously in existence, PCC SE redeemed in full on maturity a total of four in the course of 2015 as fol-lows: bond ISIN DE000A1RE798 in the amount of € 15.0 mil-lion on April 1; bond ISIN DE000A1H3MS7 in the amount of € 26.7 million on July 1; bond ISIN DE000A1YCSX6 in the amount of € 10.0 million on October 1; and bond ISIN DE000A1K0U02 in the amount of € 21.9 million on December 1. Together with the quarterly repayments in respect of the two bonds ISIN DE000A1EWB67 and ISIN DE000A1EWRT6 in the aggregate amount of € 1.6 mil-lion, total repayments in 2015 amounted to € 75.2 million. At the same time, six new bonds were issued, three as of May 1 and three as of October 1, with different tenors and maturities and with coupons ranging between 3.5 % and 6.5 %. The nominal issue volume placed by the end of the year totalled around € 118 million. These funds were used for further investments in existing operations and ongoing projects and also, in part, for the refi nancing of the liabilities due in 2015. Aside from PCC SE, whose bonds are denominated in euro, other Group companies also issued bonds. Those of PCC Rokita SA, PCC Consumer Products Kosmet Sp. z o.o. and PCC Autochem Sp. z o.o. in Poland, denominated in zloty, had a value of PLN 126.2 million (€ 29.6 million) as of year end 2015.

107
Current provisions and liabilities decreased by € 5.0 million to € 212.4 million, due primarily to changes in trade ac-counts payable and current fi nancial liabilities. Other liabili-ties also fell by € 2.7 million to € 38.2 million.
Provisions for pensions and similar obligations and also other provisions increased slightly by € 0.3 million to € 17.2 million (previous year: € 16.9 million).
The net debt of the PCC Group rose in fi scal 2015 from € 346.5 million to € 439.0 million. In particular, non-current fi nancial liabilities increased due to the high level of capital expenditures implemented. This was countervailed by a rise in cash and cash equivalents. Compared to 2014, the ratio between net debt and earnings before interest, taxes, depreci-ation and amortisation (EBITDA) improved from 8.8 to 8.6 in 2015, with both EBITDA and net debt rising. Because of the ongoing high investments for 2016 and 2017, we currently anticipate that we will only achieve our medium-term objec-tive of improving this value to below 5.0 after fi scal 2018.
Figures in € k Dec. 31, 2015 Dec. 31, 2014
Cash and cash equivalents 80,398 46,107
Financial liabilities 519,374 392,594
Net debt 438,976 346,487
Net debt
Overall, the company management regards developments in our net assets, fi nancial position and results of operations in fi scal 2015 as satisfactory. Although the expectations docu-mented in the prior-year report were not met in all aspects, signifi cant milestones were reached for the long-term im-provement in our earnings position and further increasing our enterprise value.
Business development and fi nancial performance Δ Group management report Δ Annual Report 2015 Δ PCC Group
108 PCC Group Δ Annual Report 2015 Δ Group management report
PCC SE – CONDENSED REPORT PER HGB (GERMAN COMMERCIAL CODE)By way of supplement to the report relating to the PCC Group, we hereby submit in the following an appraisal of the performance and development of PCC SE. PCC SE is the parent company of the PCC Group and is domiciled in Duisburg (Germany). At the core of the business activities undertaken by PCC SE is a commitment to the long-term engagement in and development of its portfolio business investments. One of our primary objectives in this regard is to create and continuously increase enterprise value. As a growth-led investor with a predominantly long-term view, PCC SE supports its affi liates and portfolio companies in their development and in the expansion of their respective strengths. Aside from the active management of our invest-ment portfolio, our main tasks include the strategic man-agement and control of our affi liated companies at home and abroad. A further focus lies on cross-group fi nancing activities and market observation and advisory services with the purpose of further extending our group of companies aligned to competence-related diversifi cation. We focus in particular on positioning ourselves in less competitive sub-markets and market niches. We concentrate our investments primarily in the higher-growth regions of Eastern and South- East Europe, and also more recently in Asia.
The annual fi nancial statements of PCC SE are prepared in accordance with the German Commercial Code (HGB, the German GAAP). The consolidated fi nancial statements are prepared in accordance with International Financial Report-ing Standards (IFRS) as adopted and endorsed within the Eu-ropean Union (EU). This results in differences in the measure-ment and recognition principles applied, relating primarily to intangible assets, provisions, fi nancial instruments, leasing transactions and deferred taxes.
As in previous years, the costs incurred by PCC SE in perform-ing its holding company function are – with the exception of fi nancing costs and the legal and consultancy costs arising in relation to planned new projects, acquisitions or divestments – allocated within the framework of a licence fee agreement by means of a revenue-based formula to the companies in-cluded in the consolidation scope. Exempted from this rule for 2015 are affi liates which, in 2015, did not generate any appreciable external sales or which have not yet adopted the PCC logo in their company style. Also exempted are affi li-ates of which the business operations were discontinued and which are now merely being wound down.
BUSINESS DEVELOPMENT AND FINANCIAL PERFORMANCE OF PCC SE
Generated primarily by allocated costs/licence fees, sales in fi scal 2015 came in at € 2.9 million, a decline of € 0.3 million compared to the fi gure of € 3.2 million realised in 2014. The reasons for this lie in reduced sales achieved by the majority of the portfolio companies as a result of the lower commodity prices prevailing. There was also a decline in other operating income of € 9.4 million, causing the total to decrease from € 31.1 million to € 21.7 million. The main constituents were income from write-ups of fi nancial assets (S.C. Oltchim S.A. and PCC Synteza S.A.) in a total amount of € 12.3 million. Income was also generated from the sale of shares in affi liat-ed companies (sale of the telecommunications and data cen-tre activities of PCC SE) in the total amount of € 5.5 million. Sundry other operating income included rental income in the amount of € 0.4 million (previous year: € 0.4 million) and in-come from costs recharged of € 0.7 million (previous year: € 1.0 million). This income from costs recharged was, how-ever, countervailed on the expenses side by, among other things, personnel, consultancy and travel costs. Income from foreign exchange rate differences accrued to € 2.0 million (previous year: € 0.3 million), with losses arising from foreign exchange rate differences amounting to € 2.9 million (previ-ous year: € 2.0 million).
On the costs side, personnel expenses remained fl at year on year at € 4.9 million. However, other operating ex-penses increased by € 0.3 million from € 14.8 million to € 15.1 million. The cause here was a mixture of an increase in losses arising from foreign exchange rate differences in the amount of € 0.9 million and allowances for individual value adjustments amounting to € 2.8 million (previous year: € 0). This latter allocation relates to the loans receivable from PCC Energy Trading GmbH and SSH Sp. z o.o. Due to clawbacks demanded by an insolvency administrator relat-ing to a case that affected our former company PCC Cap-ital GmbH, provision had to be allocated for, among other things, expenses arising from guarantees and warranties in the amount of € 0.3 million (previous year: € 0). The expens-es relating to bearer bonds increased slightly from € 2.3 mil-lion to € 2.4 million. These increases incurred in respect of individual expense items were more than offset by a signifi -cant decline in legal and consultancy costs. These decreased by around € 2.0 million from € 5.2 million to € 3.2 million due primarily to the absence of exceptional items from the previous year such as the fl otation of PCC Rokita SA and an analysis of possible bond issuances by PCC SE on the Polish
109PCC SE – Condensed report per HGB (German Commercial Code) Δ Group management report Δ Annual Report 2015 Δ PCC Group
Figures in € k Dec. 31, 2015 Dec. 31, 2014
Sales 2,917 3,157
Other operating income 21,736 31,140
Personnel expenses 4,942 4,869
Depreciation of property, plant and equipment and amortisation of intangible assets 603 566
Other operating expenses 15,128 14,769
Income from investments 16,605 18,579
Other interest and similar income 6,645 5,892
Write-downs of fi nancial assets 418 7,579
Interest and similar expenses 18,332 16,605
Income from ordinary activities 8,481 14,382
Other taxes 32 17
Taxes on income 61 – 88
Net income 8,388 14,452
Condensed statement of income of PCC SE according to the German Commercial Code (HGB)
market. Losses from the disposal of fi nancial assets and from bad debts among affi liated companies were absent in 2015 (previous year: € 2.1 million).
Overall, the total of sales revenue and other income exceed-ed expenses in the 2015 fi scal year, giving rise to a positive fi gure for earnings before interest, taxes, depreciation and amortisation (EBITDA) in the amount of € + 4.6 million (pre-vious year: € + 14.7 million). Depreciation of property, plant and equipment and amortisation of intangible assets in 2015 remained fl at year on year at around € 0.6 million.
Income from investments decreased versus the prior year by € 2.0 million from € 18.6 million to € 16.6 million, with the major share again attributable to PCC Rokita SA. Other companies contributing to income from investments were PCC Exol SA, PCC Energetyka Blachownia Sp. z o.o. and PCC IT S.A.
Interest income, which was generated primarily from our affi liated companies, amounted to € 6.6 million, an increase of € 0.7 million compared to the prior-year fi gure of € 5.9 million. Nevertheless, loans to affi liated companies as of December 31, 2015 decreased from € 68.8 million to € 58.8 million. This is primarily due to the reclassifi cation to equity of the loan granted to PCC BakkiSilicon hf in the amount of around € 13.0 million. The fi gure for shares held in affi liated companies increased accordingly.
Write-downs of fi nancial assets in 2015 amounted to € 0.4 million (previous year: € 7.6 million). These relate to the loan in this amount granted to the Bulgarian affi liate PCC Izvorsko EOOD.
Because of the increase in bond liabilities, interest expense rose by € 1.7 million from € 16.6 million to € 18.3 million.
Given these developments, income from ordinary activities in fi scal 2015 amounted to € + 8.5 million (previous year: € + 14.4 million). Taking into account other taxes of € 32 k, earnings before taxes (EBT) came in at € + 8.4 million (pre-vious year: € + 14.4 million). After deducting taxes on in-come in the amount of € 61 k, net income for the year was € 8.4 million (previous year: € 14.5 million).
Taking into account this income fi gure and the distribu-tion made to the shareholder in 2015 from the 2014 net income, equity disclosed in our balance sheet increased from € 62.9 million to € 70.0 million. At the same time, to-tal assets increased from € 305 million to € 357 million. As a result, the equity ratio eased somewhat from 20.6 % to 19.6 %.
110 PCC Group Δ Annual Report 2015 Δ Group management report
The reason for the rise in total assets/liabilities lay in the in-crease in equity and also an increase in liabilities from a total of € 241.0 million to € 286.5 million. This latter arose pri-marily from the increase in bond liabilities from € 233.1 mil-lion to € 276.6 million. A total of four bonds representing an aggregate volume of € 73.6 million were fully redeemed on maturity in the course of 2015. In addition, quarterly repay-ments were made in the amount of € 1.6 million in respect of the two redeemable bonds. The total repayment volume thus amounted to € 75.2 million.
At the same time, six new bonds with coupons varying be-tween 3.5 % and 6.5 % p.a. and different tenors and ma-turities ranging from July 1, 2017 to October 1, 2022 were issued, three on May 1 and three on October 1, 2015. The funds received as a result of these new issuances were used for further investments in existing portfolio companies and ongoing projects, and also for the partial refi nancing of lia-bilities due in 2015.
On the assets side of the balance sheet, non-current assets increased from € 241.7 million to € 269.9 million, due pri-marily to the increase in shares held in affi liated compa-
nies from € 155.8 million to € 189.2 million. Investments rose from € 6.3 million to € 9.9 million. At the same time, loans to affi liated companies decreased from € 68.8 million to € 58.8 million, as already mentioned. Current assets in-creased from € 62.5 million to € 87.0 million. Within this, other assets decreased from € 29.9 million to € 15.3 million, mainly due to the loan receivable from PCC BakkiSilicon hf of € 14.8 million likewise being reclassifi ed to equity. This contributed to the aforementioned rise in shares held in af-fi liated companies in a corresponding amount. The decline in other assets was, however, signifi cantly overcompensated by the substantial increase in credit balances at banks which, as of the balance sheet date, amounted to € 38.8 million (previous year: € 6.0 million).
The decrease in other assets is also a major cause for the im-provement in cash fl ow from operating activities at PCC SE, which metric rose from € – 16.3 million in the previous year to € +1.0 million this time.
Figures in € k Dec. 31, 2015 Dec. 31, 2014
Intangible assets 251 106
Property, plant and equipment 10,927 10,043
Financial assets 258,770 231,564
Receivables and other assets 48,188 56,494
Securities 0 0
Cash on hand and credit balances at banks 38,818 5,970
Prepaid expenses 130 130
Deferred tax assets 136 196
Assets 357,220 304,504
Equity 69,976 62,938
Provisions 721 571
Bond liabilities 276,592 233,127
Bank liabilities 2,169 2,280
Trade accounts payable 388 1,116
Liabilities to affi liated companies 262 148
Other liabilities 7,111 4,323
Equity and liabilities 357,220 304,504
Condensed balance sheet of PCC SE according to the German Commercial Code (HGB)
111Group management report Δ Annual Report 2015 Δ PCC Group
OPPORTUNITIES FOR AND RISKS TO FUTURE DEVELOPMENT Our increasing focus on higher-grade products and our planned diversifi cation with respect to our sales markets will, in the view of the management, be the primary source of opportunity for the future growth of the PCC Group. Added to this are further modernisation and expansion investments through which our market position in the individual seg-ments is to be further extended.
Aside from the general economic risks that prevail, there also exist political risks, such as the Russia-Ukraine confl ict, which lie outside our control. Ignoring the special situation in which ZAO PCC Rail fi nds itself, the impact on the operating business of our portfolio of companies from this confl ict re-mains negligible. The situation could change, however, if the EU were to extend its economic sanctions against Russia, or Russia were to impose corresponding export restrictions or other sanctions that specifi cally affect the business of a PCC company. At the time of preparation of this management re-port, however, such eventualities appear to be unlikely. With the exemption of the DME project in Russia, which is being undertaken together with a long-standing Russian partner, no further projects are currently being promoted that might be affected by the confl ict or the current economic weakness in Russia.
Other indirect factors that can affect the performance of our portfolio companies and thus their dividend payouts to our company include price change and default risks. The latter should be eliminated as far as possible through the conclu-sion of commercial credit insurance policies by our portfolio companies. Price change risks are minimised through the conclusion of back-to-back transactions, through price for-mulae and/or through the use of price-hedging instruments.
In addition, both PCC SE and the operationally active compa-nies are exposed to the risk of changes in interest rates and foreign exchange parities. However, these can be at least partially eliminated by hedging transactions. Overall, the for-eign exchange rate and foreign currency risk encountered in the PCC Group should be signifi cantly minimised once the euro has been introduced into Poland as its offi cial currency.
Our affi liates in the Chemicals division are, in particular, also exposed to the risk of rising environmental protection costs in the wake of increasingly stringent waste, effl uent and other pan-European environmental regulations. Investment requirements possibly resulting from these could, in the fu-ture, have a negative effect on the earnings position of this division and thus also on the dividend fl ows from the affi li-ates concerned to PCC SE. The same applies to possible ad-ditional charges arising in connection with the EU regulation REACH (European legislation on the registration, evaluation, authorisation and restriction of chemicals) which came into force on June 1, 2007. The utilisation of further potential for savings may, however, compensate to some extent for any additional costs incurred.
In our fi nancial planning, we anticipate further regular li-quidity infl ows arising in the future from the issuance of corporate bonds. However, increasing obstacles within the SME bonds market could possibly lead to at least temporary liquidity bottlenecks. This risk is to be countered through the acquisition of alternative fi nancing sources, including at the institutional level. We are also working continuously on par-tially replacing the liquidity loans granted to subsidiaries by bank loans.
112 PCC Group Δ Annual Report 2015 Δ Group management report
INTERNAL CONTROL SYSTEM AND RISK MANAGEMENT RELATED TO THE GROUP ACCOUNTING PROCESSThe consolidated fi nancial statements of PCC SE as of De-cember 31, 2015 have been prepared in accordance with the provisions of the International Financial Reporting Stand-ards (IFRS) of the International Accounting Standards Board (IASB) and the interpretations of the International Financial Reporting Standards Interpretations Committee (IFRS IC) as applicable on the closing date and as adopted in the Euro-pean Union (EU), and in supplementary compliance with the statutory disclosure requirements specifi ed in Section 315a (1) HGB (German Commercial Code).
The consolidated fi nancial statements are prepared within the PCC Group in a multi-stage process using standardised IDL consolidation software. The pre-consolidated fi nancial statements of individual subsidiaries, duly audited by their own auditors, are incorporated by PCC SE within the con-solidated fi nancial statements. Responsibility for advice and support with respect to the consolidation system, for the consolidation chart of accounts standardised across the Group, and for implementation of the consolidation adjust-ments, lies with PCC SE. The companies incorporated within the consolidated fi nancial statements are required to abide
by standard accounting and fi nancial reporting guidelines. These also specify the recognition and valuation principles to be applied in compliance with the provisions of IFRS.
All the companies included in the consolidated fi nancial statements are provided with a binding, uniform calendar of due dates for the preparation of their fi nancial statements and completion of the associated audits. Automated and manual checks and controls are integrated at every stage of the process. Procedural rules ensure that all business transac-tions and the preparation of the annual fi nancial statements are recorded, processed and documented in full, promptly, accurately and with correct period allocation. Before the fi -nal submission to PCC SE, a quality-assuring review process is performed within the subsidiaries of the PCC Group by their own governing bodies or with direct involvement of their management. This internal procedure concludes with a formal written confi rmation of the system’s effectiveness together with a signed release of the fi nancial statements of the individual companies and related information for incor-poration in the consolidated fi nancial statements.
113Group management report Δ Annual Report 2015 Δ PCC Group
EVENTS AFTER THE BALANCE SHEET DATE
In February 2016, PCC SE sold its shares in SSH Sp. z o.o., Katowice (Poland), our last remaining portfolio company in the telecommunications sector. Provision was made in the 2015 annual fi nancial statements covering the loss of around € 0.5 million that was incurred on disposal of this entity.
Having received a bank fi nancing package, in March 2016 PCC Exol SA redeemed the loan of € 14.5 million granted to it by PCC SE. The liquid funds received by PCC SE as a result were used in part for debt repayment purposes.
Likewise in March 2016, PCC SE bought back 14,125,000 shares in PCC Exol SA. from an investment fund. This cor-
responds to around 8.2 % of the capital stock and around 4.7 % of the voting rights in the annual general meeting of the company.
Bond ISIN DE000A11P9V6 with a placed volume of € 7.3 mil-lion was redeemed in full on maturity as of April 1, 2016. It was issued on April 1, 2014, offering a coupon of 4.75 % p.a.
In order to partially refi nance the bonds falling due in the future and for further investments in existing portfolio com-panies and new projects, a new bond was issued on May 1, 2016: ISIN DE000A2AAVL7 with a volume of € 15 million, a coupon of 3.5 % p.a. and a tenor through to July 1, 2018.

114 PCC Group Δ Annual Report 2015 Δ Group management report
OUTLOOK FOR 2016
The focus of the PCC Group in fi scal 2016 will once again be on its predominantly long-term strategy of portfolio company investment and development. The core activities and com-petitiveness of the Group will also continue to be enhanced through capital expenditures going forward. Green-fi eld pro-jects such as the silicon metal production plant in Iceland are expected to contribute to the growth of the Group. The strat-egy of proactive investment portfolio management accompa-nied by ongoing optimisation measures is likewise to be con-tinued. The long-term objective remains to steadily increase our enterprise value.
In view of the positive business performance of, in particu-lar, PCC Rokita SA and also the majority of the other affi li-ated companies in the reporting year, dividend payments to PCC SE in the low double-digit million euro range are again expected in 2016. The lion’s share will once more be provided by PCC Rokita SA. Gains from the disposal of portfolio com-panies or other “one-offs” are not currently expected for fi scal 2016.
The current budget for 2016, prepared for the operating busi-nesses of the Group companies and affi liates in the fourth quarter of 2015, provides for an increase in sales revenue of 18 %. At the Group level, it is anticipated that total operating result (EBITDA) will be around 25 % above the 2015 level. A major share of this increase in earnings will be attributable to the Chlorine segment due to the fi rst-time all-year oper-ation of the new chlor-alkali electrolysis facilities. Signifi cant earnings improvements are also expected for the Surfactants segment and the Intermodal Transport business unit (due inter alia to the fi rst full year of operation of the terminals completed in 2015). The Consumer Products segment should experience a signifi cant recovery following conclusion of the upgrade measures in Brzeg Dolny (Poland) and receipt of the GMP approval. Further increasing burdens arising from depre-ciation, amortisation and interest will, however, mean that Group earnings before taxes (EBT) for 2016 will only slight-ly exceed the positive result of 2015. Seen from the current standpoint, signifi cant increases in earnings will – subject to positive or at least stable economic developments in the com-ing years – only start fl owing from 2017. By that time, both the new MCAA plant and also the new production lines in the Polyols segment currently under construction will, for the fi rst time, be producing over a full year. Increasing earnings should
also be forthcoming in the Intermodal Transport business unit as a result of the planned expansion in the network services of PCC Intermodal S.A. and a further increase in the number of terminal handling operations. Then, from 2018, the fi rst revenues will also begin fl owing from the silicon metal project of PCC BakkiSilicon hf. Positive effects on the earnings devel-opment of PCC SE are anticipated in the following years in the form of increasing dividend payments. At the same time, however, the net debt of both PCC SE and the PCC Group will increase, at least temporarily, due particularly to the Ice-land project. That said, the medium-term objective of the PCC Group remains to improve its net-debt-to-EBITDA ratio to less than 5.0.
The main revenue and earnings generator in fi scal 2016 will again be the Chemicals division, followed at some signifi cant distance by the Logistics division. We anticipate that the oper-ating rate within the Chemicals division will largely be compa-rable with that maintained in 2015. A year-on-year increase in both sales and earnings is expected in almost all our segments. Increasing prices and the migration towards higher-grade spe-ciality products – particularly in the Polyols and Surfactants segments – are among the reasons for these anticipated im-provements. Our trading business with chemical commodities should experience an improvement in sales due to the recov-ery in commodity prices, accompanied by a steady earnings contribution. As already mentioned, 2016 should also see a turnaround in the Consumer Products segment.
The Logistics segment is expected to register an increase in sales in fi scal 2016 of over 20 %, emanating largely from the Intermodal Transport business. Based on the existing order situation and expectations for a continuation in robust eco-nomic growth in Europe, business should once again exceed the level of the previous year. The outlook for the tanker haul-age business is similar. Although the transport business of ZAO PCC Rail will see its results improve versus 2015 in the wake of the restructuring measures implemented, it is still ex-pected to trade at a loss in 2016 due to the persistent weak-ness of Russia’s economy.
The Energy segment will continue to be essentially charac-terised by project development in the course of 2016, which means it will again be of only minor importance in terms of Group revenues and consolidated earnings.
115
As already mentioned, signifi cant earnings increases – subject to positive or at least stable economic developments in the coming years – are from the present standpoint unlikely to be generated before 2017. Consequently, for current fi scal 2016 and beyond, the focus of Group policy will remain predomi-nantly on our long-term activities aligned to portfolio business
investment and development. Beyond that, we will continue to pursue our strategy of proactive investment portfolio man-agement with sustainable growth and a steady increase in the enterprise value of the PCC Group providing our key metrics and corporate objectives.
Ulrike WarneckeManaging Director
Dr. rer. oec. (BY) Alfred PelzerManaging Director
Duisburg, May 27, 2016PCC SE
Outlook for 2016 Δ Group management report Δ Annual Report 2015 Δ PCC Group

116
In fi scal 2015, the total assets of the PCC Group rose 20.8 % from € 682.6 million to € 824.4 million, primarily as a result of the high volume of capital expenditures in the amount of € 160.1 million. Created for sustainability and fi nanced over the long term, investments such as these can be expected to generate increases in earnings over the next few years. The PCC Group is planning capital expenditures for 2016 of at least equivalent volume, causing the balance sheet to be further extended.
AUDITOR’S OPINION
CONSOLIDATED STATEMENT OF INCOME
CONSOLIDATED STATEMENT OF COMPREHENSIVE INCOME
CONSOLIDATED BALANCE SHEET
CONSOLIDATED STATEMENT OF CASH FLOWS
CONSOLIDATED STATEMENT OF CHANGES IN EQUITY
NOTES TO THE CONSOLIDATED FINANCIAL STATEMENTS
117
118
119
120
122
124
126
7CONSOLIDATED FINANCIAL STATEMENTS
117Consolidated fi nancial statements Δ Annual Report 2015 Δ PCC Group
AUDITOR’S OPINION
We have audited the consolidated fi nancial statements prepared by PCC SE, Duisburg, Germany – com-prising the consolidated balance sheet, consolidated statement of comprehensive income, consolidatedstatement of cash fl ows, consolidated statement of changes in equity and the notes to the consoli-dated fi nancial statements – and the group management report of PCC SE for the fi nancial year from January 01 to December 31, 2015. The preparation of the consolidated fi nancial statements and the group management report in accordance with IFRS, as adopted by the EU, and with the additional requirements of the German commercial law pursuant to section 315a paragraph 1 HGB, are the re-sponsibility of the parent company’s management. Our responsibility is to express an opinion on theconsolidated fi nancial statements and on the group management report based on our audit.
We conducted our audit of the consolidated fi nancial statements in accordance with section 317 HGB and German generally accepted standards for the audit of fi nancial statements promulgated by the Institut der Wirtschaftsprüfer [Institute of Public Auditors in Germany] (IDW). Those standards require that we plan and perform the audit such that misstatements materially affecting the presentation of the net assets, fi nancial position and results of operations in the consolidated fi nancial statements in accordance with the applicable fi nancial reporting framework and in the group management report, are detected with reasonable assurance. Knowledge of the business activities and the economic and legal environment of the Group and expectations as to possible misstatements, are taken into account in the determination of audit procedures. The effectiveness of the accounting-related internal control system and the evidence supporting the disclosures in the consolidated fi nancial statements and the group management report are examined primarily on a test basis within the framework of the audit. The audit includes assessing the annual fi nancial statements of those entities included in consolidation, the determination of the entities to be included in consolidation, the accounting and consolidation principles used, and signifi cant estimates made by management, as well as evaluating the overall presentation of the consolidated fi nancial statements and the group management report. We believe that our audit provides a reasonable basis for our opinion.
Our audit has not led to any reservations.
In our opinion, based on the fi ndings of our audit, the consolidated fi nancial statements of PCC SE, Duisburg, Germany, for the fi nancial year from January 01 to December 31, 2015, comply with IFRS, as adopted by the EU, and the additional requirements of the German commercial law pursuant to section 315a paragraph 1 HGB, and give a true and fair view of the net assets, fi nancial position and results of operations of the Group in accordance with these requirements. The group management report is con-sistent with the consolidated fi nancial statements and as a whole provides a suitable view of the Group’s position and suitably presents the opportunities and risks of future development.
Düsseldorf, June 21, 2016
Warth & Klein Grant Thornton AGWirtschaftsprüfungsgesellschaft
Ulrich Diersch Achim KrichelWirtschaftsprüfer Wirtschaftsprüfer(German Public Auditor) (German Public Auditor)

118 PCC Group Δ Annual Report 2015 Δ Consolidated fi nancial statements
Figures in € k (Note) 2015 2014
Sales revenue (6) 571,063 647,315
Change in inventory of fi nished products and work in progress 695 2,857
Other internal costs capitalised (7) 4,808 2,474
Purchased goods and services (8) 419,317 503,035
Personnel expenses (9) 57,345 52,874
Other operating income (10) 12,766 12,903
Other operating expenses (11) 61,883 70,631
Income from investments accounted for using the equity method (12) – 582
Earnings before interest, tax, depreciation and amortisation (EBITDA) (17) 50,787 39,591
Depreciation and amortisation (13) 23,920 21,941
Operating profi t from continuing operations (EBIT) (17) 26,867 17,650
Other interest and similar income (14) 746 1,123
Interest and similar expenses (14) 21,984 19,840
Currency translation differences (15) – 3,647 – 6,086
Other fi nancial expenses 766 181
Earnings before taxes from continuing operations (EBT) 1,216 – 7,334
Taxes on income (16) 3,214 1,574
Net result for the year – 1,998 – 8,908
Net result attributable to Group – 6,076 – 12,258
Net result attributable to minority interests 4,078 3,351
CONSOLIDATED STATEMENT OF INCOME
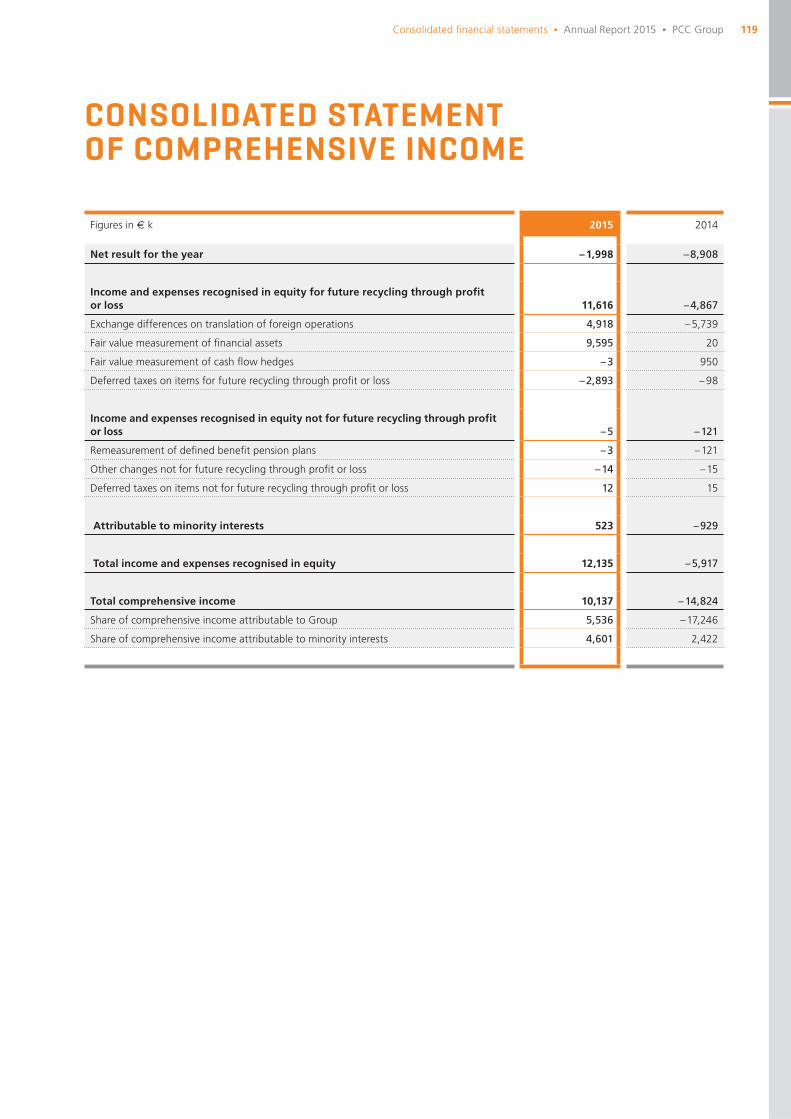
119Consolidated fi nancial statements Δ Annual Report 2015 Δ PCC Group
Figures in € k 2015 2014
Net result for the year – 1,998 – 8,908
Income and expenses recognised in equity for future recycling through profi t or loss 11,616 – 4,867
Exchange differences on translation of foreign operations 4,918 – 5,739
Fair value measurement of fi nancial assets 9,595 20
Fair value measurement of cash fl ow hedges – 3 950
Deferred taxes on items for future recycling through profi t or loss – 2,893 – 98
Income and expenses recognised in equity not for future recycling through profi t or loss – 5 – 121
Remeasurement of defi ned benefi t pension plans – 3 – 121
Other changes not for future recycling through profi t or loss – 14 – 15
Deferred taxes on items not for future recycling through profi t or loss 12 15
Attributable to minority interests 523 – 929
Total income and expenses recognised in equity 12,135 – 5,917
Total comprehensive income 10,137 – 14,824
Share of comprehensive income attributable to Group 5,536 – 17,246
Share of comprehensive income attributable to minority interests 4,601 2,422
CONSOLIDATED STATEMENT OF COMPREHENSIVE INCOME
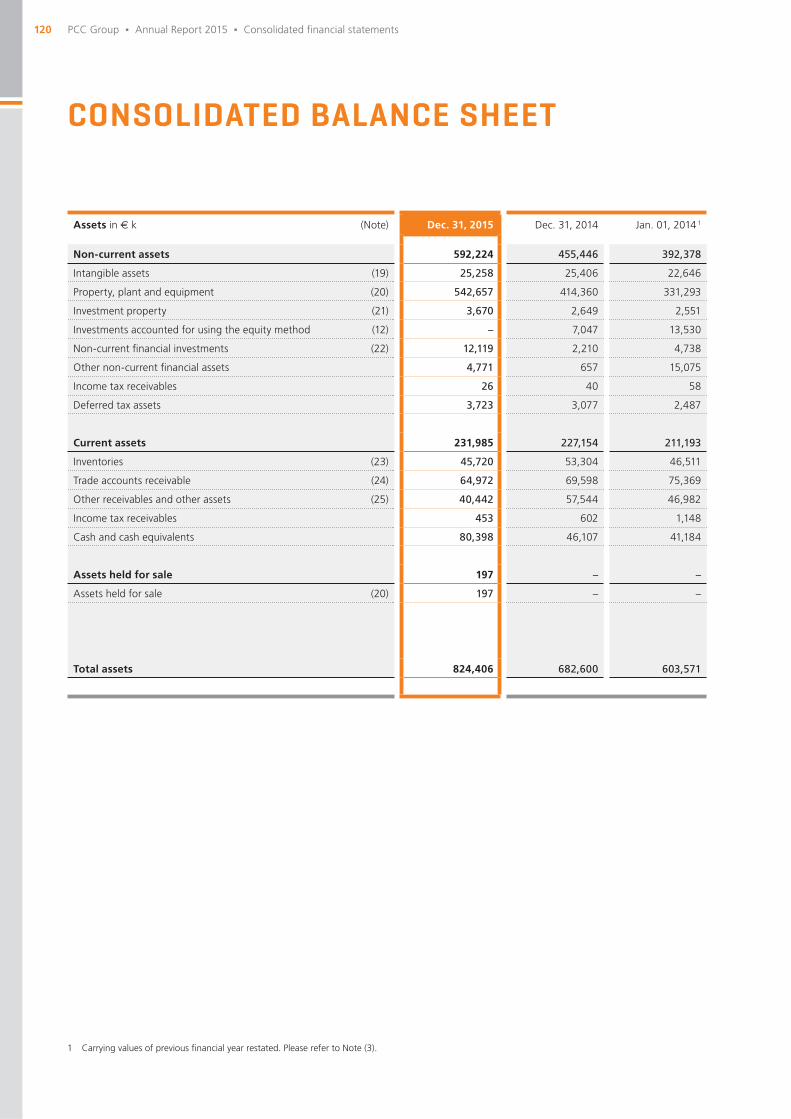
120 PCC Group Δ Annual Report 2015 Δ Consolidated fi nancial statements
Assets in € k (Note) Dec. 31, 2015 Dec. 31, 2014 Jan. 01, 2014 1
Non-current assets 592,224 455,446 392,378
Intangible assets (19) 25,258 25,406 22,646
Property, plant and equipment (20) 542,657 414,360 331,293
Investment property (21) 3,670 2,649 2,551
Investments accounted for using the equity method (12) – 7,047 13,530
Non-current fi nancial investments (22) 12,119 2,210 4,738
Other non-current fi nancial assets 4,771 657 15,075
Income tax receivables 26 40 58
Deferred tax assets 3,723 3,077 2,487
Current assets 231,985 227,154 211,193
Inventories (23) 45,720 53,304 46,511
Trade accounts receivable (24) 64,972 69,598 75,369
Other receivables and other assets (25) 40,442 57,544 46,982
Income tax receivables 453 602 1,148
Cash and cash equivalents 80,398 46,107 41,184
Assets held for sale 197 – –
Assets held for sale (20) 197 – –
Total assets 824,406 682,600 603,571
CONSOLIDATED BALANCE SHEET
1 Carrying values of previous fi nancial year restated. Please refer to Note (3).
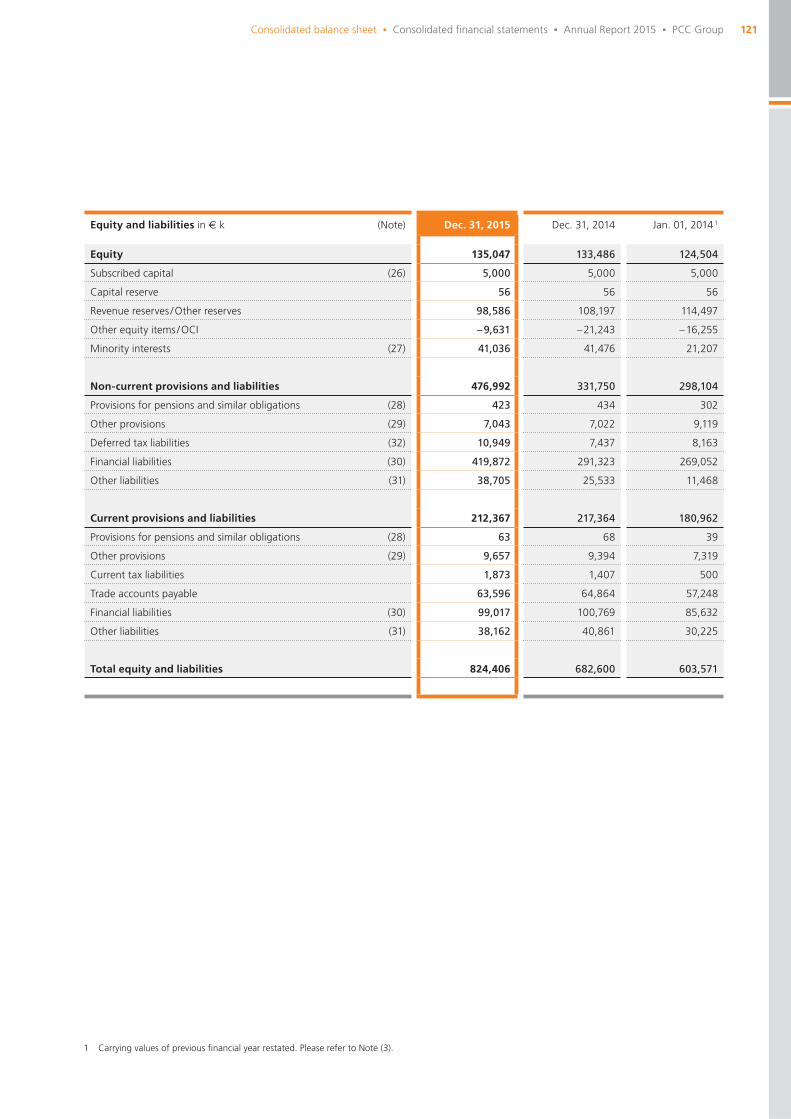
121
Equity and liabilities in € k (Note) Dec. 31, 2015 Dec. 31, 2014 Jan. 01, 2014 1
Equity 135,047 133,486 124,504
Subscribed capital (26) 5,000 5,000 5,000
Capital reserve 56 56 56
Revenue reserves / Other reserves 98,586 108,197 114,497
Other equity items / OCI – 9,631 – 21,243 – 16,255
Minority interests (27) 41,036 41,476 21,207
Non-current provisions and liabilities 476,992 331,750 298,104
Provisions for pensions and similar obligations (28) 423 434 302
Other provisions (29) 7,043 7,022 9,119
Deferred tax liabilities (32) 10,949 7,437 8,163
Financial liabilities (30) 419,872 291,323 269,052
Other liabilities (31) 38,705 25,533 11,468
Current provisions and liabilities 212,367 217,364 180,962
Provisions for pensions and similar obligations (28) 63 68 39
Other provisions (29) 9,657 9,394 7,319
Current tax liabilities 1,873 1,407 500
Trade accounts payable 63,596 64,864 57,248
Financial liabilities (30) 99,017 100,769 85,632
Other liabilities (31) 38,162 40,861 30,225
Total equity and liabilities 824,406 682,600 603,571
Consolidated balance sheet Δ Consolidated fi nancial statements Δ Annual Report 2015 Δ PCC Group
1 Carrying values of previous fi nancial year restated. Please refer to Note (3).
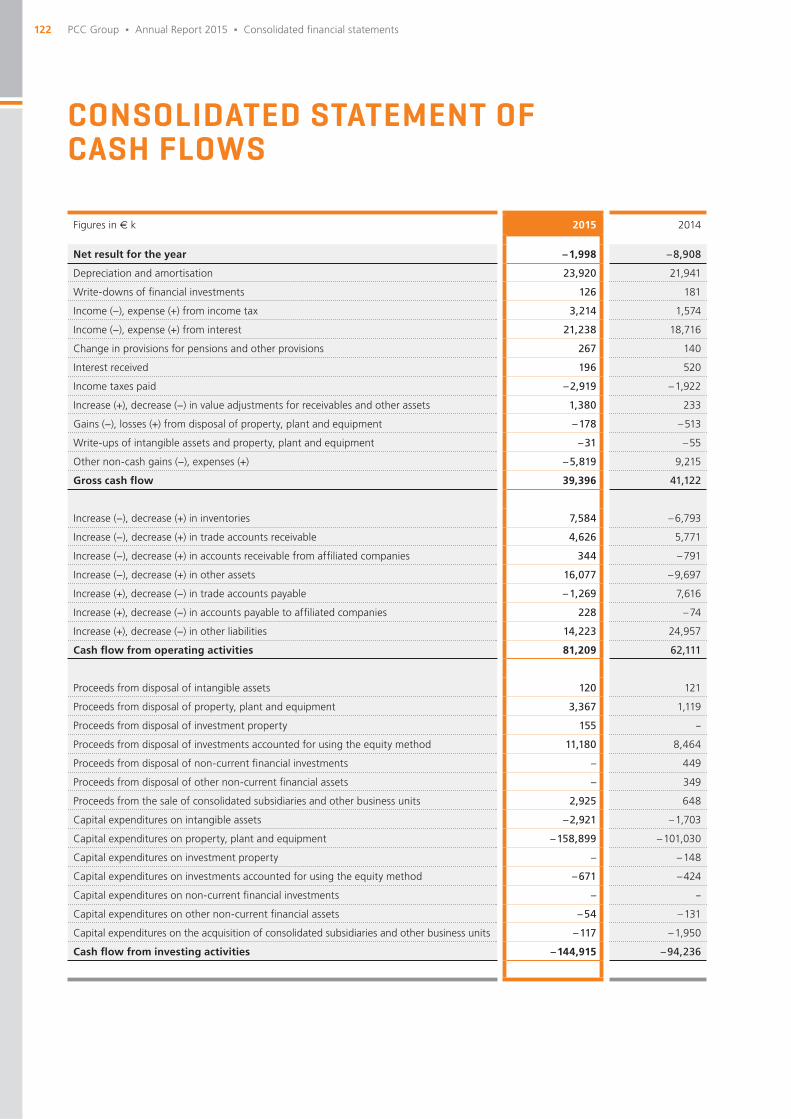
122 PCC Group Δ Annual Report 2015 Δ Consolidated fi nancial statements
Figures in € k 2015 2014
Net result for the year – 1,998 – 8,908
Depreciation and amortisation 23,920 21,941
Write-downs of fi nancial investments 126 181
Income (−), expense (+) from income tax 3,214 1,574
Income (−), expense (+) from interest 21,238 18,716
Change in provisions for pensions and other provisions 267 140
Interest received 196 520
Income taxes paid – 2,919 – 1,922
Increase (+), decrease (−) in value adjustments for receivables and other assets 1,380 233
Gains (−), losses (+) from disposal of property, plant and equipment – 178 – 513
Write-ups of intangible assets and property, plant and equipment – 31 – 55
Other non-cash gains (−), expenses (+) – 5,819 9,215
Gross cash fl ow 39,396 41,122
Increase (−), decrease (+) in inventories 7,584 – 6,793
Increase (−), decrease (+) in trade accounts receivable 4,626 5,771
Increase (−), decrease (+) in accounts receivable from affi liated companies 344 – 791
Increase (−), decrease (+) in other assets 16,077 – 9,697
Increase (+), decrease (−) in trade accounts payable – 1,269 7,616
Increase (+), decrease (−) in accounts payable to affi liated companies 228 – 74
Increase (+), decrease (−) in other liabilities 14,223 24,957
Cash fl ow from operating activities 81,209 62,111
Proceeds from disposal of intangible assets 120 121
Proceeds from disposal of property, plant and equipment 3,367 1,119
Proceeds from disposal of investment property 155 –
Proceeds from disposal of investments accounted for using the equity method 11,180 8,464
Proceeds from disposal of non-current fi nancial investments – 449
Proceeds from disposal of other non-current fi nancial assets – 349
Proceeds from the sale of consolidated subsidiaries and other business units 2,925 648
Capital expenditures on intangible assets – 2,921 – 1,703
Capital expenditures on property, plant and equipment – 158,899 – 101,030
Capital expenditures on investment property – – 148
Capital expenditures on investments accounted for using the equity method – 671 – 424
Capital expenditures on non-current fi nancial investments – –
Capital expenditures on other non-current fi nancial assets – 54 – 131
Capital expenditures on the acquisition of consolidated subsidiaries and other business units – 117 – 1,950
Cash fl ow from investing activities – 144,915 – 94,236
CONSOLIDATED STATEMENT OF CASH FLOWS
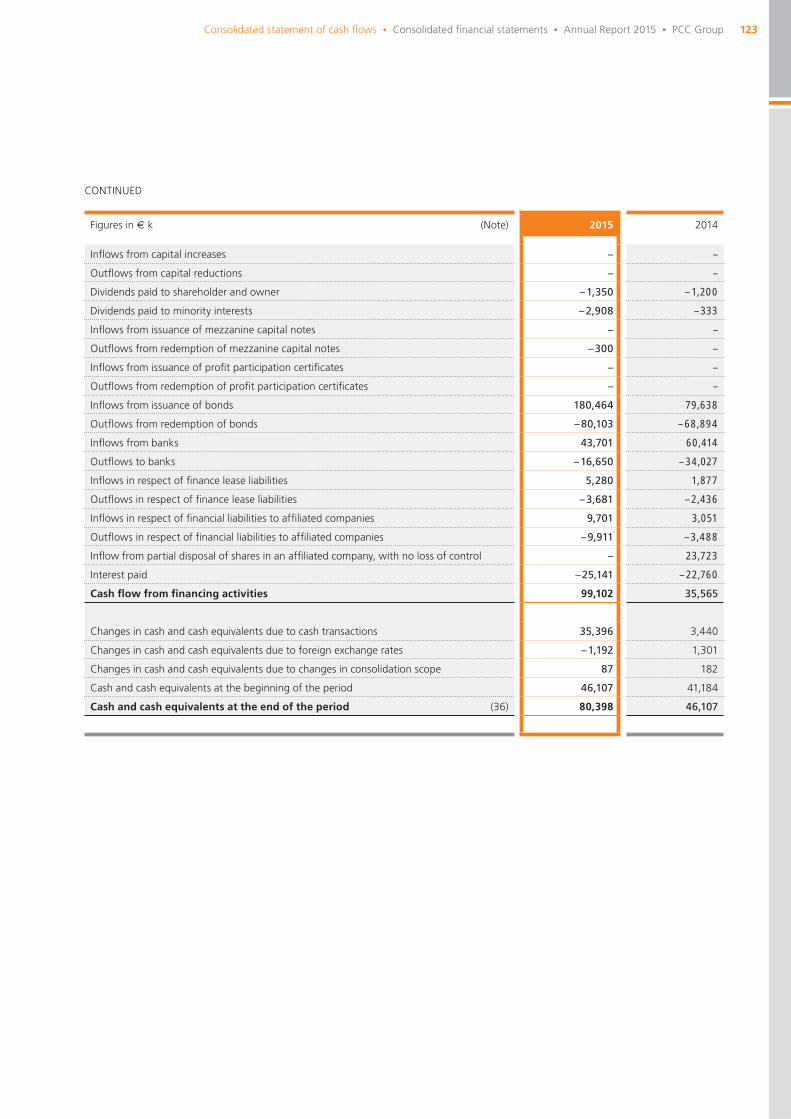
123
Figures in € k (Note) 2015 2014
Infl ows from capital increases – –
Outfl ows from capital reductions – –
Dividends paid to shareholder and owner – 1,350 – 1,200
Dividends paid to minority interests – 2,908 – 333
Infl ows from issuance of mezzanine capital notes – –
Outfl ows from redemption of mezzanine capital notes – 300 –
Infl ows from issuance of profi t participation certifi cates – –
Outfl ows from redemption of profi t participation certifi cates – –
Infl ows from issuance of bonds 180,464 79,638
Outfl ows from redemption of bonds – 80,103 – 68,894
Infl ows from banks 43,701 60,414
Outfl ows to banks – 16,650 – 34,027
Infl ows in respect of fi nance lease liabilities 5,280 1,877
Outfl ows in respect of fi nance lease liabilities – 3,681 – 2,436
Infl ows in respect of fi nancial liabilities to affi liated companies 9,701 3,051
Outfl ows in respect of fi nancial liabilities to affi liated companies – 9,911 – 3,488
Infl ow from partial disposal of shares in an affi liated company, with no loss of control – 23,723
Interest paid – 25,141 – 22,760
Cash fl ow from fi nancing activities 99,102 35,565
Changes in cash and cash equivalents due to cash transactions 35,396 3,440
Changes in cash and cash equivalents due to foreign exchange rates – 1,192 1,301
Changes in cash and cash equivalents due to changes in consolidation scope 87 182
Cash and cash equivalents at the beginning of the period 46,107 41,184
Cash and cash equivalents at the end of the period (36) 80,398 46,107
CONTINUED
Consolidated statement of cash fl ows Δ Consolidated fi nancial statements Δ Annual Report 2015 Δ PCC Group
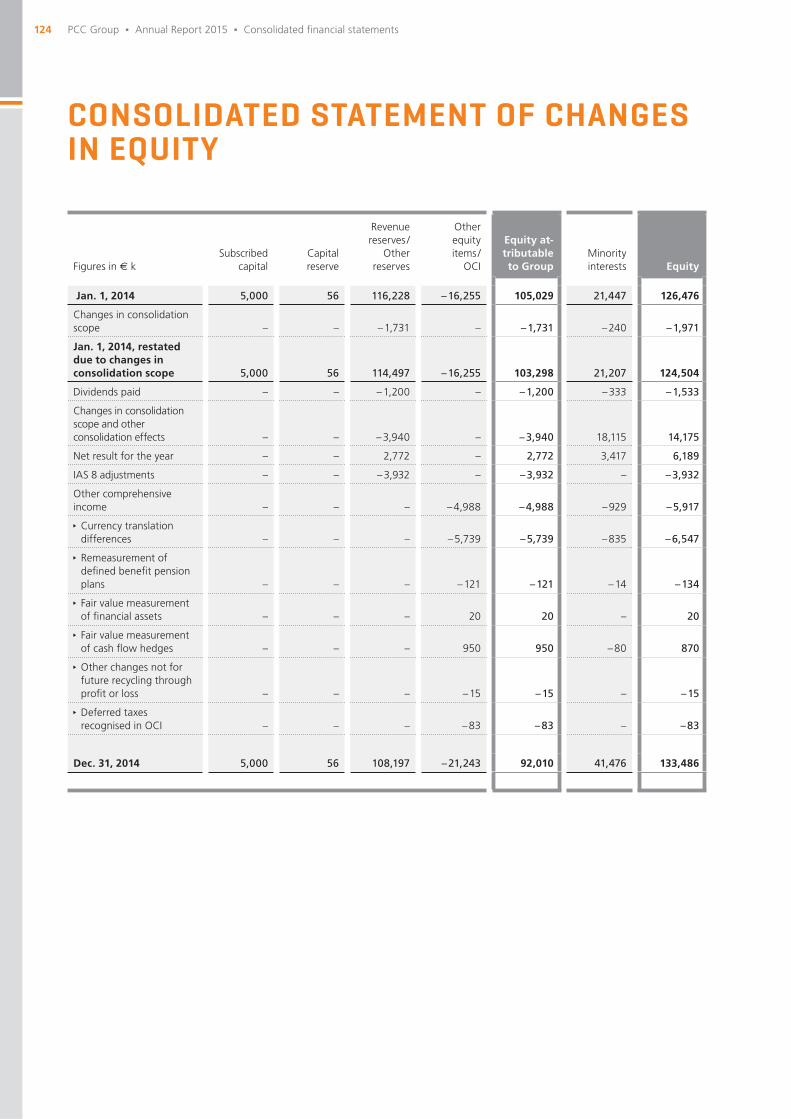
124 PCC Group Δ Annual Report 2015 Δ Consolidated fi nancial statements
Figures in € kSubscribed
capitalCapital reserve
Revenue reserves /
Other reserves
Other equity items /
OCI
Equity at-tributable to Group
Minority interests Equity
Jan. 1, 2014 5,000 56 116,228 – 16,255 105,029 21,447 126,476
Changes in consolidation scope – – – 1,731 – – 1,731 – 240 – 1,971
Jan. 1, 2014, restated due to changes in consolidation scope 5,000 56 114,497 – 16,255 103,298 21,207 124,504
Dividends paid – – – 1,200 – – 1,200 – 333 – 1,533
Changes in consolidation scope and other consolidation effects – – – 3,940 – – 3,940 18,115 14,175
Net result for the year – – 2,772 – 2,772 3,417 6,189
IAS 8 adjustments – – – 3,932 – – 3,932 – – 3,932
Other comprehensive income – – – – 4,988 – 4,988 – 929 – 5,917
Currency translation differences – – – – 5,739 – 5,739 – 835 – 6,547
Remeasurement of defi ned benefi t pension plans – – – – 121 – 121 – 14 – 134
Fair value measurement of fi nancial assets – – – 20 20 – 20
Fair value measurement of cash fl ow hedges – – – 950 950 – 80 870
Other changes not for future recycling through profi t or loss – – – – 15 – 15 – – 15
Deferred taxes recognised in OCI – – – – 83 – 83 – – 83
Dec. 31, 2014 5,000 56 108,197 – 21,243 92,010 41,476 133,486
CONSOLIDATED STATEMENT OF CHANGESIN EQUITY

125
Figures in € kSubscribed
capitalCapital reserve
Revenue reserves /
Other reserves
Other equity items /
OCI
Equity at-tributable to Group
Minority interests Equity
Jan. 1, 2015 5,000 56 108,197 – 21,243 92,010 41,476 133,486
Dividends paid – – – 1,350 – – 1,350 – 2,908 – 4,258
Changes in consolidation scope and other consolidation effects – – – 2,185 – – 2,185 – 2,133 – 4,318
Net result for the year – – – 6,076 – – 6,076 4,078 – 1,998
Other comprehensive income – – – 11,612 11,612 523 12,135
Currency translation differences – – – 4,918 4,918 527 5,445
Remeasurement of defi ned benefi t pension plans – – – – 3 – 3 – 4 – 7
Fair value measurement of fi nancial assets – – – 9,595 9,595 – 9,595
Fair value measurement of cash fl ow hedges – – – – 3 – 3 – – 3
Other changes not for future recycling through profi t or loss – – – – 14 – 14 – – 14
Deferred taxes recognised in OCI – – – – 2,882 – 2,882 – – 2,882
Dec. 31, 2015 5,000 56 98,586 – 9,632 94,010 41,036 135,047
Consolidated statement of changes in equity Δ Consolidated fi nancial statements Δ Annual Report 2015 Δ PCC Group

126 PCC Group Δ Annual Report 2015 Δ Consolidated fi nancial statements
NOTES TO THE INDIVIDUAL ITEMS OF THE CONSOLIDATED STATEMENT OF INCOME
SEGMENT REPORT
(6) Sales revenue
(7) Other internal costs capitalised
(8) Purchased goods and services
(9) Personnel expenses
(10) Other operating income
(11) Other operating expenses
(12) Income from investments accounted for using the equity method
(13) Depreciation and amortisation
(14) Interest result
(15) Currency translation result
(16) Taxes on income / tax expense
(1) General disclosures
(2) Changes in accounting policy; standards and interpretations for which application is not yet mandatory Mandatory standards and interpretations applied for the fi rst time Standards and interpretations for which application is not yet mandatory Changes in accounting policy
(3) Scope of consolidation
(4) Consolidation methods
(5) Explanatory notes to the accounting and valuation principles Property, plant and equipment Investment property Intangible assets Inventories Borrowing costs Financial instruments (IAS 39) Trade accounts receivable Cash and cash equivalents Trade accounts payable; overdrafts Provisions Taxes on income Leases (IAS 17) Revenue recognition (IAS 18) Government grants and assistance (IAS 20) Exploration for and evaluation of mineral resources (IFRS 6) Foreign currency translation Use of assumptions and estimates
128
128
128
129
130
131
132
133
133133133133 133133135135 135135135 135135135136
136137
138
138
138
139
142
142
143
144
145
146
146
148
152
SUMMARY OF THE MAIN ACCOUNTING AND VALUATION PRINCIPLES
(17) Business segment report
(18) Regional segment report
NOTES TO THE CONSOLIDATEDFINANCIAL STATEMENTS
CONTENTS
127Notes to the consolidated fi nancial statements Δ Consolidated fi nancial statements Δ Annual Report 2015 Δ PCC Group
OTHER DISCLOSURES
180
181
181
181
182
154
156 158
159 160 160 162
163 164
164
166 167
170 170
171
171172172173
176 178
179
179179
NOTES TO THE INDIVIDUAL ITEMS OF THE CONSOLIDATED BALANCE SHEET
(19) Intangible assets
(20) Property, plant and equipment
(21) Investment property
(22) Non-current fi nancial investments
(23) Inventories
(24) Trade accounts receivable
(25) Other receivables and other assets
(26) Equity
(27) Minority interests
(28) Provisions for pensions and similar obligations
(29) Other provisions
(30) Financial liabilities
(31) Other liabilities
(32) Deferred taxes
(33) Additional disclosures relating to fi nancial instruments Market risks Default or credit risks Liquidity risks Financial instruments by class and category
(34) Leases
(35) Contingent liabilities and other fi nancial commitments
(36) Statement of cash fl ows and capital structure management Statement of cash fl ows Capital structure management
(37) Related party disclosures
(38) Corporate bodies
(39) Events after the balance sheet date
(40) Miscellaneous
(41) Schedule of shareholdings in accordance with Section 313 (2) HGB
128 PCC Group Δ Annual Report 2015 Δ Consolidated fi nancial statements
SUMMARY OF THE MAIN ACCOUNTING AND VALUATION PRINCIPLES
(1) GENERAL DISCLOSURES
PCC Societas Europaea (PCC SE) is a non-listed corporation under European law headquartered in Duisburg and the parent company of the PCC Group. Its address is Moerser Str. 149, 47198 Duisburg, Germany.
The consolidated fi nancial statements of PCC SE as of De-cember 31, 2015 have been prepared in accordance with the provisions of the International Financial Reporting Stand-ards (IFRS) of the International Accounting Standards Board (IASB) and the interpretations of the International Financial Reporting Standards Interpretations Committee (IFRS IC) as applicable on the closing date and as adopted in the Eu-ropean Union (EU), and in supplementary compliance with the statutory disclosure requirements specifi ed in Section 315a (1) HGB (German Commercial Code).
Assets, liabilities and all other balance sheet items are recog-nised and measured in accordance with those IFRS applicable and mandatory as of December 31, 2015.
The closing date for the consolidated fi nancial statements is December 31, 2015, which is also the closing date for the annual fi nancial statements of PCC SE. The Group’s fi nancial year corresponds to the calendar year.
The annual and subgroup fi nancial statements of the subsid-iaries incorporated in the consolidated fi nancial statements are also prepared to this closing date.
(2) CHANGES IN ACCOUNTING POLICY; STANDARDS AND INTERPRETATIONS FOR WHICH APPLICATION IS NOT YET MANDATORY
The fi nancial statements of PCC SE and the consolidated subsidiaries are prepared in accordance with uniform ac-counting and valuation principles.
The consolidated fi nancial statements have been stated in euro. The reporting currency is the euro. Unless otherwise indicated, all amounts are disclosed in thousand euros (€ k), with the consequence that rounding differences are possible.
Individual items on the balance sheet and the statement of income of the PCC Group have been combined to improve representation clarity. These items are explained in the notes. The consolidated statement of income is structured in ac-cordance with the nature of expense method.
The PCC Group presents current and non-current assets and also current and non-current liabilities as separate classifi ca-tion groups in the balance sheet in accordance with IAS 1.60, with further subdivision according to their respective useful lives / maturities / tenors being additionally provided where appropriate in these notes to the consolidated fi nancial statements as of December 31, 2015.
The Managing Directors of PCC SE fi nalised these fi nancial statements in their meeting of June 13, 2016, whereupon they were presented to the Administrative Board for exami-nation and approval, and then released for publication.
Mandatory standards and interpretations applied for the fi rst timeApplication of the following standards and interpretations
Standard / Interpretation
Mandatory according to IASB for fi scal year beginning on or after
Mandatory for application in the EU as of
IFRIC 21 “Disclosures” January 1, 2014 June 17, 2014
Annual improvements to IFRS: Cycle 2011 – 2013 July 1, 2014 January 1, 2015
or changes thereto became mandatory for the fi rst time in respect of the consolidated fi nancial statements as of De-cember 31, 2015.
The above did not have any material impact on the consoli-dated fi nancial statements of PCC SE.
129Notes to the consolidated fi nancial statements Δ Consolidated fi nancial statements Δ Annual Report 2015 Δ PCC Group
Standards and interpretations for which application is not yet mandatoryThe IASB has published the standards and interpretations and/or amendments thereto listed in the following which are
Standard / InterpretationMandatory fi rst-time applica-tion according to IASB as of
Mandatory fi rst-time application in the EU
Amendments to IAS 7 “Statement of Cash Flows” January 1, 2017 Not yet known
IFRS 9 “Financial Instruments” January 1, 2018 Not yet known
IFRS 14 “Regulatory Deferral Accounts” January 1, 2016 No EU endorsement
IFRS 15 “Revenue from Contracts with Customers” January 1, 2018 Not yet known
IFRS 15 “Clarifi cations to ‘Revenue from Contracts with Customers’” January 1, 2018 Not yet known
IFRS 16 “Leases” January 1, 2019 Not yet known
Amendments to IAS 1 “Disclosure Initiative” January 1, 2016 January 1, 2016
Amendments to IAS 12 “Income Taxes” January 1, 2017 Not yet known
Amendments to IAS 16 and IAS 38 “Clarifi cation of Acceptable Methods of Depreciation and Amortisation” January 1, 2016 January 1, 2016
Amendments to IAS 16 and IAS 41 “Agriculture: Bearer Plants” January 1, 2016 January 1, 2016
Amendments to IAS 19 “Defi ned Benefi t Plans: Employee Contributions” July 1, 2014 February 1, 2015
Amendments to IAS 27 “Equity Method in Separate Financial Statements” January 1, 2016 January 1, 2016
Amendments to IFRS 10 and IAS 28 “Sale or Contribution of Assets between an Investor and its Associate or Joint Venture” Yet to be determined Not yet known
Amendments to IFRS 11 “Accounting for Acquisitions of Interests in Joint Operations” January 1, 2016 January 1, 2016
Annual improvements to IFRS: Cycle 2010 – 2012 July 1, 2014 February 1, 2015
Annual improvements to IFRS: Cycle 2012 – 2014 January 1, 2016 January 1, 2016
Amendments to IFRS 10, IFRS 12 and IAS 28 “Investment Entities: Applying the Consolidation Exception” January 1, 2016 Not yet known
The PCC Group is currently determining the extent to which new, not yet mandatory standards and interpretations will infl uence the consolidated fi nancial statements. Unless oth-erwise indicated below, the current expectation is that the standards and interpretations listed above that are not yet mandatory will not have a material impact on the consolidat-ed fi nancial statements.
IFRS 15 “Revenue from Contracts with Customers”In May 2014, the IASB published the new standard IFRS 15 “Revenue from Contracts with Customers”. The purpose of this new standard relating to revenue realisation is to bring together the many regulations contained in the various standards and interpretations that have existed to date. At the same time, uniform basic principles are defi ned which are applicable to all industries and for all kinds of sales trans-action. The questions as to how much and at what date or across what period revenue is to be recognised as realised are answered with the aid of a fi ve-step model. The stand-ard also contains a number of other regulations covering questions of detail and also an extension to the notes that
is required. The new standard is mandatory as of fi scal years beginning on or after January 1, 2018. First-time application must be retrospective. However, various simplifi cation op-tions are granted; earlier application is permissible. The EU has yet to adopt the changes. The PCC Group expects that the notes to the consolidated fi nancial statements will be ex-panded once the standard has been applied. Further effects are currently under investigation.
IFRS 16 “Leases”In January 2016, the IASB published the new standard IFRS 16 “Leases”. IFRS 16 establishes principles for the rec-ognition and measurement, disclosure and notes required in respect of leases. The objective is to ensure that lessees and lessors are provided with relevant information with respect to the effects of leasing transactions. At the same time, the previous accounting model according to IAS 17, in which leases were classifi ed as operating or fi nancial, was discarded in favour of a lease accounting concept in keeping with the concept of control. For the lessee, the standard provides for a single accounting model. In the case of the lessee, it means
not yet mandatory as of fi scal 2015. Some of these standards and interpretations have not yet been endorsed by the EU and have not yet been applied by the PCC Group.

130 PCC Group Δ Annual Report 2015 Δ Consolidated fi nancial statements
that all assets and liabilities arising from a lease agreement must be disclosed in the balance sheet where the term ex-ceeds 12 months, or where the asset concerned is not classed as minor (option). For accounting purposes, the lessor con-tinues to distinguish between fi nance or rental lease agree-ments (fi nance or operating leases). Application of IFRS 16 “Leases” becomes mandatory as of fi scal years starting on or after January 1, 2019. Application in advance of this date is allowed provided that IFRS 15 “Revenue from Contracts with Customers” is already being applied in full in advance of its mandatory date. The lessor must apply IFRS 16 either in full and retrospectively, taking into account earlier reporting periods, or must recognise the cumulative adjustment effect as of the date of fi rst-time application as an equity entry at the start of the fi scal year in which the standard is fi rst ap-plied. The EU has yet to adopt the standard. The PCC Group is currently examining the impact of the fi rst-time applica-tion of IFRS 16 on the consolidated fi nancial statements and will determine the date of fi rst-time application and also the transition method to be applied once it has been adopted in this form by the EU.
IFRS 9 “Financial Instruments”:Classifi cation and measurement IFRS 9 “Financial Instruments” contains regulations for the disclosure, recognition, derecognition and also the account-ing of hedge relationships. The IASB published the fi nal ver-sion of the standard on July 24, 2014 in the course of fi nalis-ing the various phases of its comprehensive project in relation to fi nancial instruments. As a result, the previous accounting methods applied to fi nancial instruments as specifi ed under IAS 39 “Financial Instruments: Recognition and Measure-ment” can be entirely replaced by the accounting methods described in IFRS 9. The now published version of IFRS 9 su-persedes all previous versions. The central requirements of the fi nal IFRS 9 standard can be summarised as follows:
∂ The requirements of IFRS 9 relating to scope of applica-tion, recognition and derecognition remain largely un-changed compared to the preceding standard IAS 39.
∂ However, the provisions of IFRS 9 introduce a new classifi -cation model for fi nancial assets that is absent from IAS 39.
∂ The subsequent measurement of fi nancial assets is to be aligned in future to three categories with different value cri-teria and a different method of value change recognition. Categorisation is performed as a function both of the con-
tractual cash fl ows emanating from the instrument and of the business model in which the instrument is held. Essentially, these are therefore mandatory categories. In addition, however, the company or entity also a number of options available to it.
∂ By contrast, the existing requirements in respect of fi nan-cial liabilities were extensively adopted in IFRS 9. The only signifi cant change relates to fi nancial liabilities in the fair value option. Fair value fl uctuations in these liabilities due to changes of a company’s own risk of default are to be recognised under other comprehensive income.
∂ IFRS 9 provides for three stages which, in future, will deter-mine both the level of loss to be recognised and the treat-ment of interest income. Accordingly, losses already expect-ed on receipt are to be recognised on the basis of the cash value of a 12-month expected credit loss (Stage 1). If there is a signifi cant deterioration in credit quality, the risk provi-sion needs to be increased to the level of the expected loss-es over the entire remaining life of the fi nancial instrument (Stage 2). On receipt of an objective indication of impairment, interest revenue is calculated on the net carrying amount – i.e. it is reduced for expected credit losses (Stage 3).
∂ In addition to extensive transitional provisions, IFRS 9 also specifi es comprehensive disclosure regulations in respect of both the transition and current application. Changes compared to IFRS 7 “Financial Instruments: Disclosures” relate particularly to the impairment requirements.
The fi nal IFRS 9 will be mandatorily effective for periods beginning on or after January 1, 2018; earlier application is permitted. The EU has not yet adopted the changes. The PCC Group anticipates that the future application of IFRS 9 may affect the presentation of fi nancial assets and fi nan-cial liabilities of the Group. However, it will only be possible to provide a reliable assessment of the effects of applying IFRS 9 after a detailed analysis has been carried out.
Changes in accounting policyThe reduction in participating interest recognised through profi t or loss in the previous year with respect to PCC Rokita SA, Brzeg Dolny (Poland), has been retrospectively restated in accordance with IFRS 10 B.96. This results in a reduction in the prior-year earnings and a corresponding increase in revenue reserves of € 3.9 million. For more details, please see the statement of changes in equity.

131Notes to the consolidated fi nancial statements Δ Consolidated fi nancial statements Δ Annual Report 2015 Δ PCC Group
(3) SCOPE OF CONSOLIDATION
The basis for consolidation of the entities incorporated in the consolidated fi nancial statements was provided by the annualfi nancial statements (or commercial balance sheets II accord-ing to IFRS) of the companies as of December 31, 2015. The consolidated fi nancial statements as of this closing date were prepared on the basis of uniform accounting and valuation principles (IFRS). Included in the consolidated fi nancial state-ments as of December 31, 2015 are the fi nancial statements of the parent company PCC SE and those of subsidiaries over which the parent company exerts control.
Subsidiaries not responsible for material business operations and regarded individually and in aggregate as being immate-rial in terms of portraying a true and fair view of the net as-sets, fi nancial position, results of operations and cash fl ows of the Group, have been omitted from the consolidation process and are therefore not refl ected in the consolidated annual fi nancial statements.
Following an updated materiality assessment, certain sub-sidiaries previously not fully consolidated have now been included in the consolidated fi nancial statements on appli-cation of IAS 8.22, which means that incorporation is retro-spective. The entities involved are as follows:
∂ PCC BakkiSilicon hf, Húsavík (Iceland)
∂ PCC NEW HYDRO DOOEL, Skopje (Republic of Macedonia)PCC Energia EOOD, Sofia (Bulgaria)
∂ PCC EXOL Kimya Sanayi ve Ticaret Limited Şirketi, Istanbul (Turkey)
∂ PCC Packaging, Brzeg Dolny (Poland)
∂ Novi Energii OOD, Sofia (Bulgaria)
∂ PCC Izvorsko, Sofia (Bulgaria)
These adjustments mean that comparison with the previous year is only possible to a limited degree.
The entity PCC BakkiSilicon hf, Húsavík (Iceland), became ma-terial on successful conclusion of the fi nancing agreements and with the advent of the turnkey contract with a plant constructor, and was therefore included in the consolidation scope. The fi nal closing with the fi nancing partners was achieved with respect to this project in June 2015. The pro-ject company also received a capital increase. The stake held by PCC SE therefore rose to a current fi gure of 86.5 %. The minority shareholders take the form of a consortium of Ice-landic pension funds and an Icelandic bank. The project com-pany is responsible for the construction and operation of a silicon metal smelting plant in Iceland.
The consolidation scope was also expanded by a further entity accounted for using the equity method. Here also, the prior-year fi gures have had to be restated:
∂ OOO DME Aerosol, Pervomaysky (Russia)
This company is a joint venture with a Russian partner compa-ny. Located on the production site of JSC Shchekinoazot, the joint venture is undertaking the construction of a plant for the manufacture of dimethyl ether (DME). PCC SE holds a direct share of 50.0 % in the voting and capital rights of this joint venture.
For a detailed schedule of shareholdings in accordance with Section 313 (2) HGB (German Commercial Code), please refer to Note (41).
Fully consolidated subsidiaries Germany Abroad
Jan. 1, 2014 4 37
∂ Additions 1 2
∂ Disposals / Mergers – 2
Jan. 1, 2015 5 37
∂ Additions – 2
∂ Disposals / Mergers – 1
Consolidated subsidiaries as of Dec. 31, 2015 5 38
There was an addition to the scope of consolidation in fi scal 2015 within the Polyols segment in the form of PCC Therm Sp. z o.o., Brzeg Dolny (Poland). The company was re-established as a new entity in the year under review and is responsible for the production and marketing of PU-based thermal insulation products.
A further company was newly established in 2015 in the form of distripark.com Sp. z o.o., Brzeg Dolny (Poland). Operat-ing on a group-wide and cross-segment basis, this entity is developing the direct sale of PCC products in standard household and small commercial quantities via an internet portal.
132 PCC Group Δ Annual Report 2015 Δ Consolidated fi nancial statements
(4) CONSOLIDATION METHODS
The consolidated fi nancial statements of the PCC Group contain all the material German and international subsidiar-ies over which PCC SE is able to exercise control.
Subsidiaries are fully consolidated from the time of acquisition. The time of acquisition is defi ned as the time at which the parent company acquires control over these Group entities. Subsidiaries remain included in the consolidated fi nancial statements until they are no longer under the control of the parent company.
All intercompany receivables and payables and intra-Group income and expenses are eliminated on consolidation. Inter-company results are, where material, also eliminated.
The acquisition of subsidiaries is accounted for using the pur-chase method. The consideration transferred in the course of a business combination is measured at fair value. This is determined from the total of the fair values of the assets transferred at the time of acquisition less the liabilities as-sumed from the previous owners of the acquired entity and the equity instruments issued by the Group in exchange for control of the acquired entity. Transaction costs associated with business combinations are expensed against income on incurrence.
The purchase price is distributed between the acquired assets and liabilities on fi rst-time consolidation. Any positive differ-ence between the purchase price and the amount allocated
is recorded as goodwill. Goodwill thus arises as the surplus represented by the total of the consideration transferred plus the amount of all non-controlling shares in the acquired company and the fair value of the equity share previously held by the acquirer in the acquired entity (where applicable) above the balance of the fair values of the acquired identifi -able assets and liabilities assumed on the date of acquisition. In the event that a negative difference is identifi ed, and remains confi rmed after a second assessment, this is immediately recognised as income. Any goodwill recognised is subjected to an impairment test at least once a year. For further details, please see Note (19).
Participating interests in associated companies and joint ar-rangements, i.e. those entities accounted for using the equity method, are recognised at cost in the consolidated balance sheet. In the following periods, the annual net profi t or loss realised is proportionally allocated in accordance with the equity value approach. The dividends received in the report-ing year are then deducted from the equity value. The dif-ferences that may arise on fi rst-time consolidation are taken into account in the equity approach. At each balance sheet date, the Group investigates whether there are indications that an impairment loss needs to be recognised with respect to an associated company or a joint venture. In this case, the difference between the carrying amount and the expected net realisable value is recognised as an impairment loss un-der income from investments accounted for using the equity method in the consolidated statement of income.
None of the additions named fall under the scope of IFRS 3.
The company 3S S.A., previously accounted for using the equity method, and 3Services Factory S.A., both domiciled in Katowice (Poland), were sold and eliminated from the consolidation.
In addition, PCC Utilities Sp. z o.o., Brzeg Dolny (Poland), was liquidated as an inactive entity and removed from the com-mercial register.
In the case of S.C. Oltchim S.A., Râmnicu Vâlcea (Romania), which is listed in the schedule of shareholdings under Note (41), PCC SE has no codetermination rights whatsoever that would enable it to exert a signifi cant infl uence over the company.
133Notes to the consolidated fi nancial statements Δ Consolidated fi nancial statements Δ Annual Report 2015 Δ PCC Group
An item of property, plant and equipment is derecognised either on disposal or when the further use or disposal of the asset is no longer expected to generate any economic ben-efi t. The gains or losses arising from the derecognition of the asset are determined as the difference between the net proceeds and the book value/carrying amount of the asset, and recognised through profi t or loss in the period in which the asset is derecognised. Value write-ups arising from im-pairment reversals are recognised in other operating income.
The residual values, useful lives and depreciation methods are regularly reviewed and, where required, adapted at the end of each fi scal year.
Investment propertyInvestment property, i.e. real estate held for the purpose of generating rental income or value increase, is capitalised at cost. Value write-ups are recognised under other operating income, write-downs/impairments are recognised under de-preciation.
Assets in this category are accounted for using the acqui-sition cost model and subjected to scheduled depreciation over a useful life ranging between 28 and 33 years.
Intangible assetsAcquired intangible assets are recognised at cost less accu-mulated amortisation and accumulated impairment charges. Only those intangible assets acquired from third parties are capitalised, as the prerequisites for capitalisation of internally generated intangible assets are not fulfi lled. Intangible assets are capitalised and generally amortised using the straight-line method over their estimated useful lives ranging between
2 and 20 years, and relate essentially to concessions for the operation of technical facilities. The intangible assets capital-ised within the Group – other than goodwill – have limited useful lives.
Research and development expenses are accounted for in accordance with IAS 38 “Intangible Assets”. Research costs are expensed on incurrence. Development expenses may be capitalised under certain circumstances (see IAS 38.57), depending on the possible outcome of the associated devel-opment activities. Development expenses of a project qualify for capitalisation where the Group can prove that the pro-ject is both technically feasible, resulting in the generating of internal benefi ts, or allowing the sale of an asset, and that both the intention and the funds exist to complete said asset and to utilise or sell it. Assessment of this possible out-come necessitates material assumptions by the management involved. Moreover, the Group must verify that the expendi-tures to be allocated to the intangible asset during its devel-opment can be reliably calculated.
InventoriesRaw materials and supplies and also fi nished products and work in progress are recognised at cost. Capitalisation of the cost of borrowings in accordance with IAS 23 does not take place in the case of inventories as the prerequisites for this are not met. The acquisition or manufacturing cost of raw materials and supplies is essentially determined using the fi rst in, fi rst out method (FIFO). In isolated, negligible cases, however, the weighted average method may be used instead. Inventories are subjected to a valuation adjustment as of the closing date where the net realisable value is less than the carrying value.
Borrowing costsDirectly attributable borrowing costs incurred as part of the acquisition, construction or manufacture of a qualifying asset are capitalised as part of the cost of acquisition, construction or manufacture. They remain capitalised until the asset is ready for its envisaged use, with the relevant interest rate being duly applied. All other borrowing costs are expensed in the period in which they are incurred.
Financial instruments (IAS 39)Financial instruments take the form of fi nancial assets and fi nancial liabilities. They are disclosed in the consol-idated balance sheet where PCC SE or a subsidiary is a contractual party to the associated transaction. Financial assets are derecognised once the contractual rights to payments from the fi nancial assets expire or the fi nan-cial assets are transferred to another party together with all material risks and opportunities. Financial liabilities are derecognised once the contractual obligations are settled, cancelled or have expired. Regular-way purchases and sales
(5) EXPLANATORY NOTES TO THE ACCOUNTING AND VALUATION PRINCIPLES
Property, plant and equipmentProperty, plant and equipment are recognised at cost less accumulated scheduled depreciation and accumulated im-pairment charges, in accordance with IAS 16. The revaluation method is not applied. Costs for repairs and maintenance of property, plant and equipment are immediately expensed. Regular maintenance of major plant or the replacement of major components is capitalised where additional future benefi ts are anticipated. The scheduled straight-line depreci-ation amounts are based on the following useful lives:
in years 2015 2014
Buildings and structures 5 – 80 5 – 80
Plant and machinery 3 – 30 3 – 30
Factory and offi ce equipment 1 – 29 1 – 29
Investment property 28 – 33 28 – 33
134 PCC Group Δ Annual Report 2015 Δ Consolidated fi nancial statements
of fi nancial assets are recognised as of the settlement date, that is to say the date on which the Group commits to the purchase or sale of the asset.
Within the PCC Group, fi nancial assets are classifi ed in ac-cordance with the following categories: (a) “At fair value through profi t or loss”; (b) “Loans and receivables”; or (c) “Available for sale”. Classifi cation depends on the nature of the assets and their purpose. The management determines the classifi cation of fi nancial assets on fi rst-time recognition.
Financial assets that do not belong to the category “At fair value through profi t or loss” are initially recognised at their fair value plus transaction costs. Financial assets which be-long to the category “At fair value through profi t or loss” are initially recognised at their fair value, while the associated transaction costs are immediately expensed.
a) Financial assets recognised at fair value through profi t or loss
Financial assets recognised at fair value through profi t or loss are those held for trading or which have been designated as belonging to this category on fi rst-time recognition. A fi nancial asset is assigned to this category if it has essentially been acquired with a view to short-term resale. Derivatives likewise belong to this category where they are not qualifi ed as hedges. Financial assets measured at fair value through profi t or loss are recog-nised at their fair value. Any gain or loss arising from (re-)measurement is added or deducted from income.
b) Loans and receivables Loans and receivables are non-derivative fi nancial assets
with fi xed or determinable cash fl ows that are not quoted on an active market. Financial assets assigned to this cate-gory are recognised in the balance sheet under “Trade ac-counts receivable”, “Other receivables and other assets” and “Cash and cash equivalents”. Loans and receivables are subsequently stated at amortised cost using the effec-tive interest method. If there are objective indications of impairment, they are subjected to individual value allow-ances. The assessment of the value allowance require-ment is based on experience with respect to the solven-cy of the customer, the age structure of the asset, days overdue, any existing insurance policies, and customer-specifi c risks.
c) Financial assets available for sale Financial assets available for sale are non-derivative fi -
nancial assets which do not fall into any of the other categories described. They are measured at fair value. The fair values are essentially determined on the basis of market prices or quotations. Participating interests of which the fair value cannot be reliably determined are measured at cost and written down on impairment. In the case of such participating interests, the cost of ac-
quisition represents the best estimate of the fair value. Assets that fall under this heading include shares in sub-sidiaries, associates and joint ventures which, for reasons of materiality, are not fully consolidated or are included in the consolidated fi nancial statements using the equity method. There are generally no plans to sell these partic-ipating interests to any signifi cant degree.
Changes in the book values / carrying amounts of monetary fi -nancial instruments denominated in a foreign currency within the category of fi nancial assets available for sale are recog-nised through profi t or loss where such changes result from fl uctuations in foreign exchange rates. Other changes in the book value / carrying amount of fi nancial assets available for sale are recognised under other comprehensive income. In-terest gains arising from application of the effective interest method in respect of securities in the category “Available for sale” are recognised through profi t or loss. Dividends payable on equity instruments available for sale are taken to income once the Group becomes legally entitled to payment.
If fi nancial assets classifi ed as available for sale are sold or become impaired, the cumulative changes in fair value recognised in equity are recycled through profi t and loss.
Financial liabilities are categorised either at fair value through profi t or loss or as other fi nancial liabilities. The rules govern-ing initial recognition and measurement and the treatment of transaction costs are similar to those applicable to fi nan-cial assets. With fi nancial liabilities recognised at fair value through profi t or loss, gains and losses arising from subse-quent measurement in the following periods are taken to in-come. Other fi nancial liabilities are measured in subsequent periods at amortised cost in accordance with the effective interest method.
Financial assets and liabilities are only offset and disclosed as a net amount in the balance sheet where there is a legal entitlement to do so and the intention is to settle on a net basis or to discharge the associated liability simultaneously with realisation of the associated asset.
Derivative fi nancial instruments are initially recognised at fair value as of conclusion of the associated contract. Subsequent measurement is likewise at fair value as of the respective re-porting date. The method for recognising gains and losses depends on whether the derivative fi nancial instrument is des-ignated as a hedge and, if so, on the nature of the hedged item. The PCC Group designates certain derivative fi nancial instruments either as a) a fair value hedge of a recognised as-set, a liability or an unrecognised fi rm commitment (fair value hedge), b) a hedge against the risks of fl uctuating cash fl ows (cash fl ow hedge) associated with a recognised asset or a rec-ognised liability or an expected future transaction with a high probability of occurrence, or c) as a hedge of a net investment in a foreign business operation (net investment hedge). In the
135Notes to the consolidated fi nancial statements Δ Consolidated fi nancial statements Δ Annual Report 2015 Δ PCC Group
reporting year and also in the previous year, the PCC Group only had cash fl ow hedges to account for.
On conclusion of a transaction, the Group documents the hedge relationship between the hedging instrument and the main transaction, the purpose of the associated risk man-agement and also the underlying strategy with respect to hedging transactions. Estimates are also documented both at the beginning of the hedging relationship and thereafter as to whether the derivatives used in the hedging relation-ship extensively compensate for changes in the fair value or the cash fl ows of the underlying transactions.
The effective portion of changes in the fair value of deriv-atives designated as cash fl ow hedges is recognised under other comprehensive income, with the ineffective portion being recognised directly through profi t and loss. Amounts accrued under equity are recycled to profi t or loss in the peri-od in which the hedged underlying affects income.
In the event that a hedging transaction expires, is sold or no longer fulfi ls the criteria for recognition as a hedge, the gain or loss accumulated in equity remains in equity and is only recycled to profi t or loss once the originally hedged, future transaction takes place. If the future transaction is no longer expected to occur, the cumulative gains or losses in equity are immediately recycled to profi t or loss.
Trade accounts receivable Trade accounts receivable are recognised at amortised cost. In the event of value adjustments, these are recognised direct-ly in the receivable concerned. Value adjustments are allocat-ed to receivables from insolvent debtors and also receivables that are more than 365 days overdue. Receivables denom-inated in foreign currency are converted as of the closing date at the applicable euro exchange rate, with any trans-lation differences being recognised through profi t or loss.
Cash and cash equivalentsCash and cash equivalents encompass cash balances and cheques, credit balances at banks with a term of up to three months from the date of acquisition, and also highly liquid fi nancial assets available at short notice. These items are rec-ognised at amortised cost. Trade accounts payable; overdraftsTrade accounts payable, overdraft liabilities and other liabili-ties are recognised at their repayable or settlement amount.
ProvisionsProvisions are created where a past event has given rise to an obligation towards third parties that is likely to lead in the future to an outfl ow of funds, and where the amount involved can be reliably estimated.
Taxes on incomeThe PCC Group accounts for deferred taxes in accordance with IAS 12 where differences exist between the carrying amount and the tax base of an asset. Deferred tax liabilities are essentially recognised on all taxable temporary differenc-es, while deferred tax assets are only recognised where it is probable that taxable profi ts will be available to enable their realisation. The carrying value of deferred income tax assets is examined on each closing date and reduced to the extent that it is no longer probable that suffi cient income will be available against which the deferred tax asset can be at least partially realised. Deferred income tax assets not recognised in an earlier period are reassessed at each closing date and recognised to the extent that it currently appears probable that future taxable profi ts will allow realisation of the de-ferred tax asset.
Deferred tax liabilities and deferred tax assets are netted where there is a right to do so and where they involve the same tax authority.
Current taxes are calculated on the basis of the taxable in-come of the company for the reporting period. The tax rates applied for each company are those applicable as of the clos-ing date.
Leases (IAS 17)Concluded lease contracts are treated as either fi nance leas-es or operating leases. Where material opportunities and risks are transferred to the Group as the lessee, the Group is also assigned economic ownership. In the case of contracts that qualify as operating leases, the current lease instalments are immediately expensed. Assets held as fi nance leases are either capitalised at the present value of the minimum lease payments or the fair value of the leased item at the inception of the lease, whichever is the lower. In the event that change of ownership to the lessee at the end of the contractual peri-od is not suffi ciently ensured, these assets are either written down over the term of the lease or over their useful life, whichever period is shorter. A lease liability is also recognised in the corresponding amount. The periodic lease payments have to be divided into repayment and interest components. The repayment component reduces the liability, while the interest component is recognised as an interest expense.
Revenue recognition (IAS 18)The company recognises revenue in compliance with IAS 18 where the selling process has been completed and the risks and opportunities associated with ownership have been transferred to the purchaser. The Group essentially recognis-es its sales revenue with the sale of its products and services.
Government grants and assistance (IAS 20)Government grants and assistance are recognised in the consolidated fi nancial statements of the PCC Group as deferred income on the liabilities side, provided that there

136 PCC Group Δ Annual Report 2015 Δ Consolidated fi nancial statements
is reasonable assurance that the entity will comply with any conditions attached to the grant or assistance, and that the grant or assistance will be received. The release of this deferred income is effected through profi t and loss under other operating income over the full period of depreciation assigned to the asset created.
Exploration for and evaluation of mineral resources (IFRS 6)Expenditures on viable exploration drilling operations and also for non-productive drilling operations are capitalised. The expenditures are recognised through to exploitation as assets in course of construction. Once production begins on a positive fi nd, the asset is reclassifi ed to plant and ma-chinery. The capitalised expenses are amortised over the maximum period of production as determined by expert ap-praisal. If annual investigation of the resources should result in a change in this lifetime estimate, the depreciation period is adjusted accordingly. In the event of the fi nd being deter-mined as unviable in subsequent periods, the asset is written off by way of an unscheduled impairment.
Foreign currency translationThe consolidated fi nancial statements have been prepared in euro, the functional currency of the parent company.
Each company within the Group determines its own function-al currency. The items contained in the fi nancial statements of the company concerned are measured using this functional currency. Foreign currency transactions are initially translated into the functional currency at the spot rate applicable on the transaction date.
Monetary assets and liabilities in a foreign currency are trans-lated into the functional currency on each closing date using the spot rate applicable as of that date. All foreign exchange
differences are recognised through profi t or loss with the exception of translation differences arising from foreign currency loans where these are recognised as hedges of a net investment in a foreign operation. These are recognised directly in equity until the net investment is sold, and only on derecognition are they recycled through profi t or loss. Deferred taxes arising from the translation differences of these foreign currency loans are likewise recognised directly in equity.
For entities for which the euro is not the functional currency, non-monetary items that are measured at historical cost in a foreign currency are translated at the rate prevailing on the date of the transaction. Non-monetary items measured at their fair value in a foreign currency are translated at the rate applicable at the time of ascertaining the fair value.
All assets and liabilities resulting from the acquisition of a for-eign operation are recognised as assets and liabilities of that foreign operation and translated at the spot rate prevailing on the closing date.
For entities for which the euro is not the functional currency, the assets and liabilities of foreign operations are translated into euro as of the closing date. Income and expenses are translated at the weighted average rate for the fi scal year. The translation differences arising from this are recognised as a separate item in equity.
The accumulated amount recognised for a foreign operation in equity is recycled through profi t or loss on disposal of that foreign operation.
The exchange rates of the currencies of importance to the consolidated fi nancial statements are indicated in the follow-ing table:
Closing rate Average rate
Currency exchange rate for 1 € Dec. 31, 2015 Dec. 31, 2014 2015 2014
Bosnian convertible mark (BAM) 1.9558 1.9558 1.9558 1.9558
Bulgarian lev (BGN) 1.9558 1.9558 1.9558 1.9558
Belarusian ruble (BYR) 20,304.29 13,395.61 17,505.36 13,592.89
Czech koruna (CZK) 27.0230 27.7350 27.2790 27.5359
Macedonian denar (MKD) 61.5947 61.4814 61.6098 61.6228
Polish zloty (PLN) 4.2639 4.2732 4.1841 4.1843
Romanian leu (RON) 4.5240 4.4823 4.4454 4.4437
Russian ruble (RUB) 80.6736 72.3370 68.0720 50.9518
Turkish lira (TRY) 3.1765 2.8320 3.0255 2.9065
US dollar (USD) 1.0887 1.2141 1.1095 1.3285
137Notes to the consolidated fi nancial statements Δ Consolidated fi nancial statements Δ Annual Report 2015 Δ PCC Group
Use of assumptions and estimates Preparation of the consolidated fi nancial statements as of December 31, 2015 in compliance with IFRS requires certain estimates and assumptions to be made by the management that infl uence the amount recognised as assets, liabilities, contingent receivables and contingent liabilities as of the reporting date, and also the income and expenses gener-ated during the fi scal year. The main areas of application for assumptions, estimates and the exercise of discretion-ary scope are encountered in determining the useful lives of non-current assets, the recognition and measurement of other reserves and pension reserves, and also income tax. It is also necessary when determining goodwill impairment to
assess the value-in-use of the cash-generating unit to which the goodwill is assigned. Calculation of the value-in-use re-quires an estimate of future cash fl ows from the cash-gener-ating unit and also a suitable discount rate for determining the present value of those future cash fl ows. Estimates are based on empirical values and other assumptions considered appropriate under the given circumstances. They are con-tinuously reviewed and may deviate from the actual values and fi gures that come to light. The book values / carrying amounts of items affected by estimates can be found in the following Notes and also in the balance sheet. Discretionary decisions which are not based on estimates occur, for exam-ple, in relation to the categorisation of lease contracts.
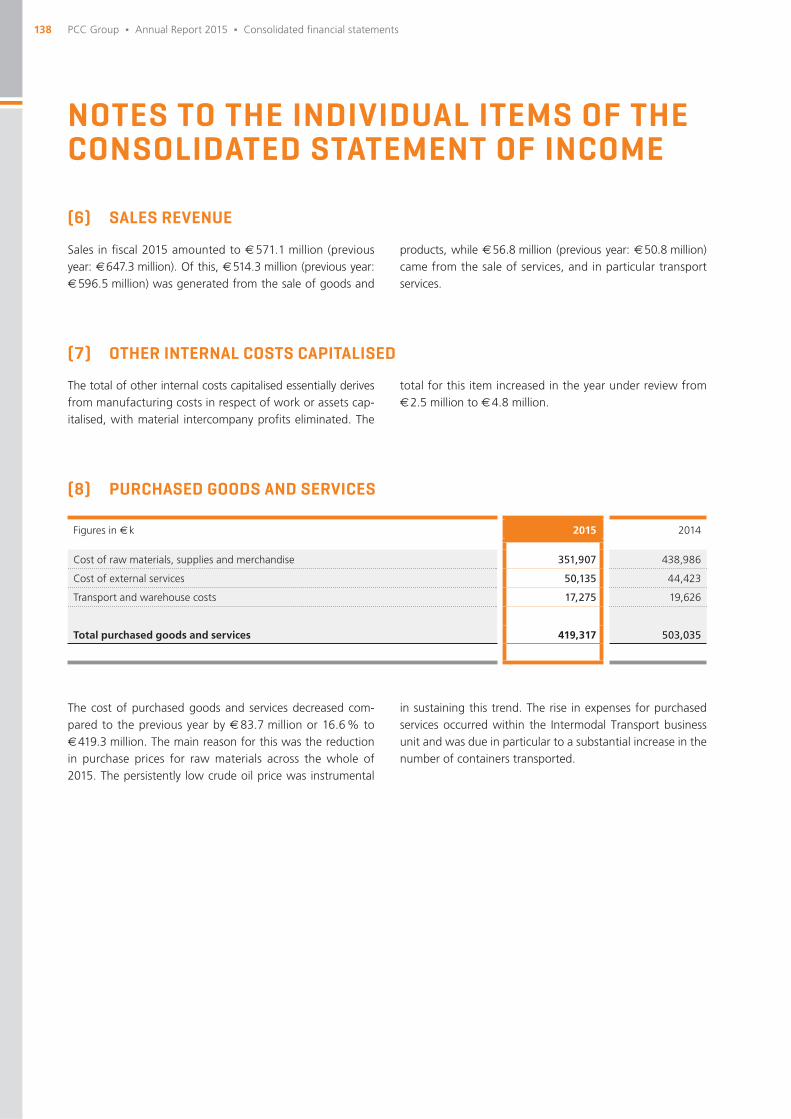
138 PCC Group Δ Annual Report 2015 Δ Consolidated fi nancial statements
Figures in € k 2015 2014
Cost of raw materials, supplies and merchandise 351,907 438,986
Cost of external services 50,135 44,423
Transport and warehouse costs 17,275 19,626
Total purchased goods and services 419,317 503,035
NOTES TO THE INDIVIDUAL ITEMS OF THE CONSOLIDATED STATEMENT OF INCOME
(6) SALES REVENUE
Sales in fi scal 2015 amounted to € 571.1 million (previous year: € 647.3 million). Of this, € 514.3 million (previous year: € 596.5 million) was generated from the sale of goods and
products, while € 56.8 million (previous year: € 50.8 million) came from the sale of services, and in particular transport services.
(7) OTHER INTERNAL COSTS CAPITALISED
The total of other internal costs capitalised essentially derives from manufacturing costs in respect of work or assets cap-italised, with material intercompany profi ts eliminated. The
total for this item increased in the year under review from € 2.5 million to € 4.8 million.
(8) PURCHASED GOODS AND SERVICES
The cost of purchased goods and services decreased com-pared to the previous year by € 83.7 million or 16.6 % to € 419.3 million. The main reason for this was the reduction in purchase prices for raw materials across the whole of 2015. The persistently low crude oil price was instrumental
in sustaining this trend. The rise in expenses for purchased services occurred within the Intermodal Transport business unit and was due in particular to a substantial increase in the number of containers transported.
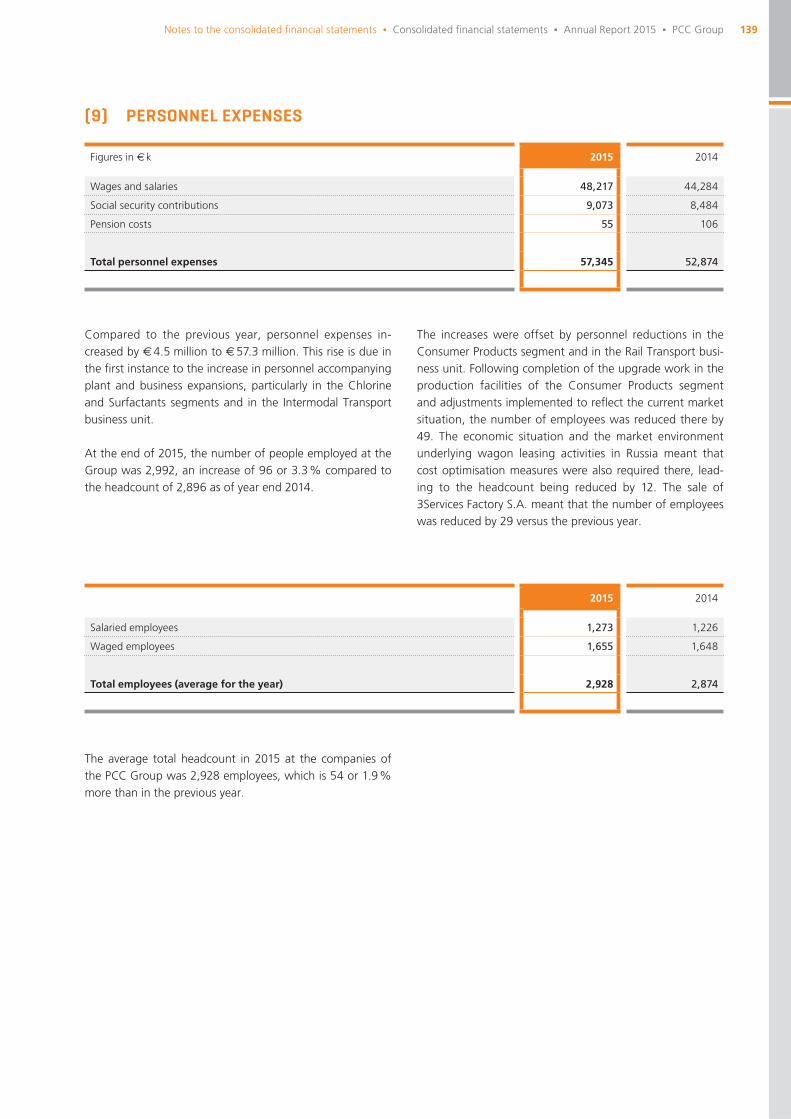
139Notes to the consolidated fi nancial statements Δ Consolidated fi nancial statements Δ Annual Report 2015 Δ PCC Group
(9) PERSONNEL EXPENSES
Compared to the previous year, personnel expenses in-creased by € 4.5 million to € 57.3 million. This rise is due in the fi rst instance to the increase in personnel accompanying plant and business expansions, particularly in the Chlorine and Surfactants segments and in the Intermodal Transport business unit.
At the end of 2015, the number of people employed at the Group was 2,992, an increase of 96 or 3.3 % compared to the headcount of 2,896 as of year end 2014.
Figures in € k 2015 2014
Wages and salaries 48,217 44,284
Social security contributions 9,073 8,484
Pension costs 55 106
Total personnel expenses 57,345 52,874
2015 2014
Salaried employees 1,273 1,226
Waged employees 1,655 1,648
Total employees (average for the year) 2,928 2,874
The increases were offset by personnel reductions in the Consumer Products segment and in the Rail Transport busi-ness unit. Following completion of the upgrade work in the production facilities of the Consumer Products segment and adjustments implemented to refl ect the current market situation, the number of employees was reduced there by 49. The economic situation and the market environment underlying wagon leasing activities in Russia meant that cost optimisation measures were also required there, lead-ing to the headcount being reduced by 12. The sale of 3Services Factory S.A. meant that the number of employees was reduced by 29 versus the previous year.
The average total headcount in 2015 at the companies of the PCC Group was 2,928 employees, which is 54 or 1.9 % more than in the previous year.
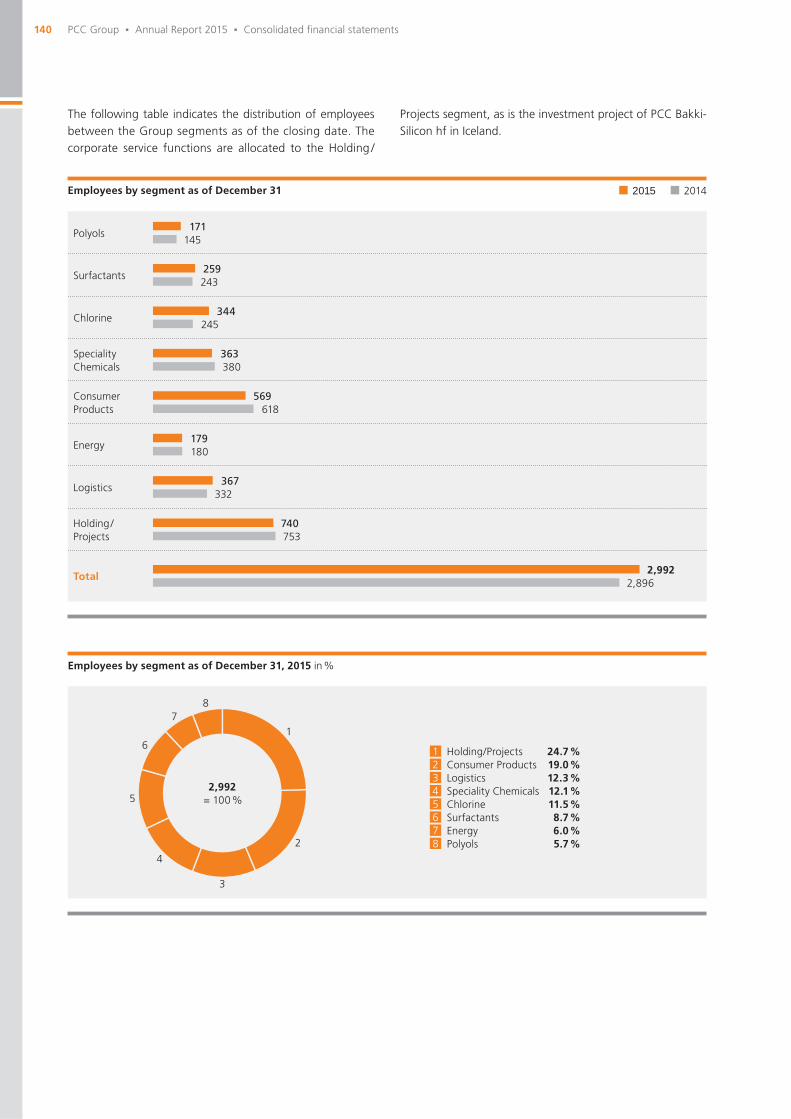
140 PCC Group Δ Annual Report 2015 Δ Consolidated fi nancial statements
The following table indicates the distribution of employees between the Group segments as of the closing date. The corporate service functions are allocated to the Holding /
Employees by segment as of December 31, 2015 in %
5
1
678
234
Holding/Projects 24.7 %Consumer Products 19.0 %Logistics 12.3 %Speciality Chemicals 12.1 %Chlorine 11.5 %Surfactants 8.7 %Energy 6.0 %Polyols 5.7 %
8
5
61
2
7
3
4
Employees by segment as of December 31
Polyols171
145
Surfactants259243
Chlorine344
245
Speciality Chemicals
363380
Consumer Products
569618
Energy179180
Logistics367
332
Total2,896
2,992
Holding / Projects
740753
20142015
Projects segment, as is the investment project of PCC Bakki-Silicon hf in Iceland.
2,992 = 100 %
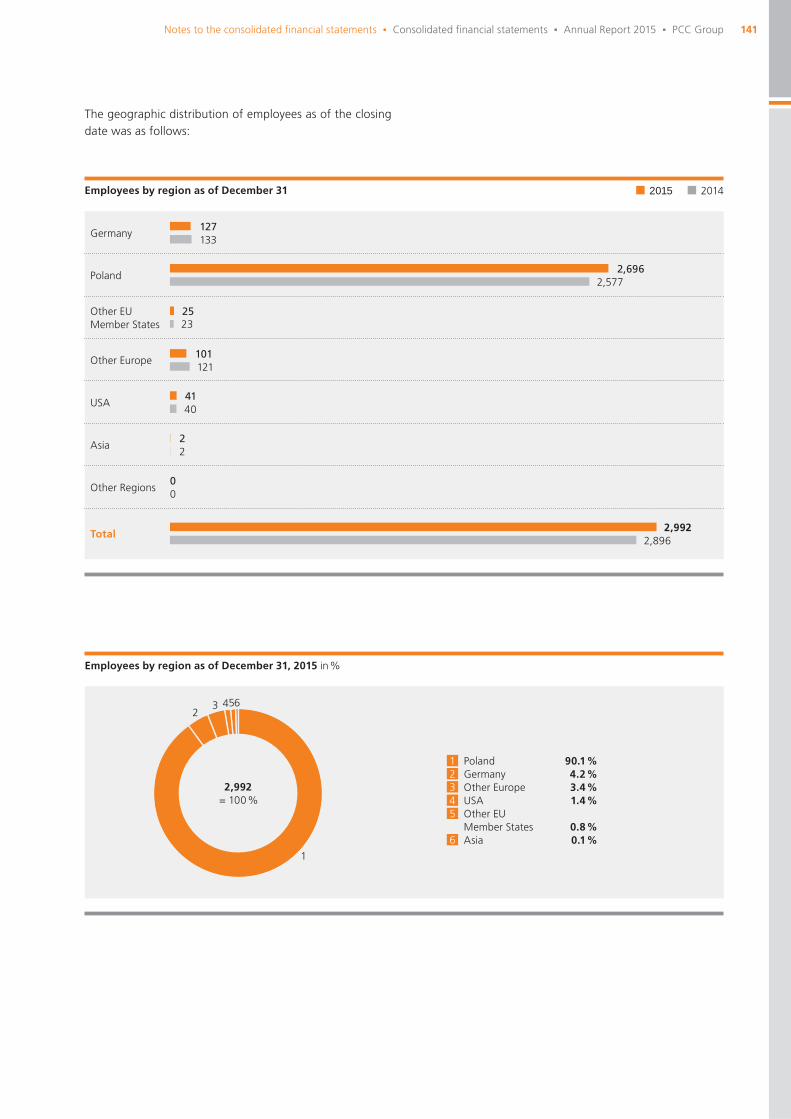
141Notes to the consolidated fi nancial statements Δ Consolidated fi nancial statements Δ Annual Report 2015 Δ PCC Group
Employees by region as of December 31
5
1
23 4
Employees by region as of December 31, 2015 in %
4
1
5
23
Poland 90.1 %Germany 4.2 %Other Europe 3.4 %USA 1.4 %Other EUMember States 0.8 %Asia 0.1 %
Asia
Other Regions
Total2,992
2,896
Germany127133
Other Europe101121
USA4140
22
00
Poland2,696
2,577
Other EU Member States 23
25
20142015
The geographic distribution of employees as of the closing date was as follows:
6
2,992 = 100 %
6
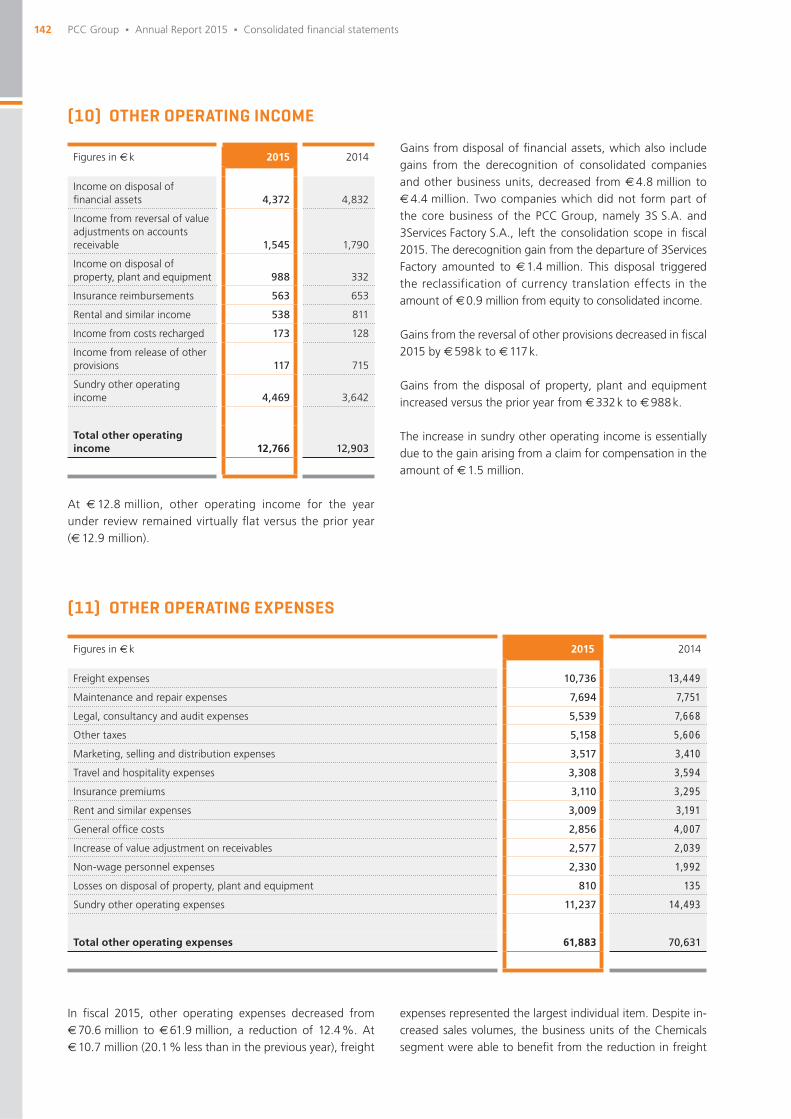
142 PCC Group Δ Annual Report 2015 Δ Consolidated fi nancial statements
In fi scal 2015, other operating expenses decreased from € 70.6 million to € 61.9 million, a reduction of 12.4 %. At € 10.7 million (20.1 % less than in the previous year), freight
(10) OTHER OPERATING INCOME
Figures in € k 2015 2014
Income on disposal of fi nancial assets 4,372 4,832
Income from reversal of value adjustments on accounts receivable 1,545 1,790
Income on disposal of property, plant and equipment 988 332
Insurance reimbursements 563 653
Rental and similar income 538 811
Income from costs recharged 173 128
Income from release of other provisions 117 715
Sundry other operating income 4,469 3,642
Total other operating income 12,766 12,903
Figures in € k 2015 2014
Freight expenses 10,736 13,449
Maintenance and repair expenses 7,694 7,751
Legal, consultancy and audit expenses 5,539 7,668
Other taxes 5,158 5,606
Marketing, selling and distribution expenses 3,517 3,410
Travel and hospitality expenses 3,308 3,594
Insurance premiums 3,110 3,295
Rent and similar expenses 3,009 3,191
General offi ce costs 2,856 4,007
Increase of value adjustment on receivables 2,577 2,039
Non-wage personnel expenses 2,330 1,992
Losses on disposal of property, plant and equipment 810 135
Sundry other operating expenses 11,237 14,493
Total other operating expenses 61,883 70,631
(11) OTHER OPERATING EXPENSES
At € 12.8 million, other operating income for the year under review remained virtually fl at versus the prior year (€ 12.9 million).
Gains from disposal of fi nancial assets, which also include gains from the derecognition of consolidated companies and other business units, decreased from € 4.8 million to € 4.4 million. Two companies which did not form part of the core business of the PCC Group, namely 3S S.A. and 3Services Factory S.A., left the consolidation scope in fi scal 2015. The derecognition gain from the departure of 3Services Factory amounted to € 1.4 million. This disposal triggered the reclassification of currency translation effects in the amount of € 0.9 million from equity to consolidated income.
Gains from the reversal of other provisions decreased in fi scal 2015 by € 598 k to € 117 k.
Gains from the disposal of property, plant and equipment increased versus the prior year from € 332 k to € 988 k.
The increase in sundry other operating income is essentially due to the gain arising from a claim for compensation in the amount of € 1.5 million.
expenses represented the largest individual item. Despite in-creased sales volumes, the business units of the Chemicals segment were able to benefi t from the reduction in freight
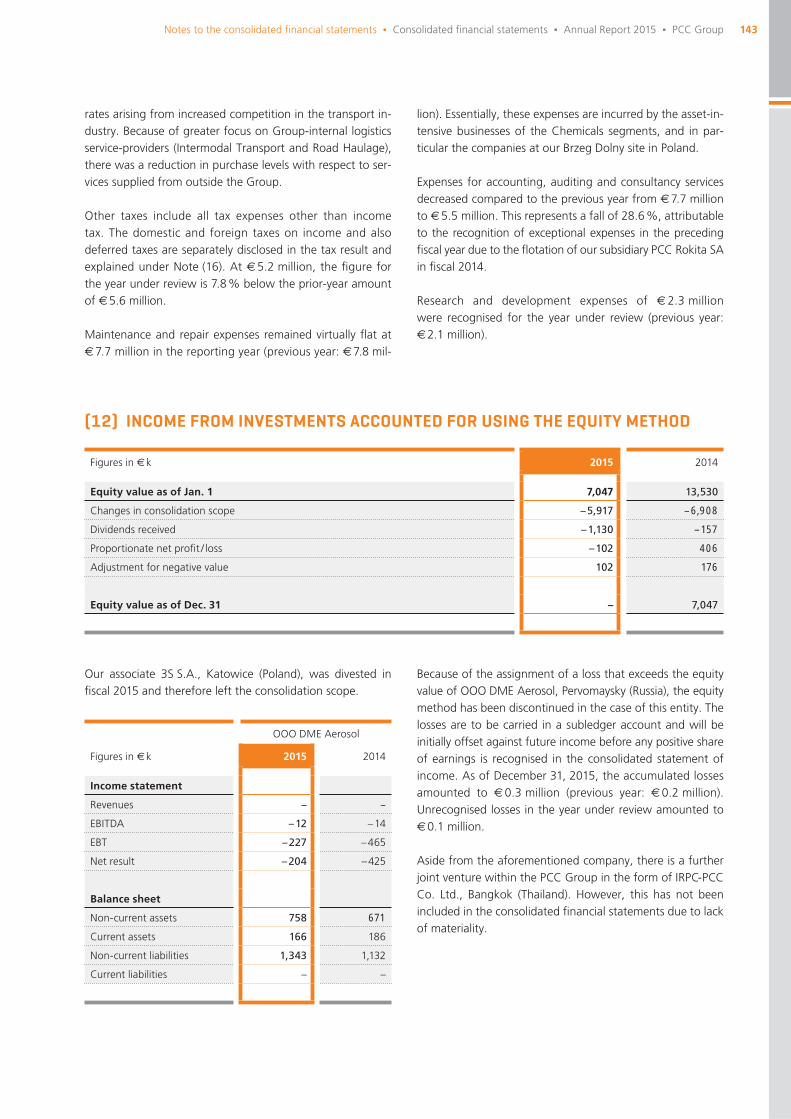
143Notes to the consolidated fi nancial statements Δ Consolidated fi nancial statements Δ Annual Report 2015 Δ PCC Group
lion). Essentially, these expenses are incurred by the asset-in-tensive businesses of the Chemicals segments, and in par-ticular the companies at our Brzeg Dolny site in Poland.
Expenses for accounting, auditing and consultancy services decreased compared to the previous year from € 7.7 million to € 5.5 million. This represents a fall of 28.6 %, attributable to the recognition of exceptional expenses in the preceding fi scal year due to the fl otation of our subsidiary PCC Rokita SA in fi scal 2014.
Research and development expenses of € 2.3 million were recognised for the year under review (previous year: € 2.1 million).
(12) INCOME FROM INVESTMENTS ACCOUNTED FOR USING THE EQUITY METHOD
Our associate 3S S.A., Katowice (Poland), was divested in fi scal 2015 and therefore left the consolidation scope.
Figures in € k 2015 2014
Equity value as of Jan. 1 7,047 13,530
Changes in consolidation scope – 5,917 – 6,908
Dividends received – 1,130 – 157
Proportionate net profi t / loss – 102 406
Adjustment for negative value 102 176
Equity value as of Dec. 31 – 7,047
OOO DME Aerosol
Figures in € k 2015 2014
Income statement
Revenues – –
EBITDA – 12 – 14
EBT – 227 – 465
Net result – 204 – 425
Balance sheet
Non-current assets 758 671
Current assets 166 186
Non-current liabilities 1,343 1,132
Current liabilities – –
rates arising from increased competition in the transport in-dustry. Because of greater focus on Group-internal logistics service-providers (Intermodal Transport and Road Haulage), there was a reduction in purchase levels with respect to ser-vices supplied from outside the Group.
Other taxes include all tax expenses other than income tax. The domestic and foreign taxes on income and also deferred taxes are separately disclosed in the tax result and explained under Note (16). At € 5.2 million, the fi gure for the year under review is 7.8 % below the prior-year amount of € 5.6 million.
Maintenance and repair expenses remained virtually fl at at € 7.7 million in the reporting year (previous year: € 7.8 mil-
Because of the assignment of a loss that exceeds the equity value of OOO DME Aerosol, Pervomaysky (Russia), the equity method has been discontinued in the case of this entity. The losses are to be carried in a subledger account and will be initially offset against future income before any positive share of earnings is recognised in the consolidated statement of income. As of December 31, 2015, the accumulated losses amounted to € 0.3 million (previous year: € 0.2 million). Unrecognised losses in the year under review amounted to € 0.1 million.
Aside from the aforementioned company, there is a further joint venture within the PCC Group in the form of IRPC-PCC Co. Ltd., Bangkok (Thailand). However, this has not been included in the consolidated fi nancial statements due to lack of materiality.
144 PCC Group Δ Annual Report 2015 Δ Consolidated fi nancial statements
(13) DEPRECIATION AND AMORTISATION
The depreciation of property, plant and equipment increased due to the continuation of the extensive capital expenditure programme of the PCC Group that has been put in train in recent years. In the reporting year, amortisation of intangible assets and depreciation of property, plant and equipment amounted to € 23.9 million, 9.0 % more than in the previ-ous year. A signifi cant portion of the increase is attributable to the now commissioned new container terminals in the Logistics segment, and also to the switch of the chlor-alkali
electrolysis process in the Chlorine segment to environmen-tally friendly membrane technology. The commissioning of a further small hydropower plant in Macedonia and the fi rst-time full-year effect of the hydroelectric power plants com-pleted in the previous year led to an increase of € 260.9 k.
Countervailing decreases arose as a result of the disposal of the data centre activities (€ – 384.9 k) and depreciation of the Russian ruble (€ – 267.0 k).
Figures in € k 2015 2014
Amortisation of intangible assets 1,070 985
Depreciation of property, plant and equipment 22,849 20,956
Total depreciation and amortisation 23,920 21,941
Amortisation of non-current intangible assets relates to in-dustrial property rights and similar rights. There were no im-pairments or write-ups of goodwill either in fi scal 2015 or in the previous year. For further information in relation to goodwill, please refer to Note (19).
In fi scal 2015, total impairment charges with respect to prop-erty, plant and equipment amounted to € 821.7 k, caused primarily by assets in the Chlorine segment being written off as a result of replacement by technologically more advanced plant and equipment.

145Notes to the consolidated fi nancial statements Δ Consolidated fi nancial statements Δ Annual Report 2015 Δ PCC Group
(14) INTEREST RESULT
The balance of interest income and interest expenses moved from € – 18.7 million in the previous year to € – 21.2 million
in the year under review, representing a change of – 13.4 %. The breakdown for 2015 reads as follows:
Figures in € k 2015 2014
Interest and similar income 746 1,123
Interest income from deposits 108 198
Interest income on bank balances 531 477
Interest income from discounting of non-current provisions – 24
Interest income from discounting of non-current receivables – –
Interest income on intercompany loans 107 424
Interest and similar expenses 21,984 19,838
Interest payable on bearer bonds 15,023 12,726
Interest payable on profi t participation certifi cates 962 962
Interest payable on loans 4,422 5,765
Interest expense from discounting of non-current provisions 325 9
Interest expense from discounting of non-current receivables 916 –
Interest expense component of fi nance lease payments 306 360
Derivatives – –
Interest expenses on intercompany loans received 30 17
Interest result – 21,238 – 18,716
The largest individual item was, as in the previous year, interest payable on bonds. Overall, the interest expense arising from bonds increased by € 2.3 million or 18.0 % to € 15.0 million. This was the result of an increase in bond li-abilities of € 100.1 million to € 363.1 million. Nevertheless, both the parent company of the PCC Group and also the Polish subsidiaries were able to obtain fi nance at improved interest rates. Several companies of the PCC Group issued bonds to fi nance investments and also for the refi nancing of liabilities falling due. Note (30) provides a detailed break-down of the bond liabilities and their tenors.
Interest attributable to investment projects that represent qualifying assets is capitalised during the construction phase in accordance with IAS 23. In the year under review, total interest expenses amounting to € 8.6 million (previous year: € 4.8 million) were recognised on the assets side. The capi-talisation rate was 7.0 % (previous year: 8.0 %).
The weighted interest rate across all interest-bearing liabili-ties in fi scal 2015 was 5.6 %, a decrease of 0.2 percentage points compared to the rate prevailing in the previous year.
146 PCC Group Δ Annual Report 2015 Δ Consolidated fi nancial statements
(15) CURRENCY TRANSLATION RESULT
Gains and losses from currency translation are recognised un-der fi nancial result. In particular, gains arising from currency
Figures in € k 2015 2014
Foreign exchange rate gains 16,024 7,903
Foreign exchange rate losses 19,671 13,989
Currency translation result – 3,647 – 6,086
translation increased considerably compared to the previous year, with the rise in the US dollar primarily responsible.
(16) TAXES ON INCOME / TAX EXPENSE
Taxes on income include the income taxes paid or owed in the individual countries, and also deferred taxes recognised through profi t or loss. Taxes on income are comprised of municipal trade and corporate income tax, the solidarity sur-charge payable in Germany and the corresponding foreign taxes on income.
Figures in € k 2015 2014
Current taxes on income, Germany 756 1,159
Current taxes on income, abroad 2,884 1,935
Current income tax expenses 3,640 3,094
Deferred tax income (–) / expense (+) – 427 – 1,521
Total taxes on income 3,214 1,574
Other taxes incl. VAT and other excise duties 5,158 5,606
Total tax expenses 8,371 7,179
Other taxes include property taxes, wealth taxes and other comparable tax classes and amounted to € 5.2 million (pre-vious year: € 5.6 million). These are allocated to other oper-ating expenses.
147Notes to the consolidated fi nancial statements Δ Consolidated fi nancial statements Δ Annual Report 2015 Δ PCC Group
The effective tax rate of the PCC Group has moved from – 21.5 % to 264.3 %. The differences between the income tax rate of 30 % applicable in Germany for 2015 and the
Individual Group companies have tax losses that can be carried forward. The following indicates the timeframes in which these tax loss carry-forwards can be used and from which deferred tax assets are formed. Compared to the pre-
Figures in € k 2015 2014
Usable within:
1 year 66 673
2 years 2,645 193
3 years 834 4,480
4 years 806 1,297
5 years and thereafter 9,024 8,732
Carried forward without restriction 407 –
Total usable tax losses carried forward 13,781 15,373
effective tax rate are indicated in the following reconcilia-tion statement:
vious year, the amount has decreased by € 1.6 million or 10.4 %. Tax loss carry-forwards from which no deferred tax assets have been formed amount to € 94.4 million (previous year: € 83.2 million).
Figures in € k 2015 2014
Earnings before taxes (EBT) 1,216 – 7,334
Anticipated income tax burden at parent company 365 – 2,200
Effects of changes on income tax rates – –
Foreign tax rate differentials 1,935 725
Results from investments accounted for using the equity method – – 582
Non-taxable income – 20,838 – 18,693
Non-deductible expenses 24,321 22,437
Deduction of losses for which deferred taxes have been provided – 2,962 – 3,008
Deduction of losses for which deferred taxes have not been provided – 310 – 1,645
Non-period-related taxes – – 74
Result in special economic zones – 14,657 – 13,409
Permanent differences 23,847 15,912
Other effects – 8,486 2,111
Effective income tax 3,214 1,574
148 PCC Group Δ Annual Report 2015 Δ Consolidated fi nancial statements
Div
isio
ns
Bu
sin
ess
un
its
Chemicals
Seg
men
ts
∂ Polyols
∂ Polyurethane Systems
Polyols
∂ Anionic Surfactants
∂ Non-ionic Surfactants
∂ Amphoteric Surfactants (Betaines)
Surfactants
∂ Chlorine
∂ MCAA
∂ Other Chlorine Downstream Products
Chlorine
∂ Phosphorus and Naphthalene Derivatives
∂ Alkylphenols
∂ Chemicals and Commodities Trading
∂ Quartzite
SpecialityChemicals
∂ Household and Industrial Cleaners, Detergents and Personal Care Products
∂ Matches and Firelighters
ConsumerProducts
∂ Renewable Energies
∂ Conventional Energies
Energy
Energy
∂ Intermodal Transport
∂ Road Haulage
∂ Rail Transport
Logistics
Logistics
∂ Portfolio Manage- ment
∂ Projects
∂ Services
Holding/Projects
Holding/Projects
The divisions, segments and business units of the PCC Group
(17) BUSINESS SEGMENT REPORT
SEGMENT REPORT
The PCC Group is currently active with around 3,000 em-ployees at 40 sites in 17 countries. The investment portfolio of PCC SE is divided into eight segments. The seven seg-ments Polyols, Surfactants, Chlorine, Speciality Chemicals, Consumer Products, Energy and Logistics are assigned full operational responsibility. Allocated to these segments are 19 business units that are managed by the international com-
panies and entities of PCC. The eighth segment, Holding/Projects, includes not only the holding company PCC SE but also other companies and entities and is primarily responsible for providing corporate services in the fi elds of fi nance, busi-ness development, information technology, environmental protection, site infrastructure management, research & de-velopment and engineering & technology.
The assignment of the Group’s businesses to the seven op-erational segments assists in the leverage of synergy effects and sharpens the profi le of the individual operations. The adoption of this structure underscores the PCC Group’s commitment to its strategy of active investment portfolio management and ongoing portfolio optimisation. The man-agement of the portfolio assets and affi liates together with examination of further acquisitions for the purpose of com-petence-related diversifi cation into new market segments re-mains at the heart of Group policy. The underlying objective over the long term is to build a basis for sustainable growth and to continuously increase enterprise value.
The Polyols segment is divided into the business units Polyols and Polyurethane Systems. These manufacture products that provide the basis for PU foam materials serving a wide range
of applications in numerous industries – from the PCC foam technology iPoltec® for high-comfort mattresses to PU foam systems for the effective thermal insulation of buildings.
Pooled under the Surfactants segment are the business units Anionic Surfactants, Non-ionic Surfactants and Amphoteric Surfactants (Betaines). Because of their multiple effects in foaming, wetting, emulsifying and cleaning, surfactants are a primary ingredient in many products. In toothpastes, they generate the cleaning effect and foaming action, while in dishwashing products they ensure that dirt and grease are effectively dislodged from hard surfaces.
Chlorine marks the starting point in the value chain of many other products in the Chemicals division. For many people, it is also essential for everyday living: in swimming baths, for
149Notes to the consolidated fi nancial statements Δ Consolidated fi nancial statements Δ Annual Report 2015 Δ PCC Group
example, it serves as a disinfectant protecting bathers from germs. Produced nowadays by an environmentally friendly process, chlorine and downstream chlorine products man-ufactured by PCC are also used in water treatment and the petrochemical industry.
The Speciality Chemicals segment is PCC’s biggest in terms of revenue. Its products extend from phosphorus-based fl ame retardants, plasticisers and stabilisers, to additives for hydraulic fl uids and superplasticisers that facilitate the laying of fresh concrete. The commodities trading operation of the PCC Group is also currently allocated to this segment.
The Consumer Products segment encompasses the business unit Household & Industrial Cleaners, Detergents and Per-sonal Care Products – with its own Polish brands such as “ROKO” and “Roko Eco” – together with the business unit Matches and Firelighters.
Aside from a power plant for the on-site power generation activities of the manufacturing facilities in Poland, the Energy segment also pursues the development, construction and op-eration of power plants based on renewable energies. So far, four environmentally friendly small hydropower plants have been commissioned in the Republic of Macedonia, with one also in service in Bosnia-Herzegovina. A polish cogenerator (CHP power plant) providing heat, electricity and steam as a regional utility is also managed under this segment.
The Logistics segment comprises the three business units Inter-modal Transport, Road Haulage and Rail Transport. PCC is one of the leading providers of container transport services in Poland. The logistics network extends from Eastern Europe to the Bene-lux countries, and the Group entities also operate several wholly owned terminals. Operating throughout Europe, the tanker fl eet of PCC specialises in the road transport of liquid chemicals.
The Holding/Projects segment provides corporate and inter-divisional services to the Group companies in fi elds such as fi nance, information technology, research, and maintenance & servicing. The Holding/Projects segment also manages pro-jects in the development phase such as the advanced silicon metal production plant under construction in Iceland or the planned production plant for dimethyl ether in Russia.
The valuation principles for the Group’s segment report are based on the valuation principles used in preparation of the con-solidated fi nancial statements per IFRS. Group-internal trans-actions are essentially performed in accordance with the same arm-length principles as those involving third parties. Accord-ing to IFRS 8, operating segments are defi ned on the basis of the internal reporting regime as components of an entity whose operating results are reviewed regularly by the entity’s chief op-erating offi cer. This review process entails making decisions about resources to be allocated to the segment and assessing its performance on the basis of discrete fi nancial information. In-
formation reported to the main decision makers for the purpose of the allocation of resources to the operating segments of the Group, and also assessment of their fi nancial performance, re-lates to the types of products manufactured or services provided.
At € 571.1 million, sales for fi scal 2015 were 11.8 % below the fi gure of € 647.3 million realised in the previous year. The principle reasons for this lay in the global decline in prices for almost all the world’s commodities. Despite robust to growing volume sales, all the Chemicals segments saw revenues de-cline due to the general price collapse. The traditional trading operations of the PCC Group, managed under the Speciality Chemicals segment, experienced the biggest decline in rev-enues. Sales in the Logistics and Energy divisions increased due to the commissioning of further container terminals and hydroelectric power plants. Sales of the Polyols segment de-creased by 7.4 % to € 136.2 million. The Surfactants segment was able to slightly increase its revenue by € 2.3 million to € 101.1 million. A decrease in sales of € 9.5 million or 13.9 % was registered by the Chlorine segment. In the Speciality Chemicals segment, sales fell year on year by € 60.3 million to € 161.7 million. Aside from price effects, the Consumer Products segment was also impacted by tougher competition compared to the previous year, with the two factors result-ing in a decline in sales of € 3.9 million to € 38.6 million. The Energy segment was able to increase its sales by 3.7 % from € 10.9 million to € 11.3 million. The Logistics segment also posted a rise in revenues from € 50.8 million in 2014 to € 56.8 million this time, representing an increase of 11.6 %.
In terms of the total output of the Group in fi scal 2015, the Chemicals division accounted for sales in the amount of € 496.0 million generated by its fi ve segments Polyols, Sur-factants, Chlorine, Speciality Chemicals and Consumer Prod-ucts. This fi gure still represents a high, although slightly re-duced, proportion of consolidated sales amounting to 86.9 % (previous year: 89.3 %). Sales of the Logistics segment now correspond to a slightly greater share of 9.9 % of total rev-enue (previous year: 7.9 %). The share accounted for by the Energy segment in the reporting year amounted to 2.0 % of total sales (previous year: 1.7 %). The segment of the holding company with revenues amounting to € 7.0 million (previous year: € 7.4 million) saw its share of total output generated re-main virtually unchanged at 1.2 %.
Figures in € k 2015 2014
EBITDA 50,787 39,591
Amortisation and depreciation 23,920 21,941
Financial result – 25,651 – 24,983
Earnings before taxes (EBT) 1,216 – 7,334
Reconciliation to earnings before taxes (EBT)
150 PCC Group Δ Annual Report 2015 Δ Consolidated fi nancial statements
Polyols Surfactants ChlorineSpeciality Chemicals
Figures in € k 2015 2014 2015 2014 2015 2014 2015 2014
Sales per segment (total) 148,056 158,619 123,694 124,212 112,970 129,029 183,128 243,273
Sales with other PCC segments 11,826 11,573 22,591 25,421 54,620 61,227 21,391 21,219
Sales revenue (external, consolidated) 136,229 147,046 101,102 98,792 58,350 67,802 161,737 222,055
Contribution to total revenue 23.9 % 22.7 % 17.7 % 15.3 % 10.2 % 10.5 % 28.3 % 34.3 %
EBITDA 13,806 12,567 9,549 6,551 8,159 8,094 5,198 3,921
EBITDA margin 10.1 % 8.5 % 9.4 % 6.6 % 14.0 % 11.9 % 3.2 % 1.8 %
EBIT 12,460 11,345 7,294 4,375 3,018 3,669 1,584 – 136
EBIT margin 9.1 % 7.7 % 7.2 % 4.4 % 5.2 % 5.4 % 1.0 % – 0.1 %
Intangible assets 291 208 1,808 1,698 9,802 9,075 1,888 2,145
Property, plant and equipment 28,472 26,067 42,496 41,854 161,685 127,939 27,259 30,335
Financial liabilities 7,968 6,707 43,768 48,542 84,211 52,452 20,030 30,163
Capital expenditures on intangible assets and property, plant and equipment 4,063 2,391 2,379 2,821 38,267 50,741 1,360 2,751
Depreciation and amortisation 1,343 1,223 2,256 2,176 5,046 4,425 3,595 4,056
Capital employed (average) 25,824 27,692 67,072 67,909 182,919 125,944 53,029 60,615
ROCE 48.3 % 41.0 % 10.9 % 6.4 % 1.6 % 2.9 % 3.0 % – 0.2 %
Income from investments accounted for using the equity method – – – – – – – –
Employees at Dec. 31 171 145 259 243 344 245 363 380
Employees (annual average) 165 142 255 239 306 241 371 376
Sales by segment 2015 in % EBITDA by segment 2015 in %
8
5
6
11
2
7
3
4
5
1
678
234
Speciality Chemicals 28.3 %Polyols 23.9 %Surfactants 17.7 %Chlorine 10.2 %Logistics 9.9 %Consumer Products 6.8 %Energy 2.0 %Holding/Projects 1.2 %
5
1
678
234
Polyols 27.2 %Surfactants 18.8 %Chlorine 16.1 %Speciality Chemicals 10.2 %Consumer Products – 0.1 %Energy 14.4 %Logistics 9.6 %Holding/Projects 3.8 %
Business segment report
8
5
6
7
3
4
2
€ 571.1 million = 100 %
151Notes to the consolidated fi nancial statements Δ Consolidated fi nancial statements Δ Annual Report 2015 Δ PCC Group
160,1 Mio. € = 100 %
Consumer Products
Energy LogisticsHolding /Projects
Consolidation PCC Group
2015 2014 2015 2014 2015 2014 2015 2014 2015 2014 2015 2014
38,676 43,173 28,363 25,976 66,755 59,859 40,666 36,340 – – 742,309 820,483
102 661 17,094 15,108 9,994 9,012 33,626 28,949 – – 171,246 173,168
38,574 42,513 11,270 10,868 56,761 50,848 7,040 7,391 – – 571,063 647,315
6.8 % 6.6 % 2.0 % 1.7 % 9.9 % 7.9 % 1.2 % 1.1 % – – 100.0 % 100.0 %
– 70 1,139 7,326 5,220 4,868 3,926 2,680 18,966 – 731 – 20,793 50,787 39,591
– 0.2 % 2.7 % 65.0 % 48.0 % 8.6 % 7.7 % 38.1 % 256.6 % – – 8.9 % 6.1 %
– 877 284 4,298 2,769 1,714 1,197 – 1,779 14,917 – 845 – 20,769 26,867 17,650
– 2.3 % 0.7 % 38.1 % 25.5 % 3.0 % 2.4 % – 25.3 % 201.8 % – – 4.7 % 2.7 %
34 36 2,837 3,396 182 163 1,472 4,998 6,943 3,689 25,258 25,406
15,112 13,505 56,422 55,855 76,442 50,956 144,464 74,521 – 9,695 – 6,673 542,657 414,360
13,947 14,121 35,829 35,485 50,593 32,913 374,510 280,159 – 111,968 –108,450 518,889 392,092
3,091 4,576 3,404 2,027 31,231 19,298 75,366 20,416 949 – 1,893 160,111 103,127
807 856 2,998 2,450 3,142 2,730 4,401 4,049 333 – 24 23,920 21,941
14,231 15,991 75,740 74,994 66,153 49,983 883,876 715,325 – 777 – 612,373 1,368,067 526,080
– 6.2 % 1.8 % 5.7 % 3.7 % 2.6 % 2.4 % – 0.2 % 2.1 % 108.7 % 3.4 % 2.0 % 3.4 %
– – – – – – – 102 406 102 176 – 582
569 618 179 180 367 332 740 753 – – 2,992 2,896
576 636 179 183 352 326 724 731 – – 2,928 2,874
Property, plant and equipment by segment 2015 in % Capital expenditures by segment 2015 in %
85 6
1
2
7
3
4
5
1
678
234
€ 542.7 million = 100 %
8
5
6
1
2
7
3
4
5
1
678
234
Chlorine 29.8 %Holding/Projects 24.8 %Logistics 14.1 %Energy 10.4 %Surfactants 7.8 %Polyols 5.2 %Speciality Chemicals 5.0 %Consumer Products 2.8 %
Holding/Projects 47.7 %Chlorine 23.9 %Logistics 19.5 %Polyols 2.5 %Energy 2.1 %Consumer Products 1.9 %Surfactants 1.5 %Speciality Chemicals 0.8 %
€ 160.1 million = 100 %
152 PCC Group Δ Annual Report 2015 Δ Consolidated fi nancial statements
(18) REGIONAL SEGMENT REPORT
For the purpose of regular internal and external reporting, the business of the PCC Group is divided into seven regions (Germany, Poland, Other EU Member States, Other Europe, USA, Asia and Other Regions). In fi scal 2015, the Group generated 21.4 % of its sales with customers in Germany (previous year: 25.9 %), with 39.5 % accounted for by customers in Poland (previous year: 35.2 %).
The PCC Group generates a total of 82.1 % of its sales with customers in the member states of the European Union (previous year: 81.5 %), with Poland and Germany taking the lion’s share.
Based on company location, Poland accounted for net external sales of € 432.1 million, corresponding to 75.7 % of the Group total (previous year: 68.7 %). Based on customer location, the fi gure for Poland was € 225.3 million or around
39.5 % (previous year: 35.2 %). Due to the signifi cant de-crease in sales from our trading business, Germany registered a decline from € 167.7 million to € 122.0 million based on customer location. Based on company location, sales likewise decreased, from € 148.7 million to € 90.7 million.
Capital expenditures in Poland amounted to € 87.8 million (previous year: € 97.1 million), with major investment pro-jects being undertaken in the Chlorine and Logistics seg-ments, primarily in the form of the switch of the chlor-alkali electrolysis process to membrane technology, construction of an MCAA plant and expansion of the container terminal network. The Holding/Projects segment registered capital expenditures as a result of its investment in the new silicon metal smelting plant in Iceland, with the fi gure rising from € 20.4 million last time to € 75.4 million in the year under review.
Germany PolandOther EU
Member States
Figures in € k 2015 2014 2015 2014 2015 2014
Customer location
Sales revenue (external, consolidated) 121,998 167,660 225,311 227,779 121,285 131,892
Contribution to total revenue 21.4 % 25.9 % 39.5 % 35.2 % 21.2 % 20.4 %
Company location
Sales revenue (external, consolidated) 90,708 148,738 432,077 444,744 23,842 30,341
Contribution to total revenue 15.9 % 23.0 % 75.7 % 68.7 % 4.2 % 4.7 %
EBITDA – 1,486 17,147 52,026 41,676 – 747 45
EBITDA margin – 1.6 % 11.5 % 12.0 % 9.4 % – 3.1 % 0.1 %
EBIT – 2,572 16,105 31,506 22,921 –910 21
EBIT margin – 2.8 % 10.8 % 7.3 % 5.2 % – 3.8 % 0.1 %
Intangible assets 968 1,072 13,972 17,236 130 124
Property, plant and equipment 9,894 9,011 432,336 369,689 3,518 4,146
Investment property 2,572 2,507 1,098 – – –
Financial liabilities 298,725 261,528 232,826 186,293 6,747 8,840
Capital expenditures on intangible assets and property, plant and equipment 2,141 2,143 87,819 97,138 35 78
Depreciation and amortisation 1,086 1,041 20,301 18,754 163 24
Income from investments accounted for using the equity method – – – 582 – –
Employees at Dec. 31 127 133 2,696 2,577 25 23
Employees (annual average) 126 127 2,626 2,560 25 23
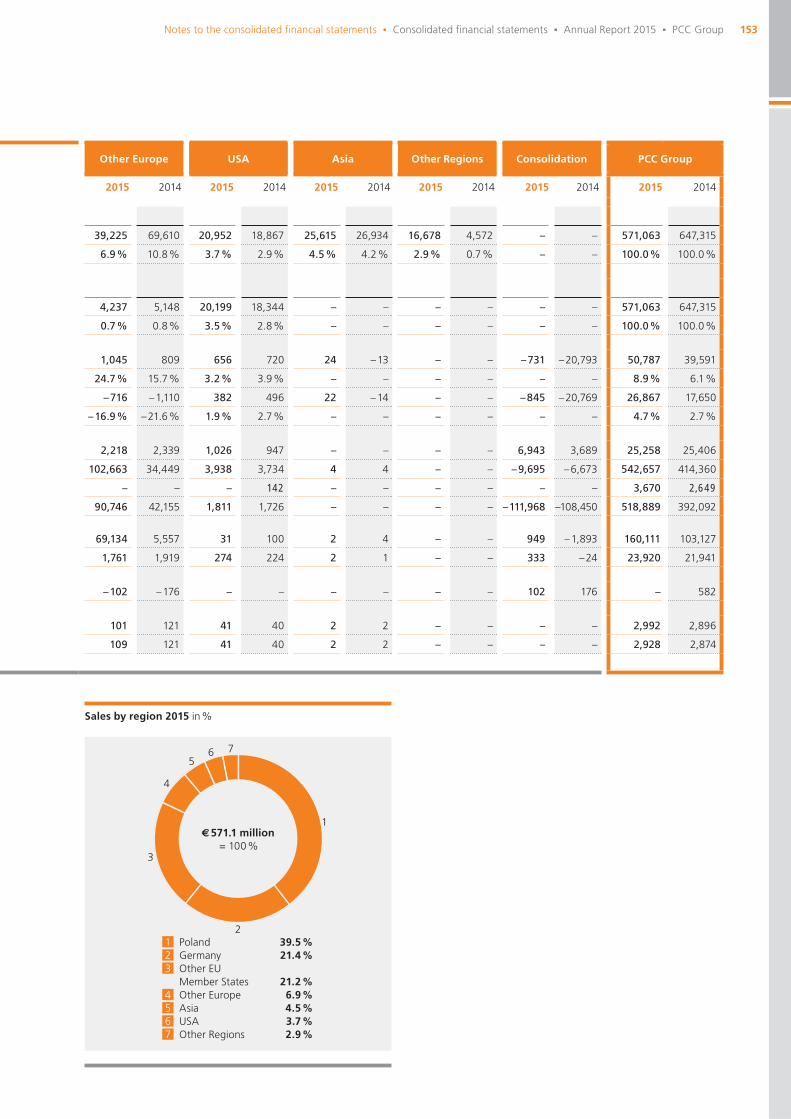
153Notes to the consolidated fi nancial statements Δ Consolidated fi nancial statements Δ Annual Report 2015 Δ PCC Group
Other Europe USA Asia Other Regions Consolidation PCC Group
2015 2014 2015 2014 2015 2014 2015 2014 2015 2014 2015 2014
39,225 69,610 20,952 18,867 25,615 26,934 16,678 4,572 – – 571,063 647,315
6.9 % 10.8 % 3.7 % 2.9 % 4.5 % 4.2 % 2.9 % 0.7 % – – 100.0 % 100.0 %
4,237 5,148 20,199 18,344 – – – – – – 571,063 647,315
0.7 % 0.8 % 3.5 % 2.8 % – – – – – – 100.0 % 100.0 %
1,045 809 656 720 24 – 13 – – – 731 – 20,793 50,787 39,591
24.7 % 15.7 % 3.2 % 3.9 % – – – – – – 8.9 % 6.1 %
– 716 – 1,110 382 496 22 – 14 – – – 845 – 20,769 26,867 17,650
– 16.9 % – 21.6 % 1.9 % 2.7 % – – – – – – 4.7 % 2.7 %
2,218 2,339 1,026 947 – – – – 6,943 3,689 25,258 25,406
102,663 34,449 3,938 3,734 4 4 – – – 9,695 – 6,673 542,657 414,360
– – – 142 – – – – – – 3,670 2,649
90,746 42,155 1,811 1,726 – – – – – 111,968 –108,450 518,889 392,092
69,134 5,557 31 100 2 4 – – 949 – 1,893 160,111 103,127
1,761 1,919 274 224 2 1 – – 333 – 24 23,920 21,941
– 102 – 176 – – – – – – 102 176 – 582
101 121 41 40 2 2 – – – – 2,992 2,896
109 121 41 40 2 2 – – – – 2,928 2,874
Sales by region 2015 in %
4
1
5
23
Poland 39.5 %Germany 21.4 %Other EU Member States 21.2 %Other Europe 6.9 %Asia 4.5 %USA 3.7 %Other Regions 2.9 %
67
5
1
2
3
4
6 7
571,1 Mio. € = 100 %
€ 571.1 million = 100 %
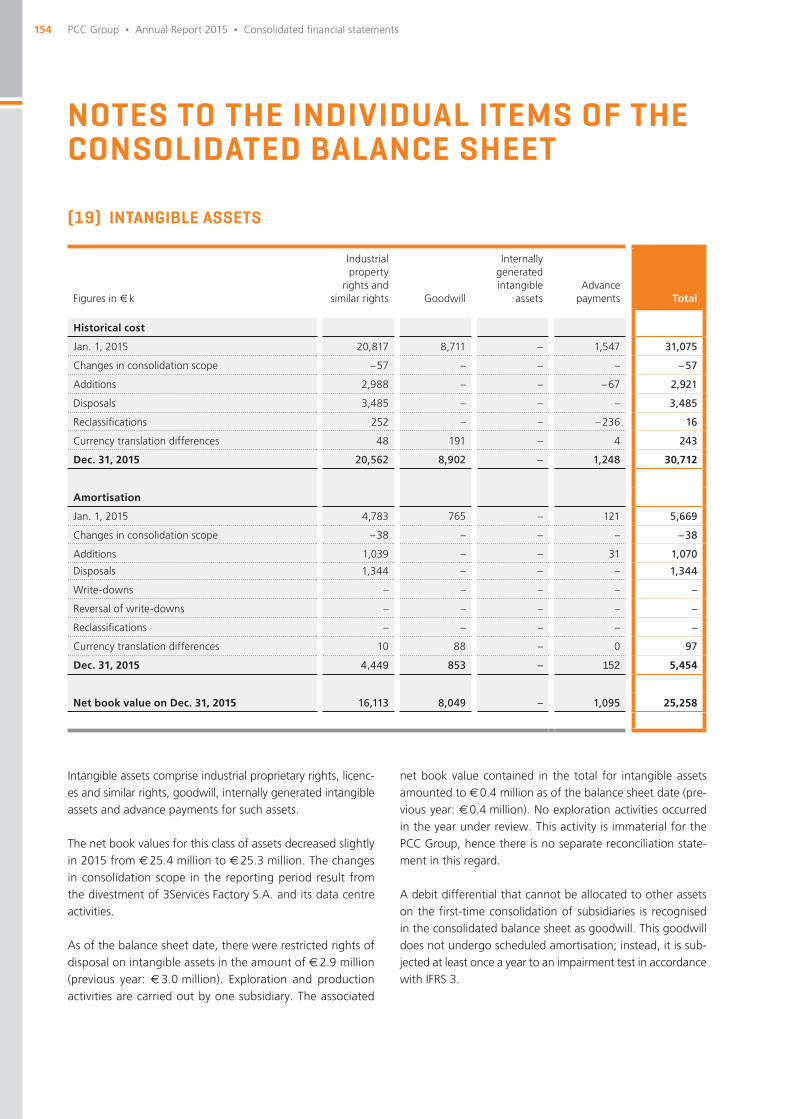
154 PCC Group Δ Annual Report 2015 Δ Consolidated fi nancial statements
(19) INTANGIBLE ASSETS
NOTES TO THE INDIVIDUAL ITEMS OF THE CONSOLIDATED BALANCE SHEET
Intangible assets comprise industrial proprietary rights, licenc-es and similar rights, goodwill, internally generated intangible assets and advance payments for such assets.
The net book values for this class of assets decreased slightly in 2015 from € 25.4 million to € 25.3 million. The changes in consolidation scope in the reporting period result from the divestment of 3Services Factory S.A. and its data centre activities.
As of the balance sheet date, there were restricted rights of disposal on intangible assets in the amount of € 2.9 million (previous year: € 3.0 million). Exploration and production activities are carried out by one subsidiary. The associated
net book value contained in the total for intangible assets amounted to € 0.4 million as of the balance sheet date (pre-vious year: € 0.4 million). No exploration activities occurred in the year under review. This activity is immaterial for the PCC Group, hence there is no separate reconciliation state-ment in this regard.
A debit differential that cannot be allocated to other assets on the fi rst-time consolidation of subsidiaries is recognised in the consolidated balance sheet as goodwill. This goodwill does not undergo scheduled amortisation; instead, it is sub-jected at least once a year to an impairment test in accordance with IFRS 3.
Figures in € k
Industrialproperty
rights and similar rights Goodwill
Internally generated intangible
assetsAdvance
payments Total
Historical cost
Jan. 1, 2015 20,817 8,711 – 1,547 31,075
Changes in consolidation scope – 57 – – – – 57
Additions 2,988 – – – 67 2,921
Disposals 3,485 – – – 3,485
Reclassifi cations 252 – – – 236 16
Currency translation differences 48 191 – 4 243
Dec. 31, 2015 20,562 8,902 – 1,248 30,712
Amortisation
Jan. 1, 2015 4,783 765 – 121 5,669
Changes in consolidation scope – 38 – – – – 38
Additions 1,039 – – 31 1,070
Disposals 1,344 – – – 1,344
Write-downs – – – – –
Reversal of write-downs – – – – –
Reclassifi cations – – – – –
Currency translation differences 10 88 – 0 97
Dec. 31, 2015 4,449 853 – 152 5,454
Net book value on Dec. 31, 2015 16,113 8,049 – 1,095 25,258
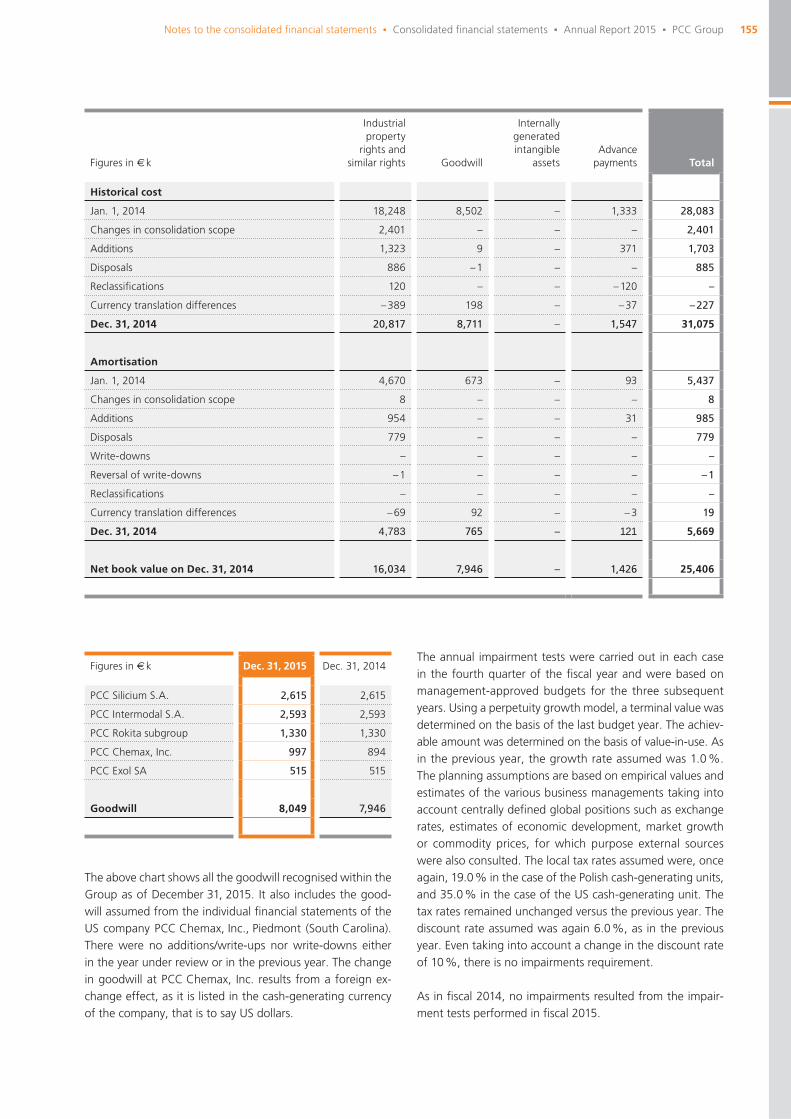
155Notes to the consolidated fi nancial statements Δ Consolidated fi nancial statements Δ Annual Report 2015 Δ PCC Group
Figures in € k
Industrialproperty
rights and similar rights Goodwill
Internally generated intangible
assetsAdvance
payments Total
Historical cost
Jan. 1, 2014 18,248 8,502 – 1,333 28,083
Changes in consolidation scope 2,401 – – – 2,401
Additions 1,323 9 – 371 1,703
Disposals 886 – 1 – – 885
Reclassifi cations 120 – – – 120 –
Currency translation differences – 389 198 – – 37 – 227
Dec. 31, 2014 20,817 8,711 – 1,547 31,075
Amortisation
Jan. 1, 2014 4,670 673 – 93 5,437
Changes in consolidation scope 8 – – – 8
Additions 954 – – 31 985
Disposals 779 – – – 779
Write-downs – – – – –
Reversal of write-downs – 1 – – – – 1
Reclassifi cations – – – – –
Currency translation differences – 69 92 – – 3 19
Dec. 31, 2014 4,783 765 – 121 5,669
Net book value on Dec. 31, 2014 16,034 7,946 – 1,426 25,406
The above chart shows all the goodwill recognised within the Group as of December 31, 2015. It also includes the good-will assumed from the individual fi nancial statements of the US company PCC Chemax, Inc., Piedmont (South Carolina). There were no additions/write-ups nor write-downs either in the year under review or in the previous year. The change in goodwill at PCC Chemax, Inc. results from a foreign ex-change effect, as it is listed in the cash-generating currency of the company, that is to say US dollars.
Figures in € k Dec. 31, 2015 Dec. 31, 2014
PCC Silicium S.A. 2,615 2,615
PCC Intermodal S.A. 2,593 2,593
PCC Rokita subgroup 1,330 1,330
PCC Chemax, Inc. 997 894
PCC Exol SA 515 515
Goodwill 8,049 7,946
The annual impairment tests were carried out in each case in the fourth quarter of the fi scal year and were based on management-approved budgets for the three subsequent years. Using a perpetuity growth model, a terminal value was determined on the basis of the last budget year. The achiev-able amount was determined on the basis of value-in-use. As in the previous year, the growth rate assumed was 1.0 %. The planning assumptions are based on empirical values and estimates of the various business managements taking into account centrally defi ned global positions such as exchange rates, estimates of economic development, market growth or commodity prices, for which purpose external sources were also consulted. The local tax rates assumed were, once again, 19.0 % in the case of the Polish cash-generating units, and 35.0 % in the case of the US cash-generating unit. The tax rates remained unchanged versus the previous year. The discount rate assumed was again 6.0 %, as in the previous year. Even taking into account a change in the discount rate of 10 %, there is no impairments requirement.
As in fi scal 2014, no impairments resulted from the impair-ment tests performed in fi scal 2015.

156 PCC Group Δ Annual Report 2015 Δ Consolidated fi nancial statements
(20) PROPERTY, PLANT AND EQUIPMENT
The value of our property, plant and equipment increased year on year from € 414.4 million to € 542.7 million. This is attributable to the major investment programmes imple-mented by the PCC Group. The construction of our silicon metal smelting plant in Iceland, the switch of the chlor-alkali electrolysis process to modern membrane technology, the establishment of a production capability for the manufacture of ultra-pure monochloroacetic acid (MCAA) and expansion of our container terminal network are among the major pro-jects worth mentioning in this regard.
Additions to property, plant and equipment in fi scal 2015 amounted to € 158.9 million (previous year: € 101.0 million).
These investments were largely implemented in the Chlorine and Logistics segments which accounted for € 38.3 million (previous year: € 50.8 million) and € 31.2 million (previous year: € 19.3 million) respectively. Through PCC BakkiSilicon hf,the Holding/Projects segment accounted for a share of the additions in the amount of € 76.3 million (previous year: € 18.5 million).
Depreciation of property, plant and equipment in the year under review amounted to € 21.7 million (previous year: € 20.9 million). The increase versus the 2014 fi gure is pri-marily due to the completion of current investment projects.
Figures in € kLand and buildings
Plant and machinery
Factory and offi ce
equipment
Advance payments and
construction in progress Total
Historical cost
Jan. 1, 2015 103,700 236,365 117,478 132,339 589,882
Changes in consolidation scope – 2,533 – 3,045 – 119 – 65 – 5,762
Additions – 79 2,795 566 155,617 158,899
Disposals 343 9,320 516 771 10,950
Reclassifi cations 31,132 54,350 14,245 – 101,745 – 2,018
Currency translation differences – 88 – 813 141 1,476 716
Dec. 31, 2015 131,788 280,333 131,795 186,851 730,766
Amortisation
Jan. 1, 2015 21,075 109,997 43,855 595 175,521
Changes in consolidation scope – 229 – 551 – 54 – – 835
Additions 2,781 13,604 5,338 – 21,724
Disposals 222 7,021 439 79 7,761
Write-downs 22 383 273 144 822
Reversal of write-downs – 31 – – – – 31
Reclassifi cations – 433 122 – 389 – – 701
Currency translation differences – 50 – 538 – 41 1 – 631
Dec. 31, 2015 22,912 115,993 48,543 661 188,109
Net book value on Dec. 31, 2015 108,876 164,340 83,252 186,190 542,657
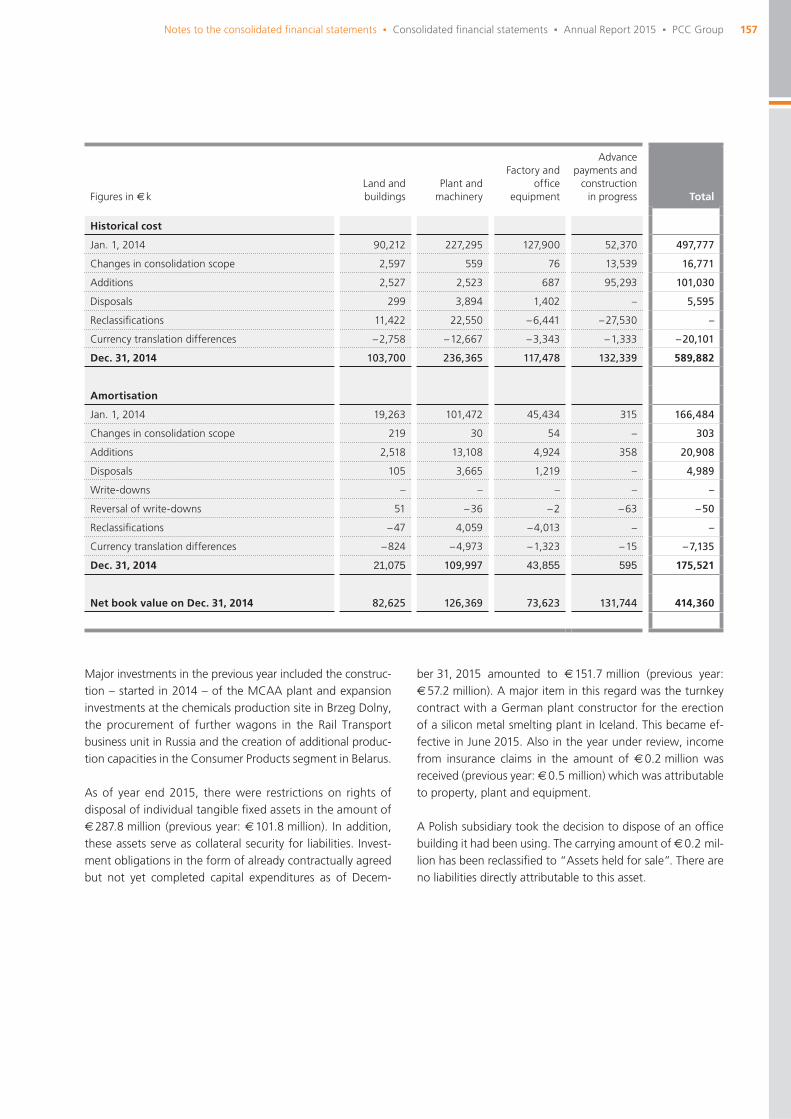
157Notes to the consolidated fi nancial statements Δ Consolidated fi nancial statements Δ Annual Report 2015 Δ PCC Group
Major investments in the previous year included the construc-tion – started in 2014 – of the MCAA plant and expansion investments at the chemicals production site in Brzeg Dolny, the procurement of further wagons in the Rail Transport business unit in Russia and the creation of additional produc-tion capacities in the Consumer Products segment in Belarus.
As of year end 2015, there were restrictions on rights of disposal of individual tangible fi xed assets in the amount of € 287.8 million (previous year: € 101.8 million). In addition, these assets serve as collateral security for liabilities. Invest-ment obligations in the form of already contractually agreed but not yet completed capital expenditures as of Decem-
Figures in € kLand and buildings
Plant and machinery
Factory and offi ce
equipment
Advance payments and
construction in progress Total
Historical cost
Jan. 1, 2014 90,212 227,295 127,900 52,370 497,777
Changes in consolidation scope 2,597 559 76 13,539 16,771
Additions 2,527 2,523 687 95,293 101,030
Disposals 299 3,894 1,402 – 5,595
Reclassifi cations 11,422 22,550 – 6,441 – 27,530 –
Currency translation differences – 2,758 – 12,667 – 3,343 – 1,333 – 20,101
Dec. 31, 2014 103,700 236,365 117,478 132,339 589,882
Amortisation
Jan. 1, 2014 19,263 101,472 45,434 315 166,484
Changes in consolidation scope 219 30 54 – 303
Additions 2,518 13,108 4,924 358 20,908
Disposals 105 3,665 1,219 – 4,989
Write-downs – – – – –
Reversal of write-downs 51 – 36 – 2 – 63 – 50
Reclassifi cations – 47 4,059 – 4,013 – –
Currency translation differences – 824 – 4,973 – 1,323 – 15 – 7,135
Dec. 31, 2014 21,075 109,997 43,855 595 175,521
Net book value on Dec. 31, 2014 82,625 126,369 73,623 131,744 414,360
ber 31, 2015 amounted to € 151.7 million (previous year: € 57.2 million). A major item in this regard was the turnkey contract with a German plant constructor for the erection of a silicon metal smelting plant in Iceland. This became ef-fective in June 2015. Also in the year under review, income from insurance claims in the amount of € 0.2 million was received (previous year: € 0.5 million) which was attributable to property, plant and equipment.
A Polish subsidiary took the decision to dispose of an offi ce building it had been using. The carrying amount of € 0.2 mil-lion has been reclassifi ed to “Assets held for sale”. There are no liabilities directly attributable to this asset.
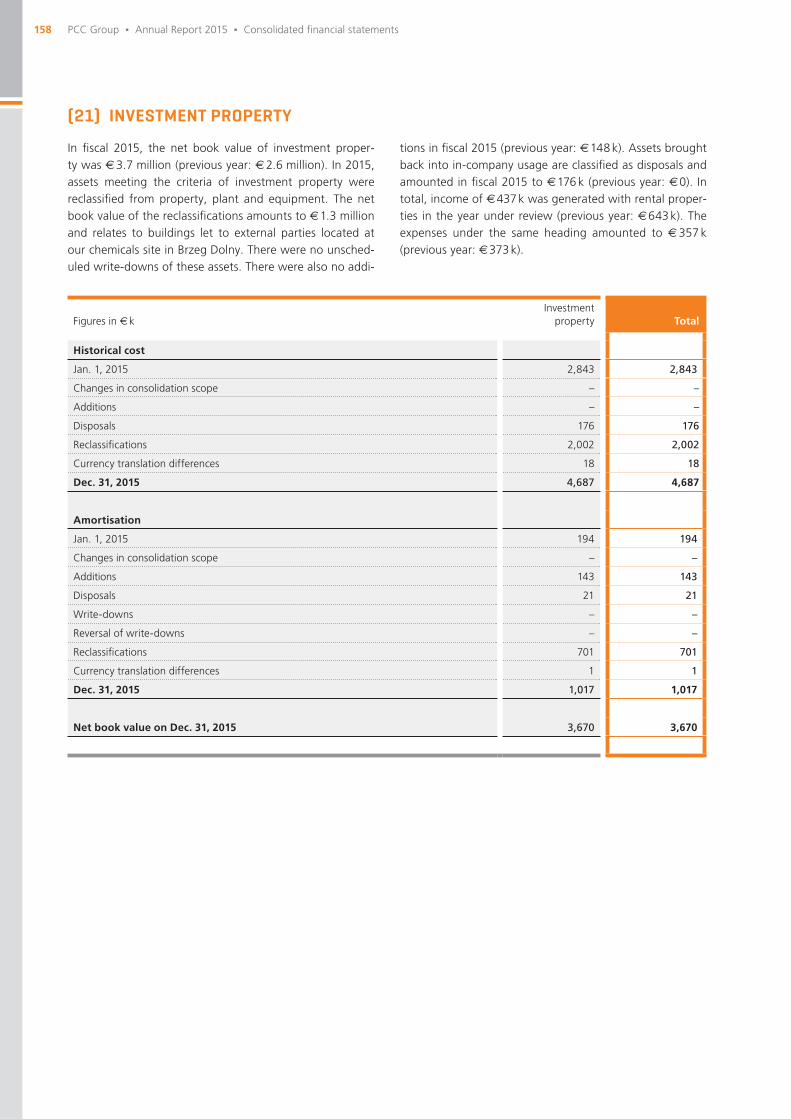
158 PCC Group Δ Annual Report 2015 Δ Consolidated fi nancial statements
(21) INVESTMENT PROPERTY
In fi scal 2015, the net book value of investment proper-ty was € 3.7 million (previous year: € 2.6 million). In 2015, assets meeting the criteria of investment property were reclassifi ed from property, plant and equipment. The net book value of the reclassifi cations amounts to € 1.3 million and relates to buildings let to external parties located at our chemicals site in Brzeg Dolny. There were no unsched-uled write-downs of these assets. There were also no addi-
tions in fi scal 2015 (previous year: € 148 k). Assets brought back into in-company usage are classifi ed as disposals and amounted in fi scal 2015 to € 176 k (previous year: € 0). In total, income of € 437 k was generated with rental proper-ties in the year under review (previous year: € 643 k). The expenses under the same heading amounted to € 357 k (previous year: € 373 k).
Figures in € kInvestment
property Total
Historical cost
Jan. 1, 2015 2,843 2,843
Changes in consolidation scope – –
Additions – –
Disposals 176 176
Reclassifi cations 2,002 2,002
Currency translation differences 18 18
Dec. 31, 2015 4,687 4,687
Amortisation
Jan. 1, 2015 194 194
Changes in consolidation scope – –
Additions 143 143
Disposals 21 21
Write-downs – –
Reversal of write-downs – –
Reclassifi cations 701 701
Currency translation differences 1 1
Dec. 31, 2015 1,017 1,017
Net book value on Dec. 31, 2015 3,670 3,670
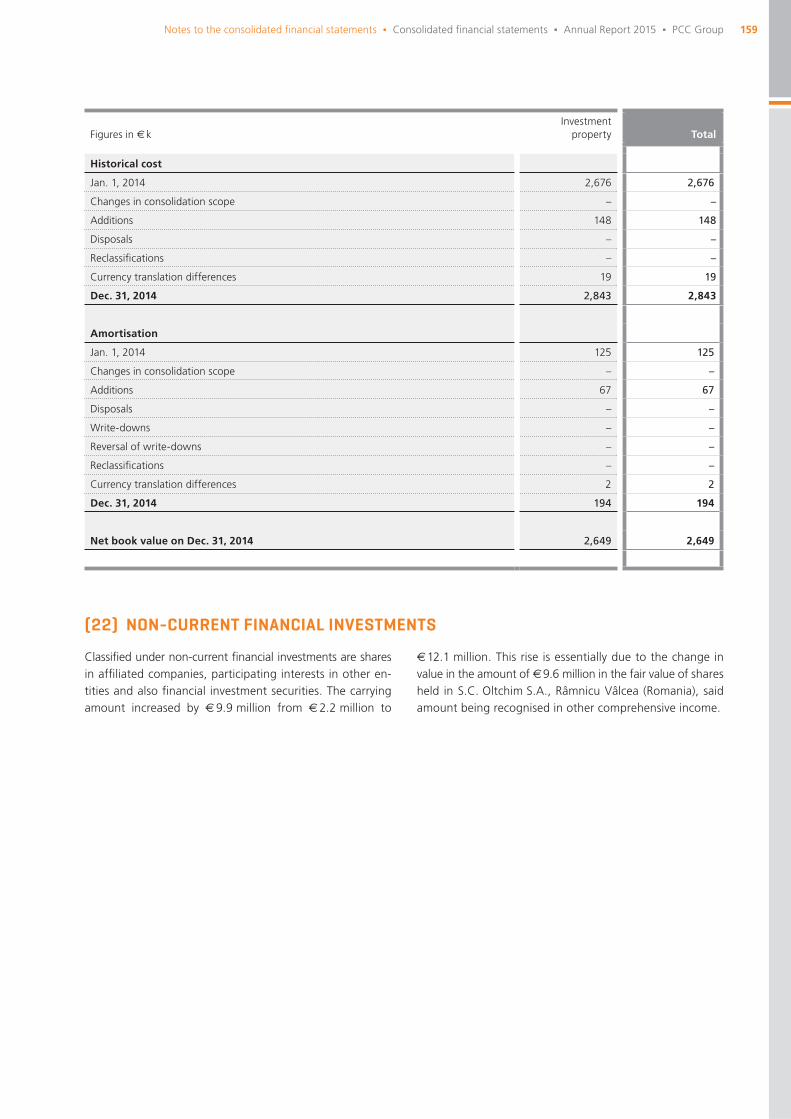
159Notes to the consolidated fi nancial statements Δ Consolidated fi nancial statements Δ Annual Report 2015 Δ PCC Group
(22) NON-CURRENT FINANCIAL INVESTMENTS
Classifi ed under non-current fi nancial investments are shares in affi liated companies, participating interests in other en-tities and also fi nancial investment securities. The carrying amount increased by € 9.9 million from € 2.2 million to
€ 12.1 million. This rise is essentially due to the change in value in the amount of € 9.6 million in the fair value of shares held in S.C. Oltchim S.A., Râmnicu Vâlcea (Romania), said amount being recognised in other comprehensive income.
Figures in € kInvestment
property Total
Historical cost
Jan. 1, 2014 2,676 2,676
Changes in consolidation scope – –
Additions 148 148
Disposals – –
Reclassifi cations – –
Currency translation differences 19 19
Dec. 31, 2014 2,843 2,843
Amortisation
Jan. 1, 2014 125 125
Changes in consolidation scope – –
Additions 67 67
Disposals – –
Write-downs – –
Reversal of write-downs – –
Reclassifi cations – –
Currency translation differences 2 2
Dec. 31, 2014 194 194
Net book value on Dec. 31, 2014 2,649 2,649
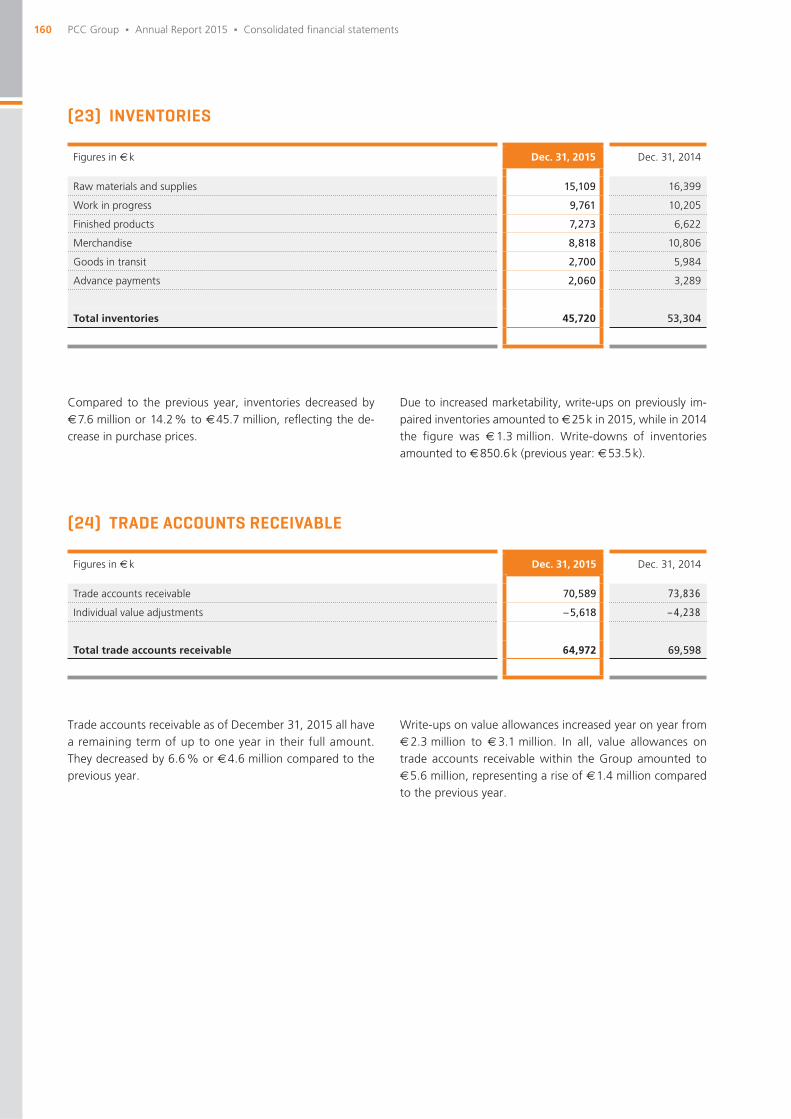
160 PCC Group Δ Annual Report 2015 Δ Consolidated fi nancial statements
Figures in € k Dec. 31, 2015 Dec. 31, 2014
Raw materials and supplies 15,109 16,399
Work in progress 9,761 10,205
Finished products 7,273 6,622
Merchandise 8,818 10,806
Goods in transit 2,700 5,984
Advance payments 2,060 3,289
Total inventories 45,720 53,304
(23) INVENTORIES
Compared to the previous year, inventories decreased by € 7.6 million or 14.2 % to € 45.7 million, refl ecting the de-crease in purchase prices.
Due to increased marketability, write-ups on previously im-paired inventories amounted to € 25 k in 2015, while in 2014 the fi gure was € 1.3 million. Write-downs of inventories amounted to € 850.6 k (previous year: € 53.5 k).
(24) TRADE ACCOUNTS RECEIVABLE
Trade accounts receivable as of December 31, 2015 all have a remaining term of up to one year in their full amount. They decreased by 6.6 % or € 4.6 million compared to the previous year.
Write-ups on value allowances increased year on year from € 2.3 million to € 3.1 million. In all, value allowances on trade accounts receivable within the Group amounted to € 5.6 million, representing a rise of € 1.4 million compared to the previous year.
Figures in € k Dec. 31, 2015 Dec. 31, 2014
Trade accounts receivable 70,589 73,836
Individual value adjustments – 5,618 – 4,238
Total trade accounts receivable 64,972 69,598
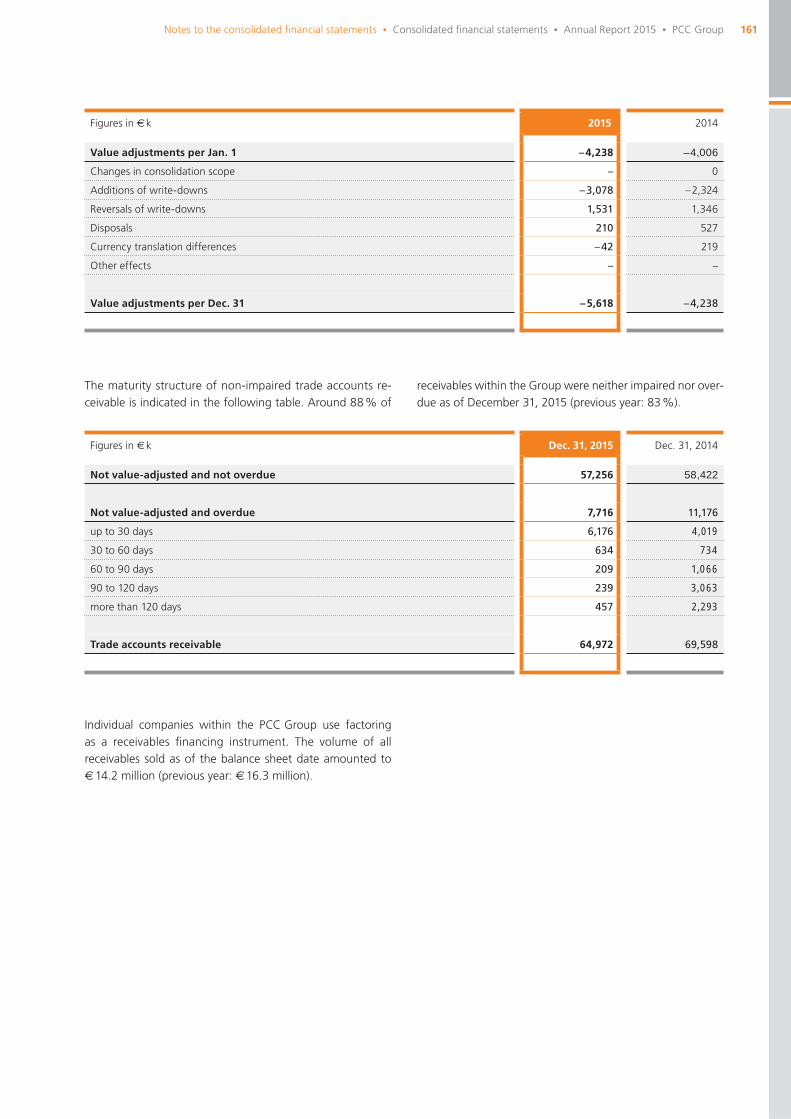
161Notes to the consolidated fi nancial statements Δ Consolidated fi nancial statements Δ Annual Report 2015 Δ PCC Group
Figures in € k 2015 2014
Value adjustments per Jan. 1 – 4,238 – 4,006
Changes in consolidation scope – 0
Additions of write-downs – 3,078 – 2,324
Reversals of write-downs 1,531 1,346
Disposals 210 527
Currency translation differences – 42 219
Other effects – –
Value adjustments per Dec. 31 – 5,618 – 4,238
Figures in € k Dec. 31, 2015 Dec. 31, 2014
Not value-adjusted and not overdue 57,256 58,422
Not value-adjusted and overdue 7,716 11,176
up to 30 days 6,176 4,019
30 to 60 days 634 734
60 to 90 days 209 1,066
90 to 120 days 239 3,063
more than 120 days 457 2,293
Trade accounts receivable 64,972 69,598
The maturity structure of non-impaired trade accounts re-ceivable is indicated in the following table. Around 88 % of
receivables within the Group were neither impaired nor over-due as of December 31, 2015 (previous year: 83 %).
Individual companies within the PCC Group use factoring as a receivables fi nancing instrument. The volume of all receivables sold as of the balance sheet date amounted to € 14.2 million (previous year: € 16.3 million).

162 PCC Group Δ Annual Report 2015 Δ Consolidated fi nancial statements
(25) OTHER RECEIVABLES AND OTHER ASSETS
Figures in € k Dec. 31, 2015 Dec. 31, 2014
Non-current Current Non-current Current
Accounts receivable from affi liated companies – 1,406 – 1,750
Accounts receivable from enterprises in which participating interests are held – 9,657 – 9,561
Security deposits paid – 122 – 163
Reimbursement claims for VAT and other duties – 7,030 – 11,112
Receivables from employees – 28 – 113
Insurance claims – – – –
Positive fair values on derivatives – – – 2
Prepaid expenses and deferred charges – 4,466 – 3,396
Loans to affi liated companies – 517 – 393
Other securities – 487 – –
Sundry other current assets – 16,728 – 31,054
Other receivables and other assets – 40,442 – 57,544
Accounts receivable from affi liated companies as of Decem-ber 31, 2015 all have a remaining term of up to one year in their full amount. They comprise accounts receivable from affi liated, non-consolidated companies. Further information is also provided in the section on related parties, see Note (37). These are largely loan receivables from project companies. Receivables from enterprises in which participating interests are held relate to the loan receivables from a Polish com-pany in which the PCC Group holds one share and no co-determination rights. The decrease in some of the other current assets relates primarily to the purchase price pay-ment in respect of shares held by the minority shareholder of PCC BakkiSilicon hf. The remainder of the sundry other
current assets largely consists of a residual purchase price claim against an international investment fund arising from the sale of shares in PCC Exol SA, Brzeg Dolny (Poland), in the amount of € 14.2 million. The shares in PCC Exol SA sold serve as security collateral for these claims.
As of the balance sheet date, an impairment was charged in the amount of € 0.5 million on the carrying value of the shares in SSH Sp. z o.o., Gliwice (Poland). The shares in this company were sold in February 2016. Other than the afore-mentioned, there were no further impairments charged on other assets or on receivables from affi liated companies. There were no impairments charged in the previous year.
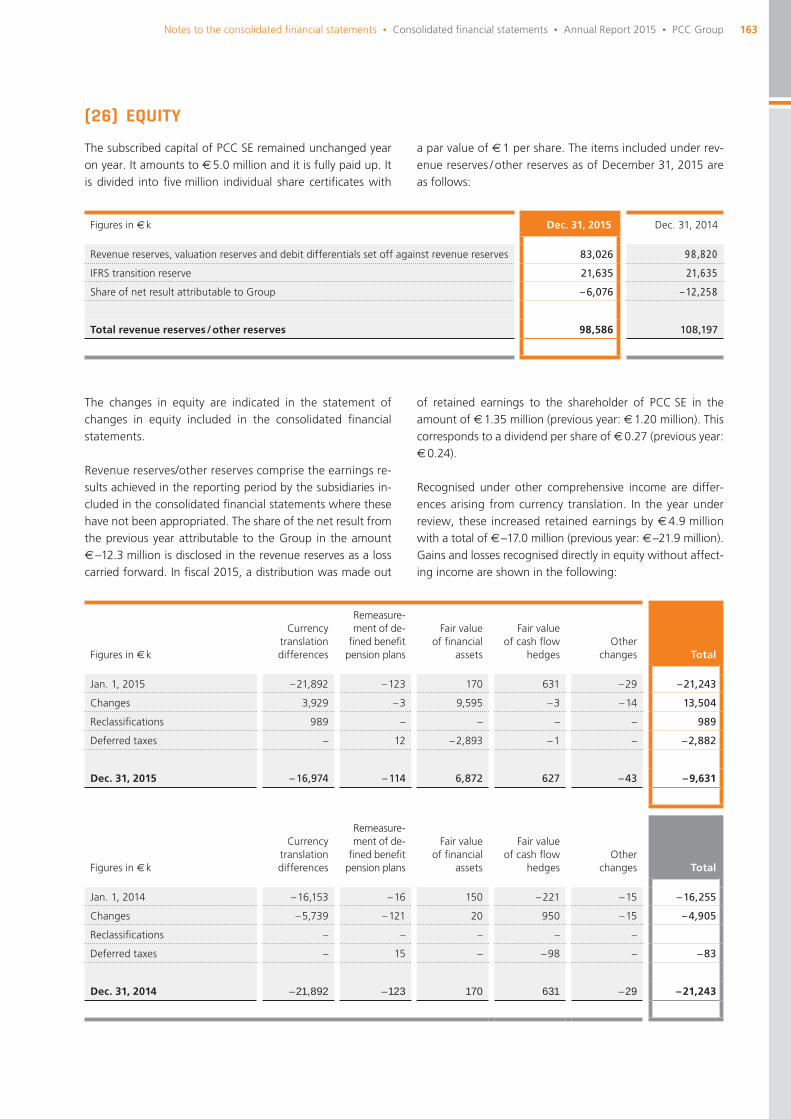
163Notes to the consolidated fi nancial statements Δ Consolidated fi nancial statements Δ Annual Report 2015 Δ PCC Group
(26) EQUITY
The subscribed capital of PCC SE remained unchanged year on year. It amounts to € 5.0 million and it is fully paid up. It is divided into fi ve million individual share certifi cates with
a par value of € 1 per share. The items included under rev-enue reserves / other reserves as of December 31, 2015 are as follows:
Figures in € k Dec. 31, 2015 Dec. 31, 2014
Revenue reserves, valuation reserves and debit differentials set off against revenue reserves 83,026 98,820
IFRS transition reserve 21,635 21,635
Share of net result attributable to Group – 6,076 – 12,258
Total revenue reserves / other reserves 98,586 108,197
The changes in equity are indicated in the statement of changes in equity included in the consolidated fi nancial statements.
Revenue reserves/other reserves comprise the earnings re-sults achieved in the reporting period by the subsidiaries in-cluded in the consolidated fi nancial statements where these have not been appropriated. The share of the net result from the previous year attributable to the Group in the amount € –12.3 million is disclosed in the revenue reserves as a loss carried forward. In fi scal 2015, a distribution was made out
of retained earnings to the shareholder of PCC SE in the amount of € 1.35 million (previous year: € 1.20 million). This corresponds to a dividend per share of € 0.27 (previous year: € 0.24).
Recognised under other comprehensive income are differ-ences arising from currency translation. In the year under review, these increased retained earnings by € 4.9 million with a total of € –17.0 million (previous year: € –21.9 million). Gains and losses recognised directly in equity without affect-ing income are shown in the following:
Figures in € k
Currency translation differences
Remeasure-ment of de-
fi ned benefi t pension plans
Fair value of fi nancial
assets
Fair value of cash fl ow
hedgesOther
changes Total
Jan. 1, 2015 – 21,892 – 123 170 631 – 29 – 21,243
Changes 3,929 – 3 9,595 – 3 – 14 13,504
Reclassifi cations 989 – – – – 989
Deferred taxes – 12 – 2,893 – 1 – – 2,882
Dec. 31, 2015 – 16,974 – 114 6,872 627 – 43 – 9,631
Figures in € k
Currency translation differences
Remeasure-ment of de-
fi ned benefi t pension plans
Fair value of fi nancial
assets
Fair value of cash fl ow
hedgesOther
changes Total
Jan. 1, 2014 – 16,153 – 16 150 – 221 – 15 – 16,255
Changes – 5,739 – 121 20 950 – 15 – 4,905
Reclassifi cations – – – – –
Deferred taxes – 15 – – 98 – – 83
Dec. 31, 2014 – 21,892 – 123 170 631 – 29 – 21,243
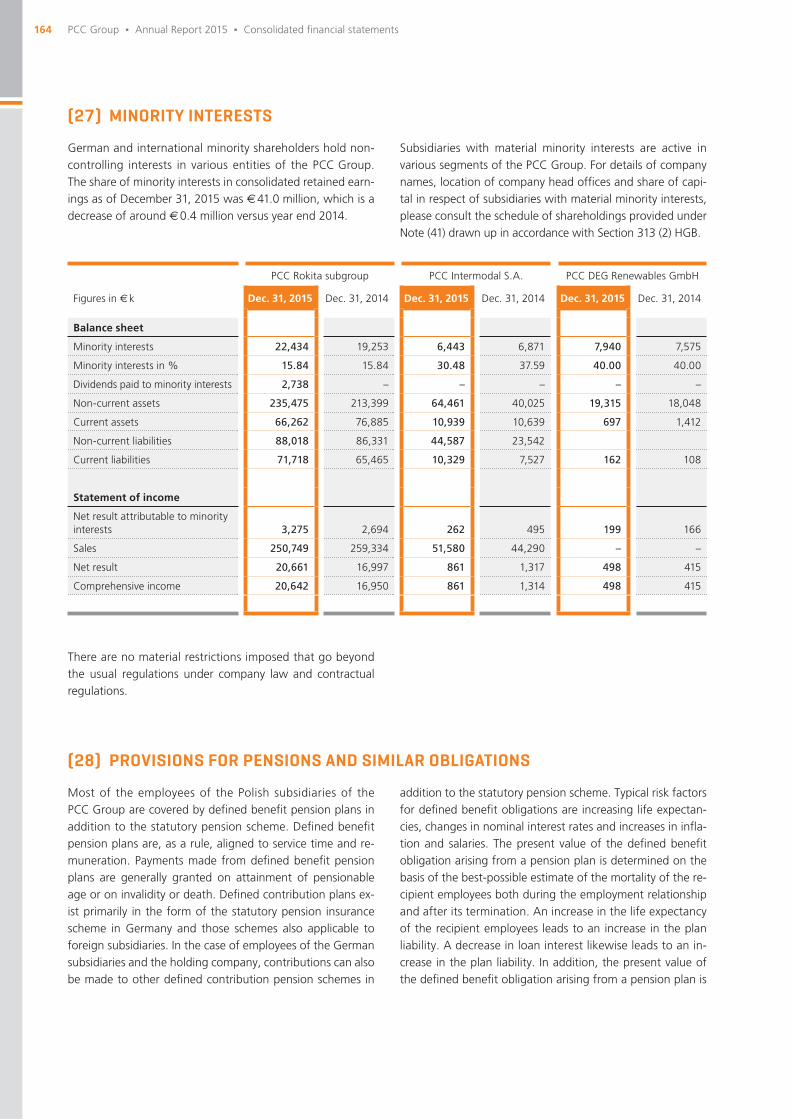
164 PCC Group Δ Annual Report 2015 Δ Consolidated fi nancial statements
(27) MINORITY INTERESTS
German and international minority shareholders hold non-controlling interests in various entities of the PCC Group. The share of minority interests in consolidated retained earn-ings as of December 31, 2015 was € 41.0 million, which is a decrease of around € 0.4 million versus year end 2014.
Subsidiaries with material minority interests are active in various segments of the PCC Group. For details of company names, location of company head offi ces and share of capi-tal in respect of subsidiaries with material minority interests, please consult the schedule of shareholdings provided under Note (41) drawn up in accordance with Section 313 (2) HGB.
PCC Rokita subgroup PCC Intermodal S.A. PCC DEG Renewables GmbH
Figures in € k Dec. 31, 2015 Dec. 31, 2014 Dec. 31, 2015 Dec. 31, 2014 Dec. 31, 2015 Dec. 31, 2014
Balance sheet
Minority interests 22,434 19,253 6,443 6,871 7,940 7,575
Minority interests in % 15.84 15.84 30.48 37.59 40.00 40.00
Dividends paid to minority interests 2,738 – – – – –
Non-current assets 235,475 213,399 64,461 40,025 19,315 18,048
Current assets 66,262 76,885 10,939 10,639 697 1,412
Non-current liabilities 88,018 86,331 44,587 23,542
Current liabilities 71,718 65,465 10,329 7,527 162 108
Statement of income
Net result attributable to minority interests 3,275 2,694 262 495 199 166
Sales 250,749 259,334 51,580 44,290 – –
Net result 20,661 16,997 861 1,317 498 415
Comprehensive income 20,642 16,950 861 1,314 498 415
There are no material restrictions imposed that go beyond the usual regulations under company law and contractual regulations.
(28) PROVISIONS FOR PENSIONS AND SIMILAR OBLIGATIONS
Most of the employees of the Polish subsidiaries of the PCC Group are covered by defi ned benefi t pension plans in addition to the statutory pension scheme. Defi ned benefi t pension plans are, as a rule, aligned to service time and re-muneration. Payments made from defi ned benefi t pension plans are generally granted on attainment of pensionable age or on invalidity or death. Defi ned contribution plans ex-ist primarily in the form of the statutory pension insurance scheme in Germany and those schemes also applicable to foreign subsidiaries. In the case of employees of the German subsidiaries and the holding company, contributions can also be made to other defi ned contribution pension schemes in
addition to the statutory pension scheme. Typical risk factors for defi ned benefi t obligations are increasing life expectan-cies, changes in nominal interest rates and increases in infl a-tion and salaries. The present value of the defi ned benefi t obligation arising from a pension plan is determined on the basis of the best-possible estimate of the mortality of the re-cipient employees both during the employment relationship and after its termination. An increase in the life expectancy of the recipient employees leads to an increase in the plan liability. A decrease in loan interest likewise leads to an in-crease in the plan liability. In addition, the present value of the defi ned benefi t obligation arising from a pension plan is
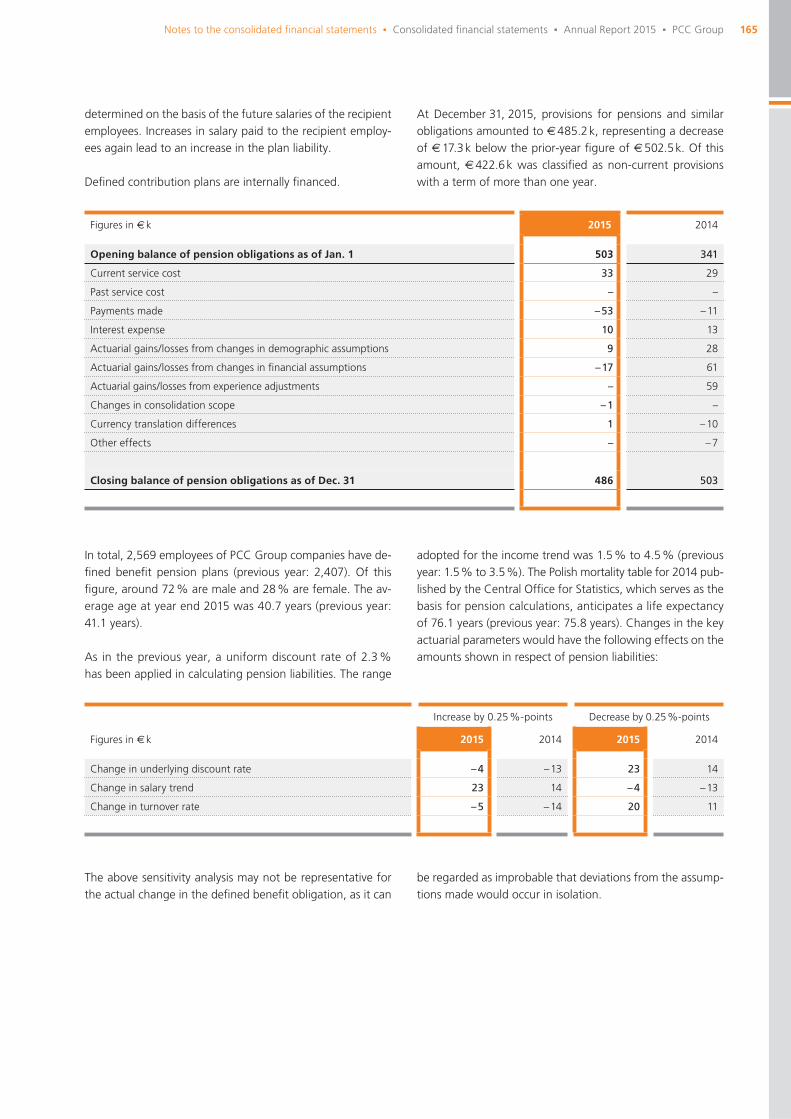
165Notes to the consolidated fi nancial statements Δ Consolidated fi nancial statements Δ Annual Report 2015 Δ PCC Group
determined on the basis of the future salaries of the recipient employees. Increases in salary paid to the recipient employ-ees again lead to an increase in the plan liability.
Defi ned contribution plans are internally fi nanced.
At December 31, 2015, provisions for pensions and similar obligations amounted to € 485.2 k, representing a decrease of € 17.3 k below the prior-year fi gure of € 502.5 k. Of this amount, € 422.6 k was classifi ed as non-current provisions with a term of more than one year.
Figures in € k 2015 2014
Opening balance of pension obligations as of Jan. 1 503 341
Current service cost 33 29
Past service cost – –
Payments made – 53 – 11
Interest expense 10 13
Actuarial gains/losses from changes in demographic assumptions 9 28
Actuarial gains/losses from changes in fi nancial assumptions – 17 61
Actuarial gains/losses from experience adjustments – 59
Changes in consolidation scope – 1 –
Currency translation differences 1 – 10
Other effects – – 7
Closing balance of pension obligations as of Dec. 31 486 503
In total, 2,569 employees of PCC Group companies have de-fi ned benefi t pension plans (previous year: 2,407). Of this fi gure, around 72 % are male and 28 % are female. The av-erage age at year end 2015 was 40.7 years (previous year: 41.1 years).
As in the previous year, a uniform discount rate of 2.3 % has been applied in calculating pension liabilities. The range
adopted for the income trend was 1.5 % to 4.5 % (previous year: 1.5 % to 3.5 %). The Polish mortality table for 2014 pub-lished by the Central Offi ce for Statistics, which serves as the basis for pension calculations, anticipates a life expectancy of 76.1 years (previous year: 75.8 years). Changes in the key actuarial parameters would have the following effects on the amounts shown in respect of pension liabilities:
Increase by 0.25 %-points Decrease by 0.25 %-points
Figures in € k 2015 2014 2015 2014
Change in underlying discount rate – 4 – 13 23 14
Change in salary trend 23 14 – 4 – 13
Change in turnover rate – 5 – 14 20 11
The above sensitivity analysis may not be representative for the actual change in the defi ned benefi t obligation, as it can
be regarded as improbable that deviations from the assump-tions made would occur in isolation.
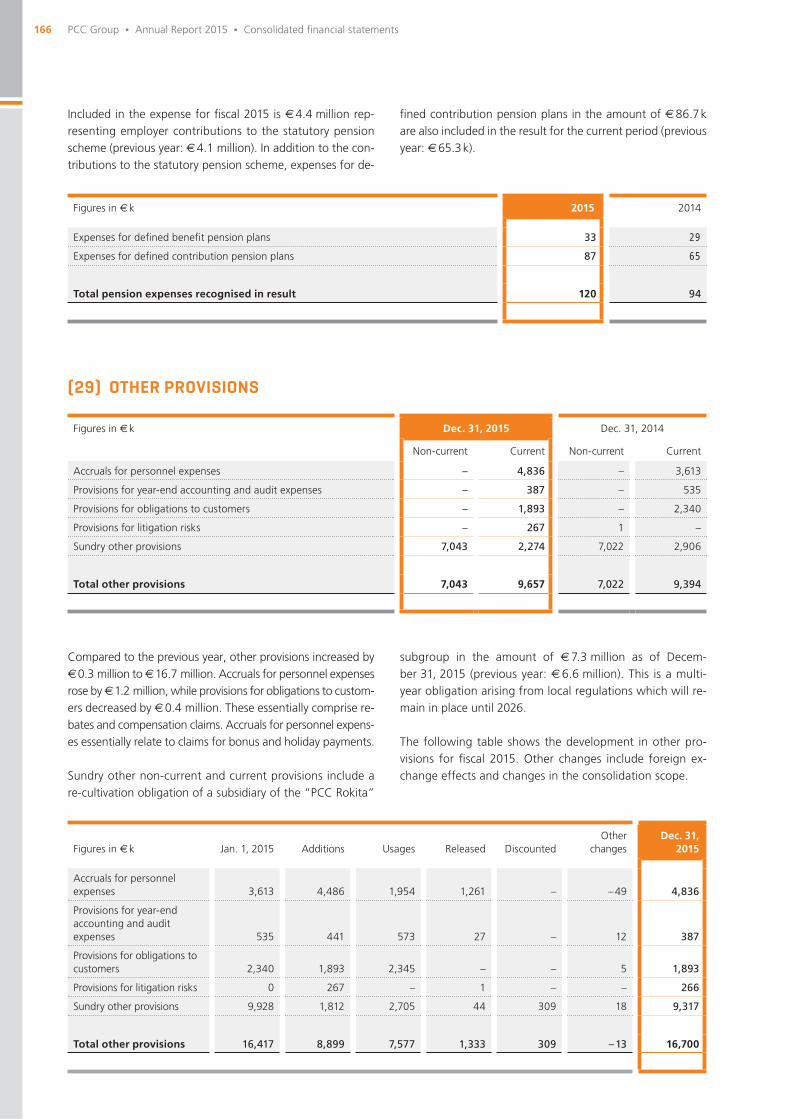
166 PCC Group Δ Annual Report 2015 Δ Consolidated fi nancial statements
(29) OTHER PROVISIONS
Compared to the previous year, other provisions increased by € 0.3 million to € 16.7 million. Accruals for personnel expenses rose by € 1.2 million, while provisions for obligations to custom-ers decreased by € 0.4 million. These essentially comprise re-bates and compensation claims. Accruals for personnel expens-es essentially relate to claims for bonus and holiday payments.
Sundry other non-current and current provisions include a re-cultivation obligation of a subsidiary of the “PCC Rokita”
Figures in € k Dec. 31, 2015 Dec. 31, 2014
Non-current Current Non-current Current
Accruals for personnel expenses – 4,836 – 3,613
Provisions for year-end accounting and audit expenses – 387 – 535
Provisions for obligations to customers – 1,893 – 2,340
Provisions for litigation risks – 267 1 –
Sundry other provisions 7,043 2,274 7,022 2,906
Total other provisions 7,043 9,657 7,022 9,394
subgroup in the amount of € 7.3 million as of Decem-ber 31, 2015 (previous year: € 6.6 million). This is a multi-year obligation arising from local regulations which will re-main in place until 2026.
The following table shows the development in other pro-visions for fi scal 2015. Other changes include foreign ex-change effects and changes in the consolidation scope.
Figures in € k Jan. 1, 2015 Additions Usages Released DiscountedOther
changesDec. 31,
2015
Accruals for personnel expenses 3,613 4,486 1,954 1,261 – – 49 4,836
Provisions for year-end accounting and audit expenses 535 441 573 27 – 12 387
Provisions for obligations to customers 2,340 1,893 2,345 – – 5 1,893
Provisions for litigation risks 0 267 – 1 – – 266
Sundry other provisions 9,928 1,812 2,705 44 309 18 9,317
Total other provisions 16,417 8,899 7,577 1,333 309 – 13 16,700
Figures in € k 2015 2014
Expenses for defi ned benefi t pension plans 33 29
Expenses for defi ned contribution pension plans 87 65
Total pension expenses recognised in result 120 94
Included in the expense for fi scal 2015 is € 4.4 million rep-resenting employer contributions to the statutory pension scheme (previous year: € 4.1 million). In addition to the con-tributions to the statutory pension scheme, expenses for de-
fi ned contribution pension plans in the amount of € 86.7 k are also included in the result for the current period (previous year: € 65.3 k).
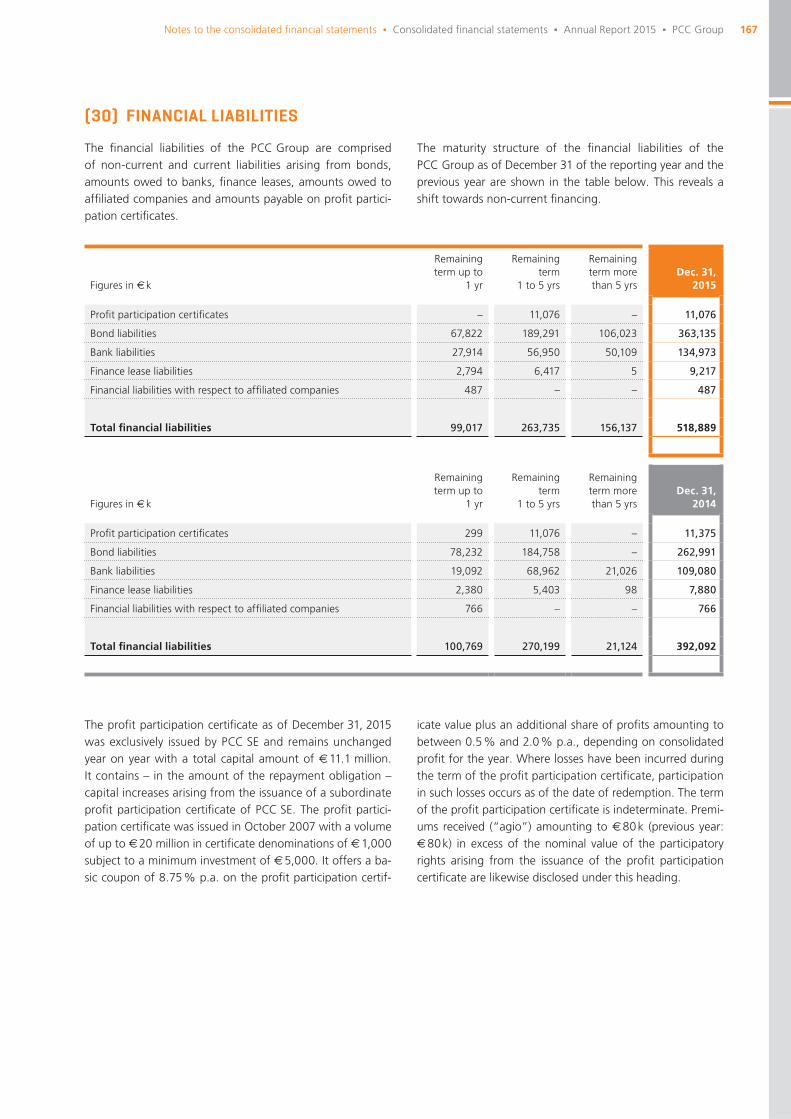
167Notes to the consolidated fi nancial statements Δ Consolidated fi nancial statements Δ Annual Report 2015 Δ PCC Group
(30) FINANCIAL LIABILITIES
The fi nancial liabilities of the PCC Group are comprised of non-current and current liabilities arising from bonds, amounts owed to banks, fi nance leases, amounts owed to affi liated companies and amounts payable on profi t partici-pation certifi cates.
The maturity structure of the fi nancial liabilities of the PCC Group as of December 31 of the reporting year and the previous year are shown in the table below. This reveals a shift towards non-current fi nancing.
Figures in € k
Remaining term up to
1 yr
Remaining term
1 to 5 yrs
Remaining term more than 5 yrs
Dec. 31, 2015
Profi t participation certifi cates – 11,076 – 11,076
Bond liabilities 67,822 189,291 106,023 363,135
Bank liabilities 27,914 56,950 50,109 134,973
Finance lease liabilities 2,794 6,417 5 9,217
Financial liabilities with respect to affi liated companies 487 – – 487
Total fi nancial liabilities 99,017 263,735 156,137 518,889
Figures in € k
Remaining term up to
1 yr
Remaining term
1 to 5 yrs
Remaining term more than 5 yrs
Dec. 31, 2014
Profi t participation certifi cates 299 11,076 – 11,375
Bond liabilities 78,232 184,758 – 262,991
Bank liabilities 19,092 68,962 21,026 109,080
Finance lease liabilities 2,380 5,403 98 7,880
Financial liabilities with respect to affi liated companies 766 – – 766
Total fi nancial liabilities 100,769 270,199 21,124 392,092
The profi t participation certifi cate as of December 31, 2015 was exclusively issued by PCC SE and remains unchanged year on year with a total capital amount of € 11.1 million. It contains – in the amount of the repayment obligation – capital increases arising from the issuance of a subordinate profi t participation certifi cate of PCC SE. The profi t partici-pation certifi cate was issued in October 2007 with a volume of up to € 20 million in certifi cate denominations of € 1,000 subject to a minimum investment of € 5,000. It offers a ba-sic coupon of 8.75 % p.a. on the profi t participation certif-
icate value plus an additional share of profi ts amounting to between 0.5 % and 2.0 % p.a., depending on consolidated profi t for the year. Where losses have been incurred during the term of the profi t participation certifi cate, participation in such losses occurs as of the date of redemption. The term of the profi t participation certifi cate is indeterminate. Premi-ums received (“agio”) amounting to € 80 k (previous year: € 80 k) in excess of the nominal value of the participatory rights arising from the issuance of the profi t participation certifi cate are likewise disclosed under this heading.
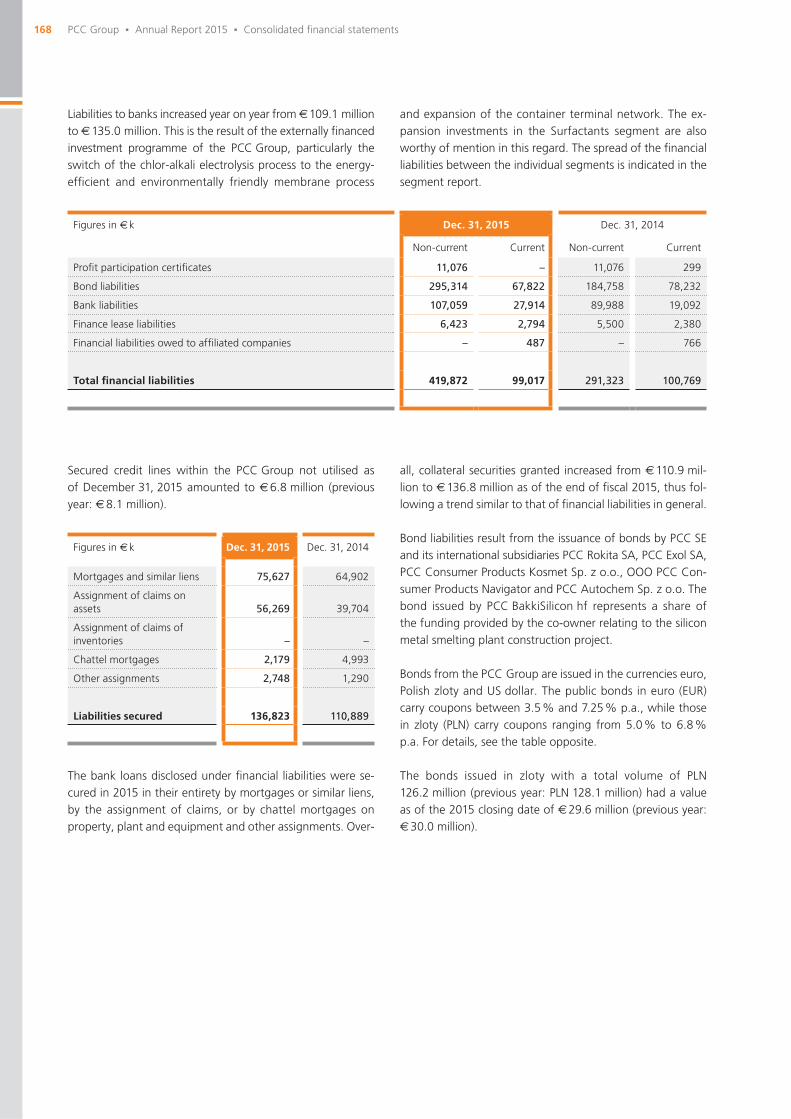
168 PCC Group Δ Annual Report 2015 Δ Consolidated fi nancial statements
Secured credit lines within the PCC Group not utilised as of December 31, 2015 amounted to € 6.8 million (previous year: € 8.1 million).
Figures in € k Dec. 31, 2015 Dec. 31, 2014
Non-current Current Non-current Current
Profi t participation certifi cates 11,076 – 11,076 299
Bond liabilities 295,314 67,822 184,758 78,232
Bank liabilities 107,059 27,914 89,988 19,092
Finance lease liabilities 6,423 2,794 5,500 2,380
Financial liabilities owed to affi liated companies – 487 – 766
Total fi nancial liabilities 419,872 99,017 291,323 100,769
Figures in € k Dec. 31, 2015 Dec. 31, 2014
Mortgages and similar liens 75,627 64,902
Assignment of claims on assets 56,269 39,704
Assignment of claims of inventories – –
Chattel mortgages 2,179 4,993
Other assignments 2,748 1,290
Liabilities secured 136,823 110,889
The bank loans disclosed under fi nancial liabilities were se-cured in 2015 in their entirety by mortgages or similar liens, by the assignment of claims, or by chattel mortgages on property, plant and equipment and other assignments. Over-
Liabilities to banks increased year on year from € 109.1 million to € 135.0 million. This is the result of the externally fi nanced investment programme of the PCC Group, particularly the switch of the chlor-alkali electrolysis process to the energy-effi cient and environmentally friendly membrane process
and expansion of the container terminal network. The ex-pansion investments in the Surfactants segment are also worthy of mention in this regard. The spread of the fi nancial liabilities between the individual segments is indicated in the segment report.
all, collateral securities granted increased from € 110.9 mil-lion to € 136.8 million as of the end of fi scal 2015, thus fol-lowing a trend similar to that of fi nancial liabilities in general.
Bond liabilities result from the issuance of bonds by PCC SE and its international subsidiaries PCC Rokita SA, PCC Exol SA, PCC Consumer Products Kosmet Sp. z o.o., OOO PCC Con-sumer Products Navigator and PCC Autochem Sp. z o.o. The bond issued by PCC BakkiSilicon hf represents a share of the funding provided by the co-owner relating to the silicon metal smelting plant construction project.
Bonds from the PCC Group are issued in the currencies euro, Polish zloty and US dollar. The public bonds in euro (EUR) carry coupons between 3.5 % and 7.25 % p.a., while those in zloty (PLN) carry coupons ranging from 5.0 % to 6.8 % p.a. For details, see the table opposite.
The bonds issued in zloty with a total volume of PLN 126.2 million (previous year: PLN 128.1 million) had a value as of the 2015 closing date of € 29.6 million (previous year: € 30.0 million).
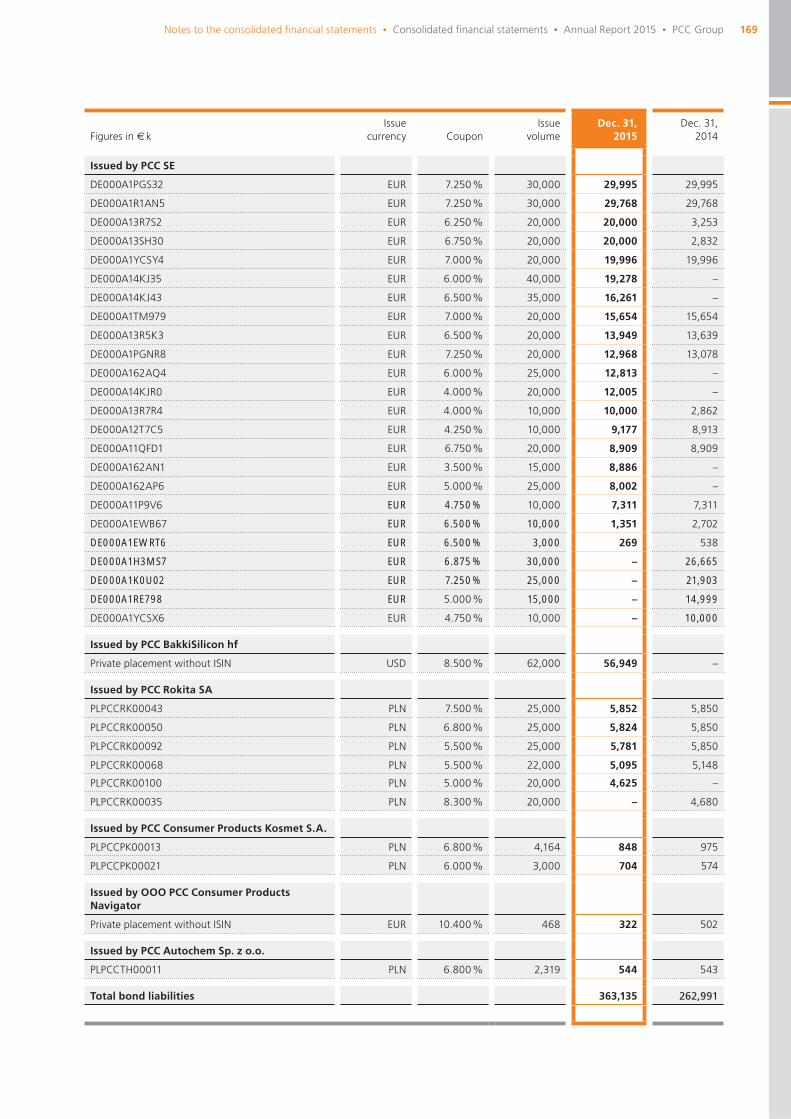
169Notes to the consolidated fi nancial statements Δ Consolidated fi nancial statements Δ Annual Report 2015 Δ PCC Group
Figures in € kIssue
currency CouponIssue
volumeDec. 31,
2015Dec. 31,
2014
Issued by PCC SE
DE000A1PGS32 EUR 7.250 % 30,000 29,995 29,995
DE000A1R1AN5 EUR 7.250 % 30,000 29,768 29,768
DE000A13R7S2 EUR 6.250 % 20,000 20,000 3,253
DE000A13SH30 EUR 6.750 % 20,000 20,000 2,832
DE000A1YCSY4 EUR 7.000 % 20,000 19,996 19,996
DE000A14KJ35 EUR 6.000 % 40,000 19,278 –
DE000A14KJ43 EUR 6.500 % 35,000 16,261 –
DE000A1TM979 EUR 7.000 % 20,000 15,654 15,654
DE000A13R5K3 EUR 6.500 % 20,000 13,949 13,639
DE000A1PGNR8 EUR 7.250 % 20,000 12,968 13,078
DE000A162AQ4 EUR 6.000 % 25,000 12,813 –
DE000A14KJR0 EUR 4.000 % 20,000 12,005 –
DE000A13R7R4 EUR 4.000 % 10,000 10,000 2,862
DE000A12T7C5 EUR 4.250 % 10,000 9,177 8,913
DE000A11QFD1 EUR 6.750 % 20,000 8,909 8,909
DE000A162AN1 EUR 3.500 % 15,000 8,886 –
DE000A162AP6 EUR 5.000 % 25,000 8,002 –
DE000A11P9V6 EUR 4.750 % 10,000 7,311 7,311
DE000A1EWB67 EUR 6.500 % 10,000 1,351 2,702
DE000A1EWRT6 EUR 6.500 % 3,000 269 538
DE000A1H3MS7 EUR 6.875 % 30,000 – 26,665
DE000A1K0U02 EUR 7.250 % 25,000 – 21,903
DE000A1RE798 EUR 5.000 % 15,000 – 14,999
DE000A1YCSX6 EUR 4.750 % 10,000 – 10,000
Issued by PCC BakkiSilicon hf
Private placement without ISIN USD 8.500 % 62,000 56,949 –
Issued by PCC Rokita SA
PLPCCRK00043 PLN 7.500 % 25,000 5,852 5,850
PLPCCRK00050 PLN 6.800 % 25,000 5,824 5,850
PLPCCRK00092 PLN 5.500 % 25,000 5,781 5,850
PLPCCRK00068 PLN 5.500 % 22,000 5,095 5,148
PLPCCRK00100 PLN 5.000 % 20,000 4,625 –
PLPCCRK00035 PLN 8.300 % 20,000 – 4,680
Issued by PCC Consumer Products Kosmet S.A.
PLPCCPK00013 PLN 6.800 % 4,164 848 975
PLPCCPK00021 PLN 6.000 % 3,000 704 574
Issued by OOO PCC Consumer Products Navigator
Private placement without ISIN EUR 10.400 % 468 322 502
Issued by PCC Autochem Sp. z o.o.
PLPCCTH00011 PLN 6.800 % 2,319 544 543
Total bond liabilities 363,135 262,991
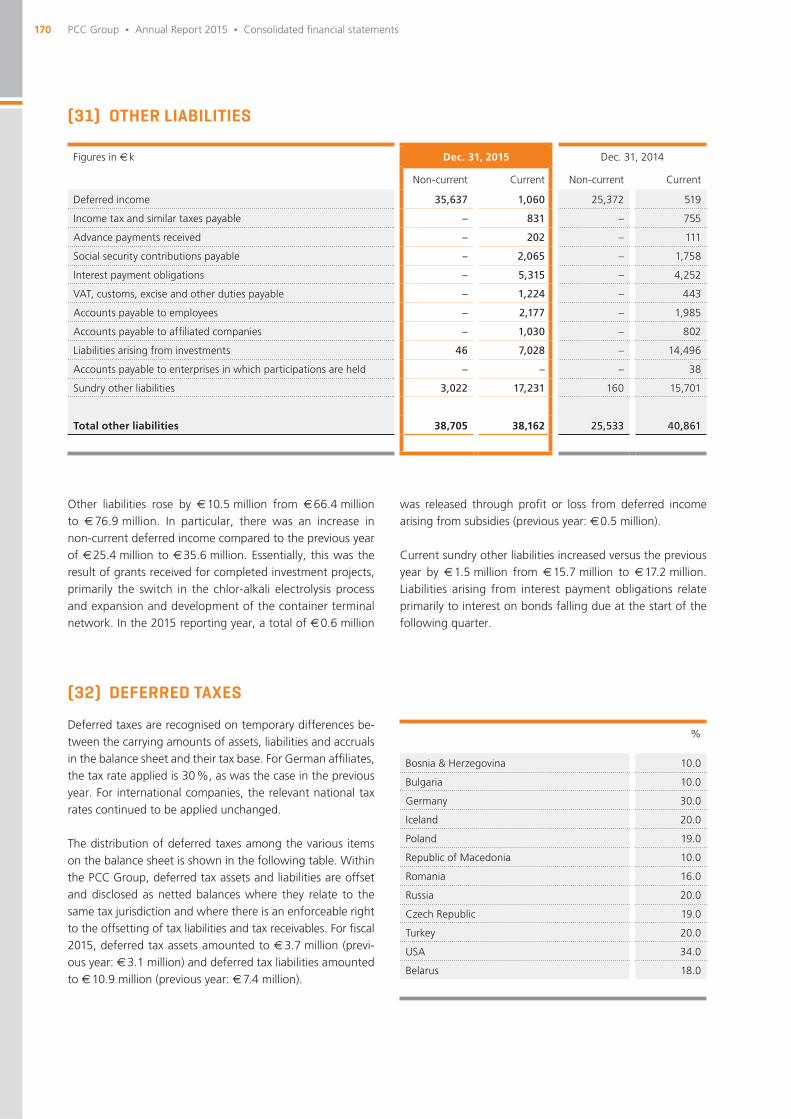
170 PCC Group Δ Annual Report 2015 Δ Consolidated fi nancial statements
(31) OTHER LIABILITIES
Other liabilities rose by € 10.5 million from € 66.4 million to € 76.9 million. In particular, there was an increase in non-current deferred income compared to the previous year of € 25.4 million to € 35.6 million. Essentially, this was the result of grants received for completed investment projects, primarily the switch in the chlor-alkali electrolysis process and expansion and development of the container terminal network. In the 2015 reporting year, a total of € 0.6 million
Figures in € k Dec. 31, 2015 Dec. 31, 2014
Non-current Current Non-current Current
Deferred income 35,637 1,060 25,372 519
Income tax and similar taxes payable – 831 – 755
Advance payments received – 202 – 111
Social security contributions payable – 2,065 – 1,758
Interest payment obligations – 5,315 – 4,252
VAT, customs, excise and other duties payable – 1,224 – 443
Accounts payable to employees – 2,177 – 1,985
Accounts payable to affi liated companies – 1,030 – 802
Liabilities arising from investments 46 7,028 – 14,496
Accounts payable to enterprises in which participations are held – – – 38
Sundry other liabilities 3,022 17,231 160 15,701
Total other liabilities 38,705 38,162 25,533 40,861
was released through profi t or loss from deferred income arising from subsidies (previous year: € 0.5 million).
Current sundry other liabilities increased versus the previous year by € 1.5 million from € 15.7 million to € 17.2 million. Liabilities arising from interest payment obligations relate primarily to interest on bonds falling due at the start of the following quarter.
(32) DEFERRED TAXES
Deferred taxes are recognised on temporary differences be-tween the carrying amounts of assets, liabilities and accruals in the balance sheet and their tax base. For German affi liates, the tax rate applied is 30 %, as was the case in the previous year. For international companies, the relevant national tax rates continued to be applied unchanged.
The distribution of deferred taxes among the various items on the balance sheet is shown in the following table. Within the PCC Group, deferred tax assets and liabilities are offset and disclosed as netted balances where they relate to the same tax jurisdiction and where there is an enforceable right to the offsetting of tax liabilities and tax receivables. For fi scal 2015, deferred tax assets amounted to € 3.7 million (previ-ous year: € 3.1 million) and deferred tax liabilities amounted to € 10.9 million (previous year: € 7.4 million).
%
Bosnia & Herzegovina 10.0
Bulgaria 10.0
Germany 30.0
Iceland 20.0
Poland 19.0
Republic of Macedonia 10.0
Romania 16.0
Russia 20.0
Czech Republic 19.0
Turkey 20.0
USA 34.0
Belarus 18.0
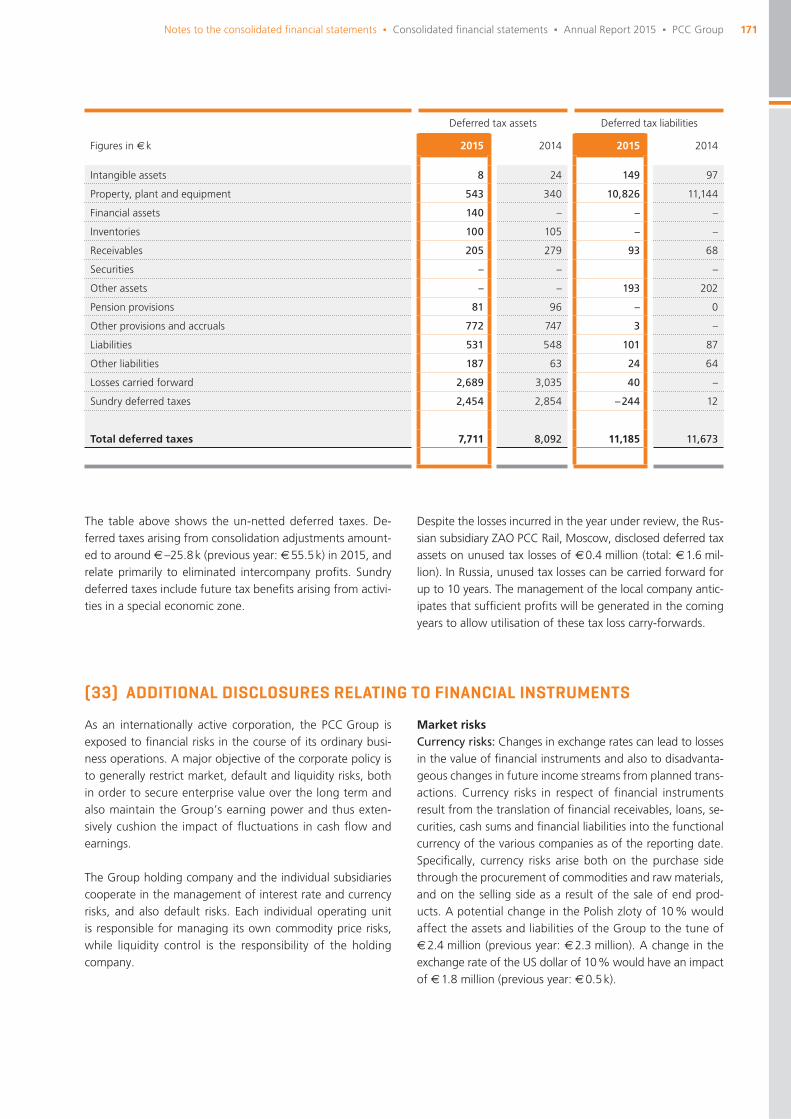
171Notes to the consolidated fi nancial statements Δ Consolidated fi nancial statements Δ Annual Report 2015 Δ PCC Group
Deferred tax assets Deferred tax liabilities
Figures in € k 2015 2014 2015 2014
Intangible assets 8 24 149 97
Property, plant and equipment 543 340 10,826 11,144
Financial assets 140 – – –
Inventories 100 105 – –
Receivables 205 279 93 68
Securities – – –
Other assets – – 193 202
Pension provisions 81 96 – 0
Other provisions and accruals 772 747 3 –
Liabilities 531 548 101 87
Other liabilities 187 63 24 64
Losses carried forward 2,689 3,035 40 –
Sundry deferred taxes 2,454 2,854 – 244 12
Total deferred taxes 7,711 8,092 11,185 11,673
The table above shows the un-netted deferred taxes. De-ferred taxes arising from consolidation adjustments amount-ed to around € –25.8 k (previous year: € 55.5 k) in 2015, and relate primarily to eliminated intercompany profi ts. Sundry deferred taxes include future tax benefi ts arising from activi-ties in a special economic zone.
Despite the losses incurred in the year under review, the Rus-sian subsidiary ZAO PCC Rail, Moscow, disclosed deferred tax assets on unused tax losses of € 0.4 million (total: € 1.6 mil-lion). In Russia, unused tax losses can be carried forward for up to 10 years. The management of the local company antic-ipates that suffi cient profi ts will be generated in the coming years to allow utilisation of these tax loss carry-forwards.
(33) ADDITIONAL DISCLOSURES RELATING TO FINANCIAL INSTRUMENTS
As an internationally active corporation, the PCC Group is exposed to fi nancial risks in the course of its ordinary busi-ness operations. A major objective of the corporate policy is to generally restrict market, default and liquidity risks, both in order to secure enterprise value over the long term and also maintain the Group’s earning power and thus exten-sively cushion the impact of fl uctuations in cash fl ow and earnings.
The Group holding company and the individual subsidiaries cooperate in the management of interest rate and currency risks, and also default risks. Each individual operating unit is responsible for managing its own commodity price risks, while liquidity control is the responsibility of the holding company.
Market risksCurrency risks: Changes in exchange rates can lead to losses in the value of fi nancial instruments and also to disadvanta-geous changes in future income streams from planned trans-actions. Currency risks in respect of fi nancial instruments result from the translation of fi nancial receivables, loans, se-curities, cash sums and fi nancial liabilities into the functional currency of the various companies as of the reporting date. Specifi cally, currency risks arise both on the purchase side through the procurement of commodities and raw materials, and on the selling side as a result of the sale of end prod-ucts. A potential change in the Polish zloty of 10 % would affect the assets and liabilities of the Group to the tune of € 2.4 million (previous year: € 2.3 million). A change in the exchange rate of the US dollar of 10 % would have an impact of € 1.8 million (previous year: € 0.5 k).
172 PCC Group Δ Annual Report 2015 Δ Consolidated fi nancial statements
Interest rate risks: These risks arise as a result of potential changes in the market interest rate, causing fl uctuations in the fair value of fi nancial instruments bearing a fi xed interest rate, and fl uctuations in interest payments in the case of fi -nancial instruments bearing fl oating interest rates. A potential change in interest rates of 100 basis points would affect the assets and liabilities of the Group to the tune of € 3.8 million (previous year: € 3.0 million).
Commodity price risks: These risks result from market price changes in relation to commodity purchases and sales, and also the purchase of electricity and gas. The general risk situ-ation of the PCC Group is greatly affected by the availability and also the price-dependency of relevant raw materials, in-put products and intermediate products. Within this context, the dependency of important commodity prices on foreign exchange rates and, in particular, the oil price, is especially relevant. Price volatilities are hedged, for example, through the agreement of price escalator clauses with suppliers and customers. Moreover, commodity price risks are restricted by internationally aligned sourcing activities. Backward integra-tion along the value chain or along the various production stages encountered in the Chemicals division provides for an additional, high degree of independence in the procurement of raw materials and commodities, thus reducing risk to an acceptable level. The commodities trading business in the Speciality Chemicals segment is exposed to major price fl uc-tuations that can occur from time to time.
Default or credit risksDefault or credit risks arise when contractual partners are unable to meet their contractual obligations. Credit limits are granted based on the continuous monitoring of the creditworthiness of major debtors. Because of the interna-tional activity and the diversifi ed customer structure of the PCC Group, there are no major regional or segment-specifi c clusters of default risks. In selecting short-term capital invest-ments, various safeguarding criteria are taken into account (e.g. ratings, capital guarantee or protection afforded by de-posit protection funds). Given the selection criteria applied
and our regime of constantly monitoring our capital invest-ments, the PCC Group does not envisage any unidentifi ed default risk occurring in this domain. The fi nancial asset amounts shown in the balance sheet essentially represent the maximum default risk.
Such risks are regularly monitored and analysed within the framework of a receivables and credit management regime and also by a Working Capital Management unit with re-sponsibility at both the operational and Group levels. In all, receivables from customers are insured for an amount of € 44.8 million (previous year: € 41.3 million). Financial assets that are neither overdue nor impaired are categorised as col-lectable in line with the creditworthiness of the debtor.
Liquidity risksLiquidity risks result from income stream fl uctuations and are identifi ed at an early stage by a liquidity planning and control system based on an IT-supported solution (Treasury Informa-tion Platform) implemented across the Group.
Liquidity is monitored and controlled on the basis of both short- and long-term corporate planning. Liquidity risks are identifi ed at an early stage through simulation of different scenarios. Current liquidity is measured and monitored with IT-supported systems on a weekly basis.
The possibility of increasing obstacles within the SME bonds market could possibly – at least temporarily – lead to liquidity bottlenecks. This risk is to be countered through the acqui-sition of alternative fi nancing sources, including at the insti-tutional level. Work is also being carried out on the partial replacement of the liquidity loans granted to the affi liated companies by bank loans.
One subsidiary uses forward contracts to hedge transactions in foreign currencies. The nominal value as of the balance sheet date was € 46.7 k. The fair value is recognised as a liability in the amount of € 97.8 k.
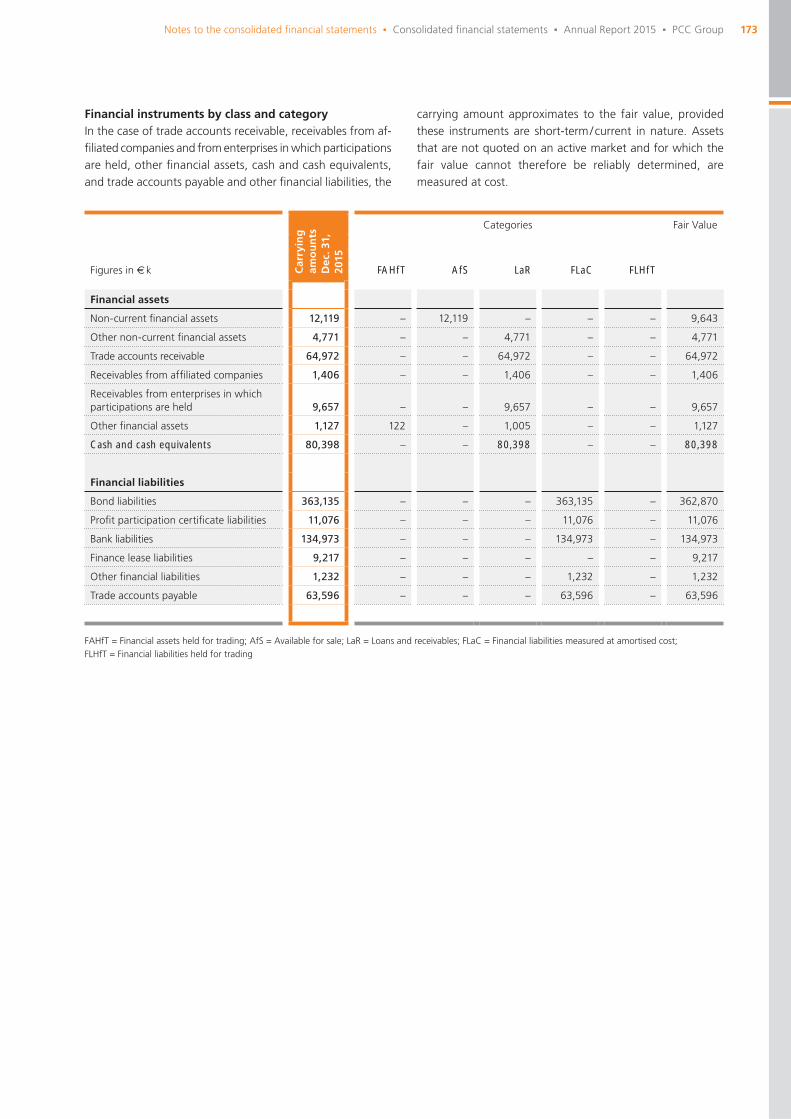
173Notes to the consolidated fi nancial statements Δ Consolidated fi nancial statements Δ Annual Report 2015 Δ PCC Group
Financial instruments by class and categoryIn the case of trade accounts receivable, receivables from af-fi liated companies and from enterprises in which participations are held, other fi nancial assets, cash and cash equivalents, and trade accounts payable and other fi nancial liabilities, the
carrying amount approximates to the fair value, provided these instruments are short-term / current in nature. Assets that are not quoted on an active market and for which the fair value cannot therefore be reliably determined, are measured at cost.
Figures in € k Car
ryin
g
amo
un
tsD
ec. 3
1,20
15
Categories Fair Value
FAHfT AfS LaR FLaC FLHfT
Financial assets
Non-current fi nancial assets 12,119 – 12,119 – – – 9,643
Other non-current fi nancial assets 4,771 – – 4,771 – – 4,771
Trade accounts receivable 64,972 – – 64,972 – – 64,972
Receivables from affi liated companies 1,406 – – 1,406 – – 1,406
Receivables from enterprises in which participations are held 9,657 – – 9,657 – – 9,657
Other fi nancial assets 1,127 122 – 1,005 – – 1,127
Cash and cash equivalents 80,398 – – 80,398 – – 80,398
Financial liabilities
Bond liabilities 363,135 – – – 363,135 – 362,870
Profi t participation certifi cate liabilities 11,076 – – – 11,076 – 11,076
Bank liabilities 134,973 – – – 134,973 – 134,973
Finance lease liabilities 9,217 – – – – – 9,217
Other fi nancial liabilities 1,232 – – – 1,232 – 1,232
Trade accounts payable 63,596 – – – 63,596 – 63,596
FAHfT = Financial assets held for trading; AfS = Available for sale; LaR = Loans and receivables; FLaC = Financial liabilities measured at amortised cost; FLHfT = Financial liabilities held for trading

174 PCC Group Δ Annual Report 2015 Δ Consolidated fi nancial statements
Figures in € k Car
ryin
g
amo
un
tsD
ec. 3
1,20
14
Categories Fair Value
FAHfT AfS LaR FLaC FLHfT
Financial assets
Non-current fi nancial assets 2,210 – 2,210 – – – 2,210
Other non-current fi nancial assets 657 – – 657 – – 657
Trade accounts receivable 69,598 – – 69,598 – – 69,598
Receivables from affi liated companies 1,750 – – 1,750 – – 1,750
Receivables from enterprises in which participations are held 9,561 – – 9,561 – – 9,561
Other fi nancial assets 558 163 – 395 – – 558
Cash and cash equivalents 46,107 – – 46,107 – – 46,107
Financial liabilities
Bond liabilities 262,991 – – – 262,991 – 263,407
Profi t participation certifi cate liabilities 11,076 – – – 11,076 – 11,076
Bank liabilities 109,080 – – – 109,080 – 106,770
Finance lease liabilities 7,880 – – – – – 7,880
Other fi nancial liabilities 954 – – – 954 – 954
Trade accounts payable 64,864 – – – 64,864 – 64,864
FAHfT = Financial assets held for trading; AfS = Available for sale; LaR = Loans and receivables; FLaC = Financial liabilities measured at amortised cost; FLHfT = Financial liabilities held for trading
Figures in € k 2015 2014
Loans and receivables (LaR) – 1,426 – 832
Available for sale (AfS) – 94 – 999
Financial instruments held for trading (FAHfT, FLHfT) – 9 – 82
Financial liabilities carried at amortised cost (FLaC) – 25,667 – 23,999
The net gains and net losses from fi nancial instruments comprise valuation results, the carrying amounts of premi-ums and discounts, the recognition and reversal of expenses arising from impairments, currency translation results, and interest, dividends and all other effects on income arising from fi nancial instruments. Under the heading “Financial instruments valued at fair value through profi t and loss”, only those results appear pertaining to such instruments that have not been designated as hedging instruments in a hedging arrangement to IAS 39. Net gains and net losses on fi nancial assets held for sale contain results arising from depreciation and amortisation, write-ups, interest, dividends and reclassifi cations of valuation effects from equity through profi t and loss on the sale of securities or investments.
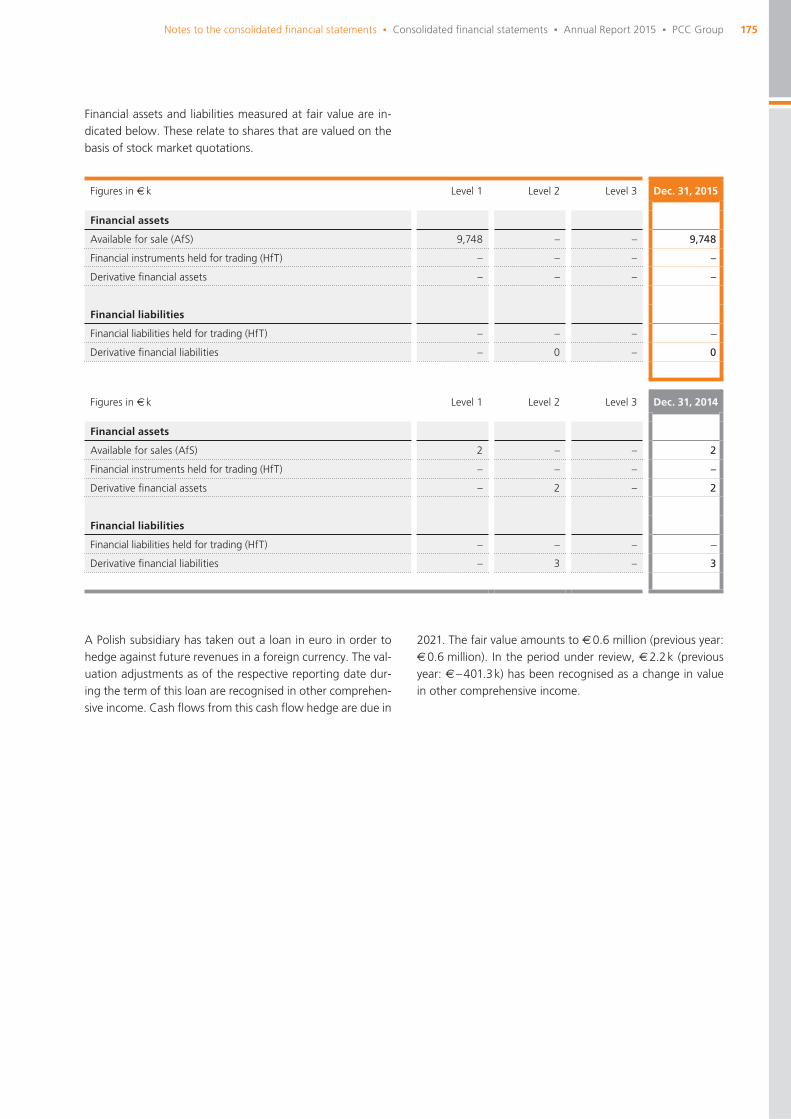
175Notes to the consolidated fi nancial statements Δ Consolidated fi nancial statements Δ Annual Report 2015 Δ PCC Group
Figures in € k Level 1 Level 2 Level 3 Dec. 31, 2015
Financial assets
Available for sale (AfS) 9,748 – – 9,748
Financial instruments held for trading (HfT) – – – –
Derivative fi nancial assets – – – –
Financial liabilities
Financial liabilities held for trading (HfT) – – – –
Derivative fi nancial liabilities – 0 – 0
Figures in € k Level 1 Level 2 Level 3 Dec. 31, 2014
Financial assets
Available for sales (AfS) 2 – – 2
Financial instruments held for trading (HfT) – – – –
Derivative fi nancial assets – 2 – 2
Financial liabilities
Financial liabilities held for trading (HfT) – – – –
Derivative fi nancial liabilities – 3 – 3
Financial assets and liabilities measured at fair value are in-dicated below. These relate to shares that are valued on the basis of stock market quotations.
A Polish subsidiary has taken out a loan in euro in order to hedge against future revenues in a foreign currency. The val-uation adjustments as of the respective reporting date dur-ing the term of this loan are recognised in other comprehen-sive income. Cash fl ows from this cash fl ow hedge are due in
2021. The fair value amounts to € 0.6 million (previous year: € 0.6 million). In the period under review, € 2.2 k (previous year: € – 401.3 k) has been recognised as a change in value in other comprehensive income.
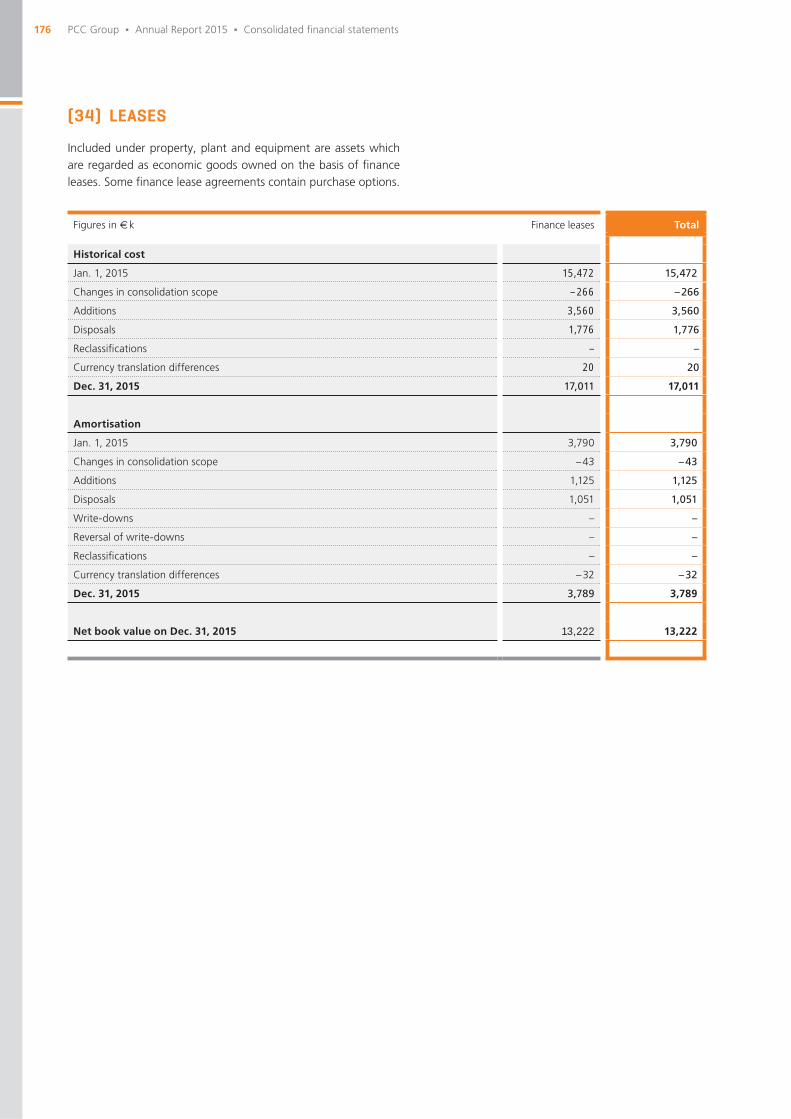
176 PCC Group Δ Annual Report 2015 Δ Consolidated fi nancial statements
(34) LEASES
Included under property, plant and equipment are assets which are regarded as economic goods owned on the basis of fi nance leases. Some fi nance lease agreements contain purchase options.
Figures in € k Finance leases Total
Historical cost
Jan. 1, 2015 15,472 15,472
Changes in consolidation scope – 266 – 266
Additions 3,560 3,560
Disposals 1,776 1,776
Reclassifi cations – –
Currency translation differences 20 20
Dec. 31, 2015 17,011 17,011
Amortisation
Jan. 1, 2015 3,790 3,790
Changes in consolidation scope – 43 – 43
Additions 1,125 1,125
Disposals 1,051 1,051
Write-downs – –
Reversal of write-downs – –
Reclassifi cations – –
Currency translation differences – 32 – 32
Dec. 31, 2015 3,789 3,789
Net book value on Dec. 31, 2015 13,222 13,222
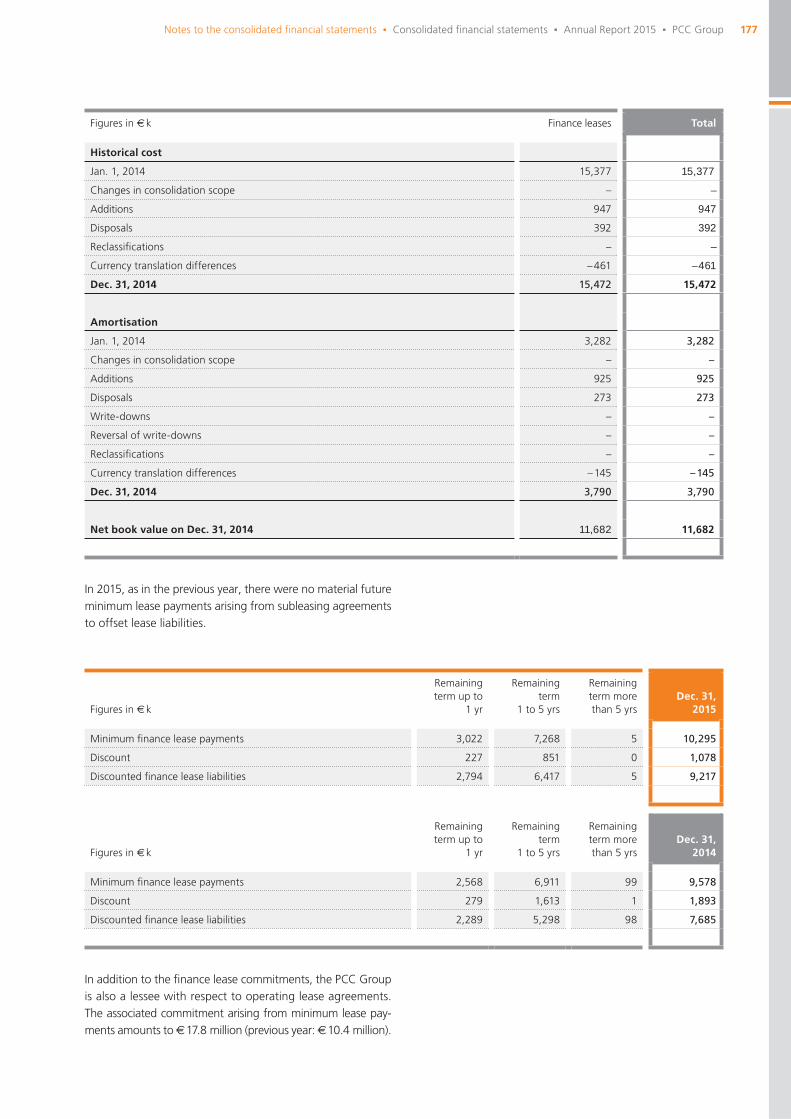
177Notes to the consolidated fi nancial statements Δ Consolidated fi nancial statements Δ Annual Report 2015 Δ PCC Group
Figures in € k Finance leases Total
Historical cost
Jan. 1, 2014 15,377 15,377
Changes in consolidation scope – –
Additions 947 947
Disposals 392 392
Reclassifi cations – –
Currency translation differences – 461 – 461
Dec. 31, 2014 15,472 15,472
Amortisation
Jan. 1, 2014 3,282 3,282
Changes in consolidation scope – –
Additions 925 925
Disposals 273 273
Write-downs – –
Reversal of write-downs – –
Reclassifi cations – –
Currency translation differences – 145 – 145
Dec. 31, 2014 3,790 3,790
Net book value on Dec. 31, 2014 11,682 11,682
Figures in € k
Remaining term up to
1 yr
Remaining term
1 to 5 yrs
Remaining term more than 5 yrs
Dec. 31, 2015
Minimum fi nance lease payments 3,022 7,268 5 10,295
Discount 227 851 0 1,078
Discounted fi nance lease liabilities 2,794 6,417 5 9,217
Figures in € k
Remaining term up to
1 yr
Remaining term
1 to 5 yrs
Remaining term more than 5 yrs
Dec. 31, 2014
Minimum fi nance lease payments 2,568 6,911 99 9,578
Discount 279 1,613 1 1,893
Discounted fi nance lease liabilities 2,289 5,298 98 7,685
In 2015, as in the previous year, there were no material future minimum lease payments arising from subleasing agreements to offset lease liabilities.
In addition to the fi nance lease commitments, the PCC Group is also a lessee with respect to operating lease agreements. The associated commitment arising from minimum lease pay-ments amounts to € 17.8 million (previous year: € 10.4 million).

178 PCC Group Δ Annual Report 2015 Δ Consolidated fi nancial statements
(35) CONTINGENT LIABILITIES AND OTHER FINANCIAL COMMITMENTS
The liabilities arising from guarantee and warranty agree-ments and other contingent liabilities are attributable to Polish subsidiaries. These are guarantees issued either to non-con-solidated companies or third parties. They relate to leases and obligations to government bodies. The PCC Group’s current estimates indicate that no claims will be made against any such guarantees or warranties.
As of December 31, 2015, there were certain commitments arising from operating leases and other fi nancial obligations. In particular, commitments arising from investment agree-ments increased signifi cantly. This rise is due, among other things, to the turnkey agreement with a German plant con-structor for the erection of the silicon metal smelting facility in Iceland. This agreement came into effect in June 2015.
Figures in € k Dec. 31, 2015 Dec. 31, 2014
Contingent liabilities arising from warranty agreements – –
Contingent liabilities arising from sureties and debt guarantees 302 28
Other contingent liabilities – 108
Total contingent liabilities 302 136
Figures in € k
Remaining term up to
1 yr
Remaining term
1 to 5 yrs
Remaining term more than 5 yrs
Dec. 31, 2015
Operating lease commitments 3,768 2,876 11,224 17,868
Investment commitments for intangible assets – – – –
Investment commitments for property, plant and equipment 91,021 60,719 – 151,740
Other commitments (incl. pending transactions) 345 – – 345
Total fi nancial commitments 95,134 63,595 11,224 169,953
Figures in € k
Remaining term up to
1 yr
Remaining term
1 to 5 yrs
Remaining term more than 5 yrs
Dec. 31, 2014
Operating lease commitments 3,748 3,925 2,706 10,378
Investment commitments for intangible assets – – – –
Investment commitments for property, plant and equipment 57,226 – – 57,226
Other commitments (incl. pending transactions) 45 – – 45
Total fi nancial commitments 61,018 3,925 2,706 67,649
There were no other major fi nancial commitments in 2015 to entities not included in the consolidated fi nancial state-ments.
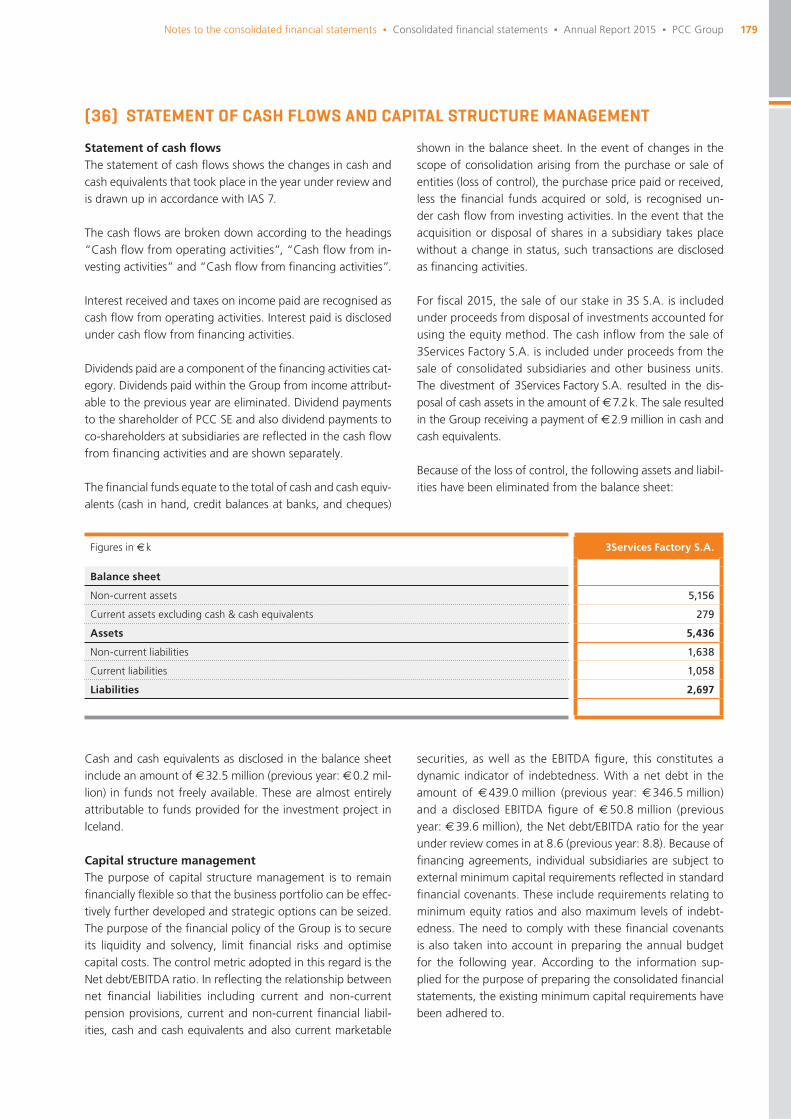
179Notes to the consolidated fi nancial statements Δ Consolidated fi nancial statements Δ Annual Report 2015 Δ PCC Group
(36) STATEMENT OF CASH FLOWS AND CAPITAL STRUCTURE MANAGEMENT
Statement of cash fl owsThe statement of cash fl ows shows the changes in cash and cash equivalents that took place in the year under review and is drawn up in accordance with IAS 7.
The cash fl ows are broken down according to the headings “Cash fl ow from operating activities”, “Cash fl ow from in-vesting activities” and “Cash fl ow from fi nancing activities”.
Interest received and taxes on income paid are recognised as cash fl ow from operating activities. Interest paid is disclosed under cash fl ow from fi nancing activities.
Dividends paid are a component of the fi nancing activities cat-egory. Dividends paid within the Group from income attribut-able to the previous year are eliminated. Dividend payments to the shareholder of PCC SE and also dividend payments to co-shareholders at subsidiaries are refl ected in the cash fl ow from fi nancing activities and are shown separately.
The fi nancial funds equate to the total of cash and cash equiv-alents (cash in hand, credit balances at banks, and cheques)
shown in the balance sheet. In the event of changes in the scope of consolidation arising from the purchase or sale of entities (loss of control), the purchase price paid or received, less the fi nancial funds acquired or sold, is recognised un-der cash fl ow from investing activities. In the event that the acquisition or disposal of shares in a subsidiary takes place without a change in status, such transactions are disclosed as fi nancing activities.
For fi scal 2015, the sale of our stake in 3S S.A. is included under proceeds from disposal of investments accounted for using the equity method. The cash infl ow from the sale of 3Services Factory S.A. is included under proceeds from the sale of consolidated subsidiaries and other business units. The divestment of 3Services Factory S.A. resulted in the dis-posal of cash assets in the amount of € 7.2 k. The sale resulted in the Group receiving a payment of € 2.9 million in cash and cash equivalents.
Because of the loss of control, the following assets and liabil-ities have been eliminated from the balance sheet:
Figures in € k 3Services Factory S.A.
Balance sheet
Non-current assets 5,156
Current assets excluding cash & cash equivalents 279
Assets 5,436
Non-current liabilities 1,638
Current liabilities 1,058
Liabilities 2,697
Cash and cash equivalents as disclosed in the balance sheet include an amount of € 32.5 million (previous year: € 0.2 mil-lion) in funds not freely available. These are almost entirely attributable to funds provided for the investment project in Iceland.
Capital structure management The purpose of capital structure management is to remain fi nancially fl exible so that the business portfolio can be effec-tively further developed and strategic options can be seized. The purpose of the fi nancial policy of the Group is to secure its liquidity and solvency, limit fi nancial risks and optimise capital costs. The control metric adopted in this regard is the Net debt/EBITDA ratio. In refl ecting the relationship between net fi nancial liabilities including current and non-current pension provisions, current and non-current fi nancial liabil-ities, cash and cash equivalents and also current marketable
securities, as well as the EBITDA fi gure, this constitutes a dynamic indicator of indebtedness. With a net debt in the amount of € 439.0 million (previous year: € 346.5 million) and a disclosed EBITDA fi gure of € 50.8 million (previous year: € 39.6 million), the Net debt/EBITDA ratio for the year under review comes in at 8.6 (previous year: 8.8). Because of fi nancing agreements, individual subsidiaries are subject to external minimum capital requirements refl ected in standard fi nancial covenants. These include requirements relating to minimum equity ratios and also maximum levels of indebt-edness. The need to comply with these fi nancial covenants is also taken into account in preparing the annual budget for the following year. According to the information sup-plied for the purpose of preparing the consolidated fi nancial statements, the existing minimum capital requirements have been adhered to.

180 PCC Group Δ Annual Report 2015 Δ Consolidated fi nancial statements
OTHER DISCLOSURES
(37) RELATED PARTY DISCLOSURES
Balances and business transactions between PCC SE and in-corporated subsidiaries regarded as related parties are elimi-nated as part of the consolidation process and have not been included in these notes and disclosures. Details regarding the business transactions between the PCC Group and other re-lated parties are indicated in the following.
Other receivables and other assets include a claim against the sole shareholder PCC SE in the amount of € 474.8 k (pre-vious year: € 316 k). This receivable is short-term and, as in the previous year, carries an interest rate of 6.0 % p.a.
As of the balance sheet date, December 31, 2015, the PCC Group has claims against affi liated entities not included in the consolidated fi nancial statements in an amount total-ling € 1.5 million (previous year: € 1.8 million). These relate to loans, trade accounts receivable and current loan receiva-bles. The Group-internal fi nancing arrangements carry inter-est rates ranging between 4.0 % p.a. and 8.0 % p.a.
For compensation to Board members, please refer to the notes under the section Corporate Bodies (38).
For compensation of the Administrative Board, again please refer to the notes under Corporate Bodies (38).
Essentially, sales made to related parties, or purchases from related parties, are transacted at prevailing market prices. Open positions as of the end of the fi scal year are not se-cured, are non-interest-bearing and will be settled in cash. There are no guarantees covering receivables from related parties or payables to related parties. As in the previous year, no value adjustment on receivables from related parties was necessary in fi scal 2015.
Claims against the affi liated company OOO DME Aerosol amounted to € 649 k as of the balance sheet date (previous year: € 595 k) and relate to loan receivables. As in the pre-vious year, these receivables bear an interest rate of 10.0 % p.a. The loans were granted for the development and con-struction of a dimethyl ether plant on the production site of the joint venture partner. In all, the joint venture com-pany has been granted loans by PCC SE in the amount of € 3.5 million which can be drawn down as the project pro-ceeds through various defi ned milestones.
Figures in € k 2015 2014
Sales with related parties
Non-consolidated entities 2,466 4,145
Joint ventures – –
Associated companies – –
Receivables from related parties
Non-consolidated entities 1,468 1,812
Joint ventures 649 –
Associated companies – 29
Liabilities to related parties
Non-consolidated entities 487 766
Joint ventures – –
Associated companies – –
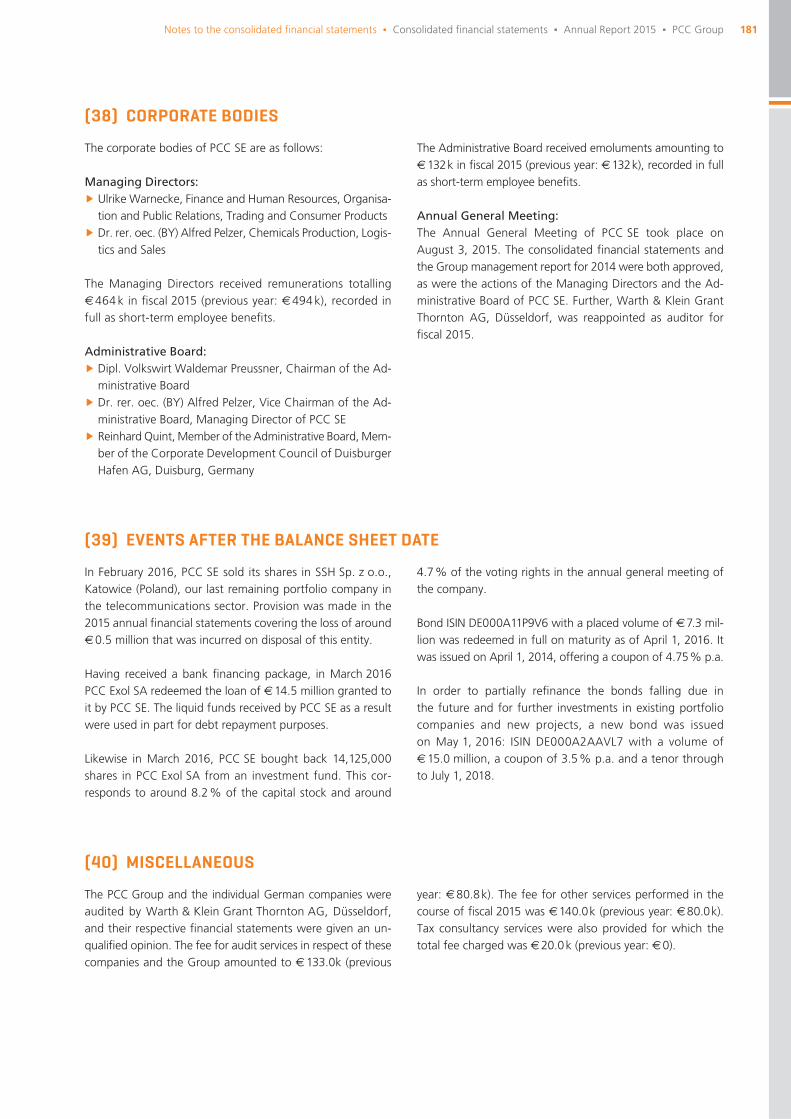
181Notes to the consolidated fi nancial statements Δ Consolidated fi nancial statements Δ Annual Report 2015 Δ PCC Group
(38) CORPORATE BODIES
The corporate bodies of PCC SE are as follows:
Managing Directors:
∂ Ulrike Warnecke, Finance and Human Resources, Organisa-tion and Public Relations, Trading and Consumer Products
∂ Dr. rer. oec. (BY) Alfred Pelzer, Chemicals Production, Logis-tics and Sales
The Managing Directors received remunerations totalling € 464 k in fi scal 2015 (previous year: € 494 k), recorded in full as short-term employee benefi ts.
Administrative Board:
∂ Dipl. Volkswirt Waldemar Preussner, Chairman of the Ad-ministrative Board
∂ Dr. rer. oec. (BY) Alfred Pelzer, Vice Chairman of the Ad-ministrative Board, Managing Director of PCC SE
∂ Reinhard Quint, Member of the Administrative Board, Mem-ber of the Corporate Development Council of Duisburger Hafen AG, Duisburg, Germany
The Administrative Board received emoluments amounting to € 132 k in fi scal 2015 (previous year: € 132 k), recorded in full as short-term employee benefi ts.
Annual General Meeting:The Annual General Meeting of PCC SE took place on August 3, 2015. The consolidated fi nancial statements and the Group management report for 2014 were both approved, as were the actions of the Managing Directors and the Ad-ministrative Board of PCC SE. Further, Warth & Klein Grant Thornton AG, Düsseldorf, was reappointed as auditor for fi scal 2015.
(39) EVENTS AFTER THE BALANCE SHEET DATE
In February 2016, PCC SE sold its shares in SSH Sp. z o.o., Katowice (Poland), our last remaining portfolio company in the telecommunications sector. Provision was made in the 2015 annual fi nancial statements covering the loss of around € 0.5 million that was incurred on disposal of this entity.
Having received a bank fi nancing package, in March 2016 PCC Exol SA redeemed the loan of € 14.5 million granted to it by PCC SE. The liquid funds received by PCC SE as a result were used in part for debt repayment purposes.
Likewise in March 2016, PCC SE bought back 14,125,000 shares in PCC Exol SA from an investment fund. This cor-responds to around 8.2 % of the capital stock and around
4.7 % of the voting rights in the annual general meeting of the company.
Bond ISIN DE000A11P9V6 with a placed volume of € 7.3 mil-lion was redeemed in full on maturity as of April 1, 2016. It was issued on April 1, 2014, offering a coupon of 4.75 % p.a.
In order to partially refi nance the bonds falling due in the future and for further investments in existing portfolio companies and new projects, a new bond was issued on May 1, 2016: ISIN DE000A2AAVL7 with a volume of € 15.0 million, a coupon of 3.5 % p.a. and a tenor through to July 1, 2018.
(40) MISCELLANEOUS
The PCC Group and the individual German companies were audited by Warth & Klein Grant Thornton AG, Düsseldorf, and their respective fi nancial statements were given an un-qualifi ed opinion. The fee for audit services in respect of these companies and the Group amounted to € 133.0k (previous
year: € 80.8 k). The fee for other services performed in the course of fi scal 2015 was € 140.0 k (previous year: € 80.0 k). Tax consultancy services were also provided for which the total fee charged was € 20.0 k (previous year: € 0).
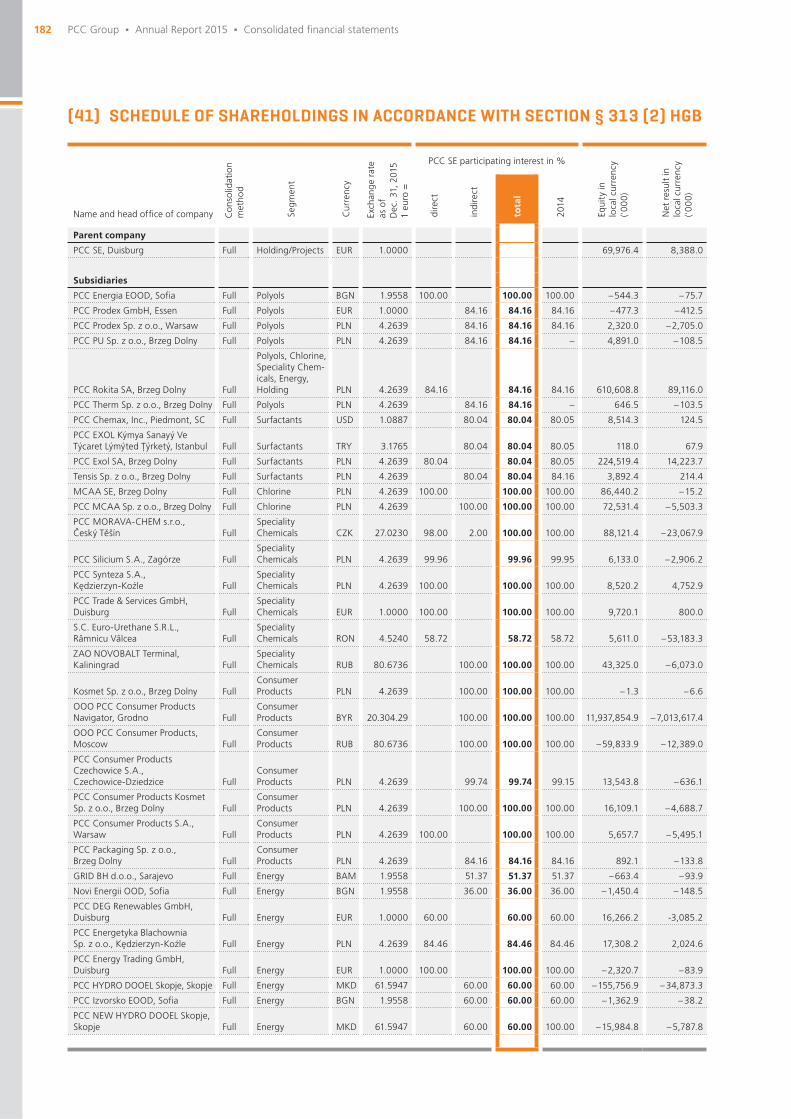
182 PCC Group Δ Annual Report 2015 Δ Consolidated fi nancial statements
(41) SCHEDULE OF SHAREHOLDINGS IN ACCORDANCE WITH SECTION § 313 (2) HGB
Con
solid
atio
n m
etho
d
Exch
ang
e ra
teas
of
Dec
. 31,
201
51
euro
=
PCC SE participating interest in %
Equi
ty in
lo
cal c
urre
ncy
('00
0)
Net
res
ult
inlo
cal c
urre
ncy
('00
0)
Name and head offi ce of company Segm
ent
Cur
renc
y
dire
ct
indi
rect
tota
l
2014
Parent company
PCC SE, Duisburg Full Holding/Projects EUR 1.0000 69,976.4 8,388.0
Subsidiaries
PCC Energia EOOD, Sofi a Full Polyols BGN 1.9558 100.00 100.00 100.00 – 544.3 – 75.7
PCC Prodex GmbH, Essen Full Polyols EUR 1.0000 84.16 84.16 84.16 – 477.3 – 412.5
PCC Prodex Sp. z o.o., Warsaw Full Polyols PLN 4.2639 84.16 84.16 84.16 2,320.0 – 2,705.0
PCC PU Sp. z o.o., Brzeg Dolny Full Polyols PLN 4.2639 84.16 84.16 – 4,891.0 – 108.5
PCC Rokita SA, Brzeg Dolny Full
Polyols, Chlorine, Speciality Chem-icals, Energy, Holding PLN 4.2639 84.16 84.16 84.16 610,608.8 89,116.0
PCC Therm Sp. z o.o., Brzeg Dolny Full Polyols PLN 4.2639 84.16 84.16 – 646.5 – 103.5
PCC Chemax, Inc., Piedmont, SC Full Surfactants USD 1.0887 80.04 80.04 80.05 8,514.3 124.5
PCC EXOL Kýmya Sanayý Ve Týcaret Lýmýted Ţýrketý, Istanbul Full Surfactants TRY 3.1765 80.04 80.04 80.05 118.0 67.9
PCC Exol SA, Brzeg Dolny Full Surfactants PLN 4.2639 80.04 80.04 80.05 224,519.4 14,223.7
Tensis Sp. z o.o., Brzeg Dolny Full Surfactants PLN 4.2639 80.04 80.04 84.16 3,892.4 214.4
MCAA SE, Brzeg Dolny Full Chlorine PLN 4.2639 100.00 100.00 100.00 86,440.2 – 15.2
PCC MCAA Sp. z o.o., Brzeg Dolny Full Chlorine PLN 4.2639 100.00 100.00 100.00 72,531.4 – 5,503.3
PCC MORAVA-CHEM s.r.o., Český Těšín Full
Speciality Chemicals CZK 27.0230 98.00 2.00 100.00 100.00 88,121.4 – 23,067.9
PCC Silicium S.A., Zagórze FullSpecialityChemicals PLN 4.2639 99.96 99.96 99.95 6,133.0 – 2,906.2
PCC Synteza S.A., Kędzierzyn-Koźle Full
SpecialityChemicals PLN 4.2639 100.00 100.00 100.00 8,520.2 4,752.9
PCC Trade & Services GmbH, Duisburg Full
Speciality Chemicals EUR 1.0000 100.00 100.00 100.00 9,720.1 800.0
S.C. Euro-Urethane S.R.L., Râmnicu Vâlcea Full
Speciality Chemicals RON 4.5240 58.72 58.72 58.72 5,611.0 – 53,183.3
ZAO NOVOBALT Terminal, Kaliningrad Full
Speciality Chemicals RUB 80.6736 100.00 100.00 100.00 43,325.0 – 6,073.0
Kosmet Sp. z o.o., Brzeg Dolny FullConsumer Products PLN 4.2639 100.00 100.00 100.00 – 1.3 – 6.6
OOO PCC Consumer Products Navigator, Grodno Full
Consumer Products BYR 20.304.29 100.00 100.00 100.00 11,937,854.9 – 7,013,617.4
OOO PCC Consumer Products, Moscow Full
Consumer Products RUB 80.6736 100.00 100.00 100.00 – 59,833.9 – 12,389.0
PCC Consumer Products Czechowice S.A., Czechowice-Dziedzice Full
ConsumerProducts PLN 4.2639 99.74 99.74 99.15 13,543.8 – 636.1
PCC Consumer Products Kosmet Sp. z o.o., Brzeg Dolny Full
Consumer Products PLN 4.2639 100.00 100.00 100.00 16,109.1 – 4,688.7
PCC Consumer Products S.A., Warsaw Full
Consumer Products PLN 4.2639 100.00 100.00 100.00 5,657.7 – 5,495.1
PCC Packaging Sp. z o.o., Brzeg Dolny Full
Consumer Products PLN 4.2639 84.16 84.16 84.16 892.1 – 133.8
GRID BH d.o.o., Sarajevo Full Energy BAM 1.9558 51.37 51.37 51.37 – 663.4 – 93.9
Novi Energii OOD, Sofi a Full Energy BGN 1.9558 36.00 36.00 36.00 – 1,450.4 – 148.5
PCC DEG Renewables GmbH, Duisburg Full Energy EUR 1.0000 60.00 60.00 60.00 16,266.2 -3,085.2
PCC Energetyka Blachownia Sp. z o.o., Kędzierzyn-Koźle Full Energy PLN 4.2639 84.46 84.46 84.46 17,308.2 2,024.6
PCC Energy Trading GmbH, Duisburg Full Energy EUR 1.0000 100.00 100.00 100.00 – 2,320.7 – 83.9
PCC HYDRO DOOEL Skopje, Skopje Full Energy MKD 61.5947 60.00 60.00 60.00 – 155,756.9 – 34,873.3
PCC Izvorsko EOOD, Sofi a Full Energy BGN 1.9558 60.00 60.00 60.00 – 1,362.9 – 38.2
PCC NEW HYDRO DOOEL Skopje, Skopje Full Energy MKD 61.5947 60.00 60.00 100.00 – 15,984.8 – 5,787.8
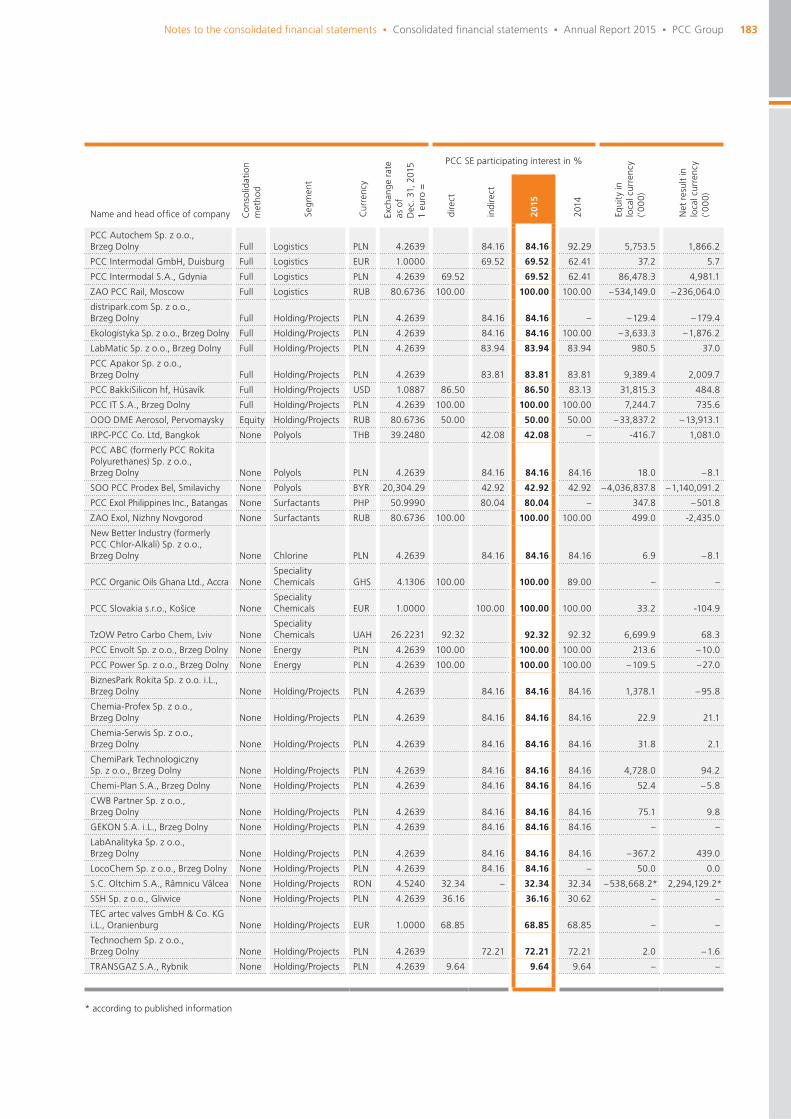
183Notes to the consolidated fi nancial statements Δ Consolidated fi nancial statements Δ Annual Report 2015 Δ PCC Group
Con
solid
atio
n m
etho
d
Exch
ang
e ra
teas
of
Dec
. 31,
201
51
euro
=
PCC SE participating interest in %
Equi
ty in
lo
cal c
urre
ncy
('00
0)
Net
res
ult
inlo
cal c
urre
ncy
('00
0)
Name and head offi ce of company Segm
ent
Cur
renc
y
dire
ct
indi
rect
2015
2014
PCC Autochem Sp. z o.o., Brzeg Dolny Full Logistics PLN 4.2639 84.16 84.16 92.29 5,753.5 1,866.2
PCC Intermodal GmbH, Duisburg Full Logistics EUR 1.0000 69.52 69.52 62.41 37.2 5.7
PCC Intermodal S.A., Gdynia Full Logistics PLN 4.2639 69.52 69.52 62.41 86,478.3 4,981.1
ZAO PCC Rail, Moscow Full Logistics RUB 80.6736 100.00 100.00 100.00 – 534,149.0 – 236,064.0
distripark.com Sp. z o.o., Brzeg Dolny Full Holding/Projects PLN 4.2639 84.16 84.16 – – 129.4 – 179.4
Ekologistyka Sp. z o.o., Brzeg Dolny Full Holding/Projects PLN 4.2639 84.16 84.16 100.00 – 3,633.3 – 1,876.2
LabMatic Sp. z o.o., Brzeg Dolny Full Holding/Projects PLN 4.2639 83.94 83.94 83.94 980.5 37.0
PCC Apakor Sp. z o.o., Brzeg Dolny Full Holding/Projects PLN 4.2639 83.81 83.81 83.81 9,389.4 2,009.7
PCC BakkiSilicon hf, Húsavík Full Holding/Projects USD 1.0887 86.50 86.50 83.13 31,815.3 484.8
PCC IT S.A., Brzeg Dolny Full Holding/Projects PLN 4.2639 100.00 100.00 100.00 7,244.7 735.6
OOO DME Aerosol, Pervomaysky Equity Holding/Projects RUB 80.6736 50.00 50.00 50.00 – 33,837.2 – 13,913.1
IRPC-PCC Co. Ltd, Bangkok None Polyols THB 39.2480 42.08 42.08 – -416.7 1,081.0
PCC ABC (formerly PCC Rokita Polyurethanes) Sp. z o.o., Brzeg Dolny None Polyols PLN 4.2639 84.16 84.16 84.16 18.0 – 8.1
SOO PCC Prodex Bel, Smilavichy None Polyols BYR 20,304.29 42.92 42.92 42.92 – 4,036,837.8 – 1,140,091.2
PCC Exol Philippines Inc., Batangas None Surfactants PHP 50.9990 80.04 80.04 – 347.8 – 501.8
ZAO Exol, Nizhny Novgorod None Surfactants RUB 80.6736 100.00 100.00 100.00 499.0 -2,435.0
New Better Industry (formerly PCC Chlor-Alkali) Sp. z o.o., Brzeg Dolny None Chlorine PLN 4.2639 84.16 84.16 84.16 6.9 – 8.1
PCC Organic Oils Ghana Ltd., Accra NoneSpeciality Chemicals GHS 4.1306 100.00 100.00 89.00 – –
PCC Slovakia s.r.o., Košice NoneSpeciality Chemicals EUR 1.0000 100.00 100.00 100.00 33.2 -104.9
TzOW Petro Carbo Chem, Lviv NoneSpeciality Chemicals UAH 26.2231 92.32 92.32 92.32 6,699.9 68.3
PCC Envolt Sp. z o.o., Brzeg Dolny None Energy PLN 4.2639 100.00 100.00 100.00 213.6 – 10.0
PCC Power Sp. z o.o., Brzeg Dolny None Energy PLN 4.2639 100.00 100.00 100.00 – 109.5 – 27.0
BiznesPark Rokita Sp. z o.o. i.L., Brzeg Dolny None Holding/Projects PLN 4.2639 84.16 84.16 84.16 1,378.1 – 95.8
Chemia-Profex Sp. z o.o., Brzeg Dolny None Holding/Projects PLN 4.2639 84.16 84.16 84.16 22.9 21.1
Chemia-Serwis Sp. z o.o., Brzeg Dolny None Holding/Projects PLN 4.2639 84.16 84.16 84.16 31.8 2.1
ChemiPark Technologiczny Sp. z o.o., Brzeg Dolny None Holding/Projects PLN 4.2639 84.16 84.16 84.16 4,728.0 94.2
Chemi-Plan S.A., Brzeg Dolny None Holding/Projects PLN 4.2639 84.16 84.16 84.16 52.4 – 5.8
CWB Partner Sp. z o.o., Brzeg Dolny None Holding/Projects PLN 4.2639 84.16 84.16 84.16 75.1 9.8
GEKON S.A. i.L., Brzeg Dolny None Holding/Projects PLN 4.2639 84.16 84.16 84.16 – –
LabAnalityka Sp. z o.o., Brzeg Dolny None Holding/Projects PLN 4.2639 84.16 84.16 84.16 – 367.2 439.0
LocoChem Sp. z o.o., Brzeg Dolny None Holding/Projects PLN 4.2639 84.16 84.16 – 50.0 0.0
S.C. Oltchim S.A., Râmnicu Vâlcea None Holding/Projects RON 4.5240 32.34 – 32.34 32.34 – 538,668.2* 2,294,129.2*
SSH Sp. z o.o., Gliwice None Holding/Projects PLN 4.2639 36.16 36.16 30.62 – –
TEC artec valves GmbH & Co. KG i.L., Oranienburg None Holding/Projects EUR 1.0000 68.85 68.85 68.85 – –
Technochem Sp. z o.o., Brzeg Dolny None Holding/Projects PLN 4.2639 72.21 72.21 72.21 2.0 – 1.6
TRANSGAZ S.A., Rybnik None Holding/Projects PLN 4.2639 9.64 9.64 9.64 – –
* according to published information
184 PCC Group Δ Annual Report 2015 Δ Consolidated fi nancial statements
Duisburg, May 28, 2016
PCC SE
Ulrike Warnecke Managing Director
Dr. rer. oec. (BY) Alfred PelzerManaging Director

185Notes to the consolidated fi nancial statements Δ Consolidated fi nancial statements Δ Annual Report 2015 Δ PCC Group
186 PCC Group Δ Annual Report 2015
GLOSSARY
AdditivesAdditives are substances which, incorporated in formula-tions in very small quantities, optimise the properties and performance profi le of products such as concrete, paints and plastics and / or facilitate their manufacture and processing.
BetainesAmphoteric surfactants used in cosmetic products such as hair shampoos to optimise the skin compatibility of the anionic surfactants responsible for the cleaning effect of such products.
Chlor-alkali electrolysisElectrochemical process in which the base chemicals chlo-rine, caustic soda (sodium hydroxide) and hydrogen are generated.
CHPCombined Heat and Power – used in reference to power plants designed to supply both electrical and thermal energy in a process known as “cogeneration”. More fuel-effi cient due to utilisation of otherwise wasted heat. Produces less CO2 (greenhouse gas) per unit energy output, therefore re-garded as more climate-friendly.
Climate-protection projectIn keeping with the provisions of the Kyoto Protocol, a climate- protection project contributes to the reduction of greenhouse gases. Through adoption of a “clean development mecha-nism”, participating developing countries are also to be assist-ed not only in reducing their emissions but also generally in their pursuit of a sustainable mode of development. The small hydropower plant projects being implemented by PCC in the Balkans constitute an example of this kind of assistance.
CSRAbbreviation for Corporate Social Responsibility, referring to the self-regulatory, responsible attitude of businesses towards all stakeholders and the social and ecological environment.
EBITAbbreviation for Earnings Before Interest and Taxes; EBITDA less depreciation and amortisation.
EBITDAAbbreviation for Earnings Before Interest, Taxes, Depreciation and Amortisation. EBTAbbreviation for Earnings Before Taxes; EBIT less interest and other fi nancial items.
EthoxylationProcess for the manufacture of non-ionic surfactants (ethoxy-lates; surface-active substances), which are major constituents of, in particular, detergents and cleaning products.
FSC® Abbreviation for Forest Stewardship Council; an independent, non-profi t, non-governmental organisation which is repre-sented in 80 countries. The mission of the FSC® is to promote the environmentally sound, socially responsible and economi-cally viable management of forests.
Global Compact of the United NationsThe UN Global Compact is the world’s largest initiative in the fi eld of Corporate Social Responsibility ( CSR). It is a princi-ple-based framework for businesses, stating ten principles in the areas of human rights, labour, the environment and anti-corruption.
Hydroxyl groupsFunctional groups of alcohols and phenols.
Intermodal transportCombined transport (CT) involving the conveyance of goods, primarily in containers, which are transferred one or more times between different modes of carriage such as train, truck and ship.
IPOAbbreviation for Initial Public Offering, which relates to the fi rst-time placement of a company’s shares on an organised capital market.
IsocyanatesHighly reactive chemical esters of isocyanic acid. Compounds that contain two isocyanate groups are termed diisocyanates, and these react with polyols to create polyurethanes ( PU foams).

187Glossary Δ Annual Report 2015 Δ PCC Group
MCAAAbbreviation for monochloroacetic acid, a product used primarily in the food and beverage industry, with further applications in the manufacture of medicines, personal care products, cosmetics, dyestuffs, and plant protection products. Membrane processModern process in chlor-alkali electrolysis used in the man-ufacture of chlorine. The membrane process is more ener-gy-effi cient than, for example, the amalgam process, and functions without the use of mercury.
Mezzanine capitalGeneral term covering forms of fi nance which, due to their legal and economic make-up, represent a mix of equity and debt capital.
MW (megawatt)Unit of measurement for electric power:1 megawatt = 103 kilowatts1 gigawatt = 106 kilowatts1 terawatt = 109 kilowatts
Phosphorus derivativesSubstances manufactured from phosphorus, such as fl ame retardants and plasticisers.
PU foamsPU is the abbreviation for polyurethane (also abbreviated PUR), of which polyols are a major constituent.
REACHEuropean regulation governing the registration, evaluation, authorisation and restriction of chemicals.
Renewable energyAlso known as regenerative energy; term given to energy from sustainable sources such as solar energy, biomass, hydroelectric power and wind power.
Responsible Care®Global initiative of the chemicals industry aimed at continu-ously improving sustainability in terms of environmental pro-tection, health and safety.
ROCEReturn On Capital Employed; EBIT ÷ [Average equity + Average interest-bearing borrowings incl. pension provisions].
SELatin abbreviation: Societas Europaea; English: European Company. SegmentIntroduced on January 1, 2013 as a basic management unit of PCC (conversion to segment structure as a refi nement of the former divisional structure). The Group is divided into eight segments: Polyols, Surfactants, Chlorine, Speciality Chemicals, Consumer Products, Energy, Logistics, and Holding/Projects.
SulphonationProcess for the manufacture of anionic surfactants (sulpho-nates; surface-active substances) which, because of their dermatological compatibility, are widely used in cosmetics and laundry / home care detergents.
SurfactantsSurface-active substances; ingredients in cosmetics, deter-gents, cleaning and cleansing products ( Ethoxylation, Sulphonation).
TEUAbbreviation for Twenty-foot Equivalent Unit – unit of meas-urement for ISO standard containers; 1 TEU corresponds to a 20 foot ISO container.
Value chainThe sequential set of primary and support activities in a pro-duction process that an enterprise performs to turn inputs, e.g. raw materials, into value-added outputs, e.g. fi nished products, for its external customers.
188
CREDITS
Published byPCC SEMoerser Straße 14947198 DuisburgGermany
ContactPublic RelationsPhone +49 (0)2066 2019-35Fax +49 (0)2066 [email protected]
Conception and editingSusanne Biskamp, PCC SE (Germany)
Design and productionKaiserberg Kommunikation, Duisburg
English translationPaul Knighton, Cambridge (UK)
Photos (l. a.)∂ Sebastian Borowski, Wrocław (Poland)∂ Ryszard Grzelak, Kutno (Poland) ∂ Incydent, Piotr Deszkiewicz, Warsaw (Poland)∂ Ulli Steinmetz Fotodesign, Düsseldorf (Germany)∂ Pétur Jónasson, Húsavík (Iceland)∂ Ivica Gjurovski, Skopje (Rep. of Macedonia)∂ Somchai Umnuaywerojn, Bangkok (Thailand)
Printed byDruckerei und Verlag Peter Pomp GmbH, Bottrop (Germany)
Image rightsPCC SE
PCC SEDuisburg, June 2016
This Annual Report is available in its original German versionand as an English translation.
Both versions can be downloaded from www.pcc.eu.
This report is printed on FSC®-certifi ed natural paper.
PCC Group Δ Annual Report 2015
189Credits Δ Annual Report 2015 Δ PCC Group
FORWARD-LOOKING STATEMENTS
This Annual Report contains forward-looking statements which are based on the current estimates and assumptions made by the management with respect to future develop-ments. The accuracy of such statements is subject to risks and uncertainties that lie outside the control and forecasting capability of PCC SE. Examples include changes in the market environment and underlying economic conditions, the behav-iour of other market participants, the success with which new acquisitions can be integrated, the realisation of anticipated synergy effects, and the actions of governmental agencies. Should such factors of uncertainty or imponderables come into play, or if the assumptions upon which these statements are based prove to be incorrect, the ensuing events could differ materially from those explicitly indicated, implied in or inferred from these statements. PCC SE neither plans nor undertakes to update any forward-looking statements in respect of developments or events occurring in the future.
TECHNICAL DISCREPANCIES
For technical reasons (e.g. arising from the conversion of electronic formats), differences may occur between the in-formation provided in this Annual Report and that contained in the accounting documents submitted for publication in the Federal gazette (Bundesanzeiger). In such cases, the version appearing in the Federal gazette is authoritative.
190
PCC ON THE INTERNET
www.pcc.euwww.pcc-fi nancialdata.eu
PCC. Direktinvestwww.pcc-direktinvest.eu
Chemicalswww.products.pcc.euwww.crossin.pcc.euwww.distripark.comwww.chemproducts.comwww.pcc.rokita.plwww.pcc-exol.euwww.ipoltec.euwww.pcc-prodex.euwww.pcc-chemax.comwww.tensis.plwww.mcaase.euwww.pccsynteza.plwww.pccmorava-chem.czwww.kosmet.com.plwww.pcc-cp.euwww.navisan.bywww.matches.com.plwww.pcc-silicium.pl
Energywww.pcc-hydro-mk.comwww.zeblach.pl
Logisticswww.pcc-intermodal.plwww.pcc-autochem.euwww.pcc.ru
Holdingwww.pccit.plwww.cwbpartner.plwww.pcc.iswww.apakor.euwww.labmatic.com.pl
PCC Group Δ Annual Report 2015
PCC. Creating value together
www.pcc.eu