Raman bands
2
1/2 Raman Bands RAMAN DATA AND ANALYSIS Raman Spectroscopy for Analysis and Monitoring The Raman scattering technique is a vibrational molecular spectroscopy which derives from an inelastic light scattering process. With Raman spectroscopy, a laser photon is scattered by a sample molecule and loses ( or gains) energy during the process. The amount of energy lost is seen as a change in energy (wavelength) of the irradiating photon. This energy loss is characteristic for a particular bond in the molecule. Raman can best be thought of as producing a precise spectral fingerprint, unique to a molecule or indeed and individual molecular structure. In this respect it is similar to the more commonly found FT-IR spectroscopy. However, unlike FT-IR, there are a distinct number of advantages when using Raman. • Raman can be used to analyse aqueous solutions since it does not suffer from the large water absorption effects found with FT techniques. • The intensity of spectral features in solution is directly proportional to the concentration of the particular species • Raman spectra are generally robust to temperature changes • Raman requires little or no sample preparation. It does not need the use of Nujol, or KBr matrices and is largely unaffected y sample cell materials such as glass. • The use of a Raman microscope such as the LabRAM provides very high level of spatial resolution and depth discrimination, not found with the FT methods of analysis These advantages and its highly specific nature, mean that Raman has become a very powerful tool for analysis and chemical monitoring. Depending upon instrumentation, it is a technique which can be used for the analysis of solids, liquids and solutions and can even provide information on physical characteristics such as crystalline phase and orientation, polymorphic forms, and intrinsic stress. Functional Group/ Vibration Region Raman InfraRed Lattice vibrations in crystals, LA modes 10 - 200 cm -1 strong strong δ(CC) aliphatic chains 250 - 400 cm -1 strong weak υ(Se-Se) 290 -330 cm -1 strong weak υ(S-S) 430 -550 cm -1 strong weak υ(Si-O-Si) 450 -550 cm -1 strong weak υ(Xmetal-O) 150-450 cm -1 strong med-weak υ(C-I) 480 - 660 cm -1 strong strong υ(C-Br) 500 - 700 cm -1 strong strong υ(C-Cl) 550 - 800 cm -1 strong strong υ(C-S) aliphatic 630 - 790 cm -1 strong medium υ(C-S) aromatic 1080 - 1100 cm -1 strong medium υ(O-O) 845 -900 cm -1 strong weak υ(C-O-C) 800 -970 cm -1 medium weak υ(C-O-C) asym 1060 - 1150 cm -1 weak strong
Transcript of Raman bands
8/7/2019 Raman bands
http://slidepdf.com/reader/full/raman-bands 1/2
1/2
Raman Bands
RAMAN DATA AND ANALYSIS
Raman Spectroscopy for Analysis and Monitoring
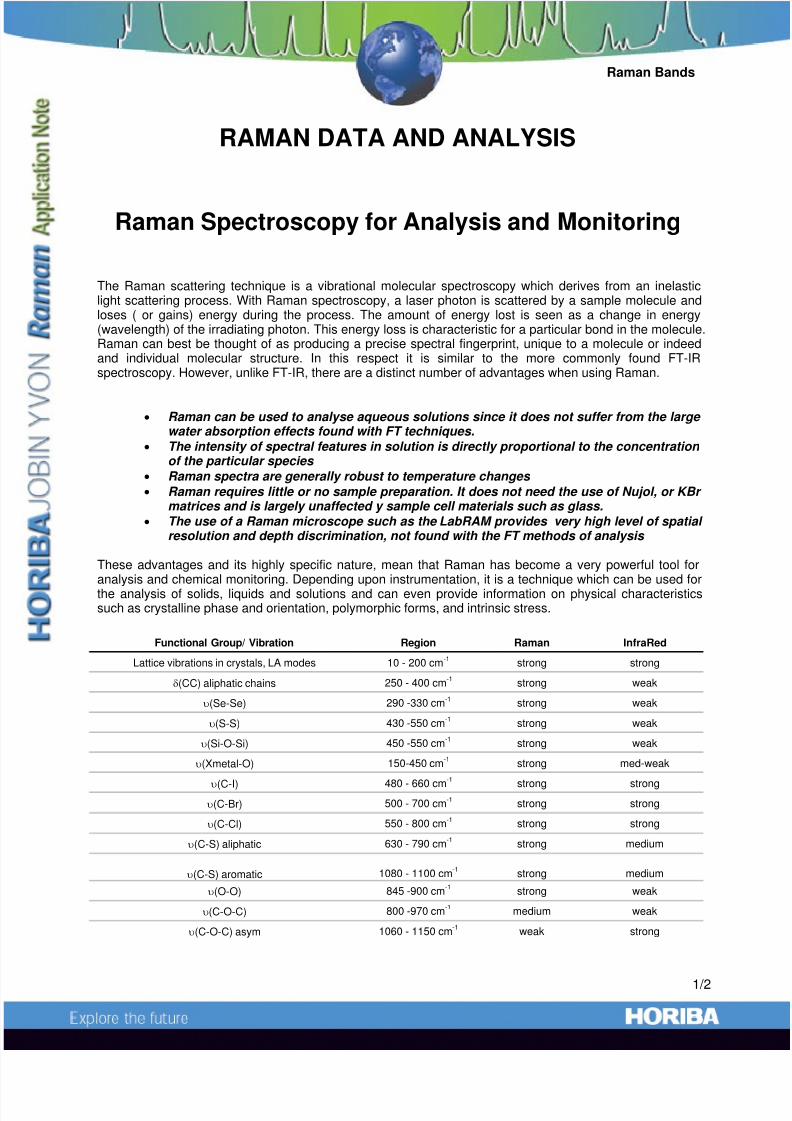
The Raman scattering technique is a vibrational molecular spectroscopy which derives from an inelasticlight scattering process. With Raman spectroscopy, a laser photon is scattered by a sample molecule andloses ( or gains) energy during the process. The amount of energy lost is seen as a change in energy(wavelength) of the irradiating photon. This energy loss is characteristic for a particular bond in the molecule.Raman can best be thought of as producing a precise spectral fingerprint, unique to a molecule or indeedand individual molecular structure. In this respect it is similar to the more commonly found FT-IRspectroscopy. However, unlike FT-IR, there are a distinct number of advantages when using Raman.
• Raman can be used to analyse aqueous solutions since it does not suffer from the large water absorption effects found with FT techniques.
• The intensity of spectral features in solution is directly proportional to the concentration of the particular species
• Raman spectra are generally robust to temperature changes
• Raman requires little or no sample preparation. It does not need the use of Nujol, or KBr matrices and is largely unaffected y sample cell materials such as glass.
• The use of a Raman microscope such as the LabRAM provides very high level of spatial resolution and depth discrimination, not found with the FT methods of analysis
These advantages and its highly specific nature, mean that Raman has become a very powerful tool foranalysis and chemical monitoring. Depending upon instrumentation, it is a technique which can be used for
the analysis of solids, liquids and solutions and can even provide information on physical characteristicssuch as crystalline phase and orientation, polymorphic forms, and intrinsic stress.
Functional Group/ Vibration Region Raman InfraRed
Lattice vibrations in crystals, LA modes 10 - 200 cm-1
strong strong
δ(CC) aliphatic chains 250 - 400 cm-1
strong weak
υ(Se-Se) 290 -330 cm-1
strong weak
υ(S-S) 430 -550 cm-1
strong weak
υ(Si-O-Si) 450 -550 cm-1
strong weak
υ(Xmetal-O) 150-450 cm-1
strong med-weak
υ(C-I) 480 - 660 cm
-1
strong strongυ(C-Br) 500 - 700 cm
-1strong strong
υ(C-Cl) 550 - 800 cm-1
strong strong
υ(C-S) aliphatic 630 - 790 cm-1
strong medium
υ(C-S) aromatic 1080 - 1100 cm-1
strong medium
υ(O-O) 845 -900 cm-1
strong weak
υ(C-O-C) 800 -970 cm-1
medium weak
υ(C-O-C) asym 1060 - 1150 cm-1
weak strong
8/7/2019 Raman bands
http://slidepdf.com/reader/full/raman-bands 2/2
2/2
Raman Bands
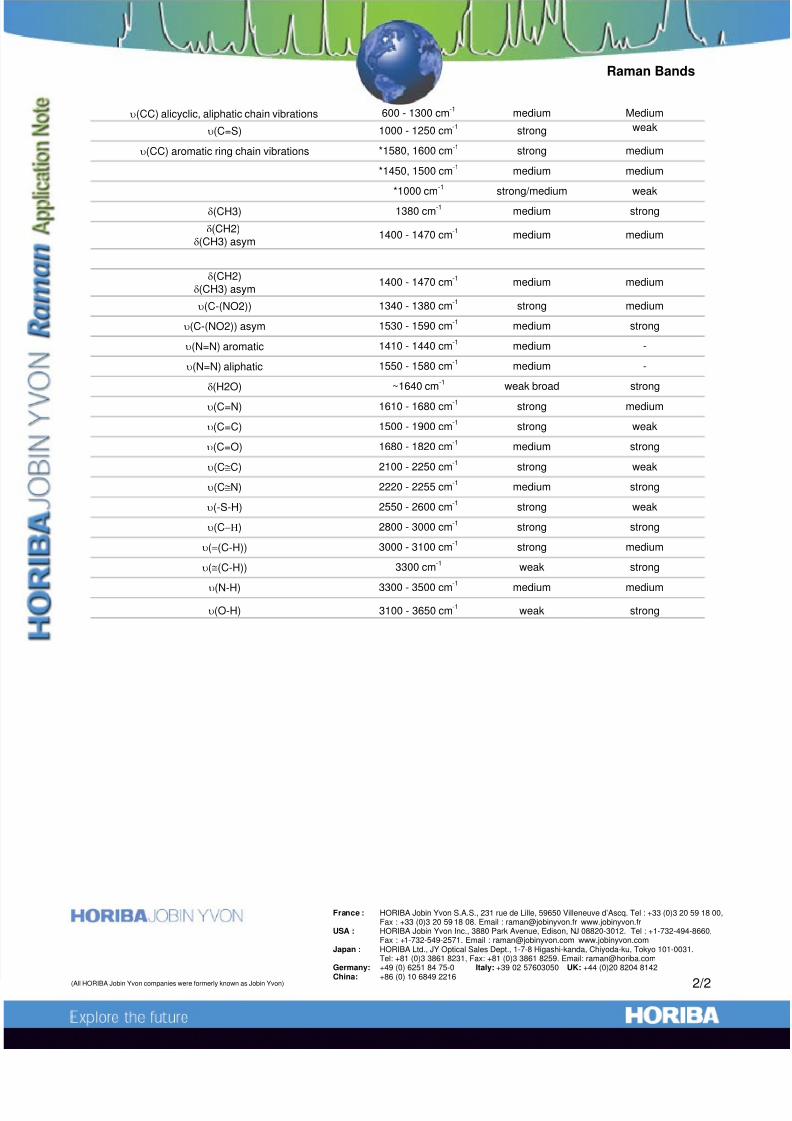
υ(CC) alicyclic, aliphatic chain vibrations 600 - 1300 cm-1
medium Medium
υ(C=S) 1000 - 1250 cm-1
strong weak
υ(CC) aromatic ring chain vibrations *1580, 1600 cm-1
strong medium
*1450, 1500 cm-1
medium medium
*1000 cm
-1
strong/medium weakδ(CH3) 1380 cm
-1medium strong
δ(CH2)
δ(CH3) asym1400 - 1470 cm
-1medium medium
δ(CH2)δ(CH3) asym
1400 - 1470 cm-1
medium medium
υ(C-(NO2)) 1340 - 1380 cm-1
strong medium
υ(C-(NO2)) asym 1530 - 1590 cm-1
medium strong
υ(N=N) aromatic 1410 - 1440 cm-1
medium -
υ(N=N) aliphatic 1550 - 1580 cm-1
medium -
δ(H2O) ~1640 cm-1
weak broad strong
υ(C=N) 1610 - 1680 cm-1
strong medium
υ(C=C) 1500 - 1900 cm-1
strong weak
υ(C=O) 1680 - 1820 cm-1
medium strong
υ(C≅C) 2100 - 2250 cm-1
strong weak
υ(C≅N) 2220 - 2255 cm-1
medium strong
υ(-S-H) 2550 - 2600 cm-1
strong weak
υ(C−Η) 2800 - 3000 cm-1
strong strong
υ(=(C-H)) 3000 - 3100 cm-1
strong medium
υ(≅(C-H)) 3300 cm-1
weak strong
υ(N-H) 3300 - 3500 cm-1
medium medium
υ(O-H) 3100 - 3650 cm-1
weak strong
France : HORIBA Jobin Yvon S.A.S., 231 rue de Lille, 59650 Villeneuve d’Ascq. Tel : +33 (0)3 20 59 18 00,Fax : +33 (0)3 20 59 18 08. Email : [email protected] www.jobinyvon.fr
USA : HORIBA Jobin Yvon Inc., 3880 Park Avenue, Edison, NJ 08820-3012. Tel : +1-732-494-8660,Fax : +1-732-549-2571. Email : [email protected] www.jobinyvon.com
Japan : HORIBA Ltd., JY Optical Sales Dept., 1-7-8 Higashi-kanda, Chiyoda-ku, Tokyo 101-0031.Tel: +81 (0)3 3861 8231, Fax: +81 (0)3 3861 8259. Email: [email protected]
Germany: +49 (0) 6251 84 75-0 Italy: +39 02 57603050 UK: +44 (0)20 8204 8142China: +86 (0) 10 6849 2216
(All HORIBA Jobin Yvon companies were formerly known as Jobin Yvon)