Research Article Automatic Evaluation of Voice Quality ...
12
Research Article Automatic Evaluation of Voice Quality Using Text-Based Laryngograph Measurements and Prosodic Analysis Tino Haderlein, 1 Cornelia Schwemmle, 2 Michael Döllinger, 3 Václav Matoušek, 4 Martin Ptok, 5 and Elmar Nöth 1 1 Lehrstuhl f¨ ur Mustererkennung, Friedrich-Alexander-Universit¨ at Erlangen-N¨ urnberg (FAU), Martensstraße 3, 91058 Erlangen, Germany 2 Klinik f¨ ur Hals-, Nasen-, Ohrenheilkunde, Universit¨ atsklinikum Magdeburg, Leipziger Straße 44, 39120 Magdeburg, Germany 3 Phoniatrische und P¨ adaudiologische Abteilung, Klinikum der Universit¨ at Erlangen-N¨ urnberg, Bohlenplatz 21, 91054 Erlangen, Germany 4 Department of Computer Science and Engineering, University of West Bohemia in Pilsen, Univerzitn´ ı 8, 306 14 Plzeˇ n, Czech Republic 5 Klinik f¨ ur Phoniatrie und P¨ adaudiologie, Medizinische Hochschule Hannover, Carl-Neuberg-Straße 1, 30625 Hannover, Germany Correspondence should be addressed to Tino Haderlein; [email protected] Received 23 February 2015; Accepted 13 May 2015 Academic Editor: Zoran Bursac Copyright © 2015 Tino Haderlein et al. is is an open access article distributed under the Creative Commons Attribution License, which permits unrestricted use, distribution, and reproduction in any medium, provided the original work is properly cited. Due to low intra- and interrater reliability, perceptual voice evaluation should be supported by objective, automatic methods. In this study, text-based, computer-aided prosodic analysis and measurements of connected speech were combined in order to model perceptual evaluation of the German Roughness-Breathiness-Hoarseness (RBH) scheme. 58 connected speech samples (43 women and 15 men; 48.7 ± 17.8 years) containing the German version of the text “e North Wind and the Sun” were evaluated perceptually by 19 speech and voice therapy students according to the RBH scale. For the human-machine correlation, Support Vector Regression with measurements of the vocal fold cycle irregularities (CFx) and the closed phases of vocal fold vibration (CQx) of the Laryngograph and 33 features from a prosodic analysis module were used to model the listeners’ ratings. e best human- machine results for roughness were obtained from a combination of six prosodic features and CFx ( = 0.71, = 0.57). ese correlations were approximately the same as the interrater agreement among human raters ( = 0.65, = 0.61). CQx was one of the substantial features of the hoarseness model. For hoarseness and breathiness, the human-machine agreement was substantially lower. Nevertheless, the automatic analysis method can serve as the basis for a meaningful objective support for perceptual analysis. 1. Introduction Voice is a perceptual phenomenon, and perceptual evaluation is therefore regarded as a gold standard for voice assessment [1, 2]. Hence, perception-based methods are the basis for the evaluation of voice pathologies in clinical routine, although they are too inconsistent among single raters to establish a standardized and unified classification [3, 4]. With this background of methodological shortcomings, simple rating criteria for perceptual evaluation have been established. Five of them have been combined to form the GRBAS scale [5] (grade, roughness, breathiness, asthenia, and strain). However, the choice of criteria has been criticized: asthenia () and breathiness () correlated very highly with each other in a study by Nawka et al., and the evaluation of the strain () criterion showed a much higher variation than the other criteria. For these reasons, the mentioned working group had developed a reduced version of GRBAS, the Roughness- Breathiness-Hoarseness (RBH) evaluation scheme [6]. It has become an established means for perceptual voice assessment in German-speaking countries. Automatic, that is, computer-based, assessment may be helpful as an objective support for the subjective evaluation, since it omits the problem of intra- and interrater variation. Perception experiments are oſten applied to spontaneous speech, standard sentences, or standard texts. About auto- matic analysis, Maryn et al. reported that 18 out of 25 reviewed studies examined sustained vowels exclusively, four only Hindawi Publishing Corporation Computational and Mathematical Methods in Medicine Volume 2015, Article ID 316325, 11 pages http://dx.doi.org/10.1155/2015/316325
Transcript of Research Article Automatic Evaluation of Voice Quality ...
Research ArticleAutomatic Evaluation of Voice Quality Using Text-BasedLaryngograph Measurements and Prosodic Analysis
Tino Haderlein,1 Cornelia Schwemmle,2 Michael Döllinger,3 Václav Matoušek,4
Martin Ptok,5 and Elmar Nöth1
1Lehrstuhl fur Mustererkennung, Friedrich-Alexander-Universitat Erlangen-Nurnberg (FAU), Martensstraße 3,91058 Erlangen, Germany2Klinik fur Hals-, Nasen-, Ohrenheilkunde, Universitatsklinikum Magdeburg, Leipziger Straße 44, 39120 Magdeburg, Germany3Phoniatrische und Padaudiologische Abteilung, Klinikum der Universitat Erlangen-Nurnberg, Bohlenplatz 21,91054 Erlangen, Germany4Department of Computer Science and Engineering, University ofWest Bohemia in Pilsen, Univerzitnı 8, 306 14 Plzen, Czech Republic5Klinik fur Phoniatrie und Padaudiologie, Medizinische Hochschule Hannover, Carl-Neuberg-Straße 1, 30625 Hannover, Germany
Correspondence should be addressed to Tino Haderlein; [email protected]
Received 23 February 2015; Accepted 13 May 2015
Academic Editor: Zoran Bursac
Copyright © 2015 Tino Haderlein et al.This is an open access article distributed under the Creative Commons Attribution License,which permits unrestricted use, distribution, and reproduction in any medium, provided the original work is properly cited.
Due to low intra- and interrater reliability, perceptual voice evaluation should be supported by objective, automatic methods.In this study, text-based, computer-aided prosodic analysis and measurements of connected speech were combined in order tomodel perceptual evaluation of the German Roughness-Breathiness-Hoarseness (RBH) scheme. 58 connected speech samples (43women and 15 men; 48.7 ± 17.8 years) containing the German version of the text “The North Wind and the Sun” were evaluatedperceptually by 19 speech and voice therapy students according to the RBH scale. For the human-machine correlation, SupportVector Regressionwithmeasurements of the vocal fold cycle irregularities (CFx) and the closed phases of vocal fold vibration (CQx)of the Laryngograph and 33 features from a prosodic analysis module were used to model the listeners’ ratings. The best human-machine results for roughness were obtained from a combination of six prosodic features and CFx (𝑟 = 0.71, 𝜌 = 0.57). Thesecorrelations were approximately the same as the interrater agreement among human raters (𝑟 = 0.65, 𝜌 = 0.61). CQx was one ofthe substantial features of the hoarseness model. For hoarseness and breathiness, the human-machine agreement was substantiallylower. Nevertheless, the automatic analysis method can serve as the basis for ameaningful objective support for perceptual analysis.
1. Introduction
Voice is a perceptual phenomenon, and perceptual evaluationis therefore regarded as a gold standard for voice assessment[1, 2]. Hence, perception-based methods are the basis for theevaluation of voice pathologies in clinical routine, althoughthey are too inconsistent among single raters to establisha standardized and unified classification [3, 4]. With thisbackground of methodological shortcomings, simple ratingcriteria for perceptual evaluation have been established. Fiveof them have been combined to form the GRBAS scale[5] (grade, roughness, breathiness, asthenia, and strain).However, the choice of criteria has been criticized: asthenia(𝐴) and breathiness (𝐵) correlated very highlywith each other
in a study by Nawka et al., and the evaluation of the strain(𝑆) criterion showed a much higher variation than the othercriteria. For these reasons, the mentioned working grouphad developed a reduced version of GRBAS, the Roughness-Breathiness-Hoarseness (RBH) evaluation scheme [6]. It hasbecome an establishedmeans for perceptual voice assessmentin German-speaking countries.
Automatic, that is, computer-based, assessment may behelpful as an objective support for the subjective evaluation,since it omits the problem of intra- and interrater variation.Perception experiments are often applied to spontaneousspeech, standard sentences, or standard texts. About auto-matic analysis,Maryn et al. reported that 18 out of 25 reviewedstudies examined sustained vowels exclusively, four only
Hindawi Publishing CorporationComputational and Mathematical Methods in MedicineVolume 2015, Article ID 316325, 11 pageshttp://dx.doi.org/10.1155/2015/316325
2 Computational and Mathematical Methods in Medicine
speech, and three both vowels and speech [7]. For the analysisof speech, mostly one sentence of the English “rainbowpassage” was used. Speech recordings have the advantage thatthey contain onsets, variations of 𝐹
0, and pauses [8]. The
impression of roughness, for instance, is influenced by thevowel onset fragments [9]. In general, hoarseness is morepresent and perceptible in long vowels, especially in openvowels, vowels in voiced context, vowels after glottal closure,or in strained vowels [10]. Hence, perceptual evaluation of avowel and speech can only be adequately compared when theentire vowel with onset is evaluated [11, 12]. For automaticevaluation, some researchers recommend examining onlythe stable part of an isolated vowel [13], but followingthese recommendations means that a substantial portionof persons whose phonation is highly irregular cannot beevaluated at all. In particular, the rapid movements of thearticulatory organs that are essential for the production ofefficient speech require methods of analysis that go beyondthe sole use of sustained vowels [14]. In order to diminishthis problem, the Laryngograph has been designed to allowvocal fold closure to bemonitored,most notably giving a basisfor the measurement of aspects of vocal fold vibration whichoccur during voiced sounds [15].
In order to achieve a more global analysis of speech, theanalysis of speech samples should be extended to methodsthat do not only evaluate voiced sounds. Also unvoicedsounds, words, the speaking rate, the duration and positionof pauses within spoken phrases, the fundamental frequencyand loudness, and their variations contribute to the complexphenomenon of speech. The analysis of these aspects hasbeen subject of our working group in the field of automaticspeech processing and understanding (identification of whatwas said and what it means) and also in automatic evaluationof voice and speech disorders (computer-based analysis ofvoice quality and speech properties, such as intelligibility).This analysis is achieved by a program package called theprosody module [16–18]. The goal of this work is to identifya computer-based equivalent for the subjective ratings ofroughness, breathiness, and hoarseness from speech record-ings, which are representative for communication by voice.This is achieved by means of the Laryngograph and prosodicanalysis. Both systems of measurement are completely inde-pendent from each other.
Binary classification in the two classes “normal speech”and “pathologic speech” was not the goal of this study.Instead, the continuum of degrees of pathology and thecontinuum of human ratings were supposed to be modeled.
The questions addressed are the following.How does the combination of prosodic analysis and
Laryngograph measurements correspond with the percep-tion-based RBH evaluation by “trained” listeners?
How do the results change when the Laryngographmeasurements are left out or used as the only features formodeling the listeners’ ratings?
2. Materials and Methods
2.1. Samples. 58 speech samples (43 samples of female and 15samples of male voices) were used in this study.The age of the
0
2
4
6
8
10
12
14
10 20 30 40 50 60 70 80 90
Occ
urre
nce
Age (years)
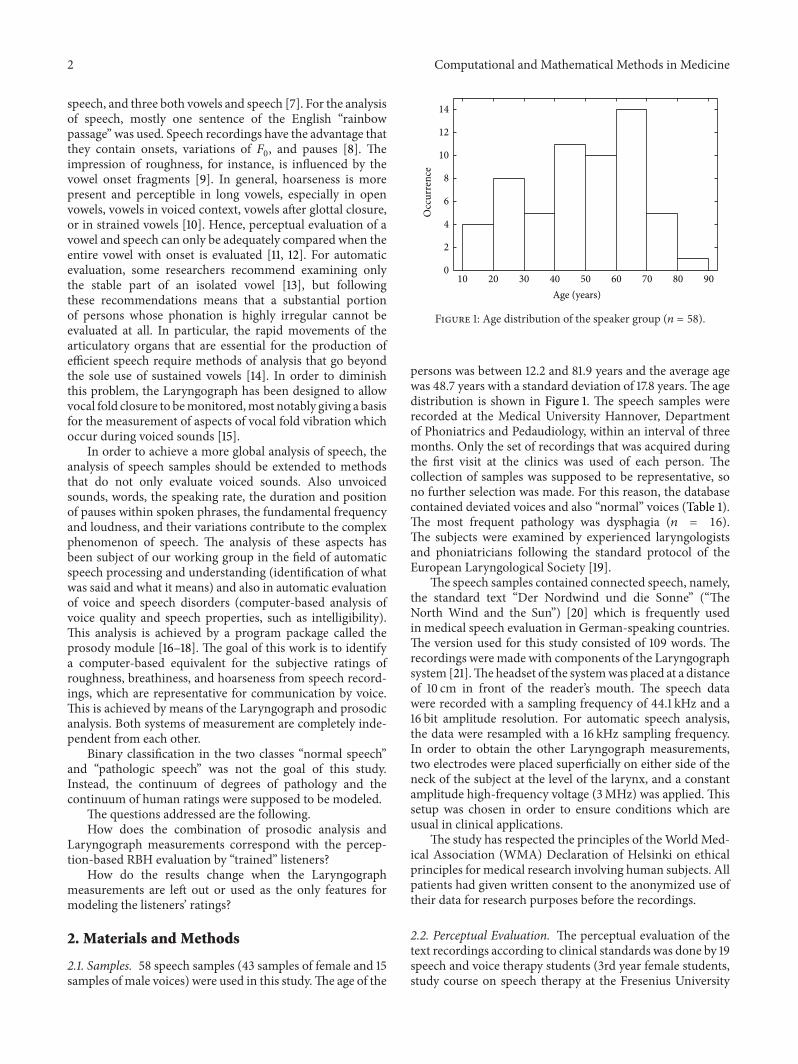
Figure 1: Age distribution of the speaker group (𝑛 = 58).
persons was between 12.2 and 81.9 years and the average agewas 48.7 years with a standard deviation of 17.8 years.The agedistribution is shown in Figure 1. The speech samples wererecorded at the Medical University Hannover, Departmentof Phoniatrics and Pedaudiology, within an interval of threemonths. Only the set of recordings that was acquired duringthe first visit at the clinics was used of each person. Thecollection of samples was supposed to be representative, sono further selection was made. For this reason, the databasecontained deviated voices and also “normal” voices (Table 1).The most frequent pathology was dysphagia (𝑛 = 16).The subjects were examined by experienced laryngologistsand phoniatricians following the standard protocol of theEuropean Laryngological Society [19].
The speech samples contained connected speech, namely,the standard text “Der Nordwind und die Sonne” (“TheNorth Wind and the Sun”) [20] which is frequently usedin medical speech evaluation in German-speaking countries.The version used for this study consisted of 109 words. Therecordings were made with components of the Laryngographsystem [21].Theheadset of the systemwas placed at a distanceof 10 cm in front of the reader’s mouth. The speech datawere recorded with a sampling frequency of 44.1 kHz and a16 bit amplitude resolution. For automatic speech analysis,the data were resampled with a 16 kHz sampling frequency.In order to obtain the other Laryngograph measurements,two electrodes were placed superficially on either side of theneck of the subject at the level of the larynx, and a constantamplitude high-frequency voltage (3MHz) was applied. Thissetup was chosen in order to ensure conditions which areusual in clinical applications.
The study has respected the principles of theWorld Med-ical Association (WMA) Declaration of Helsinki on ethicalprinciples for medical research involving human subjects. Allpatients had given written consent to the anonymized use oftheir data for research purposes before the recordings.
2.2. Perceptual Evaluation. The perceptual evaluation of thetext recordings according to clinical standards was done by 19speech and voice therapy students (3rd year female students,study course on speech therapy at the Fresenius University

Computational and Mathematical Methods in Medicine 3
Table 1: Diagnoses within the speaker group (𝑛 = 58).
EdemaReinke’s edema (bilateral) 3Edge edema 1
ParesesVocal fold paresis (right) 8Vocal fold paresis (left) 3Vocal fold paresis (bilateral) 2
Benign tumors, pseudotumorsHyperplasia vocal fold (right) 1Vocal fold polyp (right) 4Vocal fold polyp (left) 1Vocal fold cyst (right) 1Vocal fold nodules 3Vocal fold granuloma 1Larynx papillomatosis 1
InflammationsLaryngitis 3
Central movement disordersSpasmodic dysphonia 3Balbuties 1Other central disorders 1
Functional dysphoniaPsychogenic dysphonia 1Dysphagia 16Normal laryngeal findings 4
of Applied Sciences, Idstein, Germany) using the RBH scale[6]. The students had learned about the RBH scheme fromthe beginning of their education. In the third year, they havesufficient theoretical and practical knowledge about voiceevaluation, the ability to interpret larynx-related diagnoses,and practical experience, since they have also undergonepractical training including therapy lessons by themselvesunder supervision.
Before the listening task, detailed instructionwas given tothe students by the study tutors. During the task, no furtherinformation was given, however. The raters listened to eachspeech sample once. This was sufficient since the duration ofone recoding was 46 seconds on the average. Between twosamples, there was a pause to note down the results. Thestudents were not allowed to discuss their impression withthe other raters.
For one speech sample, each of the RBH criteria, that is,roughness, breathiness, and hoarseness, can be evaluated on a4-point scale where “0” means “absent” and “3” means “highdegree.” Originally it was believed that hoarseness is distinctof the other two categories, roughness and breathiness [22].The RBH instead assumes that hoarseness is a superclass ofthem [23]. In order to capture the fact that hoarseness is thesuperclass, the𝐻 rating value must usually be at least as highas 𝑅 and 𝐵. For this study, however, this latter rule was notapplied, and the students were told to evaluate hoarsenesson the 4-point scale just by their impression of the replayed
speech.This procedure has already been performed in severalother studies in Germany [24–26].
2.3. Laryngograph Measurements. The Laryngograph mea-sures the time and degree of contact between the vocal foldsby the application of two electrodes which are placed on theneck. The electroglottogram serves as the basis for the com-putation of several measures. Two of them have been used inthis study and will be explained below. Although the voicedexcitation of the vocal tract is a complex activity, it has twomain time-dependent characteristics. The first one is derivedfrom the duration of excitation of the vocal tract, when theclosure of the vocal folds produces its main acoustic signal;the second one relates to the period during which the vocalfolds are effectively closed [21]. The fundamental frequency(𝐹0) is usually estimated from short-time windows and based
on average values from several vocal fold cycles, which mayalso be fragmented at the boundaries of the analysis window.A period-synchronous analysis is more exact since it takesinto account only full cycles and can also consider period-to-period variations that are often of perceptual importance.These variations of the period frequency values Fx aredenoted as CFx in the Laryngograph software. Another mea-suring factor, which provides information about perceivedvoice quality, is the changes CQx of the contact phase Qx.The latter is directly related to the ratio of the closed phaseof vocal fold vibration to the total period of time betweentwo successive epochs of excitation [21]. In this study, CFxand CQx were used in combination with prosodic features todescribe voice quality. Both values are given in percent.
2.4. Prosodic Features. The computation of the prosodicfeatures is independent from the Laryngograph. A speechrecognition system [27] detects the spoken words and theirpositions in the speech recordings.Then the prosodic analysismodule [16] computes a vector of prosodic features for eachword. There are three basic groups of features. Durationfeatures represent word and pause durations. Energy featurescontain information about maximum and minimum energy,their respective positions in the word, the energy regres-sion coefficient, and the mean square error. Similarly, the𝐹0features, based on the detected fundamental frequency,
comprise information about the extreme 𝐹0values and their
positions, voice onset and offset with their positions, andalso the regression coefficient and the mean square error ofthe 𝐹0trajectory. Duration, energy, and 𝐹
0values are stored
as absolute and as normalized values. The basic features arecomputed in different contexts, that is, in intervals containinga single word or pause only or a word-pause-word interval.In this way, 33 features were computed for each word (seeTable 2) [17, 28, 29].
Besides the 33 local features per word, 15 “global” fea-tures were computed for intervals of 15 words length each.They were derived from jitter (fluctuations of 𝐹
0), shimmer
(fluctuations of intensity), and the number of detected voicedand unvoiced sections in the speech signal [28].They coveredthe means and standard deviations of jitter and shimmer, thenumber, length, andmaximum length of voiced and unvoiced
4 Computational and Mathematical Methods in Medicine
Table 2: Prosodic features and their intervals of computation; 33prosodic features are based upon duration (“Dur”), energy (“En”),and fundamental frequency (“F0”) measures. The context sizedenotes the interval of words on which the features are computed;W: computed on current word,WPW: computed in the interval thatcontains the second and first word before the current word, and thepause between them.
Features Context sizeWPW W
Pause: before, Fill-before,after, Fill-after ∙
En: RegCoeff, MseReg,Abs, Norm, Mean ∙ ∙
En: Max, MaxPos ∙
Dur: Abs, Norm ∙ ∙
F0: RegCoeff, MseReg ∙ ∙
F0: Mean, Max, MaxPos,Min, MinPos, Off, OffPos,On, OnPos
∙
The features are abbreviated as follows.Length of pauses “Pause”: length of silent pause before (before) and after(after), andfilled pause before (Fill-before) and after (Fill-after) the respectiveword in context.Energy features “En”: regression coefficient (RegCoeff) and mean squareerror (MseReg) of the energy curve with respect to the regression curve;mean (Mean) and maximum energy (Max) with its position on the time axis(MaxPos); absolute (Abs) and normalized (Norm) energy values.Duration features “Dur”: absolute (Abs) and normalized (Norm) duration.𝐹0 features “F0”: regression coefficient (RegCoeff) and themean square error(MseReg) of the 𝐹0 curve with respect to its regression curve; mean (Mean),maximum (Max), minimum (Min), voice onset (On), and offset (Off) valuesas well as the position of Max (MaxPos), Min (MinPos), On (OnPos), andOff (OffPos) on the time axis; all 𝐹0 values are normalized.
sections, the ratio of the numbers of voiced and unvoicedsections, the ratio of the length of the voiced sections to thelength of the signal, and the same for unvoiced sections. Thelast feature was the standard deviation of 𝐹
0.
The listeners gave ratings for the entire text. In order toreceive also one single value for each feature that could becompared to the human ratings, the average of each prosodicfeature over the entire recording served as final feature value.
2.5. Support Vector Regression. A Support Vector Machine(SVM)performs a binary classification based on a hyperplaneseparation between two class areas in a multi-dimensionalfeature space. SVMs can also be used for Support VectorRegression (SVR) [30]. The general idea of regression is touse the element vectors of the training set to approximatea function which tries to predict the target value of a givenvector of the test set. In this study, the sequential minimaloptimization algorithm (SMO) [30] of the Weka toolbox [31]was applied for this purpose. The automatically computedprosodic features and the CFx and CQx values served as thetraining set for the regression, and the test set consisted ofthe perceptually assessed RBH scores. For each of 𝑅, 𝐵, and𝐻, one separate regression was computed.
In order to find the best subset of the computed featuresto model the subjective ratings, a correlation-based feature
Table 3: Perceptual evaluation results (average, standard devia-tion, and minimal and maximal values) and interrater agreementexpressed as Krippendorff ’s 𝛼 and the correlation coefficients 𝑟 and𝜌 (𝑛 = 58).
Average Standard dev. Min Max 𝛼 𝑟 𝜌
R 0.88 0.51 0.05 2.21 0.45 0.65 0.61B 0.59 0.47 0.00 2.16 0.33 0.58 0.50H 0.81 0.56 0.05 1.89 0.36 0.59 0.57
Table 4: Correlation 𝑟 (𝜌) between the perceptual ratings (𝑛 = 58).
B HR 0.13 (0.33) 0.50 (0.53)∗
B 0.53 (0.67)∗
∗ = correlation is significant on the 0.01 level.
selection method ([32], pp. 59–61) was applied in a 10-foldcross-validation manner. The features with the highest rankswere then used as the input for the SVR.
2.6. Human-Machine Correlation. Statistical analysis wasperformedusingWeka and in-house programs.The interraterreliability for the entire rater group was measured usingKrippendorff ’s 𝛼 [33]. Many studies use Cronbach’s 𝛼, butthis measure eliminates the influences of different tendenciesin rating since the mean values are neglected. In order toexamine human-machine correlation, the automatic mea-surement for each rating criterion of each recording wascompared to the average value of the 19 raters’ evaluation.The correlations between different measurements and ratingcriteria were computed using Pearson’s correlation coeffi-cient 𝑟 and Spearman’s rank-order correlation coefficient 𝜌.Other measures, like Cohen’s 𝜅 or Krippendorff ’s 𝛼, werenot used for this purpose due to the different domains ofhuman and machine evaluation. This means, for instance,that continuous intervals of the prosodic features or theLaryngograph values would have to bemapped to the discretevalues {0, 1, 2, 3} of the RBH components, which is anotherpossible source of error [34].
3. Results
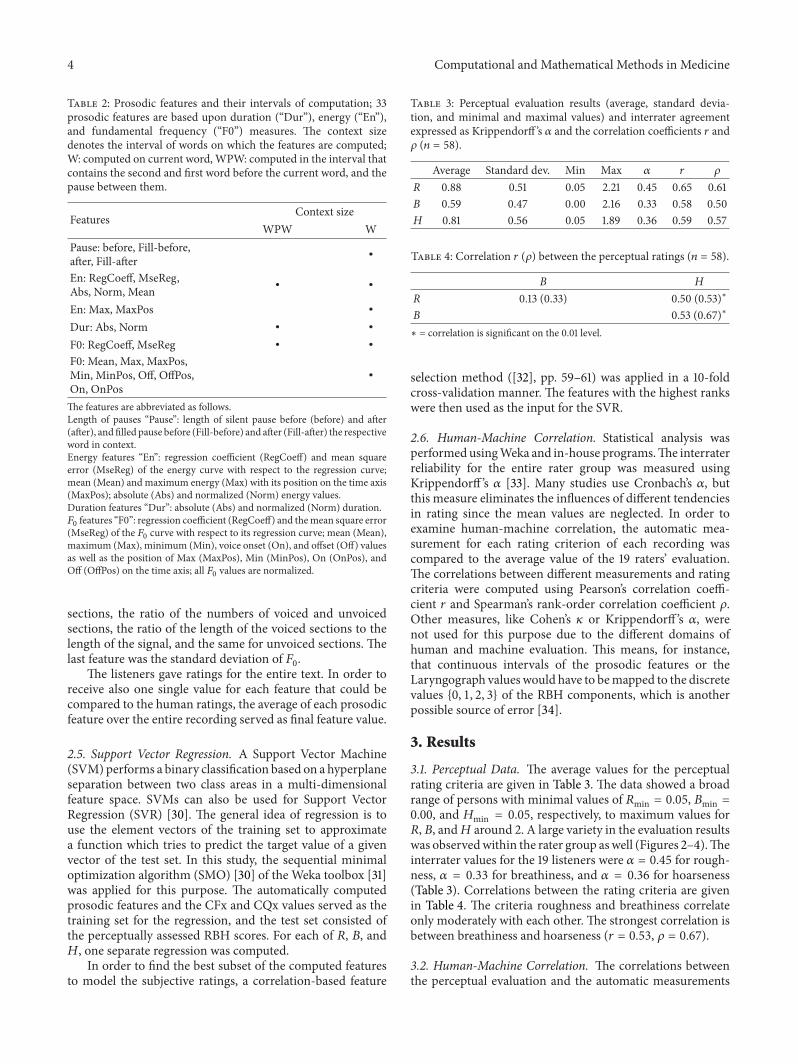
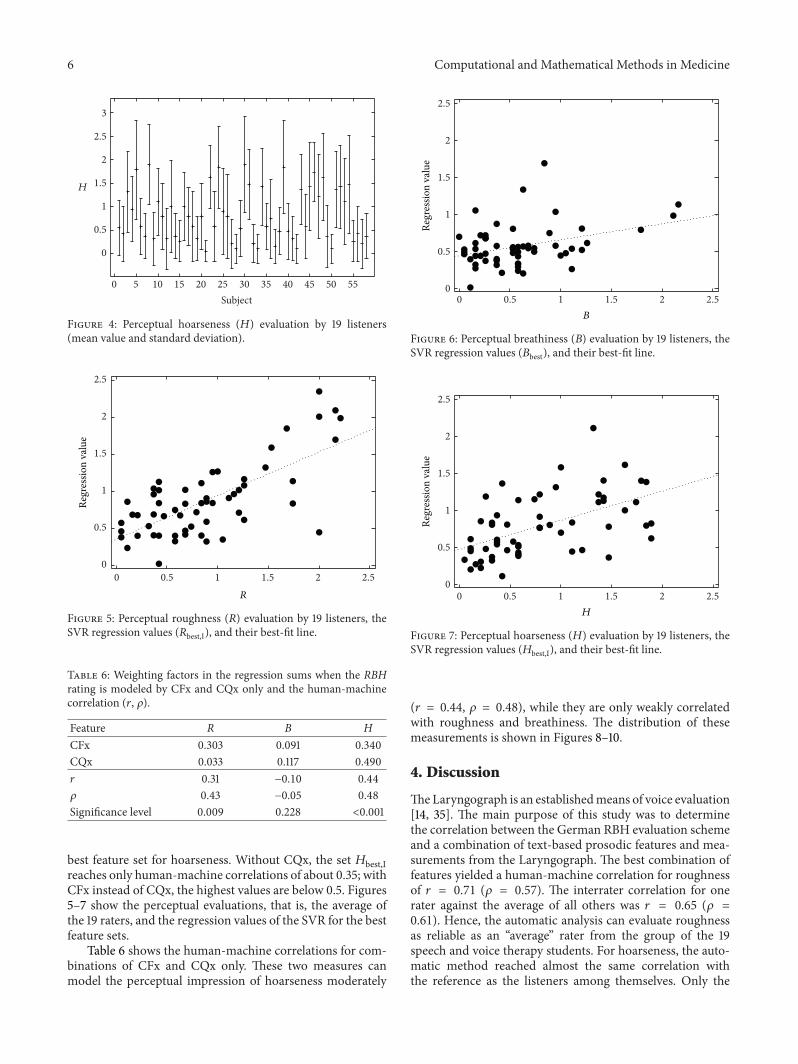
3.1. Perceptual Data. The average values for the perceptualrating criteria are given in Table 3. The data showed a broadrange of persons with minimal values of 𝑅min = 0.05, 𝐵min =0.00, and 𝐻min = 0.05, respectively, to maximum values for𝑅, 𝐵, and𝐻 around 2. A large variety in the evaluation resultswas observedwithin the rater group aswell (Figures 2–4).Theinterrater values for the 19 listeners were 𝛼 = 0.45 for rough-ness, 𝛼 = 0.33 for breathiness, and 𝛼 = 0.36 for hoarseness(Table 3). Correlations between the rating criteria are givenin Table 4. The criteria roughness and breathiness correlateonly moderately with each other. The strongest correlation isbetween breathiness and hoarseness (𝑟 = 0.53, 𝜌 = 0.67).
3.2. Human-Machine Correlation. The correlations betweenthe perceptual evaluation and the automatic measurements

Computational and Mathematical Methods in Medicine 5
Table 5: Best feature sets for human-machine correlation and their weights in the regression formulae.
Feature Context Rbest,IRbest,I
w/o CFx Rbest,IIRbest,IIw/o CFx Bbest Hbest,I Hbest,II Hbest,III Hbest,IV
DurNorm WPW −0.057 −0.046 0.377 0.499 0.378DurNorm W 0.513 0.402F0Min W −0.446 −0.458 −0.452 −0.389
F0Mean W −0.195 −0.226 −0.191 −0.172
F0Onset W 0.173F0OffPos W 0.322 0.120 0.185 0.236EnNorm WPW −0.151 0.343EnNorm W −0.247 −0.315 0.155MeanJitter 15W 0.118 0.186 0.113 0.249 0.239 0.366 0.368 0.320 0.208MeanShimmer 15W 0.144 0.138 0.145 0.114 −0.031
StandDevShimmer 15W −0.163
#+Voiced 15W 0.321 0.347 0.334 0.324 0.094 −0.133 −0.117 0.122RelNum+/−Voiced 15W −0.164 0.218 0.082 −0.144CFx 0.210 0.206CQx 0.643 0.495 −0.242 0.506𝑟 0.71 0.66 0.71 0.67 0.36 0.53 0.47 0.45 0.49𝜌 0.57 0.49 0.58 0.49 0.27 0.54 0.46 0.45 0.55Significance level <0.001 <0.001 <0.001 <0.001 0.003 <0.001 <0.001 <0.001 <0.001Contexts: W: word, WPW: word-pause-word, 15W: 15 words (“global” feature). The correlations of the respective set to the human reference are given by 𝑟(Pearson) and 𝜌 (Spearman).
0
0.5
1
1.5
2
2.5
3
0 5 10 15 20 25 30 35 40 45 50 55
R
Subject
Figure 2: Perceptual roughness (𝑅) evaluation by 19 listeners (meanvalue and standard deviation).
after the SVR are given in Table 5. The best set for roughness(𝑅best,I) achieves 𝑟 = 0.71 (𝜌 = 0.57). It contains the durationof a word-pause-word interval (DurNormWPW), the meanandminimum 𝐹
0within a word (F0MeanW, F0MinW), mean
jitter and shimmer averaged on 15-word sections (MeanJitter,MeanShimmer), the number of sections detected as voiced(#+Voiced), and CFx. Without CFx, only 𝑟 = 0.66 (𝜌 = 0.49)is reached (set 𝑅best,I w/o CFx). The duration feature can alsobe left out without changing the correlations significantly(sets 𝑅best,II and 𝑅best,II w/o CFx). The same feature is in thebest set for breathiness modeling (𝐵best), which, however,
0
0.5
1
1.5
2
2.5
3
0 5 10 15 20 25 30 35 40 45 50 55
B
Subject
Figure 3: Perceptual breathiness (𝐵) evaluation by 19 listeners(mean value and standard deviation).
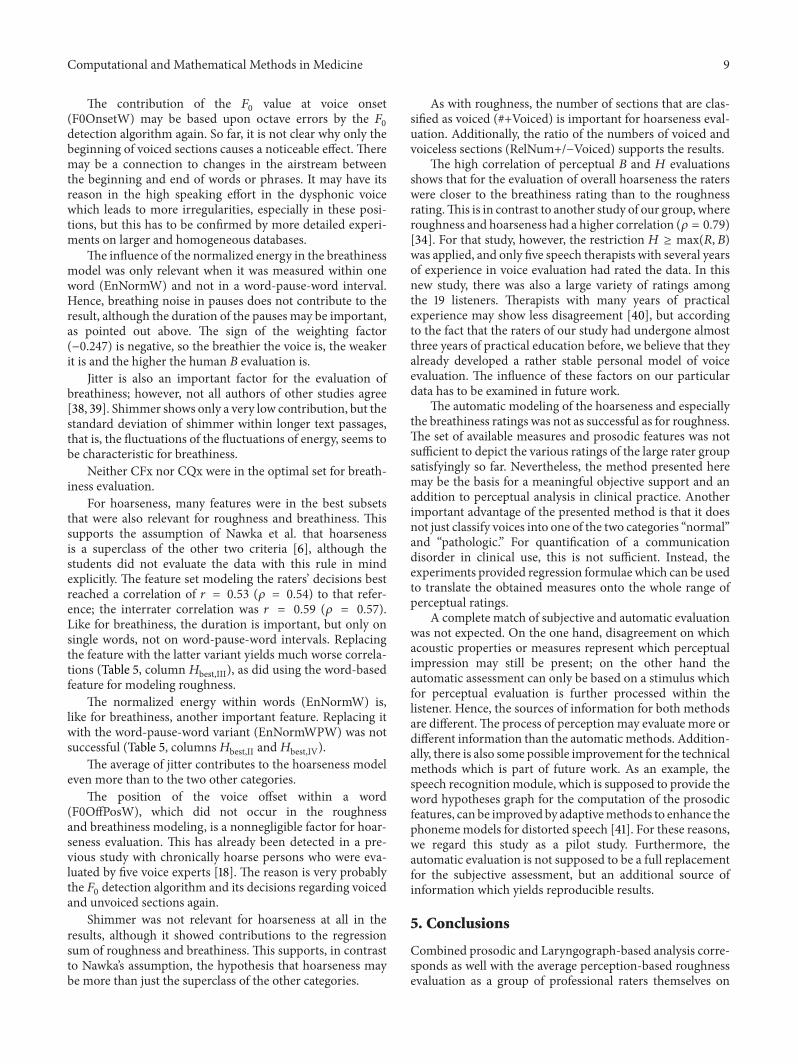
was far less successful in modeling the reference with 𝑟 =0.36 (𝜌 = 0.27). Still, this correlation is highly significant.Neither CFx nor CQx are included in the breathiness model.For hoarseness, there are four different results, denoted𝐻best,I to 𝐻best,IV. The best correlation is 𝑟 = 0.53 (𝜌 =0.54) for a combination of word duration (DurNormW), thevoice offset position within single words (F0OffPosW), thenormalized energy within words (EnNormW), the “global”number of voiced sections in the recording (#+Voiced),and the ratio between the numbers of voiced and unvoicedsections (RelNum+/−Voiced). CQx is also essential for the
6 Computational and Mathematical Methods in Medicine
0
0.5
1
1.5
2
2.5
3
0 5 10 15 20 25 30 35 40 45 50 55
H
Subject
Figure 4: Perceptual hoarseness (𝐻) evaluation by 19 listeners(mean value and standard deviation).
0
0.5
1
1.5
2
2.5
0 0.5 1 1.5 2 2.5
Regr
essio
n va
lue
R
Figure 5: Perceptual roughness (𝑅) evaluation by 19 listeners, theSVR regression values (𝑅best,I), and their best-fit line.
Table 6: Weighting factors in the regression sums when the RBHrating is modeled by CFx and CQx only and the human-machinecorrelation (𝑟, 𝜌).
Feature R B HCFx 0.303 0.091 0.340CQx 0.033 0.117 0.490𝑟 0.31 −0.10 0.44𝜌 0.43 −0.05 0.48Significance level 0.009 0.228 <0.001
best feature set for hoarseness. Without CQx, the set 𝐻best,Ireaches only human-machine correlations of about 0.35; withCFx instead of CQx, the highest values are below 0.5. Figures5–7 show the perceptual evaluations, that is, the average ofthe 19 raters, and the regression values of the SVR for the bestfeature sets.
Table 6 shows the human-machine correlations for com-binations of CFx and CQx only. These two measures canmodel the perceptual impression of hoarseness moderately
0
0.5
1
1.5
2
2.5
0 0.5 1 1.5 2 2.5
Regr
essio
n va
lue
B
Figure 6: Perceptual breathiness (𝐵) evaluation by 19 listeners, theSVR regression values (𝐵best), and their best-fit line.
0
0.5
1
1.5
2
2.5
0 0.5 1 1.5 2 2.5
Regr
essio
n va
lue
H
Figure 7: Perceptual hoarseness (𝐻) evaluation by 19 listeners, theSVR regression values (𝐻best,I), and their best-fit line.
(𝑟 = 0.44, 𝜌 = 0.48), while they are only weakly correlatedwith roughness and breathiness. The distribution of thesemeasurements is shown in Figures 8–10.
4. Discussion
TheLaryngograph is an establishedmeans of voice evaluation[14, 35]. The main purpose of this study was to determinethe correlation between the German RBH evaluation schemeand a combination of text-based prosodic features and mea-surements from the Laryngograph. The best combination offeatures yielded a human-machine correlation for roughnessof 𝑟 = 0.71 (𝜌 = 0.57). The interrater correlation for onerater against the average of all others was 𝑟 = 0.65 (𝜌 =0.61). Hence, the automatic analysis can evaluate roughnessas reliable as an “average” rater from the group of the 19speech and voice therapy students. For hoarseness, the auto-matic method reached almost the same correlation withthe reference as the listeners among themselves. Only the

Computational and Mathematical Methods in Medicine 7
Table7:Correlations
ofprosod
icandLaryngograph
measures,which
wereintheb
estm
odelsfor
theh
uman
ratin
g,with
each
other.
Feature
DurNorm
DurNorm
F0Min
F0Mean
F0Onset
F0OffP
osEn
Norm
EnNorm
MeanJitter
MeanS
himmer
StandD
evSh
immer
#+Vo
iced
RelNum
+/−Vo
iced
CFx
CQx
Con
text
WPW
WW
WW
WWPW
W15W
15W
15W
15W
15W
DurNorm
WPW
0.02−0.17−0.04
0.01−0.23
0.93
0.03
0.07
−0.03
−0.12
0.01
−0.05
0.20
0.04
DurNorm
W0.10
−0.30−0.24−0.19−0.30
0.01
0.78
0.22
0.00
−0.03
0.08
0.13
0.13
0.05
F0Min
W0.02
−0.30
0.53
0.56
0.34
−0.19−0.11−0.54
−0.31
−0.14
−0.70
−0.58
−0.26−0.11
F0Mean
W−0.09−0.31
0.62
0.68
0.39
−0.02−0.09−0.07
−0.32
0.02
−0.17
−0.13
−0.03
0.12
F0Onset
W0.00
−0.23
0.62
0.62
0.29
0.05−0.06−0.01
−0.12
0.07
−0.10
−0.10
0.02
0.06
F0OffP
osW
−0.13−0.32
0.33
0.20
0.27
−0.18−0.23−0.04
−0.26
0.08
−0.32
−0.32
−0.01
0.01
EnNorm
WPW
0.92
0.07
0.02−0.06
0.07
−0.11
0.06
0.14
0.02
−0.10
0.08
0.00
0.14
0.00
EnNorm
W0.19
0.68−0.11−0.13−0.03−0.22
0.24
0.15
−0.14
−0.11
−0.02
−0.02
0.07
0.02
MeanJitter
15W−0.11
0.18−0.30−0.11
0.00
0.08
−0.04
0.03
0.40
0.38
0.62
0.57
0.35
0.23
MeanS
himmer
15W−0.18−0.02−0.27−0.36−0.13−0.23−0.08−0.20
0.21
0.75
0.43
0.40
0.15−0.04
StandD
evSh
immer
15W−0.28
−0.10−0.10−0.03−0.02−0.03−0.21−0.16
0.17
0.75
0.34
0.37
0.15
0.04
#+Vo
iced
15W−0.13
0.13−0.63−0.29−0.21−0.35−0.06
0.00
0.51
0.34
0.31
0.89
0.30
0.15
RelNum
+/−Vo
iced
15W−0.14
0.16−0.56−0.24−0.17−0.30−0.09−0.01
0.51
0.31
0.31
0.93
0.20
0.07
CFx
0.08
0.24−0.35−0.07−0.02−0.18
0.05
0.10
0.40
0.12
0.00
0.45
0.37
0.65
CQx
−0.07
0.02−0.04
0.18
0.07
−0.01−0.12−0.04
0.15
−0.03
−0.04
0.11
0.08
0.64
Upp
errig
httriang
le:Pearson’s𝑟;low
erlefttriang
le:Spearman’s𝜌.
Con
texts:W:w
ord,WPW
:word-pause-word,15W:15words
(“global”feature).
All𝑟and𝜌correlations
with
anabsolutevalueo
flargerthan0.25
(0.33
)are
significanto
nthe0
.05(0.01)level.

8 Computational and Mathematical Methods in Medicine
0
20
40
60
80
100
0 0.5 1 1.5 2 2.5 3R
CFxCQx
Figure 8: Perceptual roughness (𝑅) evaluation by 19 listeners versusCFx and CQx, respectively.
CFxCQx
0
20
40
60
80
100
0 0.5 1 1.5 2 2.5 3B
Figure 9: Perceptual breathiness (𝐵) evaluation by 19 listenersversus CFx and CQx, respectively.
breathiness rating could not be modeled satisfactorily. Addi-tionally, dropping one of the feature sets from the automaticevaluation leads to significantly worse results.
For the modeling of roughness, the duration of a word-pause-word interval (DurNormWPW)may contribute to themost successful set of features because the anatomic alter-ations, which are the reason for the deviated voice, may alsocause a greater speaking effort. This effect has been shownfor substitute voices of laryngectomized persons [17], and itmight also be valid for the data in this study. The contribu-tion of DurNormWPW to the regression sum is, however,very small.
The impact of the values F0MinW and F0MeanW can beexplained by the properties of the 𝐹
0detection algorithm,
which does a voiced-unvoiced decision first. On all of the16ms speech frames that were classified as voiced, the
CFxCQx
0
20
40
60
80
100
0 0.5 1 1.5 2 2.5 3H
Figure 10: Perceptual hoarseness (𝐻) evaluation by 19 listenersversus CFx and CQx, respectively.
program performed 𝐹0detection. The algorithm by Bagshaw
et al. [36] that was used for the task is very robust againstdistortions. However, noisy speech may result in octaveerrors, that is, instead of the real fundamental frequencythe double, triple, or half of the actual value is found. More“noisy” speech influences the 𝐹
0trajectory and thus the
correlation with the subjective results [18].A similar case is the relevance of text-based jitter and
shimmer for themodel of the roughness evaluations. Both arewell-known detectors for voice problems, and the number ofsegments in the recording which were detected as voiced cor-responds with these findings. If a voice is very irregular, thenthe number of segments detected as voiced by the prosodymodule will be very low. A difficulty for the comparison ofthese results with other studies, however, is that the terms“jitter” and “shimmer” disguise a plethora of different algo-rithms, across many different software vendors and researchgroups [37]. Many studies give no algorithm details. Addi-tionally, irregularitymeasures from sustained, isolated vowelsand running speech cannot be directly compared due tocoarticulatory effects anddifferences in voice onset and offset.
In this study, also the CFx value appeared to be essentialfor the good human-machine correlation for roughness.When it was missing, the correlation dropped down to 𝑟 =0.66 (𝜌 = 0.49). CFx is also related to variations of 𝐹
0, but
it is period-synchronous instead of being based on fixed-length windows.That is on the one hand an advantage againstthe traditional computation of jitter. On the other hand,the low correlation between CFx and jitter values (Table 7)indicates that both are containing important but independentinformation.
Breathiness can be modeled only weakly by the availablefeatures. While the human-human correlation was 𝑟 = 0.58(𝜌 = 0.50), the maximum for the automatic analysis was 𝑟 =0.36 (𝜌 = 0.27). Here, the duration of a word-pause-wordinterval contributes very strongly.The reasonmay be that thecontinuous leaking of air at the glottis leads to longer or morefrequent pauses.
Computational and Mathematical Methods in Medicine 9
The contribution of the 𝐹0
value at voice onset(F0OnsetW) may be based upon octave errors by the 𝐹
0
detection algorithm again. So far, it is not clear why only thebeginning of voiced sections causes a noticeable effect. Theremay be a connection to changes in the airstream betweenthe beginning and end of words or phrases. It may have itsreason in the high speaking effort in the dysphonic voicewhich leads to more irregularities, especially in these posi-tions, but this has to be confirmed by more detailed experi-ments on larger and homogeneous databases.
The influence of the normalized energy in the breathinessmodel was only relevant when it was measured within oneword (EnNormW) and not in a word-pause-word interval.Hence, breathing noise in pauses does not contribute to theresult, although the duration of the pauses may be important,as pointed out above. The sign of the weighting factor(−0.247) is negative, so the breathier the voice is, the weakerit is and the higher the human 𝐵 evaluation is.
Jitter is also an important factor for the evaluation ofbreathiness; however, not all authors of other studies agree[38, 39]. Shimmer shows only a very low contribution, but thestandard deviation of shimmer within longer text passages,that is, the fluctuations of the fluctuations of energy, seems tobe characteristic for breathiness.
Neither CFx nor CQx were in the optimal set for breath-iness evaluation.
For hoarseness, many features were in the best subsetsthat were also relevant for roughness and breathiness. Thissupports the assumption of Nawka et al. that hoarsenessis a superclass of the other two criteria [6], although thestudents did not evaluate the data with this rule in mindexplicitly. The feature set modeling the raters’ decisions bestreached a correlation of 𝑟 = 0.53 (𝜌 = 0.54) to that refer-ence; the interrater correlation was 𝑟 = 0.59 (𝜌 = 0.57).Like for breathiness, the duration is important, but only onsingle words, not on word-pause-word intervals. Replacingthe feature with the latter variant yields much worse correla-tions (Table 5, column𝐻best,III), as did using the word-basedfeature for modeling roughness.
The normalized energy within words (EnNormW) is,like for breathiness, another important feature. Replacing itwith the word-pause-word variant (EnNormWPW) was notsuccessful (Table 5, columns𝐻best,II and𝐻best,IV).
The average of jitter contributes to the hoarseness modeleven more than to the two other categories.
The position of the voice offset within a word(F0OffPosW), which did not occur in the roughnessand breathiness modeling, is a nonnegligible factor for hoar-seness evaluation. This has already been detected in a pre-vious study with chronically hoarse persons who were eva-luated by five voice experts [18]. The reason is very probablythe 𝐹0detection algorithm and its decisions regarding voiced
and unvoiced sections again.Shimmer was not relevant for hoarseness at all in the
results, although it showed contributions to the regressionsum of roughness and breathiness. This supports, in contrastto Nawka’s assumption, the hypothesis that hoarseness maybe more than just the superclass of the other categories.
As with roughness, the number of sections that are clas-sified as voiced (#+Voiced) is important for hoarseness eval-uation. Additionally, the ratio of the numbers of voiced andvoiceless sections (RelNum+/−Voiced) supports the results.
The high correlation of perceptual 𝐵 and 𝐻 evaluationsshows that for the evaluation of overall hoarseness the raterswere closer to the breathiness rating than to the roughnessrating.This is in contrast to another study of our group, whereroughness and hoarseness had a higher correlation (𝜌 = 0.79)[34]. For that study, however, the restriction 𝐻 ≥ max(𝑅, 𝐵)was applied, and only five speech therapists with several yearsof experience in voice evaluation had rated the data. In thisnew study, there was also a large variety of ratings amongthe 19 listeners. Therapists with many years of practicalexperience may show less disagreement [40], but accordingto the fact that the raters of our study had undergone almostthree years of practical education before, we believe that theyalready developed a rather stable personal model of voiceevaluation. The influence of these factors on our particulardata has to be examined in future work.
The automatic modeling of the hoarseness and especiallythe breathiness ratings was not as successful as for roughness.The set of available measures and prosodic features was notsufficient to depict the various ratings of the large rater groupsatisfyingly so far. Nevertheless, the method presented heremay be the basis for a meaningful objective support and anaddition to perceptual analysis in clinical practice. Anotherimportant advantage of the presented method is that it doesnot just classify voices into one of the two categories “normal”and “pathologic.” For quantification of a communicationdisorder in clinical use, this is not sufficient. Instead, theexperiments provided regression formulae which can be usedto translate the obtained measures onto the whole range ofperceptual ratings.
A complete match of subjective and automatic evaluationwas not expected. On the one hand, disagreement on whichacoustic properties or measures represent which perceptualimpression may still be present; on the other hand theautomatic assessment can only be based on a stimulus whichfor perceptual evaluation is further processed within thelistener. Hence, the sources of information for both methodsare different.The process of perception may evaluate more ordifferent information than the automatic methods. Addition-ally, there is also some possible improvement for the technicalmethods which is part of future work. As an example, thespeech recognitionmodule, which is supposed to provide theword hypotheses graph for the computation of the prosodicfeatures, can be improved by adaptivemethods to enhance thephonememodels for distorted speech [41]. For these reasons,we regard this study as a pilot study. Furthermore, theautomatic evaluation is not supposed to be a full replacementfor the subjective assessment, but an additional source ofinformation which yields reproducible results.
5. Conclusions
Combined prosodic and Laryngograph-based analysis corre-sponds as well with the average perception-based roughnessevaluation as a group of professional raters themselves on

10 Computational and Mathematical Methods in Medicine
a clinical representative group of patients with a broad dis-tribution of voice pathology. It can serve as an additionalsource of knowledge or an objective guideline in the clinicswhere perceptual evaluations are usually performed by asingle person only.
Conflict of Interests
The authors declare that there is no conflict of interestsregarding the publication of this paper.
Acknowledgment
This studywas partially funded by the Else Kroner-Fresenius-Stiftung, Bad Homburg v.d.H., Germany, under Grant no.2011 A167.
References
[1] Y. Maryn and N. Roy, “Sustained vowels and continuous speechin the auditory-perceptual evaluation of dysphonia severity,”Jornal da Sociedade Brasileira de Fonoaudiologia, vol. 24, no. 2,pp. 107–112, 2012.
[2] J. Oates, “Auditory-perceptual evaluation of disordered voicequality: pros, cons and future directions,” Folia Phoniatrica etLogopaedica, vol. 61, no. 1, pp. 49–56, 2009.
[3] G. B. Kempster, B. R. Gerratt, K. V. Abbott, J. Barkmeier-Kraemer, and R. E. Hillman, “Consensus auditory-perceptualevaluation of voice: development of a standardized clinicalprotocol,” American Journal of Speech-Language Pathology, vol.18, no. 2, pp. 124–132, 2009.
[4] J. Kreiman and B. R. Gerratt, “The perceptual structure ofpathologic voice quality,” Journal of the Acoustical Society ofAmerica, vol. 100, no. 3, pp. 1787–1795, 1996.
[5] M. Hirano, Clinical Examination of Voice, Springer, New York,NY, USA, 1981.
[6] T. Nawka, L.-C. Anders, and J. Wendler, “Die auditiveBeurteilung heiserer Stimmen nach demRBH-System,” SpracheStimme Gehor, vol. 18, no. 3, pp. 130–133, 1994.
[7] Y. Maryn, N. Roy, M. De Bodt, P. van Cauwenberge, and P.Corthals, “Acoustic measurement of overall voice quality: ameta-analysis,” Journal of the Acoustical Society of America, vol.126, no. 5, pp. 2619–2634, 2009.
[8] V. Parsa and D. G. Jamieson, “Acoustic discrimination ofpathological voice: sustained vowels versus continuous speech,”Journal of Speech, Language, and Hearing Research, vol. 44, no.2, pp. 327–339, 2001.
[9] G. de Krom, “Some spectral correlates of pathological breathyand rough voice quality for different types of vowel fragments,”Journal of Speech and Hearing Research, vol. 38, no. 4, pp. 794–811, 1995.
[10] J. Laver, The Phonetic Description of Voice Quality, CambridgeUniversity Press, Cambridge, UK, 1980.
[11] J. Revis, A. Giovanni, and J.-M. Triglia, “Influence de l’attaquesur l’analyse perceptive des dysphonies,” Folia Phoniatrica etLogopaedica, vol. 54, no. 1, pp. 19–25, 2002.
[12] J. Revis, A. Giovanni, F. Wuyts, and J.-M. Triglia, “Comparisonof different voice samples for perceptual analysis,” Folia Phoni-atrica et Logopaedica, vol. 51, no. 3, pp. 108–116, 1999.
[13] I. R. Titze, Workshop on Acoustic Voice Analysis: SummaryStatement, National Center for Voice and Speech, Denver, Colo,USA, 1995.
[14] A. Fourcin, “Aspects of voice irregularity measurement in con-nected speech,” Folia Phoniatrica et Logopaedica, vol. 61, no. 3,pp. 126–136, 2009.
[15] A. J. Fourcin and E. Abberton, “First applications of a newlaryngograph,” Medical & Biological Illustration, vol. 21, no. 3,pp. 172–182, 1971.
[16] V. Zeißler, J. Adelhardt, A. Batliner et al., “The prosodymodule,”in SmartKom: Foundations of Multimodal Dialogue Systems, W.Wahlster, Ed., pp. 139–152, Springer, Berlin, Germany, 2006.
[17] T. Haderlein, E. Noth, H. Toy et al., “Automatic evaluationof prosodic features of tracheoesophageal substitute voice,”European Archives of Oto-Rhino-Laryngology, vol. 264, no. 11,pp. 1315–1321, 2007.
[18] T. Haderlein, C. Moers, B. Mobius, and E. Noth, “Automaticrating of hoarseness by text-based cepstral and prosodic eval-uation,” in Text, Speech and Dialogue: 15th International Con-ference, TSD 2012, Brno, Czech Republic, September 3–7, 2012.Proceedings, vol. 7499, pp. 573–580, Springer, Berlin, Germany,2012.
[19] P. H. Dejonckere, P. Bradley, P. Clemente et al., “A basic protocolfor functional assessment of voice pathology, especially forinvestigating the efficacy of (phonosurgical) treatments andevaluating new assessment techniques. Guideline elaborated bythe Committee on Phoniatrics of the European LaryngologicalSociety (ELS),” European Archives of Oto-Rhino-Laryngology,vol. 258, no. 2, pp. 77–82, 2001.
[20] International Phonetic Association, Handbook of the Interna-tional Phonetic Association, Cambridge University Press, Cam-bridge, UK, 1999.
[21] A. Fourcin, E. Abberton, D. Miller, and D. Howells, “Laryn-gography speech pattern element tools for therapy, training andassessment,” European Journal of Disorders of Communication,vol. 30, no. 2, pp. 101–115, 1995.
[22] G. Fairbanks, Voice and Articulation Drillbook, Harper, NewYork, NY, USA, 2nd edition, 1960.
[23] A. E. Aronson andD.M. Bless,Clinical Voice Disorders,Thieme,New York, NY, USA, 4th edition, 2009.
[24] J. Koreman, M. Putzer, and M. Just, “Correlates of varyingvocal fold adduction deficiencies in perception and production:methodological and practical considerations,” Folia Phoniatricaet Logopaedica, vol. 56, no. 5, pp. 305–320, 2004.
[25] M. Putzer andW. J. Barry, “Methodische Aspekte der auditivenBeurteilung von Stimmqualitat,” Sprache-Stimme-Gehor, vol.28, no. 4, pp. 188–197, 2004.
[26] M. Ptok, C. Schwemmle, C. Iven, M. Jessen, and T. Nawka, “Zurauditiven Bewertung der Stimmqualitat,” HNO, vol. 54, no. 10,pp. 793–802, 2006.
[27] T. Haderlein, K. Riedhammer, E. Noth et al., “Application ofautomatic speech recognition to quantitative assessment oftracheoesophageal speech with different signal quality,” FoliaPhoniatrica et Logopaedica, vol. 61, no. 1, pp. 12–17, 2009.
[28] A. Batliner, J. Buckow, H. Niemann, E. Noth, and V. Warnke,“The prosody module,” in Verbmobil: Foundations of Speech-to-Speech Translation, W. Wahlster, Ed., pp. 106–121, Springer,Berlin, Germany, 2000.
[29] A. Batliner, K. Fischer, R. Huber, J. Spilker, and E. Noth, “Howto find trouble in communication,” Speech Communication, vol.40, no. 1-2, pp. 117–143, 2003.
[30] A. J. Smola and B. Scholkopf, “A tutorial on support vectorregression,” Statistics and Computing, vol. 14, no. 3, pp. 199–222,2004.
Computational and Mathematical Methods in Medicine 11
[31] I.Witten andE. Frank,DataMining: PracticalMachine LearningTools and Techniques, Morgan Kaufmann, San Francisco, Calif,USA, 2nd edition, 2005.
[32] A.Maier, Speech of Childrenwith Cleft Lip and Palate: AutomaticAssessment. Dissertation, vol. 29 of Studien zur Mustererken-nung, Logos, Berlin, Germany, 2009.
[33] K. Krippendorff,Content Analysis: An Introduction to ItsMetho-dology, Sage, Thousand Oaks, Calif, USA, 2004.
[34] C. Moers, B. Mobius, F. Rosanowski, E. Noth, U. Eysholdt,and T. Haderlein, “Vowel- and text-based cepstral analysis ofchronic hoarseness,” Journal of Voice, vol. 26, no. 4, pp. 416–424,2012.
[35] M. Ptok, C. Iven, M. Jessen, and C. Schwemmle, “Objektivgemessene Stimmlippenschwingungsirregularitat vs. subjek-tiver Eindruck der Rauigkeit,” HNO, vol. 54, no. 2, pp. 132–138,2006.
[36] P. C. Bagshaw, S. M. Hiller, and M. A. Jack, “Enhanced pitchtracking and the processing of F0 contours for computer aidedintonation teaching,” in Proceedings of the European Conferenceon Speech Communication and Technology (Eurospeech ’93), vol.2, pp. 1003–1006, 1993.
[37] P. N. Carding, I. N. Steen, A. Webb, K. Mackenzie, I. J. Deary,and J. A. Wilson, “The reliability and sensitivity to change ofacoustic measures of voice quality,” Clinical Otolaryngology andAllied Sciences, vol. 29, no. 5, pp. 538–544, 2004.
[38] J. Hillenbrand, “Perception of aperiodicities in syntheticallygenerated voices,” Journal of the Acoustical Society of America,vol. 83, no. 6, pp. 2361–2371, 1988.
[39] D. M. Hartl, S. Hans, J. Vaissiere, and D. F. Brasnu, “Objectiveacoustic and aerodynamic measures of breathiness in paralyticdysphonia,” European Archives of Oto-Rhino-Laryngology, vol.260, no. 4, pp. 175–182, 2003.
[40] I. V. Bele, “Reliability in perceptual analysis of voice quality,”Journal of Voice, vol. 19, no. 4, pp. 555–573, 2005.
[41] S.-O. Caballero-Morales, “Estimation of phoneme-specificHMM topologies for the automatic recognition of dysarthricspeech,”Computational andMathematicalMethods inMedicine,vol. 2013, Article ID 297860, 15 pages, 2013.

Submit your manuscripts athttp://www.hindawi.com
Stem CellsInternational
Hindawi Publishing Corporationhttp://www.hindawi.com Volume 2014
Hindawi Publishing Corporationhttp://www.hindawi.com Volume 2014
MEDIATORSINFLAMMATION
of
Hindawi Publishing Corporationhttp://www.hindawi.com Volume 2014
Behavioural Neurology
EndocrinologyInternational Journal of
Hindawi Publishing Corporationhttp://www.hindawi.com Volume 2014
Hindawi Publishing Corporationhttp://www.hindawi.com Volume 2014
Disease Markers
Hindawi Publishing Corporationhttp://www.hindawi.com Volume 2014
BioMed Research International
OncologyJournal of
Hindawi Publishing Corporationhttp://www.hindawi.com Volume 2014
Hindawi Publishing Corporationhttp://www.hindawi.com Volume 2014
Oxidative Medicine and Cellular Longevity
Hindawi Publishing Corporationhttp://www.hindawi.com Volume 2014
PPAR Research
The Scientific World JournalHindawi Publishing Corporation http://www.hindawi.com Volume 2014
Immunology ResearchHindawi Publishing Corporationhttp://www.hindawi.com Volume 2014
Journal of
ObesityJournal of
Hindawi Publishing Corporationhttp://www.hindawi.com Volume 2014
Hindawi Publishing Corporationhttp://www.hindawi.com Volume 2014
Computational and Mathematical Methods in Medicine
OphthalmologyJournal of
Hindawi Publishing Corporationhttp://www.hindawi.com Volume 2014
Diabetes ResearchJournal of
Hindawi Publishing Corporationhttp://www.hindawi.com Volume 2014
Hindawi Publishing Corporationhttp://www.hindawi.com Volume 2014
Research and TreatmentAIDS
Hindawi Publishing Corporationhttp://www.hindawi.com Volume 2014
Gastroenterology Research and Practice
Hindawi Publishing Corporationhttp://www.hindawi.com Volume 2014
Parkinson’s Disease
Evidence-Based Complementary and Alternative Medicine
Volume 2014Hindawi Publishing Corporationhttp://www.hindawi.com