
Sec. 6.2 Woche&7:&Evalua.on& - cis.uni-muenchen.de fileCharakteris.ken&einer&Suchmaschine& •...
47
Woche 7: Evalua.on • Woher wissen wir ob unsere Resultate brauchbar sind? – Evalua.on einer Suchmaschine • Benchmarks • Präzision und Recall • Resultate Zusammenfassen: – Unsere möglicherweise guten Resultate für die Benutzer benutzbar machen 1 Sec. 6.2
Transcript of Sec. 6.2 Woche&7:&Evalua.on& - cis.uni-muenchen.de fileCharakteris.ken&einer&Suchmaschine& •...
Woche 7: Evalua.on
• Woher wissen wir ob unsere Resultate brauchbar sind? – Evalua.on einer Suchmaschine
• Benchmarks
• Präzision und Recall
• Resultate Zusammenfassen: – Unsere möglicherweise guten Resultate für die Benutzer benutzbar machen
1
Sec. 6.2

EVALUATION von SUCHMASCHINEN
Charakteris.ken einer Suchmaschine
• Wie schnell indexiert sie – Zahl der Dokumente pro Stunde – (DurchschniKliche Dokumentengröße)
• Wie schnell ist die Suche – Wartezeit als Funk.on der Indexgröße
• Ausdrucksstärke der Anfragesprache (Querylanguage) – Fähigkeit komplexe Informa.onsbedürfnisse auszudrücken – Geschwindigkeit für komplexe Queries
• Zugängliches Benutzerinterface • Is it free?
3
Sec. 8.6
Maße zur Bewertung Suchmaschine
• Alle der vorhergehenden Kriterien sind meßbar: können Geschwindigkeit/Größe quan.fizieren
• Können Ausdrucksstärke präzisieren • Schlüsselma: Benutzerzufriedenheit (user happiness) – Antwortgeschwindigkeit/Indexgröße sind Faktoren – Aber: extrem schnelle nutzlose Antworten machen Benutzer allerdings nicht glücklich
• Weg um Benutzerzufriedenheit zu messen!?
4
Sec. 8.6
Maß für User Happiness
• Problem: wer ist der User den wir glücklich machen wollen? – Abhängig vom Se[ng
• Web Suchmaschine: – Benutzer findet was er sucht und kommt zurück
• Rate der Return User – Benutzer kann Aufgabe erledigen – Suche als MiKel, nicht als Zweck
– Vgl. Russell hKp://dmrussell.googlepages.com/JCDL-‐talk-‐June-‐2007-‐short.pdf
• eCommerce: Benutzer findet was er will und kaue – Endbenutzer oder eCommerce wessen Glück messen wir? – Können Zeit zum Kauf oder Anteil der Suchenden messen, die Käufer werden
5
Sec. 8.6.2

Messen des Nutzerglücks
• Organisa.onen (privat/öffentl./akadem.): “Produk.vität”
– Wie viel Zeit sparen die Nutzer, wenn sie nach Informa.on suchen?
– Viele andere Kriterien haben mit der Zugangseffek.vität, Sicherheit etc. zu tun
6
Sec. 8.6.2
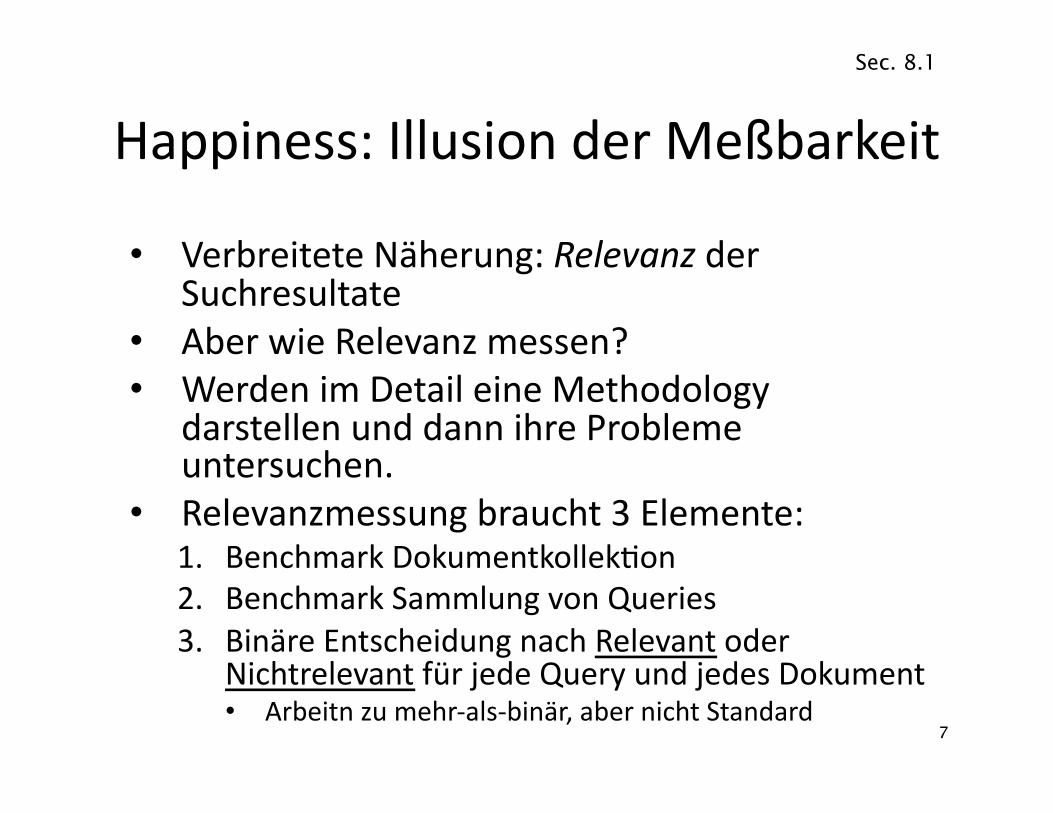
Happiness: Illusion der Meßbarkeit
• Verbreitete Näherung: Relevanz der Suchresultate
• Aber wie Relevanz messen? • Werden im Detail eine Methodology
darstellen und dann ihre Probleme untersuchen.
• Relevanzmessung braucht 3 Elemente: 1. Benchmark Dokumentkollek.on 2. Benchmark Sammlung von Queries 3. Binäre Entscheidung nach Relevant oder
Nichtrelevant für jede Query und jedes Dokument • Arbeitn zu mehr-‐als-‐binär, aber nicht Standard
7
Sec. 8.1
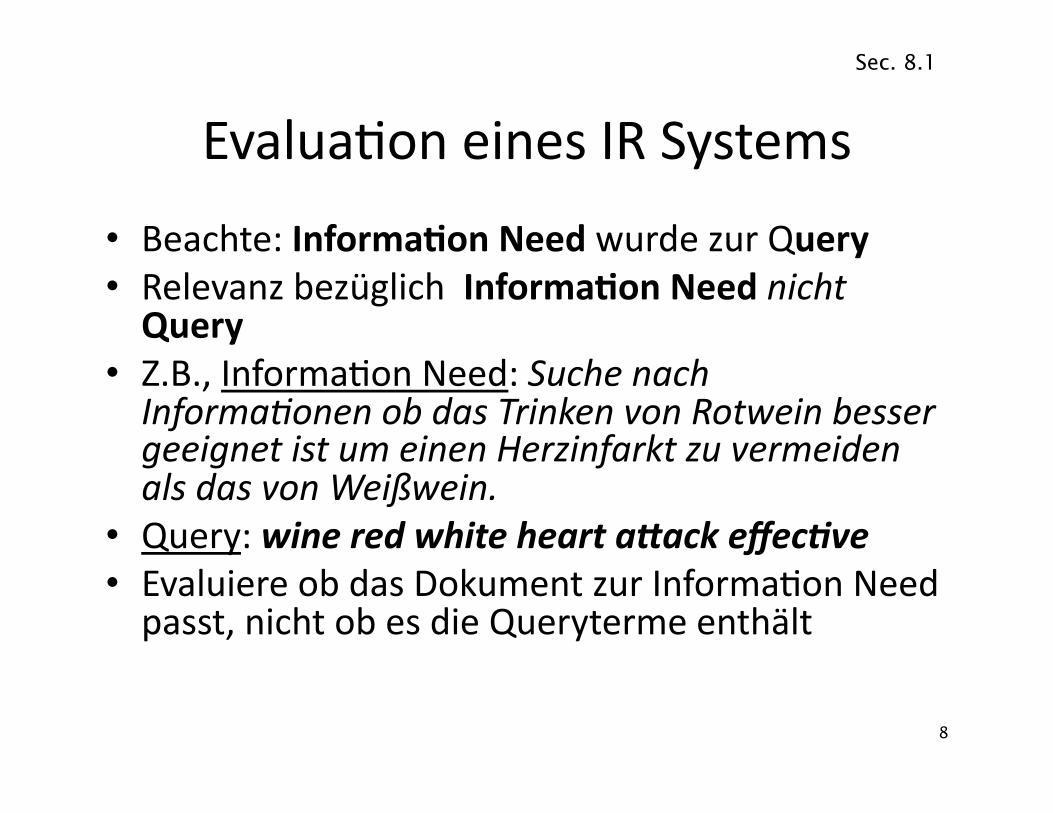
Evalua.on eines IR Systems
• Beachte: Informa6on Need wurde zur Query • Relevanz bezüglich Informa6on Need nicht Query
• Z.B., Informa.on Need: Suche nach Informa4onen ob das Trinken von Rotwein besser geeignet ist um einen Herzinfarkt zu vermeiden als das von Weißwein.
• Query: wine red white heart a+ack effec/ve • Evaluiere ob das Dokument zur Informa.on Need passt, nicht ob es die Queryterme enthält
8
Sec. 8.1
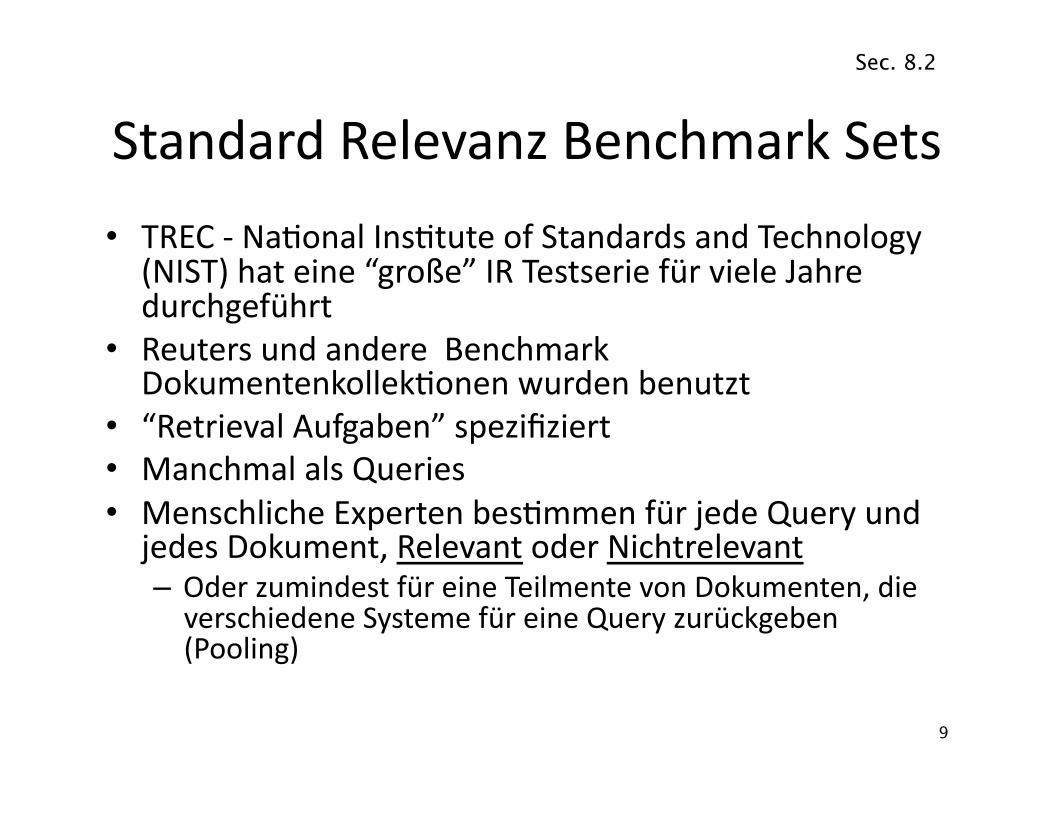
Standard Relevanz Benchmark Sets
• TREC -‐ Na.onal Ins.tute of Standards and Technology (NIST) hat eine “große” IR Testserie für viele Jahre durchgeführt
• Reuters und andere Benchmark Dokumentenkollek.onen wurden benutzt
• “Retrieval Aufgaben” spezifiziert • Manchmal als Queries • Menschliche Experten bes.mmen für jede Query und jedes Dokument, Relevant oder Nichtrelevant – Oder zumindest für eine Teilmente von Dokumenten, die verschiedene Systeme für eine Query zurückgeben (Pooling)
9
Sec. 8.2
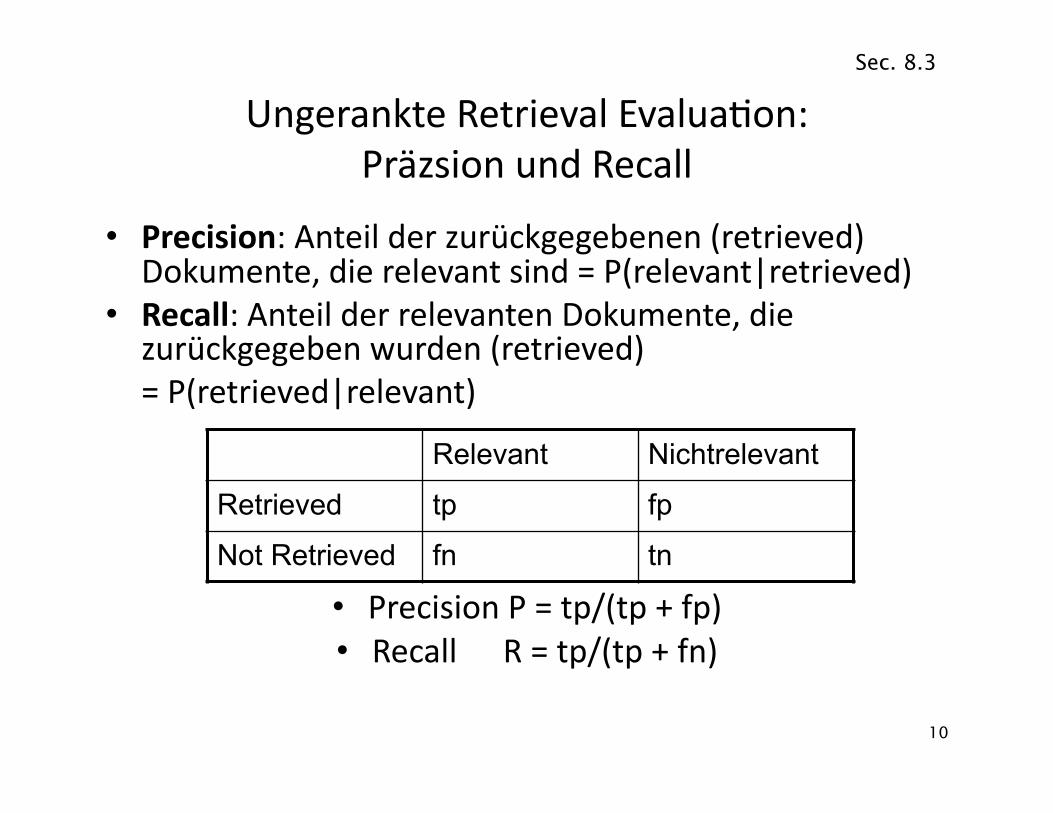
Ungerankte Retrieval Evalua.on: Präzsion und Recall
• Precision: Anteil der zurückgegebenen (retrieved) Dokumente, die relevant sind = P(relevant|retrieved)
• Recall: Anteil der relevanten Dokumente, die zurückgegeben wurden (retrieved) = P(retrieved|relevant)
• Precision P = tp/(tp + fp) • Recall R = tp/(tp + fn)
10
Relevant Nichtrelevant
Retrieved tp fp
Not Retrieved fn tn
Sec. 8.3
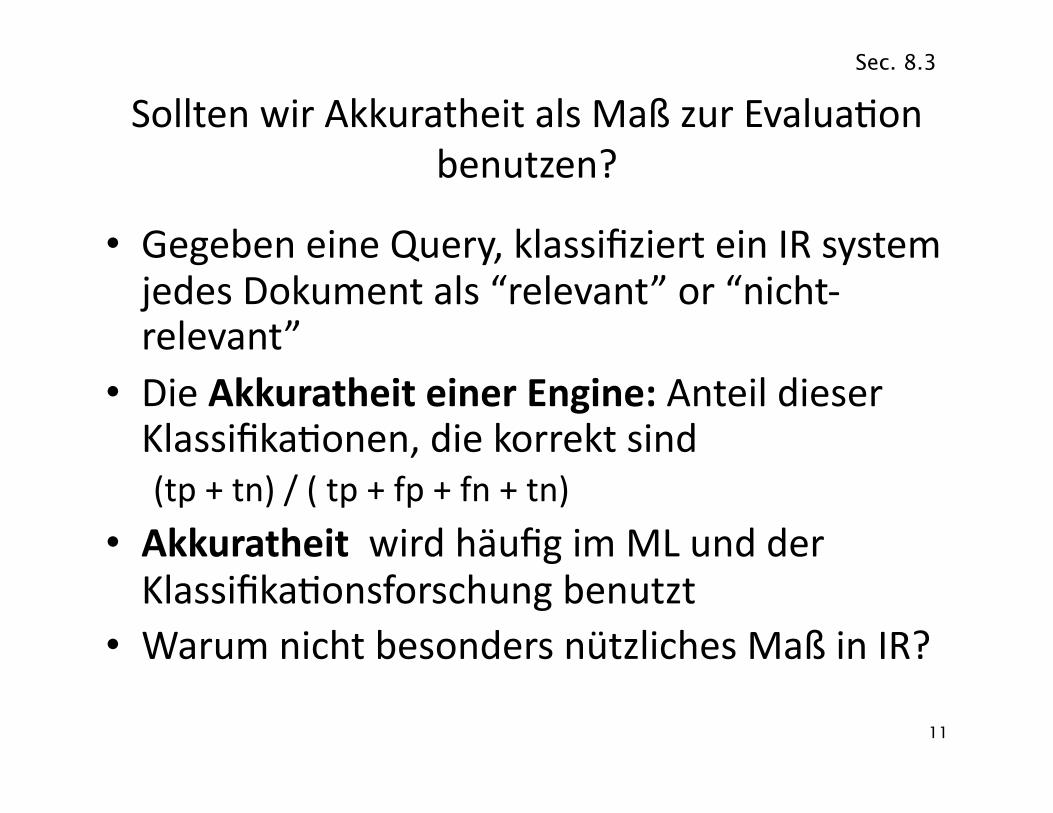
Sollten wir Akkuratheit als Maß zur Evalua.on benutzen?
• Gegeben eine Query, klassifiziert ein IR system jedes Dokument als “relevant” or “nicht-‐relevant”
• Die Akkuratheit einer Engine: Anteil dieser Klassifika.onen, die korrekt sind (tp + tn) / ( tp + fp + fn + tn)
• Akkuratheit wird häufig im ML und der Klassifika.onsforschung benutzt
• Warum nicht besonders nützliches Maß in IR?
11
Sec. 8.3
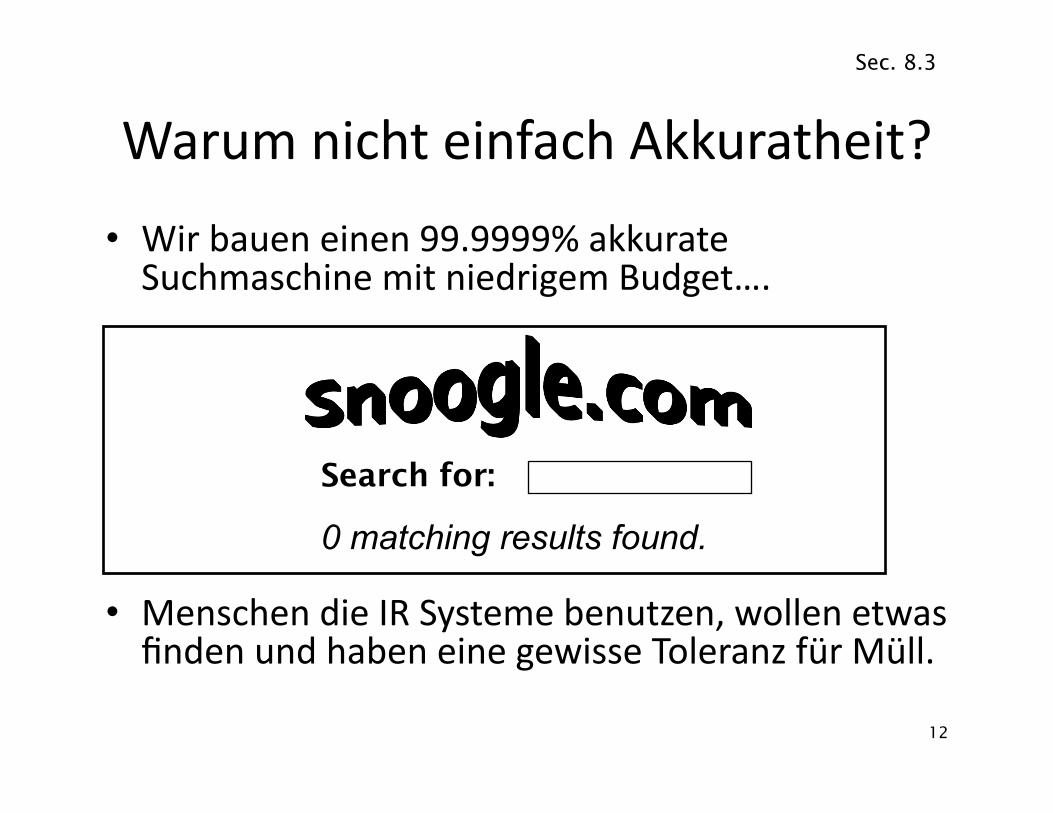
Warum nicht einfach Akkuratheit?
• Wir bauen einen 99.9999% akkurate Suchmaschine mit niedrigem Budget….
• Menschen die IR Systeme benutzen, wollen etwas finden und haben eine gewisse Toleranz für Müll.
12
Search for:
0 matching results found.
Sec. 8.3
Präzision/Recall
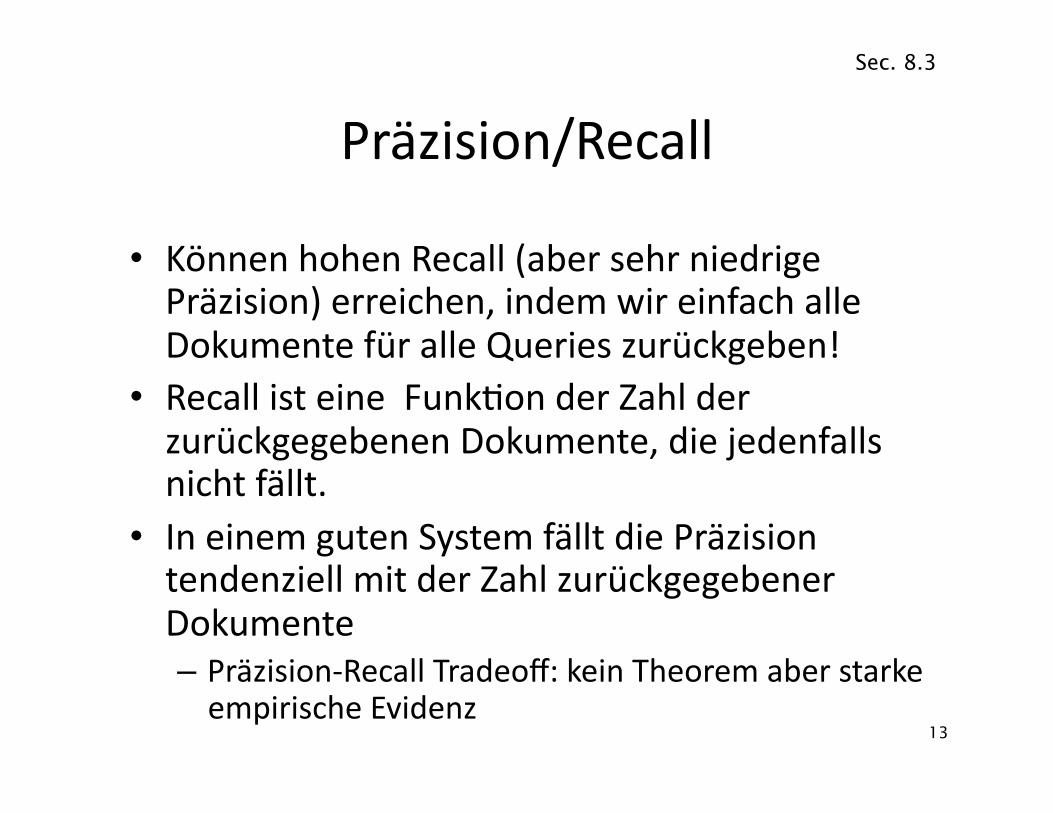
• Können hohen Recall (aber sehr niedrige Präzision) erreichen, indem wir einfach alle Dokumente für alle Queries zurückgeben!
• Recall ist eine Funk.on der Zahl der zurückgegebenen Dokumente, die jedenfalls nicht fällt.
• In einem guten System fällt die Präzision tendenziell mit der Zahl zurückgegebener Dokumente – Präzision-‐Recall Tradeoff: kein Theorem aber starke empirische Evidenz
13
Sec. 8.3
Schwierigkeiten für Präzision/Recall
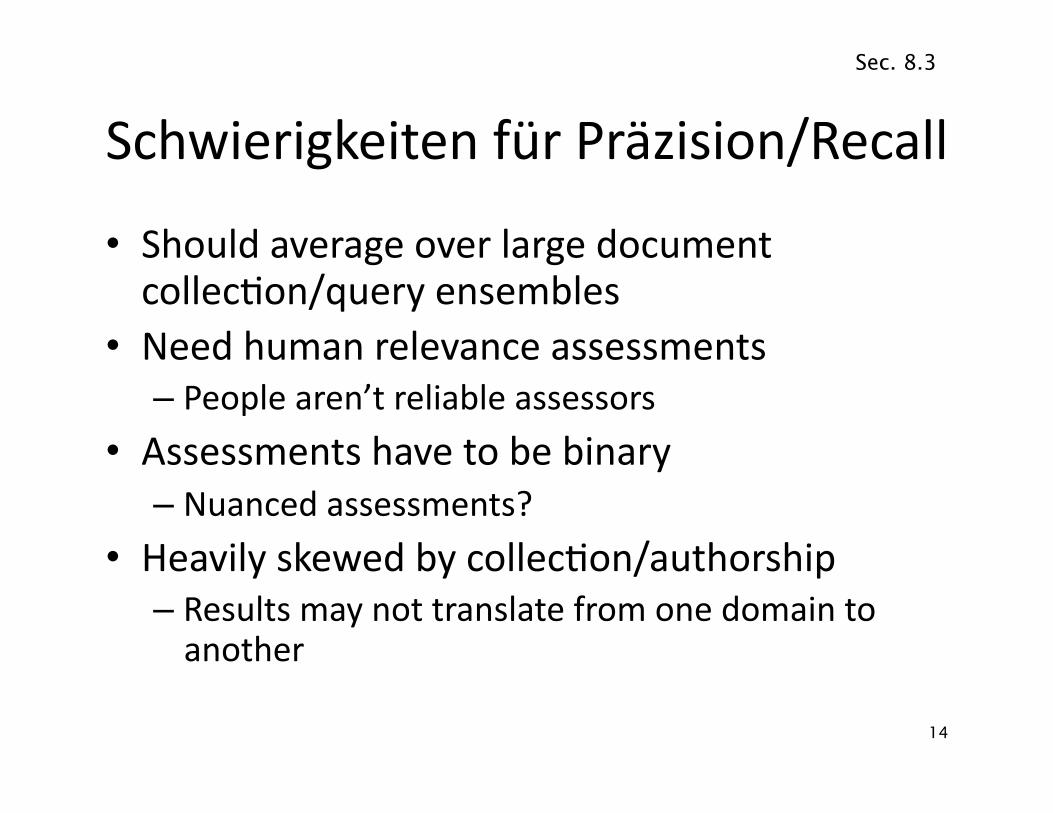
• Should average over large document collec.on/query ensembles
• Need human relevance assessments – People aren’t reliable assessors
• Assessments have to be binary – Nuanced assessments?
• Heavily skewed by collec.on/authorship – Results may not translate from one domain to another
14
Sec. 8.3
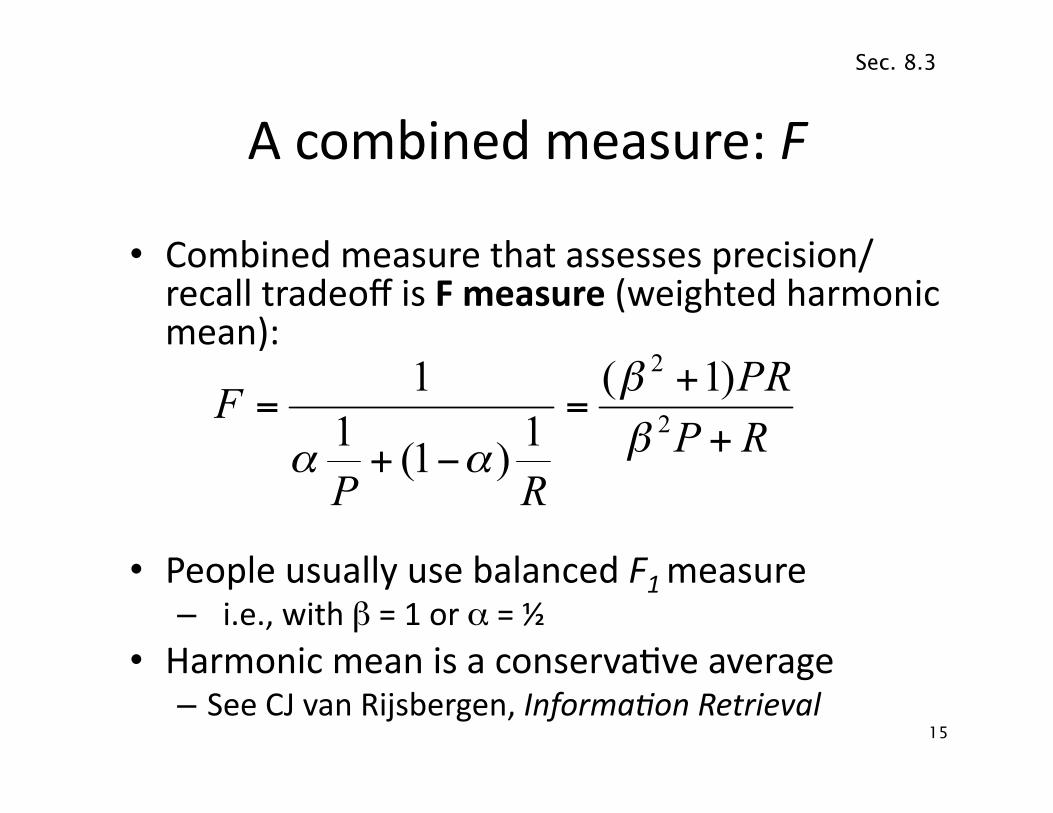
A combined measure: F
• Combined measure that assesses precision/recall tradeoff is F measure (weighted harmonic mean):
• People usually use balanced F1 measure – i.e., with β = 1 or α = ½
• Harmonic mean is a conserva.ve average – See CJ van Rijsbergen, Informa4on Retrieval
15
Sec. 8.3
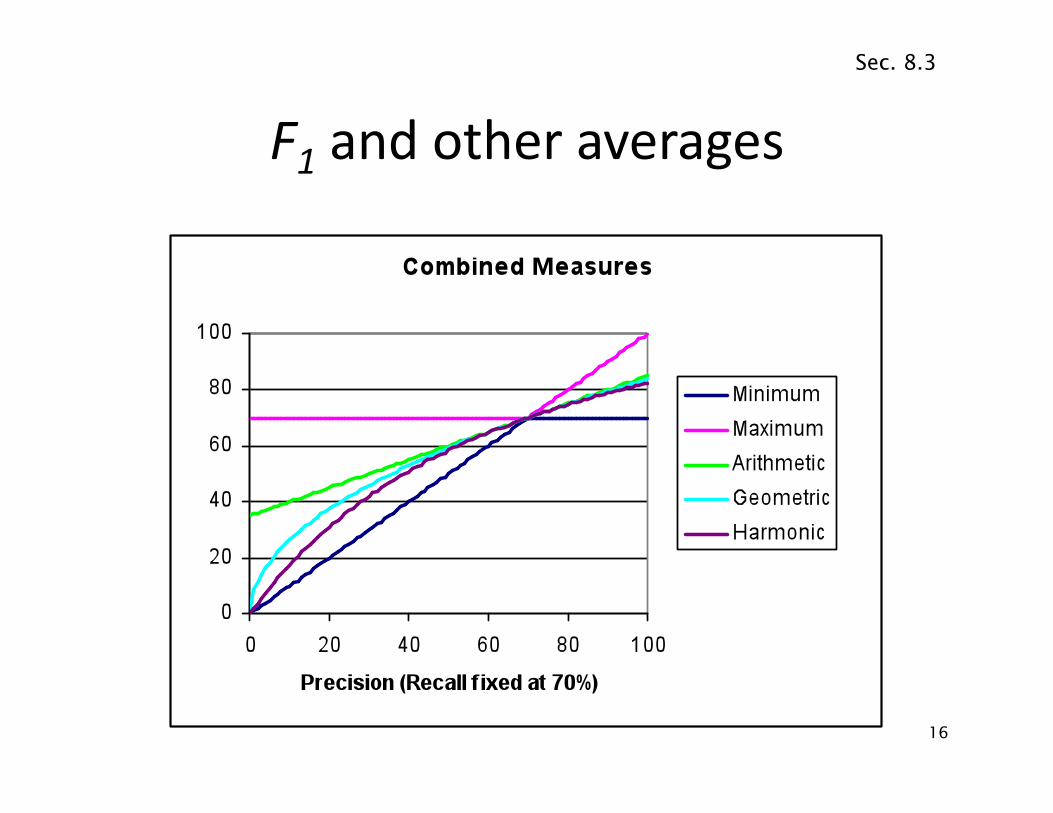
F1 and other averages
16
Sec. 8.3
Evalua.ng ranked results
• Evalua.on of ranked results: – The system can return any number of results
– By taking various numbers of the top returned documents (levels of recall), the evaluator can produce a precision-‐recall curve
17
Sec. 8.4
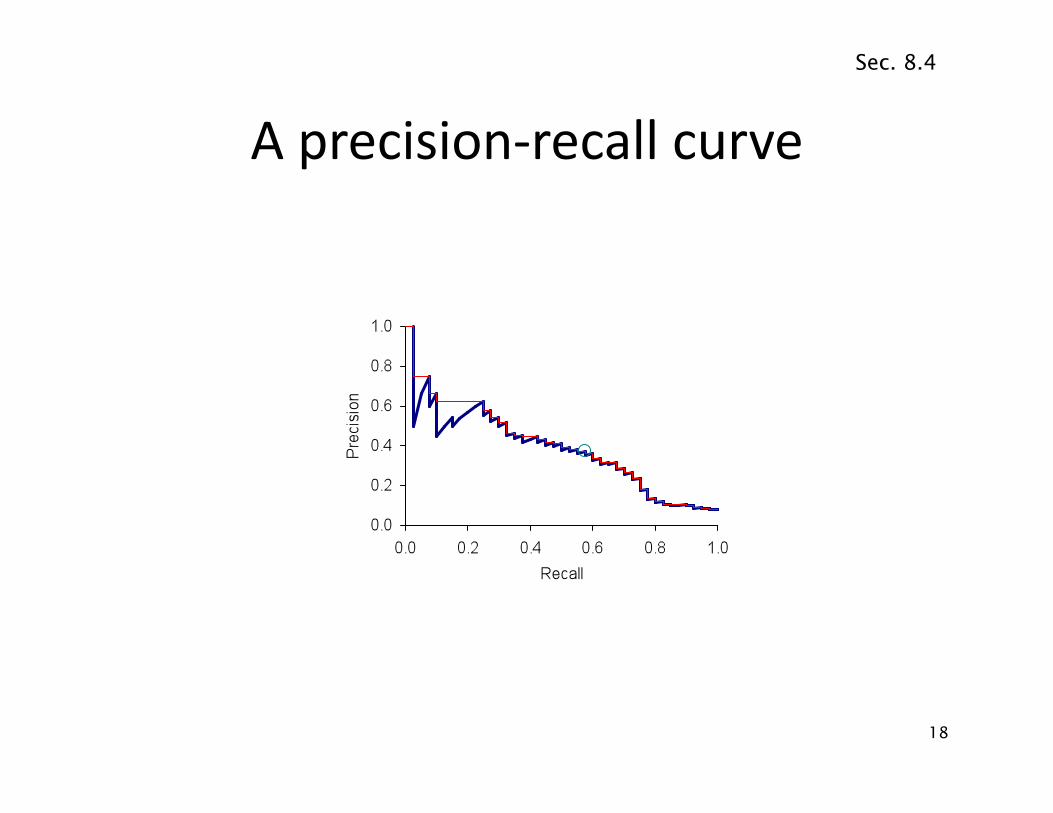
A precision-‐recall curve
18
Sec. 8.4
Averaging over queries
• A precision-‐recall graph for one query isn’t a very sensible thing to look at
• You need to average performance over a whole bunch of queries.
• But there’s a technical issue: – Precision-‐recall calcula.ons place some points on the graph
– How do you determine a value (interpolate) between the points?
19
Sec. 8.4
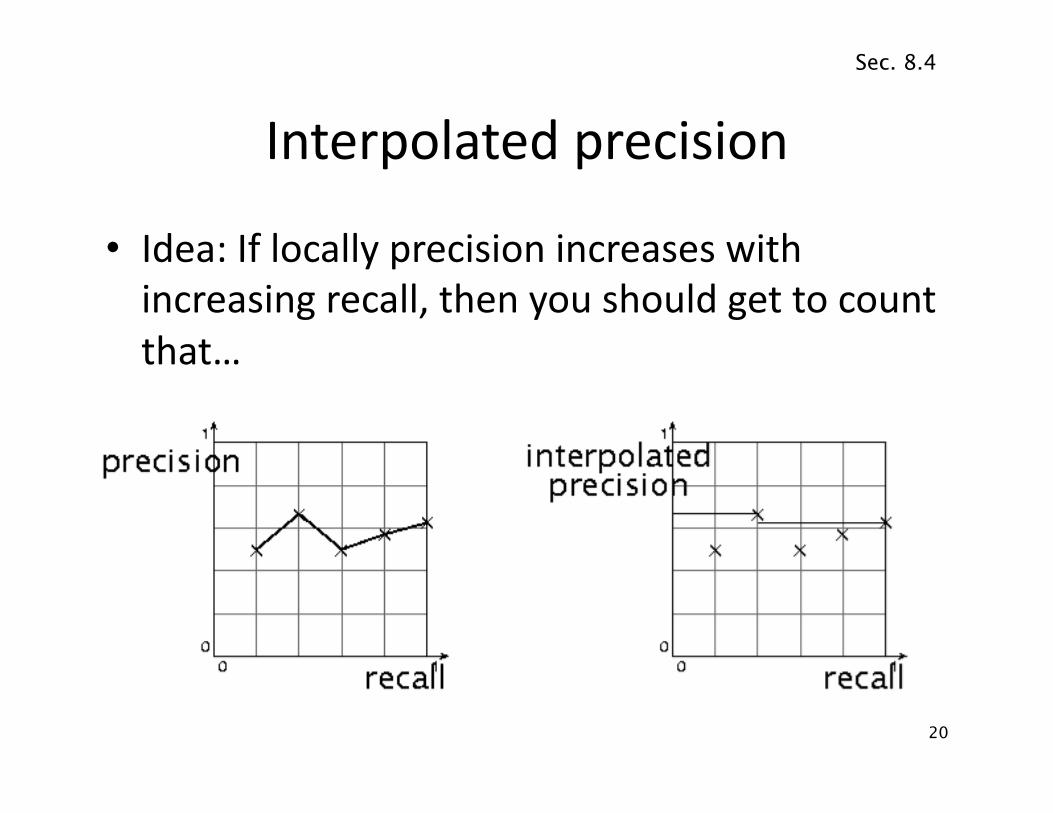
Interpolated precision
• Idea: If locally precision increases with increasing recall, then you should get to count that…
• So you take the max of precisions to right of value
20
Sec. 8.4
Evalua.on
• Graphs are good, but people want summary measures!
– Precision at fixed retrieval level • Precision-‐at-‐k: Precision of top k results • Perhaps appropriate for most of web search: all people want are good matches on the first one or two results pages
• But: averages badly and has an arbitrary parameter of k
– 11-‐point interpolated average precision • The standard measure in the early TREC compe..ons: you take the precision at 11 levels of recall varying from 0 to 1 by tenths of the documents, using interpola.on (the value for 0 is always interpolated!), and average them
• Evaluates performance at all recall levels 21
Sec. 8.4
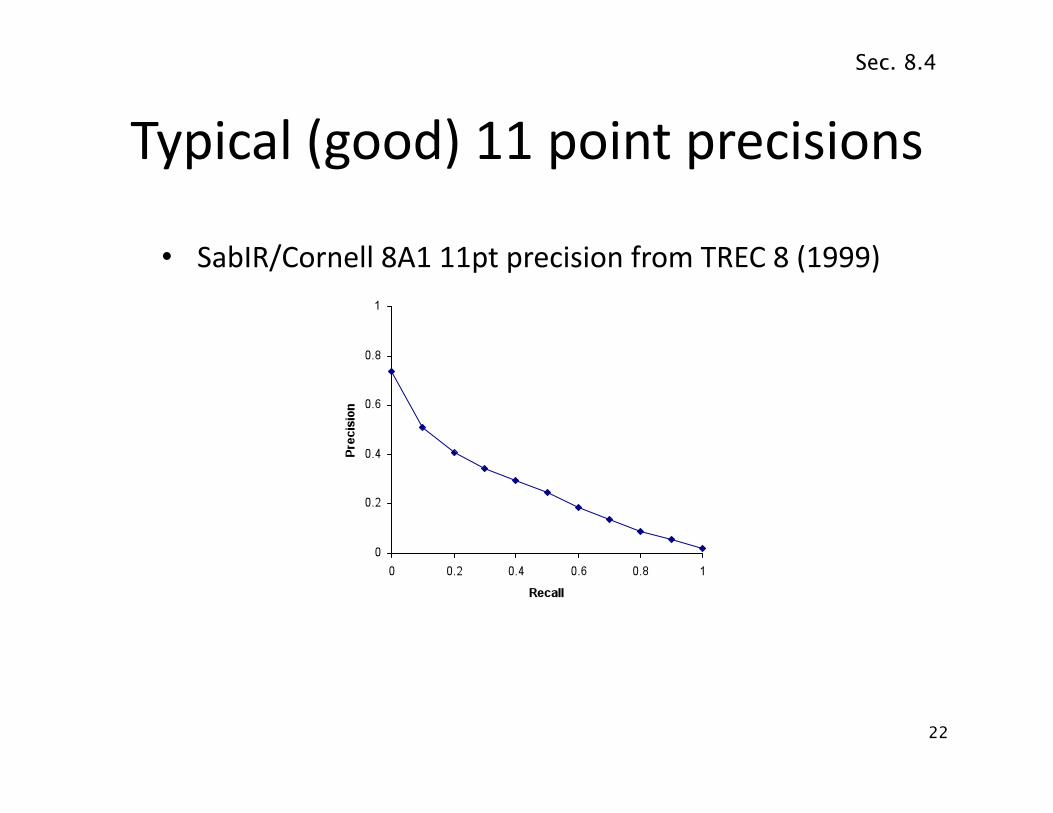
Typical (good) 11 point precisions
22
• SabIR/Cornell 8A1 11pt precision from TREC 8 (1999)
Sec. 8.4
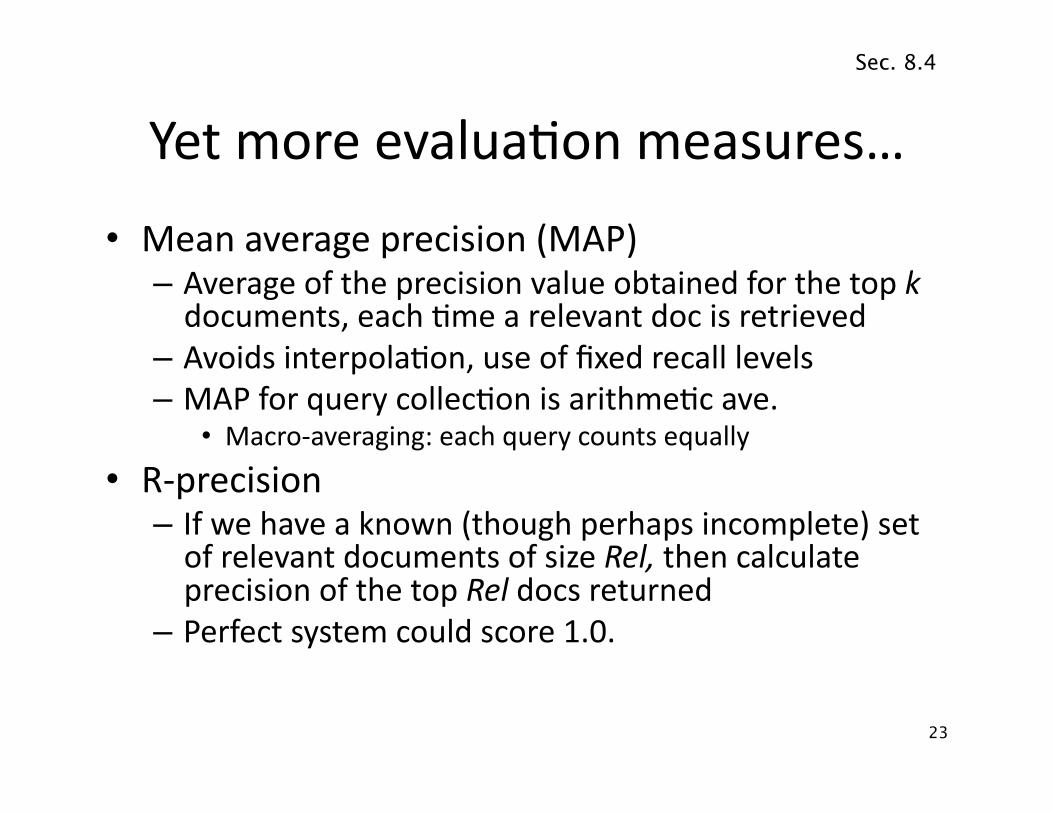
Yet more evalua.on measures…
• Mean average precision (MAP) – Average of the precision value obtained for the top k documents, each .me a relevant doc is retrieved
– Avoids interpola.on, use of fixed recall levels – MAP for query collec.on is arithme.c ave.
• Macro-‐averaging: each query counts equally
• R-‐precision – If we have a known (though perhaps incomplete) set of relevant documents of size Rel, then calculate precision of the top Rel docs returned
– Perfect system could score 1.0.
23
Sec. 8.4
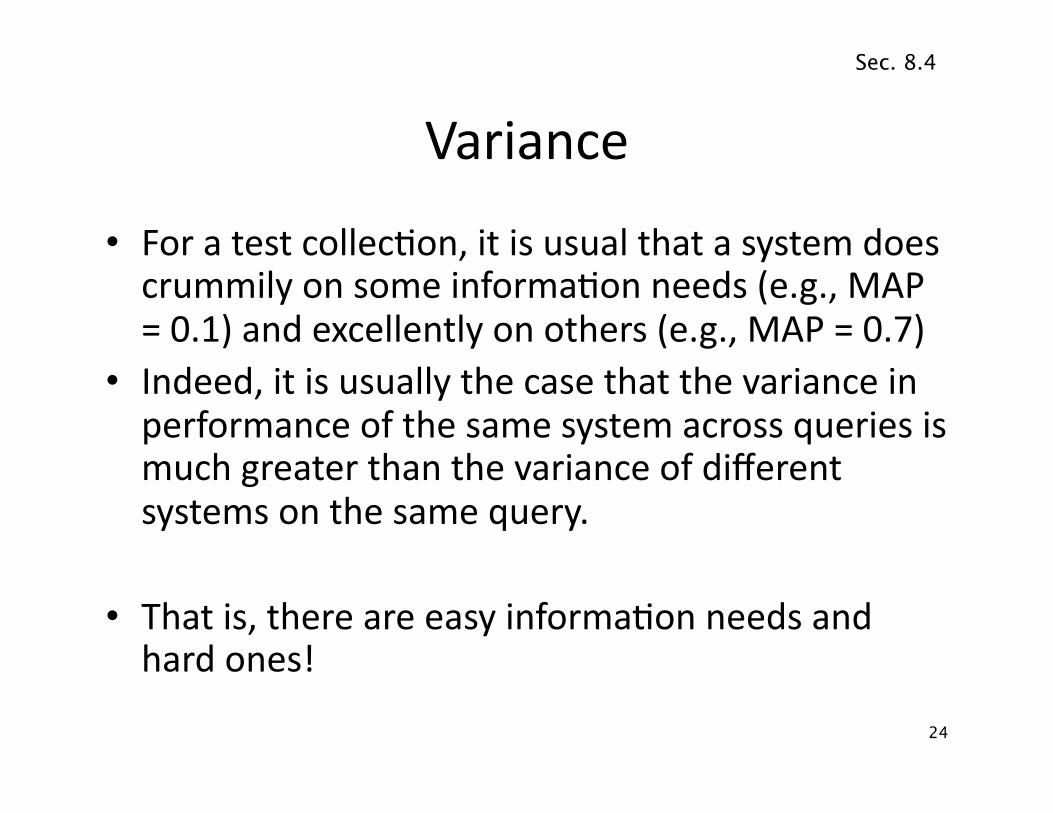
Variance
• For a test collec.on, it is usual that a system does crummily on some informa.on needs (e.g., MAP = 0.1) and excellently on others (e.g., MAP = 0.7)
• Indeed, it is usually the case that the variance in performance of the same system across queries is much greater than the variance of different systems on the same query.
• That is, there are easy informa.on needs and hard ones!
24
Sec. 8.4

CREATING TEST COLLECTIONS FOR IR EVALUATION
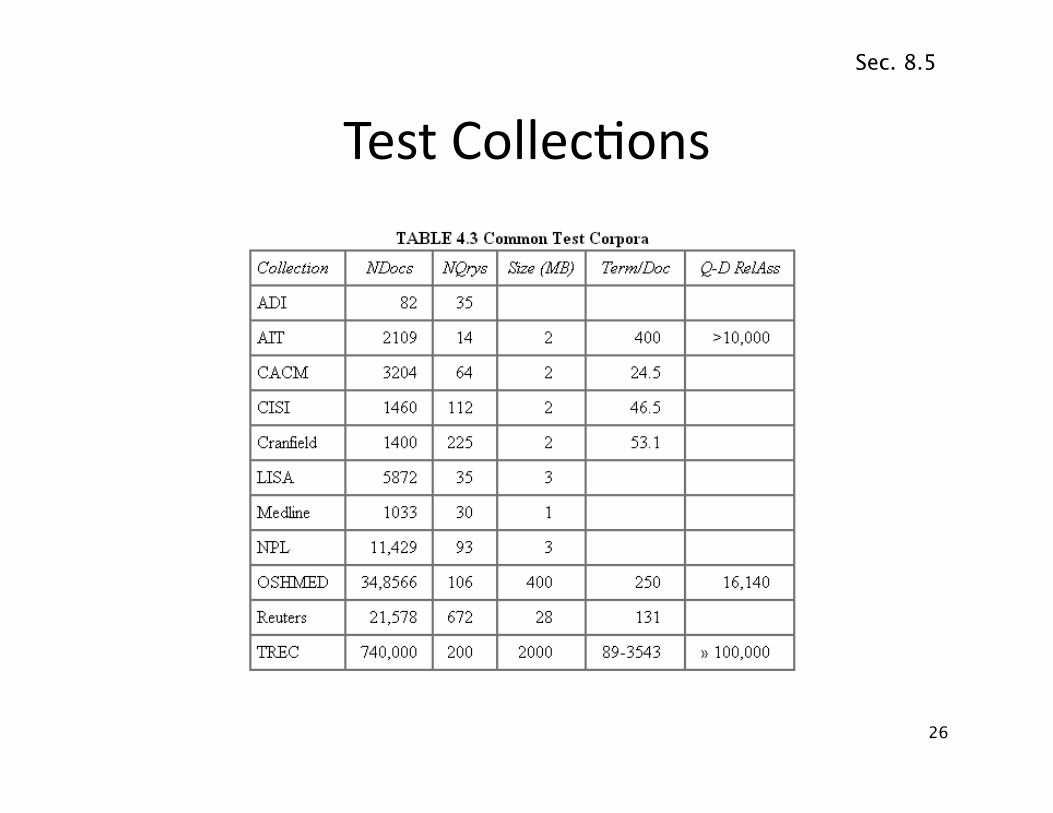
Test Collec.ons
26
Sec. 8.5
From document collec.ons to test collec.ons
• S.ll need – Test queries – Relevance assessments
• Test queries – Must be germane to docs available – Best designed by domain experts – Random query terms generally not a good idea
• Relevance assessments – Human judges, .me-‐consuming – Are human panels perfect?
27
Sec. 8.5
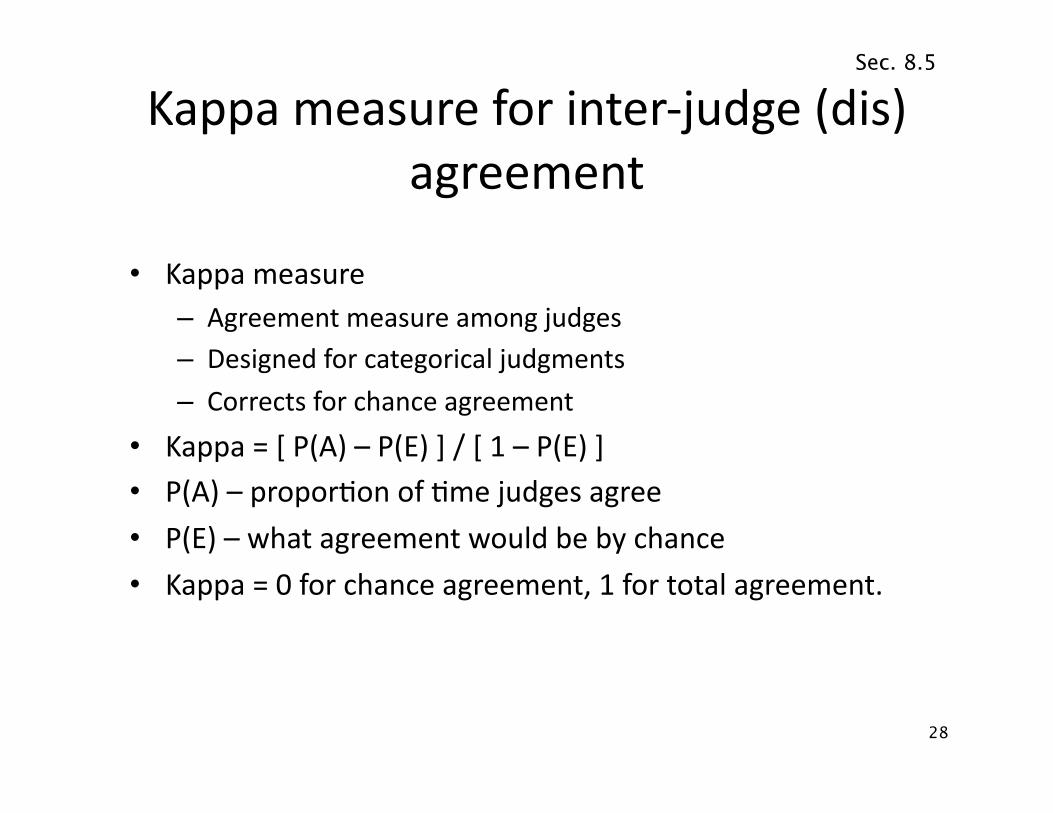
Kappa measure for inter-‐judge (dis)agreement
• Kappa measure – Agreement measure among judges – Designed for categorical judgments
– Corrects for chance agreement
• Kappa = [ P(A) – P(E) ] / [ 1 – P(E) ] • P(A) – propor.on of .me judges agree
• P(E) – what agreement would be by chance
• Kappa = 0 for chance agreement, 1 for total agreement.
28
Sec. 8.5
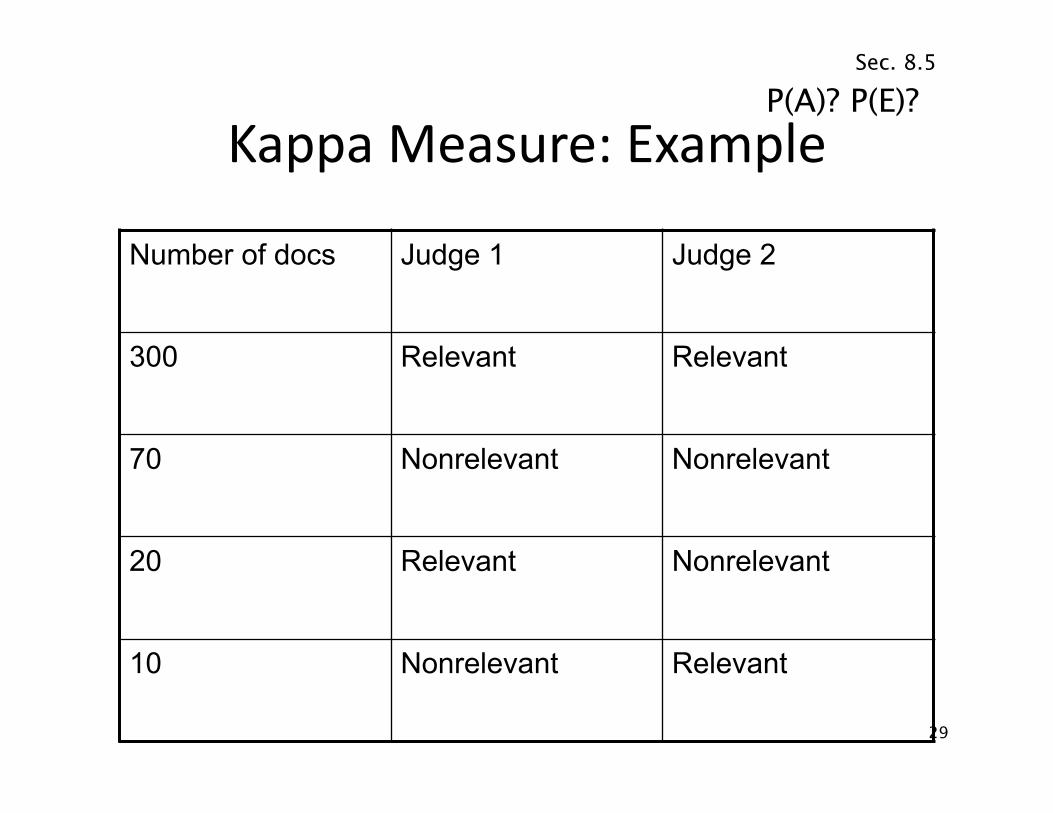
Kappa Measure: Example
Number of docs Judge 1 Judge 2
300 Relevant Relevant
70 Nonrelevant Nonrelevant
20 Relevant Nonrelevant
10 Nonrelevant Relevant
29
P(A)? P(E)? Sec. 8.5
Kappa Example
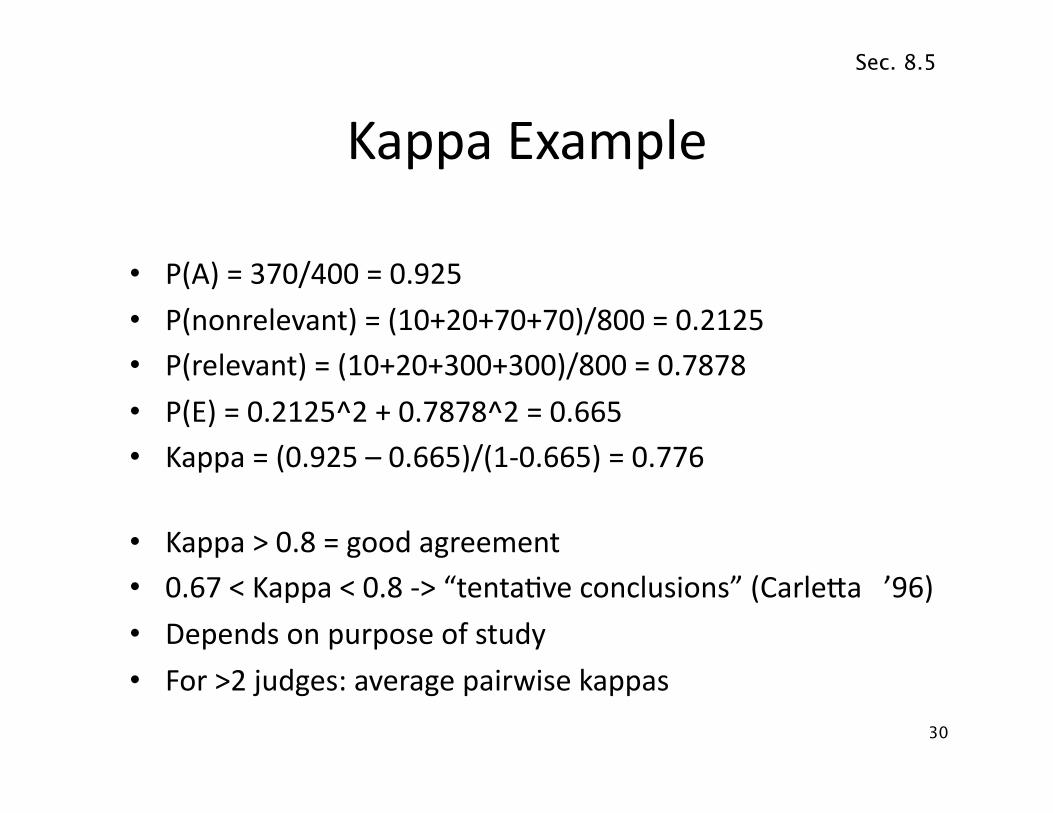
• P(A) = 370/400 = 0.925 • P(nonrelevant) = (10+20+70+70)/800 = 0.2125 • P(relevant) = (10+20+300+300)/800 = 0.7878 • P(E) = 0.2125^2 + 0.7878^2 = 0.665 • Kappa = (0.925 – 0.665)/(1-‐0.665) = 0.776
• Kappa > 0.8 = good agreement • 0.67 < Kappa < 0.8 -‐> “tenta.ve conclusions” (CarleKa ’96) • Depends on purpose of study • For >2 judges: average pairwise kappas
30
Sec. 8.5
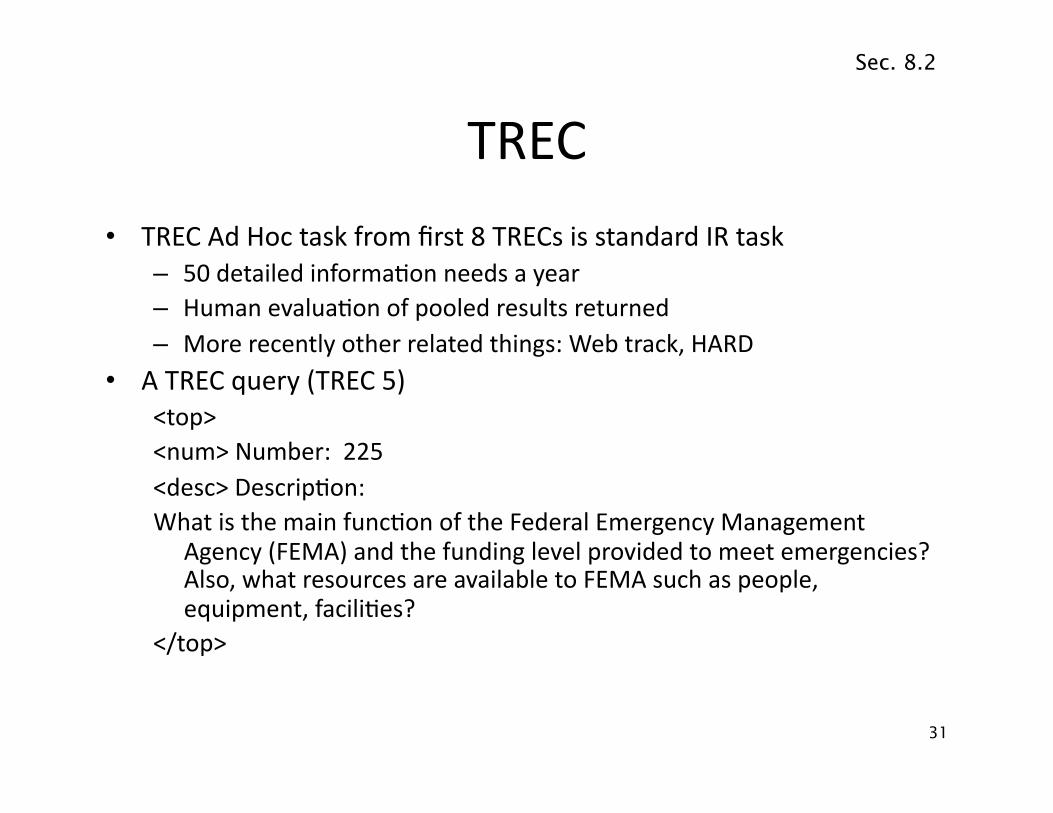
TREC
• TREC Ad Hoc task from first 8 TRECs is standard IR task – 50 detailed informa.on needs a year – Human evalua.on of pooled results returned – More recently other related things: Web track, HARD
• A TREC query (TREC 5) <top> <num> Number: 225 <desc> Descrip.on: What is the main func.on of the Federal Emergency Management
Agency (FEMA) and the funding level provided to meet emergencies? Also, what resources are available to FEMA such as people, equipment, facili.es?
</top>
31
Sec. 8.2
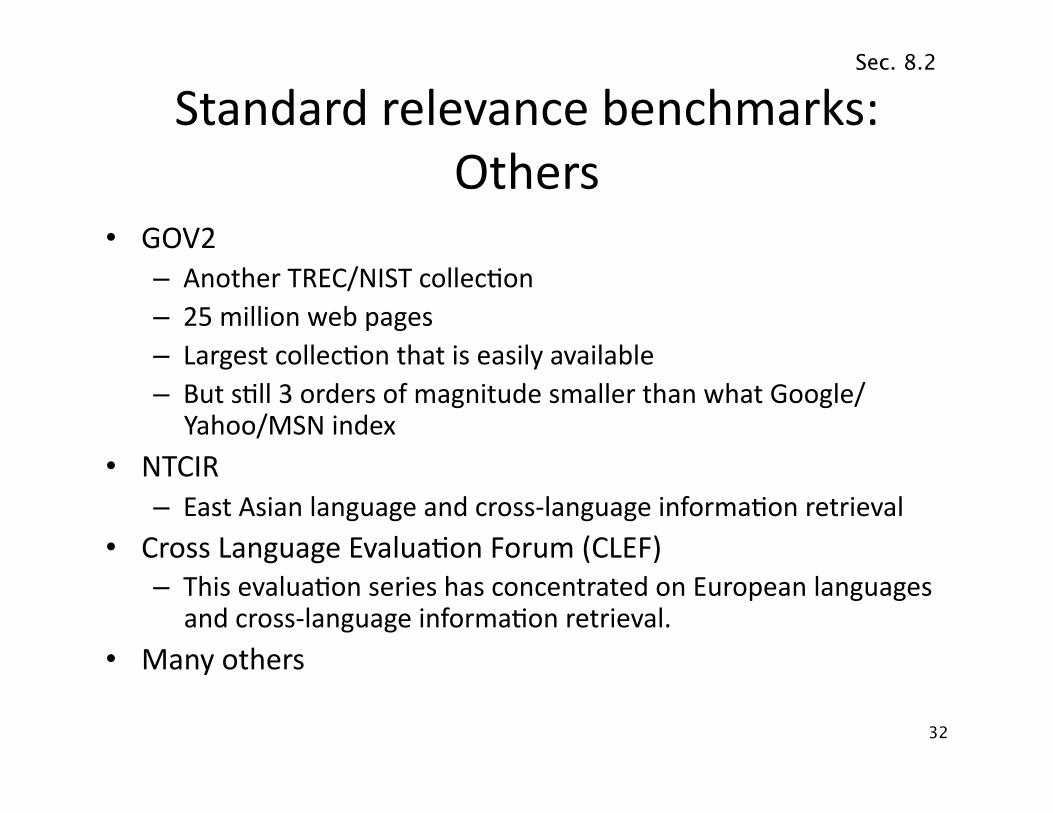
Standard relevance benchmarks: Others
• GOV2 – Another TREC/NIST collec.on – 25 million web pages – Largest collec.on that is easily available – But s.ll 3 orders of magnitude smaller than what Google/
Yahoo/MSN index
• NTCIR – East Asian language and cross-‐language informa.on retrieval
• Cross Language Evalua.on Forum (CLEF) – This evalua.on series has concentrated on European languages
and cross-‐language informa.on retrieval.
• Many others
32
Sec. 8.2
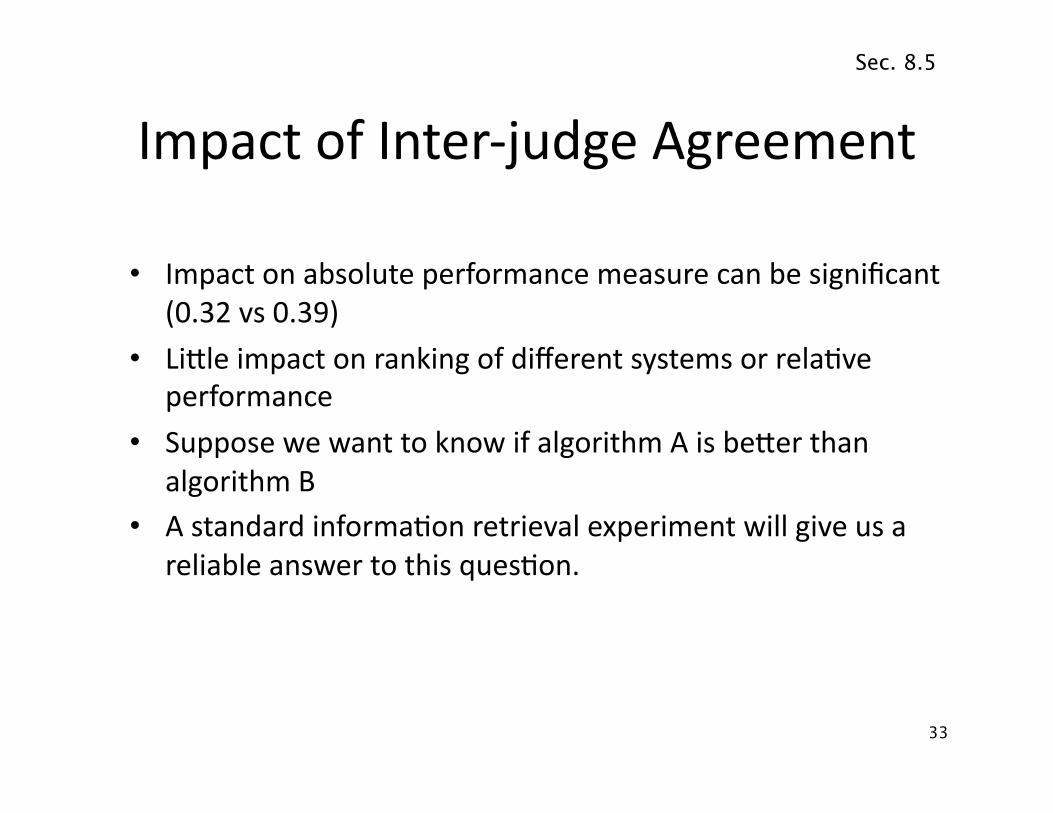
Impact of Inter-‐judge Agreement
• Impact on absolute performance measure can be significant (0.32 vs 0.39)
• LiKle impact on ranking of different systems or rela.ve performance
• Suppose we want to know if algorithm A is beKer than algorithm B
• A standard informa.on retrieval experiment will give us a reliable answer to this ques.on.
33
Sec. 8.5
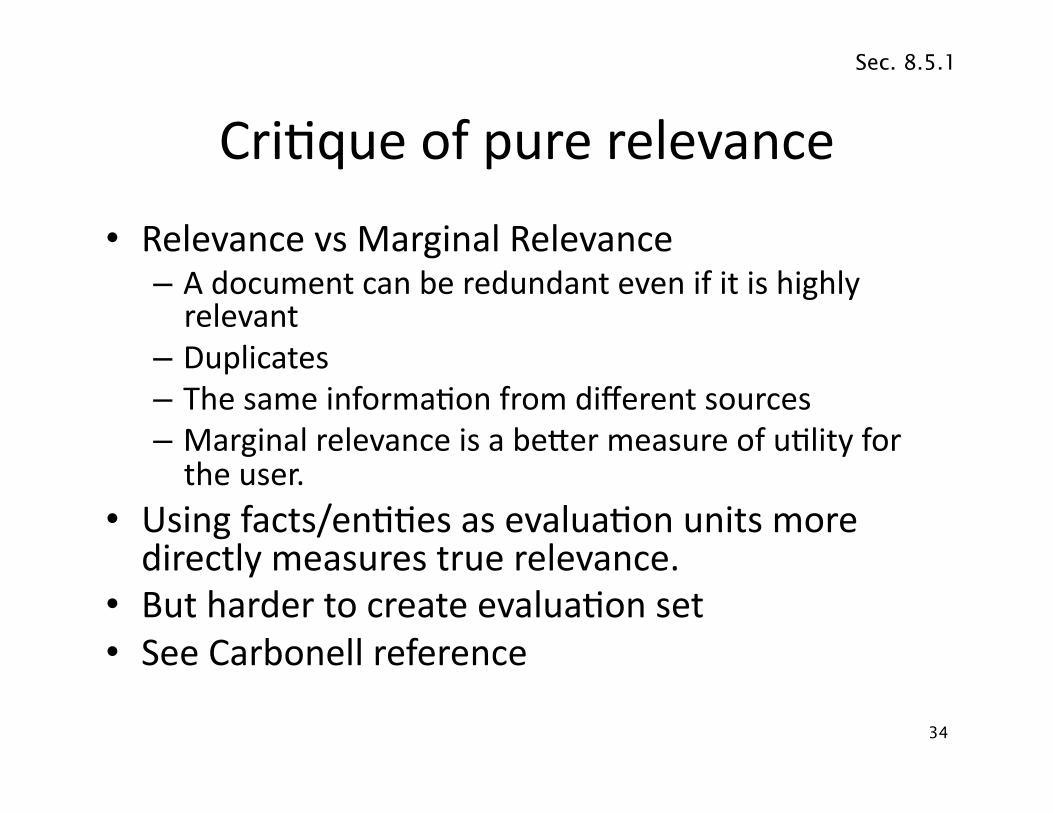
Cri.que of pure relevance
• Relevance vs Marginal Relevance – A document can be redundant even if it is highly relevant
– Duplicates – The same informa.on from different sources – Marginal relevance is a beKer measure of u.lity for the user.
• Using facts/en..es as evalua.on units more directly measures true relevance.
• But harder to create evalua.on set • See Carbonell reference
34
Sec. 8.5.1
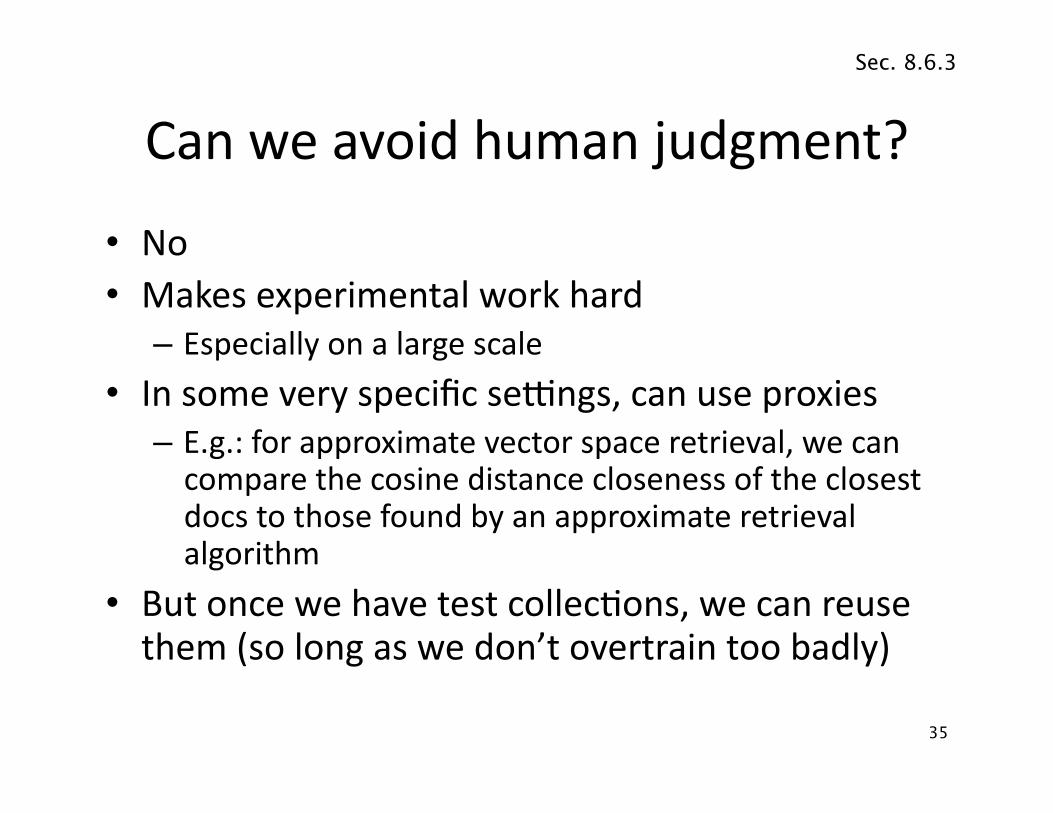
Can we avoid human judgment?
• No • Makes experimental work hard
– Especially on a large scale • In some very specific se[ngs, can use proxies
– E.g.: for approximate vector space retrieval, we can compare the cosine distance closeness of the closest docs to those found by an approximate retrieval algorithm
• But once we have test collec.ons, we can reuse them (so long as we don’t overtrain too badly)
35
Sec. 8.6.3
Evalua.on at large search engines
• Search engines have test collec.ons of queries and hand-‐ranked results
• Recall is difficult to measure on the web • Search engines oeen use precision at top k, e.g., k = 10 • . . . or measures that reward you more for ge[ng rank 1 right than
for ge[ng rank 10 right. – NDCG (Normalized Cumula.ve Discounted Gain)
• Search engines also use non-‐relevance-‐based measures. – Clickthrough on first result
• Not very reliable if you look at a single clickthrough … but preKy reliable in the aggregate.
– Studies of user behavior in the lab – A/B tes.ng
36
Sec. 8.6.3
A/B tes.ng
• Purpose: Test a single innova.on • Prerequisite: You have a large search engine up and running. • Have most users use old system • Divert a small propor.on of traffic (e.g., 1%) to the new
system that includes the innova.on • Evaluate with an “automa.c” measure like clickthrough on
first result • Now we can directly see if the innova.on does improve user
happiness. • Probably the evalua.on methodology that large search
engines trust most • In principle less powerful than doing a mul.variate regression
analysis, but easier to understand
37
Sec. 8.6.3

RESULTS PRESENTATION
38
Sec. 8.7
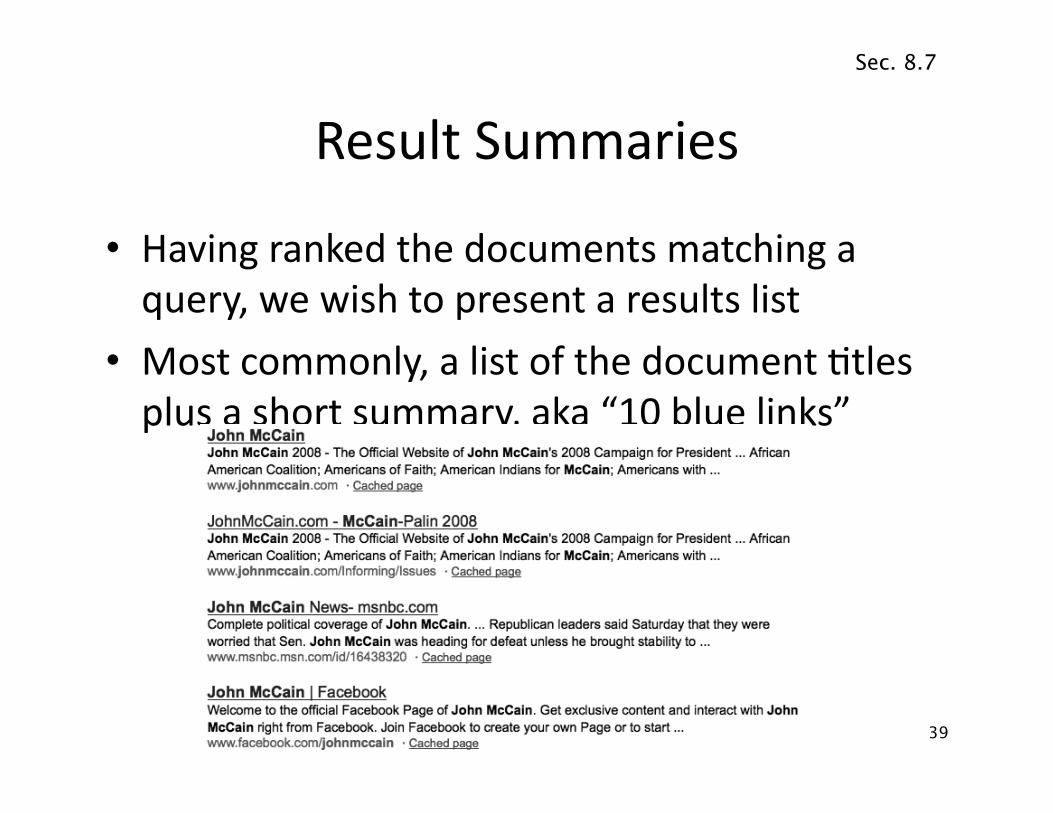
Result Summaries
• Having ranked the documents matching a query, we wish to present a results list
• Most commonly, a list of the document .tles plus a short summary, aka “10 blue links”
39
Sec. 8.7
Summaries
• The .tle is oeen automa.cally extracted from document metadata. What about the summaries? – This descrip.on is crucial. – User can iden.fy good/relevant hits based on descrip.on.
• Two basic kinds: – Sta.c – Dynamic
• A sta6c summary of a document is always the same, regardless of the query that hit the doc
• A dynamic summary is a query-‐dependent aKempt to explain why the document was retrieved for the query at hand
40
Sec. 8.7
Sta.c summaries
• In typical systems, the sta.c summary is a subset of the document
• Simplest heuris.c: the first 50 (or so – this can be varied) words of the document – Summary cached at indexing .me
• More sophis.cated: extract from each document a set of “key” sentences – Simple NLP heuris.cs to score each sentence – Summary is made up of top-‐scoring sentences.
• Most sophis.cated: NLP used to synthesize a summary – Seldom used in IR; cf. text summariza.on work
41
Sec. 8.7
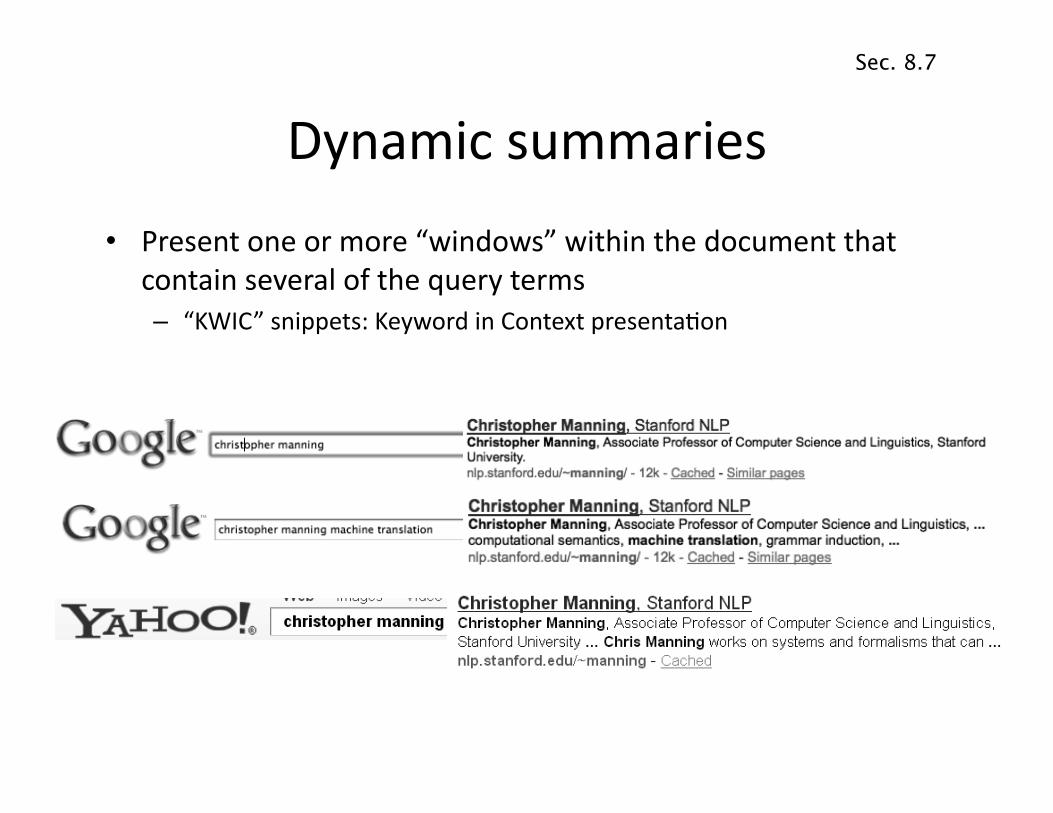
Dynamic summaries
• Present one or more “windows” within the document that contain several of the query terms – “KWIC” snippets: Keyword in Context presenta.on
42
Sec. 8.7
Techniques for dynamic summaries
• Find small windows in doc that contain query terms – Requires fast window lookup in a document cache
• Score each window wrt query – Use various features such as window width, posi.on in document, etc.
– Combine features through a scoring func.on – methodology to be covered Nov 12th
• Challenges in evalua.on: judging summaries – Easier to do pairwise comparisons rather than binary relevance assessments
43
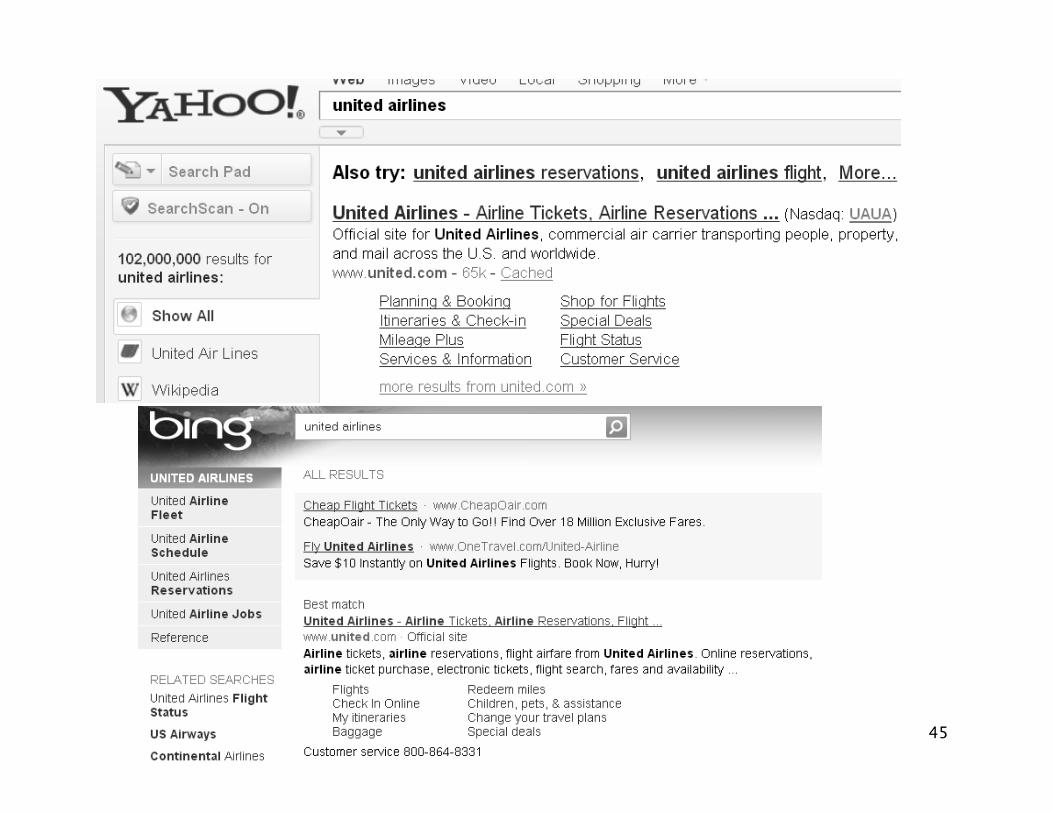
Sec. 8.7
Quicklinks
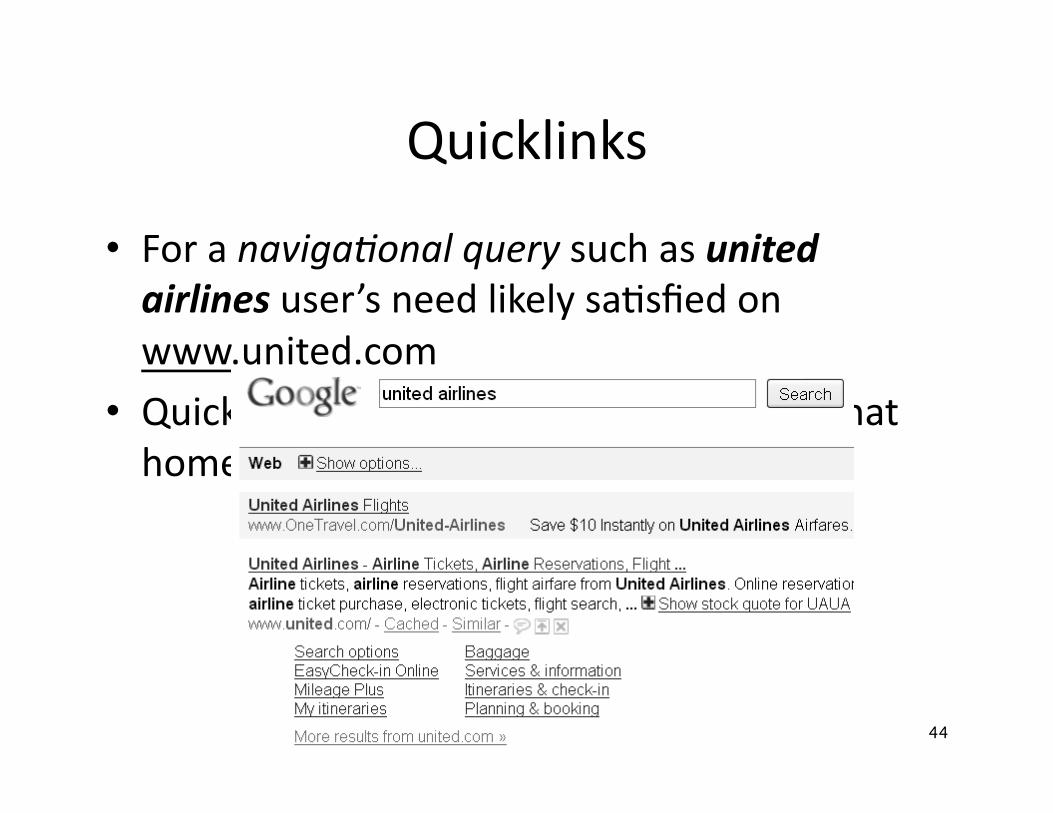
• For a naviga4onal query such as united airlines user’s need likely sa.sfied on www.united.com
• Quicklinks provide naviga.onal cues on that home page
44
45
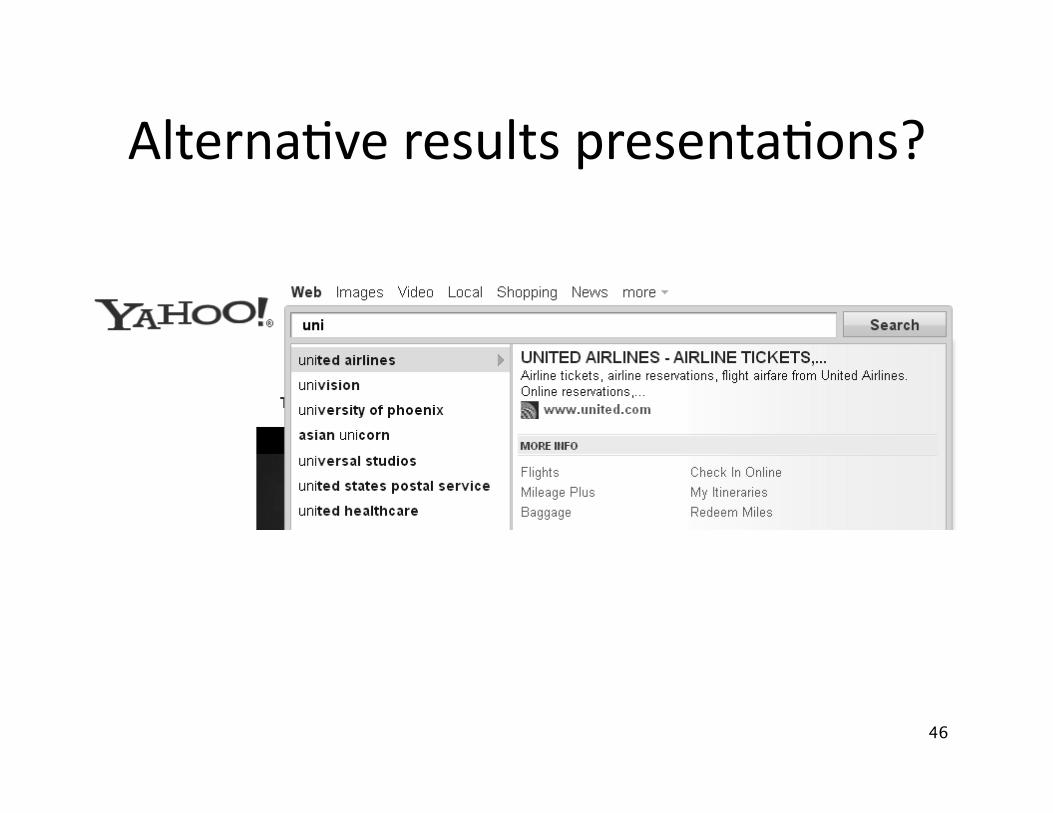
Alterna.ve results presenta.ons?
46

Resources for this lecture
• IIR 8 • MIR Chapter 3
• MG 4.5
• Carbonell and Goldstein 1998. The use of MMR, diversity-‐based reranking for reordering documents and producing summaries. SIGIR 21.
47