Structure and Architecture of Eisosomes
122
Dissertation zur Erlangung des Doktorgrades der Fakultät für Biologie der Ludwig-Maximilians-Universität München Structure and Architecture of Eisosomes vorgelegt von Lena Karotki 2012
Transcript of Structure and Architecture of Eisosomes
Dissertation zur Erlangung des Doktorgrades
der Fakultät für Biologie
der Ludwig-Maximilians-Universität München
Structure and Architecture of
Eisosomes
vorgelegt von
Lena Karotki
2012


Eidesstattliche Versicherung
Ich versichere hiermit ehrenwörtlich, dass die vorgelegte Dissertation von mir
selbstständig und ohne unerlaubte Hilfe angefertigt ist.
München, den .............................. .............................................................
(Unterschrift)
Erklärung
Hiermit erkäre ich,
□ dass die Dissertation nicht ganz oder in wesentlichen Teilen einer anderen
Prüfungskomission vorgelegt worden ist
□ dass ich mich anderweitig einer Doktorprüfung ohne Erfolg nicht unterzogen
habe
München, den .............................. .............................................................
(Unterschrift)
Diese Dissertation wurde von Prof. Dr. Stefan Jentsch betreut. Die Dissertation
wurde eingereicht am .................
1. Gutachter: Prof. Dr. Stefan Jentsch
2. Gutachter: Prof. Dr. Charles David
Tag der mündlichen Prüfung: 03.09.2012
1. Table of Contents Structure and Architecture of Eisosomes
1 | Page
1 Table of Contents
1 Table of Contents ................................................................................................ 1
2 List of Publications............................................................................................... 3
3 Abbreviations ....................................................................................................... 4
4 Summary ............................................................................................................. 6
5 Introduction .......................................................................................................... 7
5.1 The composition of the plasma membrane .................................................... 7
5.1.1 The fluid mosaic model ........................................................................... 7
5.1.2 Plasma membrane lipids ......................................................................... 9
5.1.3 Plasma membrane proteins .................................................................. 11
5.2 Plasma membrane organization .................................................................. 13
5.2.1 Macrodomain organization of the plasma membrane ........................... 13
5.2.2 Lipid rafts .............................................................................................. 15
5.2.3 Microdomains ........................................................................................ 16
5.3 Structural aspects of membrane domains ................................................... 18
5.3.1 Lipid packing and asymmetry as driving force for membrane shaping .. 19
5.3.2 Membrane shaping by proteins ............................................................. 20
5.3.3 Membrane deformation by BAR domain containing proteins ................ 21
5.4 Plasma membrane organization in yeast Saccharomyces cerevisiae ......... 26
6 Aim of the thesis ................................................................................................ 30
7 Discussion ......................................................................................................... 32
7.1 Pil1 and Lsp1 assemble into large multimeric complexes ........................... 32
7.2 Pil1 and Lsp1 bind phosphoinositides ......................................................... 36
1. Table of Contents Structure and Architecture of Eisosomes
2 | Page
7.3 Pil1 and Lsp1 sculpt membranes................................................................. 39
7.4 Pil1 and Lsp1 stabilize plasma membrane domains .................................... 44
7.5 Evolutionary conservation of eisosomes ..................................................... 45
8 References ........................................................................................................ 47
9 Acknowledgments ............................................................................................. 54
10 Curriculum vitae .............................................................................................. 55
11 Declaration of Individual Contributions ........................................................... 57
12 Reprints of the Publications ............................................................................ 58
2.List of Publications Structure and Architecture of
Eisosomes
3 | Page
2 List of Publications
Publication 1:
Wang H, Kakaradov B, Collins SR, Karotki L, Fiedler D, Shales M, Shokat KM,
Walther TC, Krogan NJ, and Koller D. (2009). A complex-based reconstruction of the
Saccharomyces cerevisiae interactome. Mol Cell Proteomics 8, 1361-1381
Publication 2:
Ziolkowska NE, Karotki L, Rehman M, Huiskonen JT, and Walther TC (2011).
Eisosome-driven plasma membrane organization is mediated by BAR domains. Nat
Struct Mol Biol 18, 854-856.
Publication 3:
Karotki L, Huiskonen JT, Stefan JS, Ziolkowska NE, Roth R, Surma MA, Krogan NJ,
Emr SD, Heuser J, Grünewald K, Walther TC (2011). Eisosome Proteins Assemble
into a Membrane Scaffold. J Cell Biol 195, 889-902.
3.Abbreviations Structure and Architecture of Eisosomes
4 | Page
3 Abbreviations
3D three dimensional
BAR Bin, Amphiphysin, Rvs161/167
CCP clathrin coated pit
CCV clathrin-coated vesicles
COP coatomer protein
cryo-ET cryo-electron tomography
DAG Diacylglycerol
DEEM deep-etch electron microscopy
EM electron microscopy
ER endoplasmatic reticulum
FCH FES-CIP4 homology
F-BAR FCH-BAR
GFP green fluorescent protein
GPI glycosylphosphatidylinositol
GUV giant unilamellar vesicle
I-BAR Inverse-BAR
IPC inositol phosphate ceramide
ld liquid-disordered
lo liquid-ordered
LPC lysophosphatidylcholine
M(IP2)C mannosyl-diinositolphosphate-ceramide
MCC membrane compartment containing Can1
3.Abbreviations Structure and Architecture of Eisosomes
5 | Page
MCP membrane compartment containing Pma1
MCT membrane compartment of TORC2
MDCK Madin-Darby canine kidney
MIPC mannosyl-inositolphosphate-ceramide
NBD nitrobenzoxadizole
PA phosphatidic acid
PC phosphatidylcholine
PE phosphatidylethanolamine
PH domain Pleckstrin homology domain
PI phosphatidylinositol
PI(3)P phosphoinositol-3-phosphate
PI(4)P phosphoinositol-4-phosphate
PI(4,5)P2 phosphoinositol-4,5-bisphosphate
PS phosphatidylserine
S.cerevisiae Saccharomyces cerevisiae
SM sphingomyelin
SNXs sorting nexins
SPT single particle tracking
TGN trans-Golgi network
TORC2 target of rapamycin complex 2
4. Summary Structure and Architecture of Eisosomes
6 | Page
4 Summary
The plasma membrane is a fundamental feature of life, since it constitutes the
boundary between the cell and its environment. To coordinate the various different
reactions occuring there, it is highly dynamic and its constituents are organized into
domains of distinct protein and lipid composition.This lateral compartmentalization is
at least partially mediated by huge protein complexes, termed eisosomes, which
localize in a uniform punctuate pattern at the plasma membrane and are mainly
composed of two proteins, Pil1 and Lsp1. Essential questions towards an
understanding of eisosome-mediated plasma membane organization refer to their
molecular architecture as well as to the mechanism mediating the lateral segregation
of proteins and lipids into distinct compartments. In order to answer these questions,
the work of my thesis characterizes the structure and architecture of eisosomes at
several levels of resolution in vitro and in vivo. Using a combination of different
biochemical and electron microscopy (EM) approaches, I show that eisosome
proteins Pil1 and Lsp1 self-assemble into higher order structures, such as thin
filaments and helices. Furthermore, both proteins Pil1 and Lsp1 directly bind and
deform preferentially PI(4,5)P2-containing membranes into long tubules. By fitting of
the crystal structure of a stable core domain of Lsp1 (named “Lsp1 ASIA”) into 3D
models of eisosome proteins bound to membranes, I unveil the mechanism how
these proteins self-assemble and bind to membranes and pinpoint amino acids that
are essential in this process. Using these EM-derived 3D models of Pil1 and Lsp1, I
demonstrate that these structures resemble eisosomes in vivo, From these data, I
introduce a model, explaining how eisosomes are molecularly built and how they
organize the plasma membrane by self-assembly into a protein scaffold that directly
binds and deforms membranes with lipid-binding-specificity. Beyond the immediate
gain of knowledge, characterization of eisosomes will most likely have an impact on
our understanding of self assembly systems and how they organize cellular structure,
and ultimately how that is used to regulate plasma membrane organization and
endocytosis.
5. Introduction Structure and Architecture of Eisosomes
7 | Page
5 Introduction
5.1 The composition of the plasma membrane
The plasma membrane constitutes the boundary between the cell and its
environment. As such, it is a fundamental feature of life and crucial for a broad variety
of functions, such as cell polarity establishment, cell motility or nutrient absorption. To
achieve these many tasks, the plasma membrane is highly dynamic and its
composition has to be constantly remodeled according to need. Consequently, the
presence of receptors, transporters or signaling molecules achieves tight regulation,
by a delicate interplay of proteins and lipids within the plasma membrane.
5.1.1 The fluid mosaic model
In 1972 Singer and Nicolson proposed a concept for membrane organization
called “fluid mosaic model”, which describes biological membranes as two-
dimensional solutions consisting of globular proteins that freely diffuse in a
phopsholipid bilayer (Singer and Nicolson, 1972). The concept is based on general
thermodynamic considerations about membranes and their components and involves
two kinds of non-covalent interactions, hydrophobic and hydrophilic. Hydrophobic
interactions are responsible for sequestering non-polar groups away from water,
while hydrophilic interactions lead to the preference of ionic and polar groups for an
aqueous environment. Cellular membranes consist mostly of amphipathic
phospholipids, which comprise of hydrophobic moieties, the fatty acyl chains and a
hydrophilic head group, which can be differently charged. According to
thermodynamics, matter prefers to maintain a low energy state, which places certain
restrictions on models for membrane structure. Since hydrophobic and hydrophilic
interactions have to be maximized, the two leaflets associate in a way that two
phospholipid fatty acid tails face towards each other, thereby being sequestered
away from contact with water. In contrast, their hydrophilic headgroups are in direct
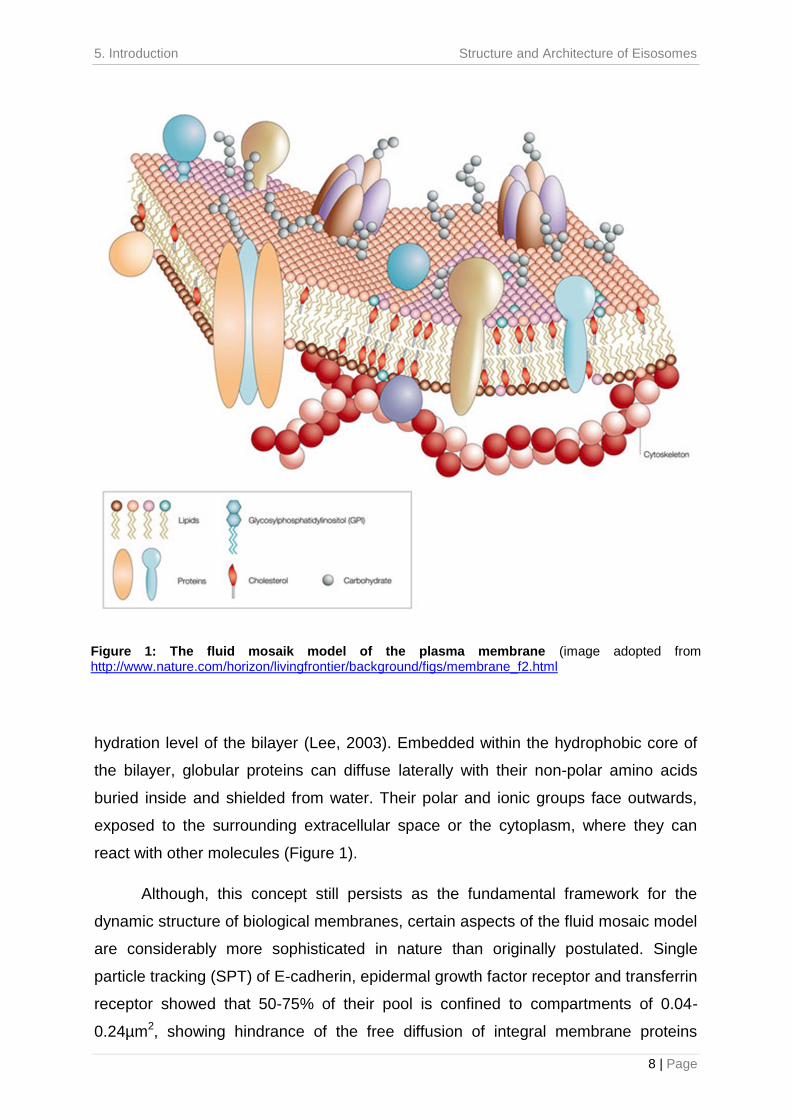
contact with the aqueous phase on the exterior surfaces (Figure 1). As such, lipid
bilayers are sufficiently stabilized by non-covalent forces and do not require covalent
interactions between individual molecules. The hydrophobic core of this lipid bilayer
is estimated to be ~30Å thick, but varies depending on the chemical composition and
5. Introduction Structure and Architecture of Eisosomes
8 | Page
hydration level of the bilayer (Lee, 2003). Embedded within the hydrophobic core of
the bilayer, globular proteins can diffuse laterally with their non-polar amino acids
buried inside and shielded from water. Their polar and ionic groups face outwards,
exposed to the surrounding extracellular space or the cytoplasm, where they can
react with other molecules (Figure 1).
Although, this concept still persists as the fundamental framework for the
dynamic structure of biological membranes, certain aspects of the fluid mosaic model
are considerably more sophisticated in nature than originally postulated. Single
particle tracking (SPT) of E-cadherin, epidermal growth factor receptor and transferrin
receptor showed that 50-75% of their pool is confined to compartments of 0.04-
0.24µm2, showing hindrance of the free diffusion of integral membrane proteins
Figure 1: The fluid mosaik model of the plasma membrane (image adopted from http://www.nature.com/horizon/livingfrontier/background/figs/membrane_f2.html
5. Introduction Structure and Architecture of Eisosomes
9 | Page
(Kusumi et al., 1993). Consistent with this observation, research during the last two
decades showed increasing evidence that membranes exhibit lateral heterogeneity.
Biological membranes are not passive solvents of amphipathic proteins and
lipids, but rather exhibit inhomogeneous distribution. It is the unique dynamics of the
multicomponent lipid bilayer that gives cell membranes their specific properties. To
fully understand the complex principles behind their dynamics, requires detailed
characterization of the various lipid types constituting the membrane and furthermore,
their interactions with each other as well as membrane proteins, respectively.
5.1.2 Plasma membrane lipids
Lipids and their metabolites play an important role in regulation and control of
cellular function and disease. Cells combine structural properties as well as signaling
functions of lipids to orchestrate their many membrane related functions. Therefore,
cellular membranes are composed of a complex mixture of different lipid types.
These different lipid types vary in their chemical constitution, so that alternating
compositions of constituents have an impact on the physical character of a
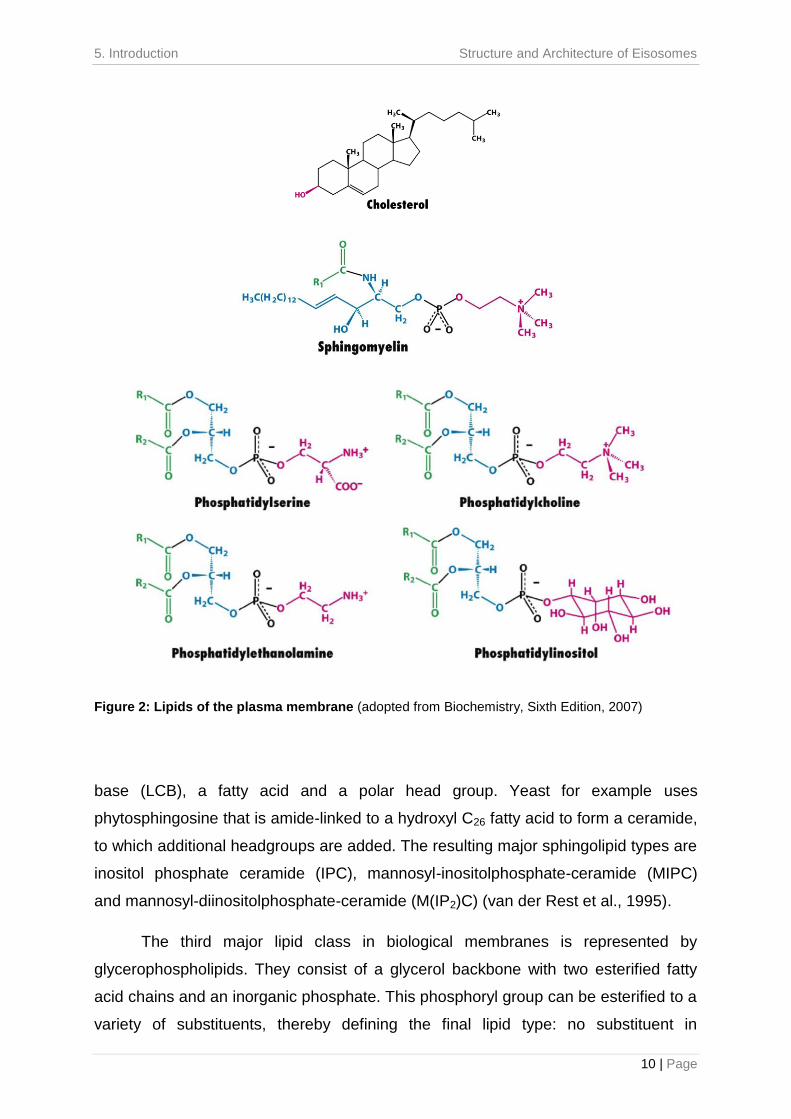
membrane. Specifically, cellular lipids can be classified into three major classes:
sterols, sphingolipids and glycerolipids (Figure 2) (van der Rest et al., 1995).
An abundant lipid species in cellular membranes is constituted by sterols.
Structurally, they are compact, hydrophobic molecules, consisting of a rigid four-ring
system backbone, a non-polar hydrocarbon tail and a single hydroxyl group forming
the polar head group. Their presence in the plasma membrane leads to tighter lateral
packing of neighboring lipids, so that plasma membrane fluidity as well as
permeability for polar molecules is decreased. Based on their impact on fluidity,
sterols are important regulators of biophysical membrane characteristics and could
also have an impact on the lateral movement of proteins in the membrane (Daum et
al., 1998).
Sphingolipids are ubiquitously present in the plasma membrane and constitute
30% of the total phospholipid content. Additionally, they play a role as second
messengers for regulating signal transduction involved in cell growth control,
endocytosis, actin cytoskeleton regulation and cell wall integrity (Dickson et al., 2006;
van der Rest et al., 1995). Chemically, they are composed of a sphingoid long-chain
5. Introduction Structure and Architecture of Eisosomes
10 | Page
base (LCB), a fatty acid and a polar head group. Yeast for example uses
phytosphingosine that is amide-linked to a hydroxyl C26 fatty acid to form a ceramide,
to which additional headgroups are added. The resulting major sphingolipid types are
inositol phosphate ceramide (IPC), mannosyl-inositolphosphate-ceramide (MIPC)
and mannosyl-diinositolphosphate-ceramide (M(IP2)C) (van der Rest et al., 1995).
The third major lipid class in biological membranes is represented by
glycerophospholipids. They consist of a glycerol backbone with two esterified fatty
acid chains and an inorganic phosphate. This phosphoryl group can be esterified to a
variety of substituents, thereby defining the final lipid type: no substituent in
Figure 2: Lipids of the plasma membrane (adopted from Biochemistry, Sixth Edition, 2007)
5. Introduction Structure and Architecture of Eisosomes
11 | Page
phosphatidic acid (PA), choline in phosphatidylcholine (PC), ethanolamine in
phosphatidylethanolamine (PE), serine in phosphatidylserine (PS) or myo-inositol in
phosphatidylinositol (PI) (van der Rest et al., 1995). The inositol ring of PI can
furthermore be subject to covalent modification by PI kinases and phosphatases,
attaching and removing phosphate groups. PI and its phosphorylated derivatives are
key regulators of cell growth and survival, membrane trafficking and cytoskeletal
dynamics (Di Paolo and De Camilli, 2006; Hurley, 2006; Lemmon, 2008; Roth, 2004).
Specific PI derivatives can be considered as organelle marker, that can be targeted
to individual intracellular compartments by recognition of the unique arrangement of
phosphate groups around the inositol ring: for example the plasma membrane is
enriched in phosphoinositol-4,5-bisphosphate (PI(4,5)P2), whereas phosphoinositol-
4-phosphate (PI(4)P) and phosphoinositol-3-phosphate (PI(3)P) are primarily in the
Golgi and early endosomes, respectively (Kutateladze, 2010).
5.1.3 Plasma membrane proteins
The mass ratio of proteins to lipids in the plasma membrane depends on the
specific cell type and function, but is on average 1:1. In general, membrane proteins
can be classified into two major categories: integral (intrinsic) and peripheral
(extrinsic) proteins, with the category being defined by the membrane-protein
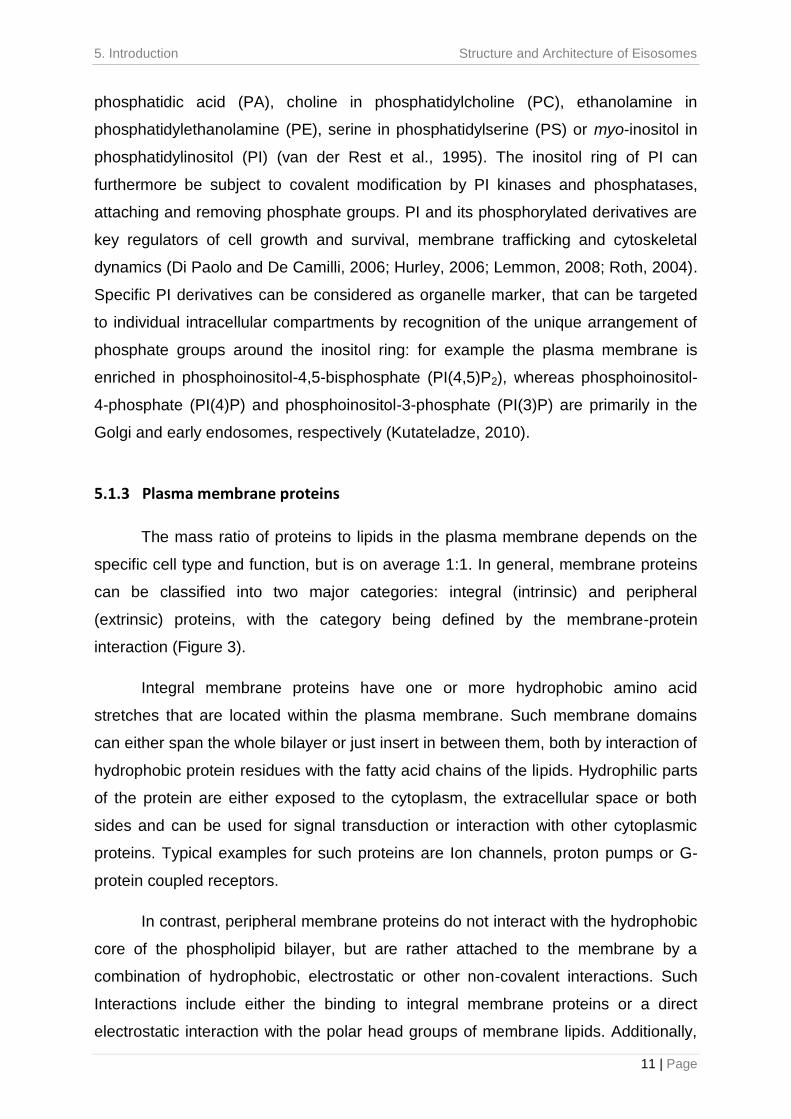
interaction (Figure 3).
Integral membrane proteins have one or more hydrophobic amino acid
stretches that are located within the plasma membrane. Such membrane domains
can either span the whole bilayer or just insert in between them, both by interaction of
hydrophobic protein residues with the fatty acid chains of the lipids. Hydrophilic parts
of the protein are either exposed to the cytoplasm, the extracellular space or both
sides and can be used for signal transduction or interaction with other cytoplasmic
proteins. Typical examples for such proteins are Ion channels, proton pumps or G-
protein coupled receptors.
In contrast, peripheral membrane proteins do not interact with the hydrophobic
core of the phospholipid bilayer, but are rather attached to the membrane by a
combination of hydrophobic, electrostatic or other non-covalent interactions. Such
Interactions include either the binding to integral membrane proteins or a direct
electrostatic interaction with the polar head groups of membrane lipids. Additionally,
5. Introduction Structure and Architecture of Eisosomes
12 | Page
fatty acid acyl chains, such as glycosylphosphatidylinositol (GPI) function as anchors
in the plasma membrane, to covalently attach proteins by palmitoylation,
myristoylation or penylation (Levental et al., 2010). Such lipid modifications regulate
function and cellular localization of G-proteins. One example is palmitoylation of
members of the Src family of tyrosine kinases, which is required for localization to
specific plasma membrane domains, termed caveolae (Lisanti et al., 1994;
Sargiacomo et al., 1993; Shenoy-Scaria et al., 1994). As an alternative approach to
GPI anchors, proteins comprise defined membrane-targeting domains that interact
with specific lipids in the membrane. Among them, the pleckstrin homology (PH)
domain was the first such domain found to associate specifically with PI(4,5)P2
(Harlan et al., 1994; Haslam et al., 1993; Mayer et al., 1993). To date, PH domains
have been identified ubiquitously, for example in cytoskeletal proteins, such as
dynamin or regulators of small G-proteins, for eample Cdc24 in S. cerevisiae
(Toenjes et al., 1999). Other examples of membrane-targeting domains include the
PX domain, which preferentially binds to PI(3)P-enriched membranes, such as
endosomes and vacuoles (Seet and Hong, 2006; Yu and Lemmon, 2001). The
largest group of PX domain containing proteins comprises sorting nexins (SNXs),
which are found to participate in endosomal sorting and trafficking in yeast and
mammalian cells (Seet and Hong, 2006; Xu et al., 2001).
Figure 3: Membrane proteins associate with membranes in different ways. Membrane proteins can contain lipid-spanning domains (single or multipass) or be anchored by lipid-modifications. Additionally, cytoplasmic proteins can associate with the membrane directly or embedded proteins from the inner or outer side of the membrane (adopted from http://www.utm.utoronto.ca).
5. Introduction Structure and Architecture of Eisosomes
13 | Page
5.2 Plasma membrane organization
Cellular membranes display a tremendous complexity of lipids and proteins to
perform their many tasks. To simultaneously coordinate these processes, cells have
the ability to laterally segregate biochemical reactions and thus to locally increase
molecular components, promoting the efficiency of their performance (Lajoie et al.,
2009; Lingwood and Simons, 2010). Such compartmentalization occurs on several
cellular levels.
5.2.1 Macrodomain organization of the plasma membrane
Macrodomain organization is a fundamental feature to segregate plasma
membranes into distinct reaction compartments. These reaction compartments
comprise different lipid and protein composition and may vary in their morphology,
features which are in close relationship to their function. Examples of such
macrodomain formation include membranes of axons and dentrites in neurons,
lamellipodia in fibroblasts or the growing bud in Saccharomyces cerevisiae (S.
cerevisiae) (Carmosino et al., 2010). However, the best-studied example so far is
epithelial cells, such as Madin-Darby canine kidney (MDCK) cells, which specialize
their surface into two distinct domains: the apical and the basolateral plasma
membrane. These surfaces vary significantly in their function and are also
biochemically distinct. While the apical membrane is enriched in sphingolipids, the
basolateral domain contains mostly the glycerophospholipid PC (Simons and van
Meer, 1988; van Meer, 1989). Besides their lipid composition, also different proteins
are targeted to these surfaces in order to efficiently perform the required functions at
the destined surface.
Generation and maintenance of such large-scale domain organization requires
the presence of a highly specialized cellular machinery that regulates continuous
sorting of newly synthesized components and controls their internalization (Matter,
2000; Mellman, 1996; Nelson and Yeaman, 2001). For example, apical polarized
protein traffic is regulated by intrinsic protein sorting signals. According to these
signals, proteins emerge from the trans-Golgi network (TGN) in different post-Golgi
carriers (Guerriero et al., 2008; Jacob et al., 2003) and navigate through distinct
subsets of endosomal compartments to their final destination (Hoekstra et al., 2004;
5. Introduction Structure and Architecture of Eisosomes
14 | Page
Weisz and Rodriguez-Boulan, 2009). Additionally, proteins such as Rab GTPases
are crucially involved in defining the trafficking routes of these transport carriers, e.g.
Rab11a is present on apical recycling endosomes, where it modulates export to the
apical membrane (Lapierre et al., 2001; Roland et al., 2007). In contrast, Rab8 and
Rab10 participate in basolateral targeting (Babbey et al., 2006; Schuck et al., 2007).
Studies on the temporal coordination of vesicular transport in mammalian cells
revealed a new layer of organization. Temperature shift to 20°C blocks vesicular
delivery from the Golgi complex and leads to accumulation of fluorescently labeled
sphingolipids and surface proteins in this compartment (van Meer et al., 1987).
Strikingly, release of this temperature-induced block showed that trapped lipids and
proteins leave this compartment together and appear at the appropriate epithelial
surface with similar kinetics (Matlin and Simons, 1984; Pfeiffer et al., 1985; van Meer
et al., 1987). Based on this observation, Simons and vanMeer postulated that not
only proteins but also lipids are presorted in the TGN, in order to be transported
collectively within the same carrier vesicles to their target membrane (Simons and
van Meer, 1988). This was the biochemical basis for the so called “lipid raft”
hypothesis. It posits that lateral self-organization of lipids together with proteins
induces sub-compartmentalization to organize bioactivity of cellular membranes,
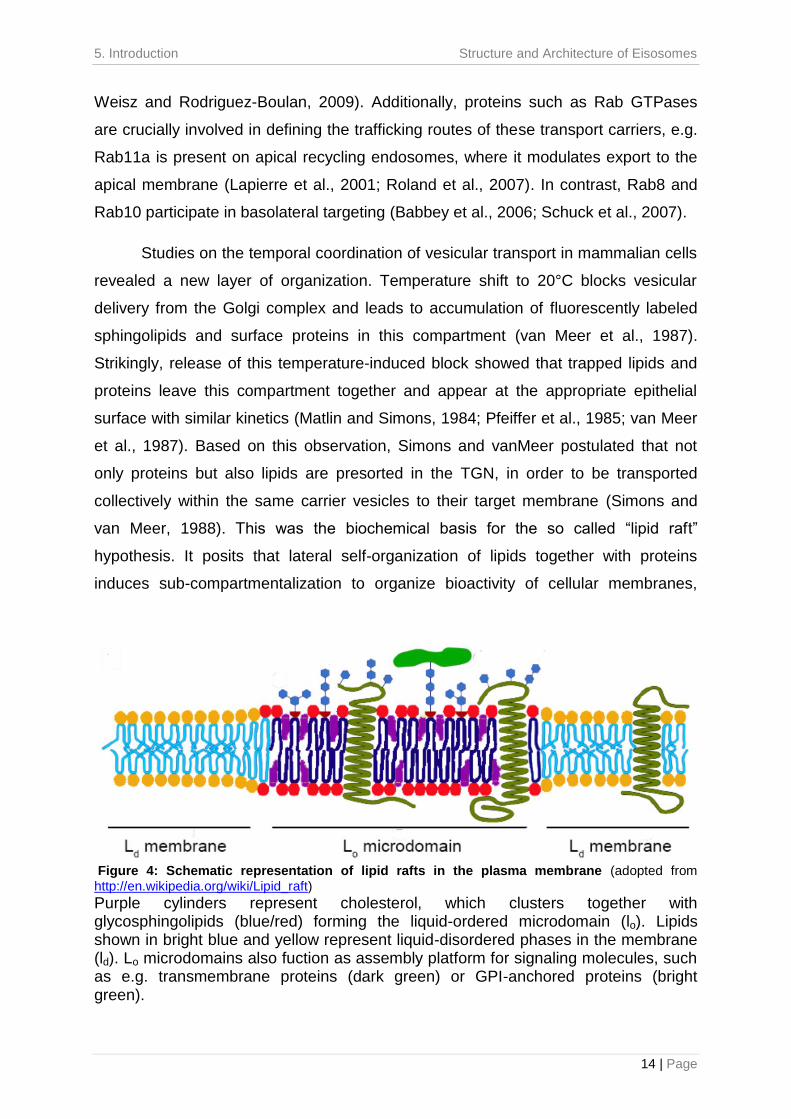
Figure 4: Schematic representation of lipid rafts in the plasma membrane (adopted from http://en.wikipedia.org/wiki/Lipid_raft)
Purple cylinders represent cholesterol, which clusters together with glycosphingolipids (blue/red) forming the liquid-ordered microdomain (lo). Lipids shown in bright blue and yellow represent liquid-disordered phases in the membrane (ld). Lo microdomains also fuction as assembly platform for signaling molecules, such as e.g. transmembrane proteins (dark green) or GPI-anchored proteins (bright green).
5. Introduction Structure and Architecture of Eisosomes
15 | Page
such as orchestrating the assembly of signaling molecules, regulating receptor and
membrane protein trafficking, or influencing membrane fluidity.
5.2.2 Lipid rafts
Lipid rafts are thought to be the smallest units of organization in the plasma
membrane (Lingwood and Simons, 2010; Munro, 2003; Simons and Vaz, 2004).
Although, the biological relevance or even existence of lipid rafts has been
questioned for years, current advances in technology yielded data, describing them
as dynamic nanoscale assemblies or platforms, enriched in cholesterol and
sphingolipids (Simons and Ikonen, 1997; Simons and Vaz, 2004). These two lipid
species form a unit together, which floats in the membrane, but is more ordered and
tightly packed than the surrounding phospholipid bilayer. The mechanism for lipid raft
formation is based on the process of phase separation in the fluid lipid bilayer,
specifically between the different lipid species according to their physical properties.
Due to the rigid nature of its sterol group, cholesterol prefers interaction with
hydrocarbon chains of saturated lipids, such as in sphingolipids, rather than with
more bulky unsaturated lipids (Figure 4) (Simons and Vaz, 2004). Additionally,
cholesterols small head group is proposed to be insufficient to shield the hydrophobic
ring system from water molecules in the environment. By partitioning into the same
domain, sphingolipids can provide additional shielding due to their larger head group,
so that cholesterol packs among them, filling the voids between associated
sphingolipids. This concept was described as the “umbrella-model” or the
“condensed complex model” (Ikonen, 2008). Such phase separation can also be
reconstituted in model systems, such as liqid bilayers or giant unilamellar vesicles
(GUVs), showing spontaneous cholesterol-dependent lateral segregation of lipids
(Ipsen et al., 1987; Kahya et al., 2003; Lentz et al., 1980).
The segregation of lipids in the membrane based on their physical properties,
lead to the differentiation in cholesterol-dependent liquid-ordered (lo) and liquid-
disordered (ld) phases (Figure 4) (Simons and Ikonen, 1997). Consistent with the acyl
chain length of their components, lo phases are suggested to be thicker then ld
phases (Harder and Simons, 1997). This morphological difference may lead to the
generation of specialized plasma membrane environments, where proteins e.g.
5. Introduction Structure and Architecture of Eisosomes
16 | Page
comprising of long transmembrane domains can preferrentially incorporate and
cluster together. For example GPI-anchored proteins partition into lipid rafts in post-
TGN sorting vesicles and act as sorting platforms for inclusion of cargo destined for
delivery to the apical membrane (Paladino et al., 2004; Simons and Ikonen, 1997).
Based on this capability to segregate specific classes of lipids and proteins, rafts
support lateral segregation of the plasma membrane into functional domains and for
example mediate polarized delivery of proteins (Bagnat et al., 2000).
5.2.3 Microdomains
In vitro spontaneous phase separation leads to the formation of very
large lipid phases, which is controversial to the observation of small and disperse raft
domains in vivo. The reason for this discrepancy is not known yet, but might be
based on the plasma membrane being close to a critical point of phase transition.
Therefore, small rafts are disperse in vivo, but able to cluster upon interactions with
the cytoskeleton or plasma membrane proteins (Honerkamp-Smith et al., 2008;
Honerkamp-Smith et al., 2009; Veatch et al., 2008). Crosslinking-experiments of the
raft ganglioside GM1 showed that lipid rafts can coalesce to form larger, micrometer-
scale membrane domains in a sterol–dependent manner (Lingwood et al., 2008).
Interactions between lipids by themselves are weak and transient, however such
microdomains can be laterally stabilized by protein-protein and/or protein-lipid
interactions. An example for such microdomain organization in vivo is provided by
caveolae. These are 60-80nm flask-like shaped plasma membrane invaginations,
which are specialized, morphologically distinguishable form of lipid rafts (Rajendran
and Simons, 2005; Simons and Toomre, 2000).
Although the function of cavolae is not entirely clear, they are implicated in
numerous cellular functions, such as lipid uptake and regulation, endocytosis, signal
transduction and virus entry (Simons and Toomre, 2000). Consistent with their
various functions, they have also been linked to disease: mutations in their molecular
components have been found in breast cancer as well as in types of muscular
dystrophy (Schwencke et al., 2006). Their main component is the integral membrane
protein caveolin-1 (Rothberg et al., 1992), which is present with around 145
molecules per caveola (Pelkmans and Zerial, 2005) and is by itself sufficient to form
these structures (Fra et al., 1995). Caveolin-1 inserts into the bilayer with its putative
5. Introduction Structure and Architecture of Eisosomes
17 | Page
transmembrane hairpin domain and has strong affinity for cholesterol (Murata et al.,
1995), which is enriched in lipid rafts. Sedimentation velocity experiments show that,
detergent-solubilized caveolin-1 forms oligomeric structures of 340kDa, the
equivalent of 10-15 molecules. Thus, interaction of caveolin-1 with cholesterol likely
triggers its oligomerization, which in turn leads to further intercalation of caveolin-1
into rafts. Based on the local increase of available cholesterol binding sites, such
oligomeric building blocks subsequently fuse with each other and collect raft
nanoclusters to form and stabilize them into larger domains. This is consistent with
the idea of rafts being dynamic and transient structures that can change their size
and composition in response to intra- and extracellular stimuli (Hancock, 2006;
Sargiacomo et al., 1995; Simons and Toomre, 2000). Thus, caveolin-1 binding and
recruitment of cholesterol to raft domains (Murata et al., 1995; Smart et al., 1996)
could organize the lipid composition in the membrane and additionally have an
impact on raft dynamics and functionality (Harder and Simons, 1997; Lajoie et al.,
2009).
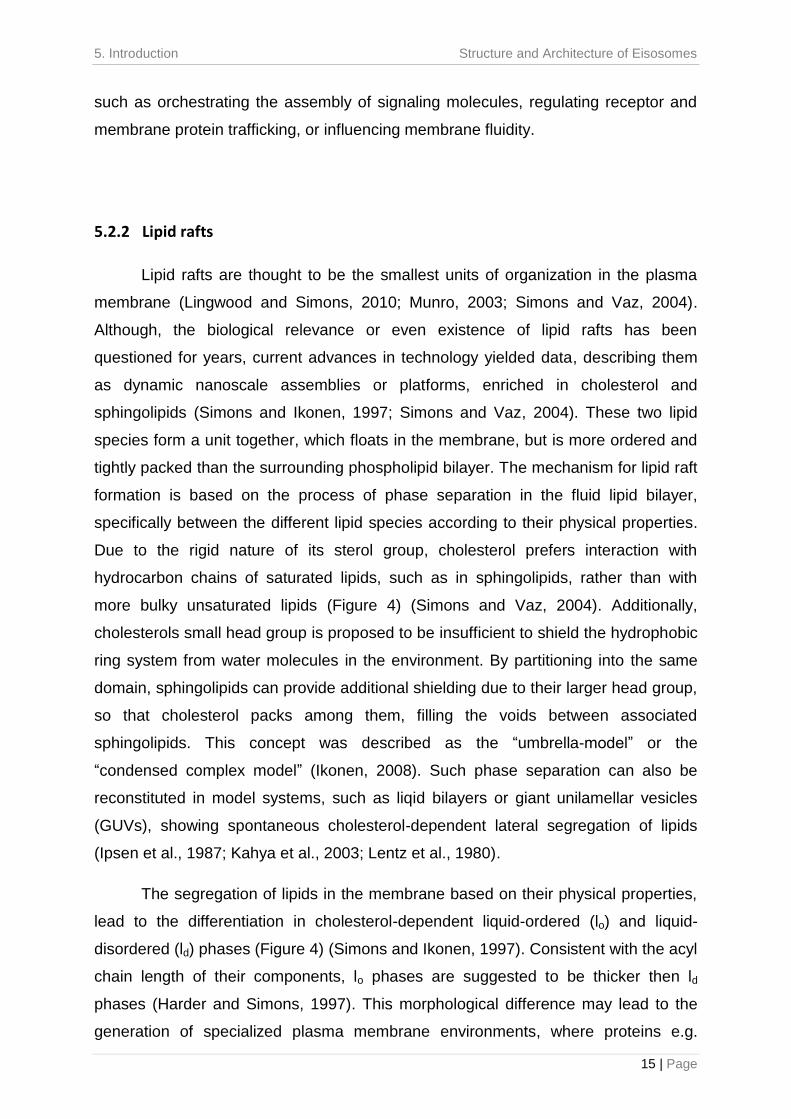
Figure 5: Structure of Caveolae and Caveolins (adopted from (Parton and Simons, 2007)) Caveolin is inserted in to the caveolar membrane with the N and C termini facing the cytoplasm and a putative ‘hairpin’ intramembrane domain embedded within the membrane bilayer. The scaffold domain, a highly conserved region of caveolin might have a role in cholesterol interactions through conserved basic (+) and bulky hydrophobic residues (red circles). The C terminal domain, which is close to the intramembrane domain, is modified by palmitoyl groups that insert into the lipid bilayer. The complex structures that are formed by interconnected caveolae can occupy a large area of the plasma membrane.
5. Introduction Structure and Architecture of Eisosomes
18 | Page
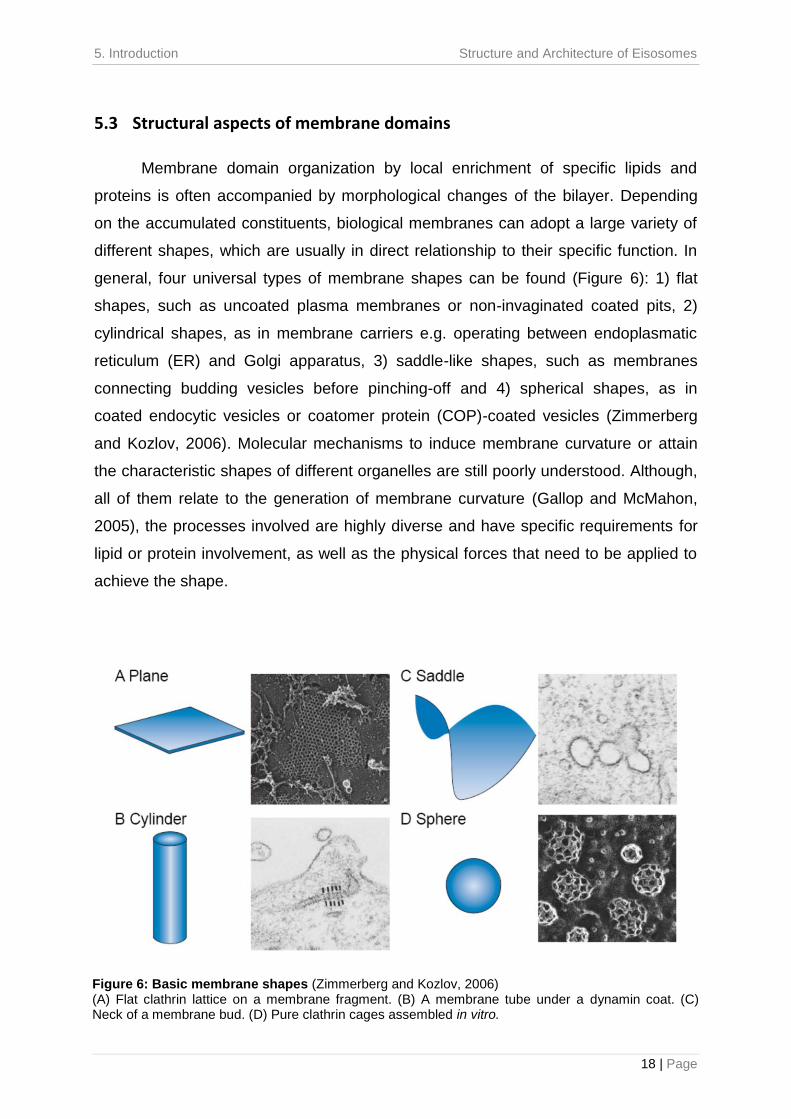
5.3 Structural aspects of membrane domains
Membrane domain organization by local enrichment of specific lipids and
proteins is often accompanied by morphological changes of the bilayer. Depending
on the accumulated constituents, biological membranes can adopt a large variety of
different shapes, which are usually in direct relationship to their specific function. In
general, four universal types of membrane shapes can be found (Figure 6): 1) flat
shapes, such as uncoated plasma membranes or non-invaginated coated pits, 2)
cylindrical shapes, as in membrane carriers e.g. operating between endoplasmatic
reticulum (ER) and Golgi apparatus, 3) saddle-like shapes, such as membranes
connecting budding vesicles before pinching-off and 4) spherical shapes, as in
coated endocytic vesicles or coatomer protein (COP)-coated vesicles (Zimmerberg
and Kozlov, 2006). Molecular mechanisms to induce membrane curvature or attain
the characteristic shapes of different organelles are still poorly understood. Although,
all of them relate to the generation of membrane curvature (Gallop and McMahon,
2005), the processes involved are highly diverse and have specific requirements for
lipid or protein involvement, as well as the physical forces that need to be applied to
achieve the shape.
Figure 6: Basic membrane shapes (Zimmerberg and Kozlov, 2006) (A) Flat clathrin lattice on a membrane fragment. (B) A membrane tube under a dynamin coat. (C) Neck of a membrane bud. (D) Pure clathrin cages assembled in vitro.
5. Introduction Structure and Architecture of Eisosomes
19 | Page
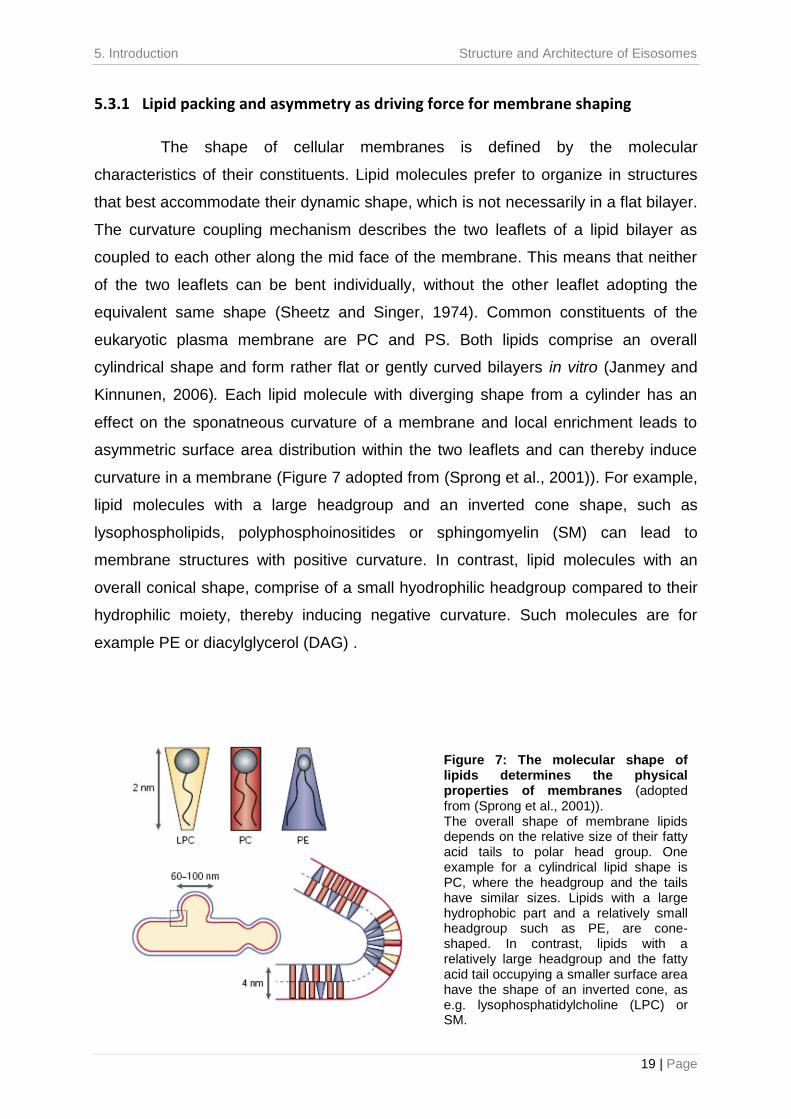
5.3.1 Lipid packing and asymmetry as driving force for membrane shaping
The shape of cellular membranes is defined by the molecular
characteristics of their constituents. Lipid molecules prefer to organize in structures
that best accommodate their dynamic shape, which is not necessarily in a flat bilayer.
The curvature coupling mechanism describes the two leaflets of a lipid bilayer as
coupled to each other along the mid face of the membrane. This means that neither
of the two leaflets can be bent individually, without the other leaflet adopting the
equivalent same shape (Sheetz and Singer, 1974). Common constituents of the
eukaryotic plasma membrane are PC and PS. Both lipids comprise an overall
cylindrical shape and form rather flat or gently curved bilayers in vitro (Janmey and
Kinnunen, 2006). Each lipid molecule with diverging shape from a cylinder has an
effect on the sponatneous curvature of a membrane and local enrichment leads to
asymmetric surface area distribution within the two leaflets and can thereby induce
curvature in a membrane (Figure 7 adopted from (Sprong et al., 2001)). For example,
lipid molecules with a large headgroup and an inverted cone shape, such as
lysophospholipids, polyphosphoinositides or sphingomyelin (SM) can lead to
membrane structures with positive curvature. In contrast, lipid molecules with an
overall conical shape, comprise of a small hyodrophilic headgroup compared to their
hydrophilic moiety, thereby inducing negative curvature. Such molecules are for
example PE or diacylglycerol (DAG) .
Figure 7: The molecular shape of lipids determines the physical properties of membranes (adopted from (Sprong et al., 2001)). The overall shape of membrane lipids depends on the relative size of their fatty acid tails to polar head group. One example for a cylindrical lipid shape is PC, where the headgroup and the tails have similar sizes. Lipids with a large hydrophobic part and a relatively small headgroup such as PE, are cone-shaped. In contrast, lipids with a relatively large headgroup and the fatty acid tail occupying a smaller surface area have the shape of an inverted cone, as e.g. lysophosphatidylcholine (LPC) or SM.
5. Introduction Structure and Architecture of Eisosomes
20 | Page
Due to the lipid composition of most cellular membranes, generation of stable
high curvature shapes purely based on lipid asymmetry is energetically unfavorable
(van Meer et al., 2008). Depending on the shape, this requires a monolayer area
difference of 10-20% across the two layers (Zimmerberg and Kozlov, 2006).
Specifically, generation of a membrane tubule requires ≈70kcal/mol, formation of a
spherical vesicle even ≈300kcal/mol. Since the characteristic thermal energy of a
membrane is much lower (≈0.6kcal/mol), stable formation of such shapes does not
occur spontaneously, but requires molecular mechanisms stabilizing such
energetically unfavorable states (Shibata et al., 2009). Thus, generation and
particularly stabilization of tubular or spherical shapes from cellular membranes
requires a substantial and persistent amount of energy, which usually requires the aid
of proteins (Zimmerberg and Kozlov, 2006).
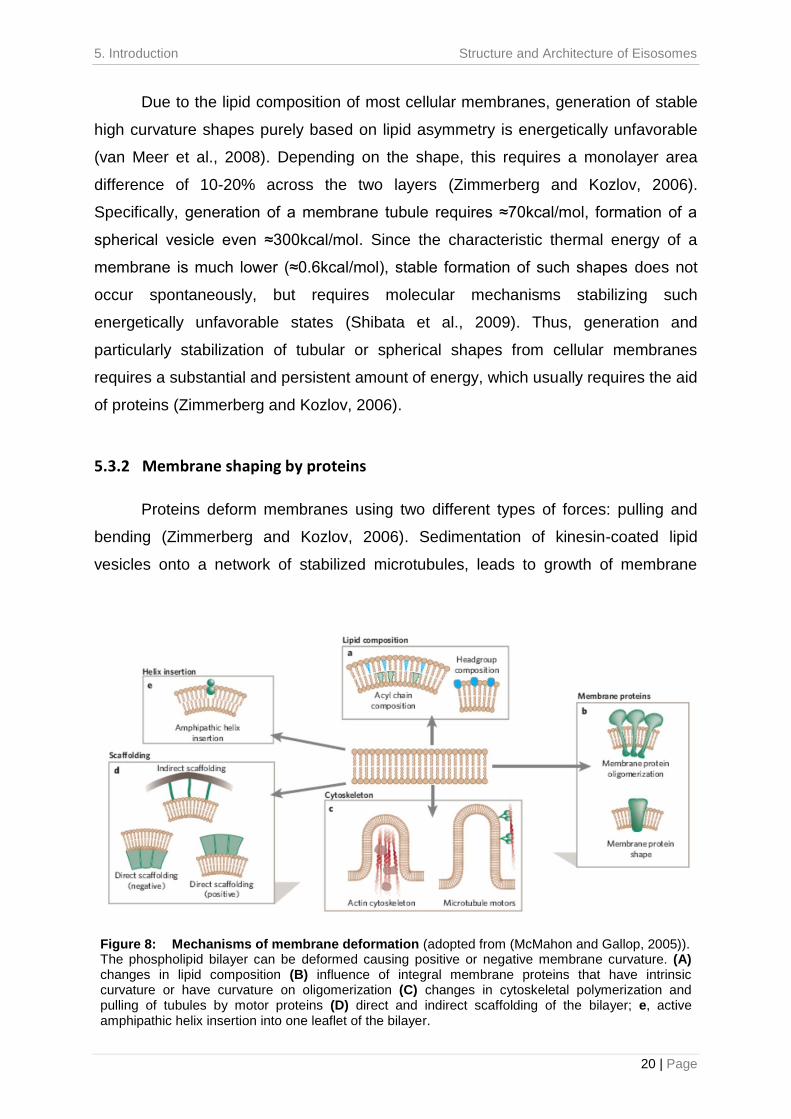
5.3.2 Membrane shaping by proteins
Proteins deform membranes using two different types of forces: pulling and
bending (Zimmerberg and Kozlov, 2006). Sedimentation of kinesin-coated lipid
vesicles onto a network of stabilized microtubules, leads to growth of membrane
Figure 8: Mechanisms of membrane deformation (adopted from (McMahon and Gallop, 2005)). The phospholipid bilayer can be deformed causing positive or negative membrane curvature. (A) changes in lipid composition (B) influence of integral membrane proteins that have intrinsic curvature or have curvature on oligomerization (C) changes in cytoskeletal polymerization and pulling of tubules by motor proteins (D) direct and indirect scaffolding of the bilayer; e, active amphipathic helix insertion into one leaflet of the bilayer.
5. Introduction Structure and Architecture of Eisosomes
21 | Page
tubes along the microtubule system (Koster et al., 2003; Roux et al., 2002). Together
with in vivo studies, this suggested that membrane curvature can be induced by
molecular motor proteins, which directly apply pulling forces onto the lipid bilayer.
Alternatively, polymerization forces generated by the cytoskeleton itself have also
been described to generate elaborate tubular membrane structures, a mechanism
independent from motor proteins (Waterman-Storer and Salmon, 1998) (Figure 8).
Bending of a membrane can be induced by two major mechanisms, which are
not mutually exclusive: scaffolding and wedging. The wedging mechanism, involves
insertion of a part of the protein into the bilayer, e.g. an amphipathic helix.
Perturbation in the packing of polar lipid headgroups subsequently induces
membrane curvature. This mechanism has been described for a variety of proteins,
examples include epsin N-terminal homology domains (Ford et al., 2002), Sar1 of the
COPII coat complex (Lee et al., 2005), the reticulons of the ER membrane (Hu et al.,
2008) or the ArfGAPs of the COPI coat (Drin et al., 2007). In contrast, the scaffolding
mechanism insinuates that proteins apply their internal curvature to the bilayer,
thereby forcing the membrane to adopt the scaffolds’ shape (Peter et al., 2004).
Here, usually charge interactions between the molecules and the membrane mediate
curvature generation (Wang et al., 2009). The scaffolding mechanism is based on the
assumption that the protein scaffold is more rigid than the membrane, which is a
particularly characteristic feature of the Bin, Amphiphysin, Rvs161/167 (BAR) domain
containing protein superfamily.
5.3.3 Membrane deformation by BAR domain containing proteins
Members of the BAR domain containing protein superfamily are described as
fundamental regulators of membrane-remodeling processes throughout eukaryotes.
They are recruited from the cytoplasm to participate in cellular events, e.g. formation
of plasma-membrane extensions or invaginations, transport intermediates such as
endocytic vesicles or the development of tubular membrane structures (Itoh et al.,
2005; Lee et al., 2002; Peter et al., 2004; Tsujita et al., 2006). The molecular basis
for our understanding of BAR domain containing proteins comes from
crystallographic and biochemical studies (Gallop et al., 2006; Mattila et al., 2007;
Peter et al., 2004). In general, all members of the family have a dimeric, banana-
shaped structure, formed by the antiparallel association of two monomers (Figure 9)
5. Introduction Structure and Architecture of Eisosomes
22 | Page
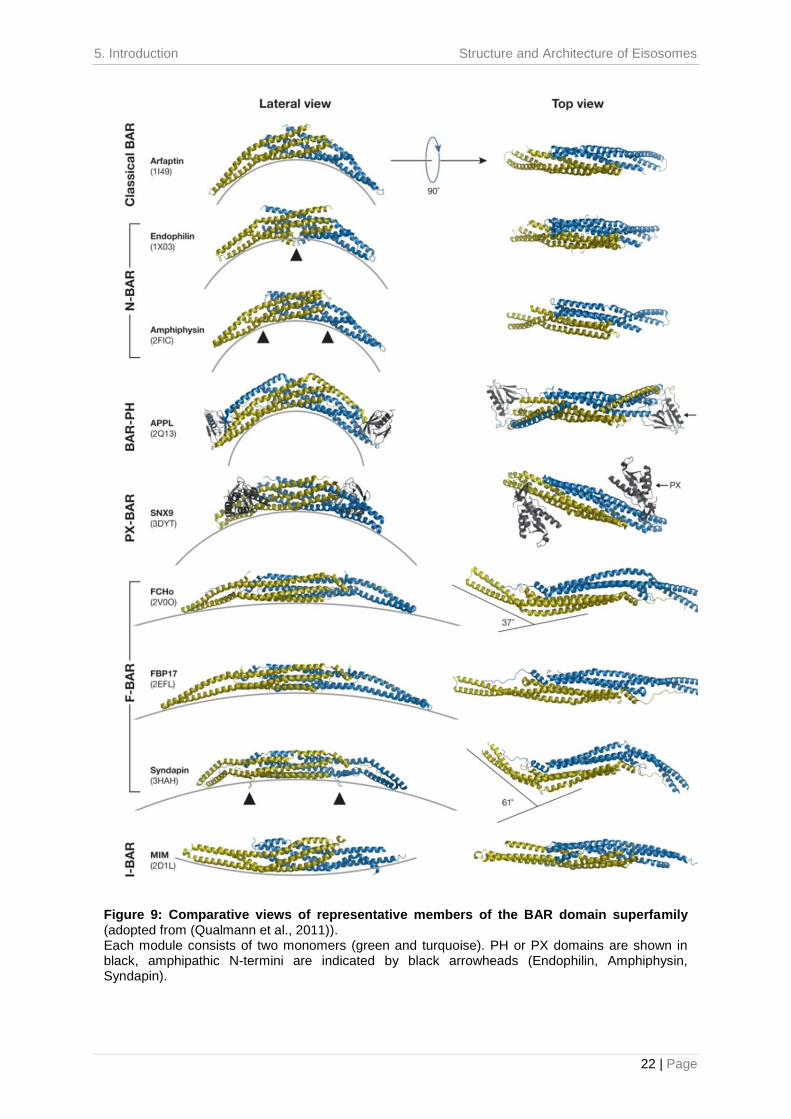
Figure 9: Comparative views of representative members of the BAR domain superfamily (adopted from (Qualmann et al., 2011)). Each module consists of two monomers (green and turquoise). PH or PX domains are shown in black, amphipathic N-termini are indicated by black arrowheads (Endophilin, Amphiphysin, Syndapin).
5. Introduction Structure and Architecture of Eisosomes
23 | Page
(Casal et al., 2006; Masuda and Mochizuki, 2010; Shimada et al., 2007; Tarricone et
al., 2001; Zhu et al., 2007). The dimer is stabilized by hydrophobic interactions
between their inner surfaces, resulting in a symmetrical elongated structure with a
central six-helix bundle core (3 from each monomer) and two arms (Gallop et al.,
2006; Henne et al., 2007; Lee et al., 2007; Masuda and Mochizuki, 2010; Zhu et al.,
2007). Based on their overall degree of curvature, they can be divided in different
subgroups: the classical banana-shaped BAR domain, the more elongated crescent
shaped F-BAR (FCH-BAR or EFC Extended-FCH) domain and the nearly flat
zeppelin shaped I-BAR (Inverse-BAR) domain (Figure 9) (Frost et al., 2008).
Membrane binding and deformation by BAR domains is generated by
interaction of positively charged amino acid patches within the concave face of the
dimer with the negatively charged phospholipid headgroups in the membrane. As
such, the BAR domain imposes its intrinsic curvature onto the membrane and
induces curvature by applying the scaffolding mechanism (Zimmerberg and Kozlov,
2006). Consistent with this, incubation of BAR domain proteins with liposomes in vitro
bends them into tubules, with the diameter matching the degree of the specific
curvature of the BAR domain (Shimada et al., 2007). A variant of the classical BAR
domain, the so-called N-BAR domain, additionally inserts an amphipathic helix into
the membrane to enhance tubulation. Prominent members of this protein family are
endophilin or amphiphysin (Gallop et al., 2006; Masuda and Mochizuki, 2010), which
have been described as key players in clathrin-mediated endocytosis. As such,
members of the BAR domain containing protein family exemplify how scaffolding and
wedging mechanism can be used independently from each other, but can also be
applied simultaneously to efficiently induce and stabilize membrane curvature
(Masuda and Mochizuki, 2010).
BAR domain containing proteins share the property of acting at sites of
membrane dynamics, such as endocytic sites (Salazar et al., 2003; Soulet et al.,
2005). Among the different endocytic routes that have been described in eukaryotic
cells, clathrin-mediated endocytosis has been studied most extensively. This pathway
requires a number of membrane-associated proteins to generate membrane
curvature. The formation of clathrin-coated vesicles (CCVs) can be separated into
four main steps (Kaksonen et al., 2005; Merrifield et al., 2005): 1) clathrin coat
assembly and cargo selection to form the clathrin coated pit (CCP) 2) invagination of
5. Introduction Structure and Architecture of Eisosomes
24 | Page
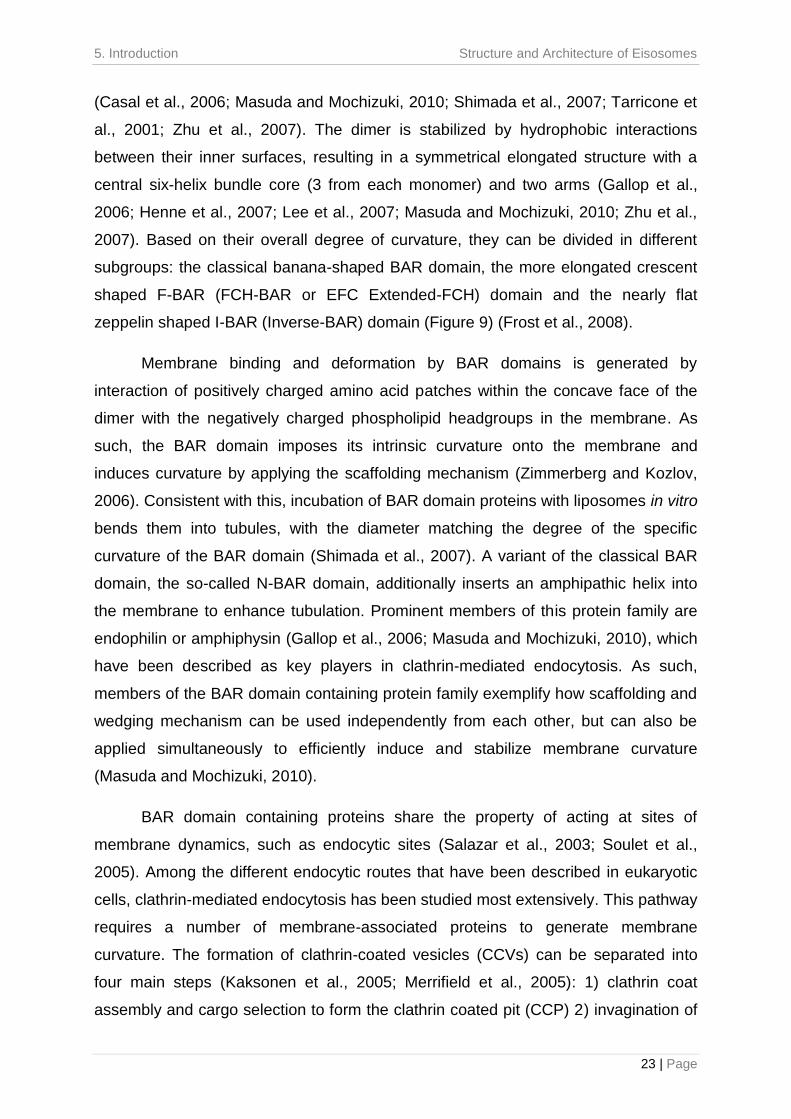
the CCP by recruitment of the actin polymerization machinery 3) neck formation at
the CCP and 4) vesicle scission (Figure 10). For example FBP17 is a member of F-
BAR domain proteins, which is transiently recruited to CCPs in the late stage of
clathrin-mediated endocytosis (Giuliani et al., 2009; Itoh et al., 2005; Suetsugu et al.,
2010; Tsujita et al., 2006; Wu et al., 2010). Clathrin coat assembly probably leads to
its accumulation at the foot of the hemispherical structure, which is consistent with its
preference for low curvature membranes (Shimada et al., 2007). Subsequent FBP17
self-oligomerization then drives the CCP invagination by constricting the tube in order
to form a neck. Additionally, activation of the actin nucleation machinery and further
recruitment of dynamins may narrow the diameter of the neck for scission to take
place. Here, classical BAR-domain proteins with a sharper curvature, such as
amphiphysin (Takei et al., 1999) or endophilin (Farsad et al., 2001; Ferguson et al.,
2009) are suggested to regulate the final constriction of the pits (Shimada et al.,
2007). In this process of CME, multiple BAR domain proteins participate in multiple
steps to generate and bind to different degrees of membrane curvature and recruit
endocytic effectors. Also in yeast, CME represents a highly complex mechanism,
involving around 60 different types of proteins of various functions (Weinberg and
Figure 10: Involvement of BAR domain proteins in clathrin-mediated endocytosis (adopted from (Suetsugu et al., 2010)). Clathrin assembly forms the invaginations that may be recognized by the EFC/F-BAR domain. The binding of EFC/F-BAR domain proteins could further induce the invagination/tubulation of the plasma membrane, as well as the actin polymerization to constrict the tubules. The narrower tubules are eventually bound to the BAR domain. Actin polymerization and the dynamin recruited by the EFC/F-BAR and BAR domain proteins induce the scission of the vesicles form the plasma membrane.
5. Introduction Structure and Architecture of Eisosomes
25 | Page
Drubin, 2012). Here, this process is locally restricted to defined sites of actin density
at the plasma membrane, called actin patches. This demonstrates that also the yeast
plasma membrane is able to segregate complex processes into distinct reaction
compartments and is highly organized.
5. Introduction Structure and Architecture of Eisosomes
26 | Page
5.4 Plasma membrane organization in yeast Saccharomyces cerevisiae
Although, plasma membrane domains are ubiquitously found and play a
cruicial role in all different types of cell biological processes, the molecular
mechanisms behind their formation are in most cases barely understood. In this
regard, yeast S.cerevisiae provides an excellent model system to study this
phenomenon, since its plasma membrane is highly organized into distinct domains
and can be easily manipulated to allow visualization of proteins at their endogenous
levels. As described in mammalian cells, also the yeast plasma membrane
constitutes non-overlapping lateral domains (Grossmann et al., 2007; Malinska et al.,
2003; Opekarova et al., 2005), which cover the vast majority of the plasma
membrane. According to the presence of specific marker proteins, three main non-
overlapping compartments have been described so far: the membrane compartment
containing 1) Can1 (MCC) and 2) Target of Rapamycin complex (TORC) 2 (MCT),
which appear in a patchy pattern. The third, spreads as a network percolating in
between the MCC and the MCT, the membrane compartment containing Pma1
(MCP) (Berchtold and Walther, 2009; Grossmann et al., 2007). Besides specific
proteins, these domains also vary in their lipid composition. In particular, the MCC is
suggested to be enriched in ergosterol, the major yeast sterol (Grossmann et al.,
2007). In general, compartmentalization of the plasma membrane into domains of
distinct protein and lipid content is believed to participate in the spatial control of
cellular signaling (Fröhlich et al., 2009). Additionally, lateral organization is required
for normal endocytosis of proteins located within these domains (Grossmann et al.,
2008; Walther et al., 2006).
Compartmentalization of the yeast plasma membrane is achieved by large
cytoplasmic protein complexes, termed eisosomes. These large, immobile structures
are stably anchored underneath the plasma membrane at the cell cortex and their
presence is required for proper plasma membrane organization of proteins and lipids.
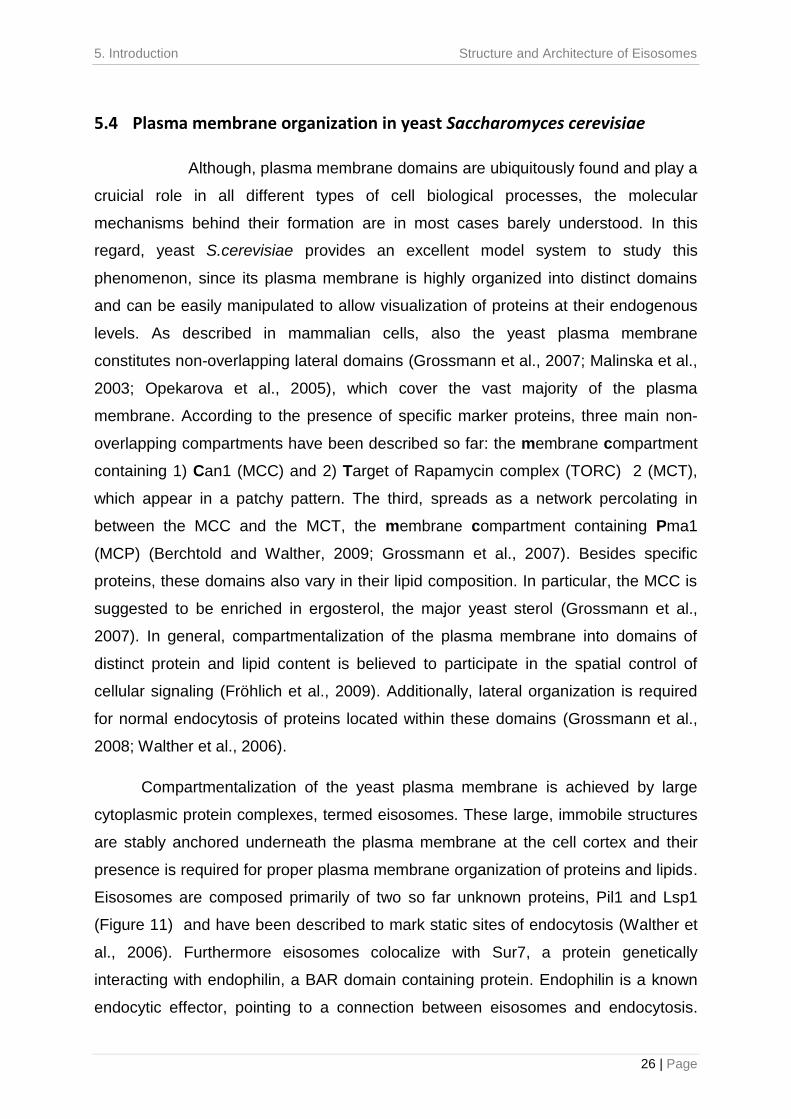
Eisosomes are composed primarily of two so far unknown proteins, Pil1 and Lsp1
(Figure 11) and have been described to mark static sites of endocytosis (Walther et
al., 2006). Furthermore eisosomes colocalize with Sur7, a protein genetically
interacting with endophilin, a BAR domain containing protein. Endophilin is a known
endocytic effector, pointing to a connection between eisosomes and endocytosis.
5. Introduction Structure and Architecture of Eisosomes
27 | Page
This connection is further reflected by the genetic interactions of PIL1 and LSP1 with
known endocytic effectors from yeast, such as RVS161, RVS167, PAN1, SLA1 and
SLA2 (Michelot et al., 2010; Walther et al., 2006) as well as the physical interaction
with the actin nucleation promoting factor Las17 (Michelot et al., 2010). Consistently,
pulse-chase experiments investigating uptake of the fluorescent lipid dye FM-464
showed accumulation of this endocytosis marker into discrete foci after 20s of
application. Interestingly, all of these early endocytic intermediates colocalized with
eisosomes, confirming the hypothesis that eisosomes mark sites of endocytosis
(Walther et al., 2006). In turn though, not all eisosomes showed FM-464
accumulation, indicating that only a certain subset of eisosomes actively participates
in endocytic events at a given time.
Eisosomes mediate the formation of MCC domains, which ultrastructurally
appear as furrows in the plasma membrane (Stradalova et al., 2009). They are
crucial for normal plasma membrane domain formation and endocytosis, since their
absence, as for example in ∆pil1 cells, leads to altered distribution of lipids and
proteins in the membrane. As observed by fluorescence microscopy, the plasma
membrane domain pattern collapses in such cells, meaning all MCC proteins
investigated so far mislocalize and are either evenly distributed in the membrane or
accumulate into one or a few clusters, called eisosome remnants (Fröhlich et al.,
2009; Grossmann et al., 2007; Walther et al., 2006). Furthermore, ergosterol loses its
punctuate pattern with a more even localization in the plasma membrane and
Figure 11: Eisosomes consist of Pil1 and Lsp1 and localize to the yeast cell cortex. Fluorescence microscopy of cherry-tagged Lsp1 and green fluorescent protein (GFP)-tagged Pil1 in yeast cells. Mid (upper panels) and top sections (lower panels) show both proteins co-localizing within eisosomes in a punctuate pattern at the plasma membrane. Insets show magnified views of the indicated areas (white boxes). Scale bar 5µm.
5. Introduction Structure and Architecture of Eisosomes
28 | Page
accumulates at eisosome remnants (Grossmann et al., 2007). Ultrastructurally, these
remnants appear by EM as large aberrant plasma membrane invaginations.
Additionally, these cells have altered endocytosis (Grossmann et al., 2008; Walther
et al., 2006) as well as cellular signalling (Zhang et al., 2004).
Eisosomes are not reminiscent of any other cellular assembly and stand out
due to their characteristic uniform and punctuate pattern, with each eisosome being
of relatively constant size. On average, a typical yeast cell has around 30 eisosomes,
which are spread along the plasma membrane with a minimal distance from each
other (Moreira et al., 2009). Their pattern arises during the cell cycle when the
proteins are expressed and once established stays stable, meaning individual
eisosomes do neither move nor exchange subunits (Walther et al., 2006). Strikingly,
these huge protein clusters are mainly composed of two subunits only, Pil1 and Lsp1.
With an estimated number of 115,000 copies per cell for Pil1 and 104,000 copies per
cell for Lsp1, both proteins are highly abundant in yeast (de Godoy et al., 2008;
Ghaemmaghami et al., 2003). From that, rough calculation estimates a total number
of 3000 copies of each of the proteins per complex, since no significant cytoplasmic
pool can be detected. These identical subunits, in turn must be repeatedly arranged
within eisosomes, to yield a uniform and functional complex.
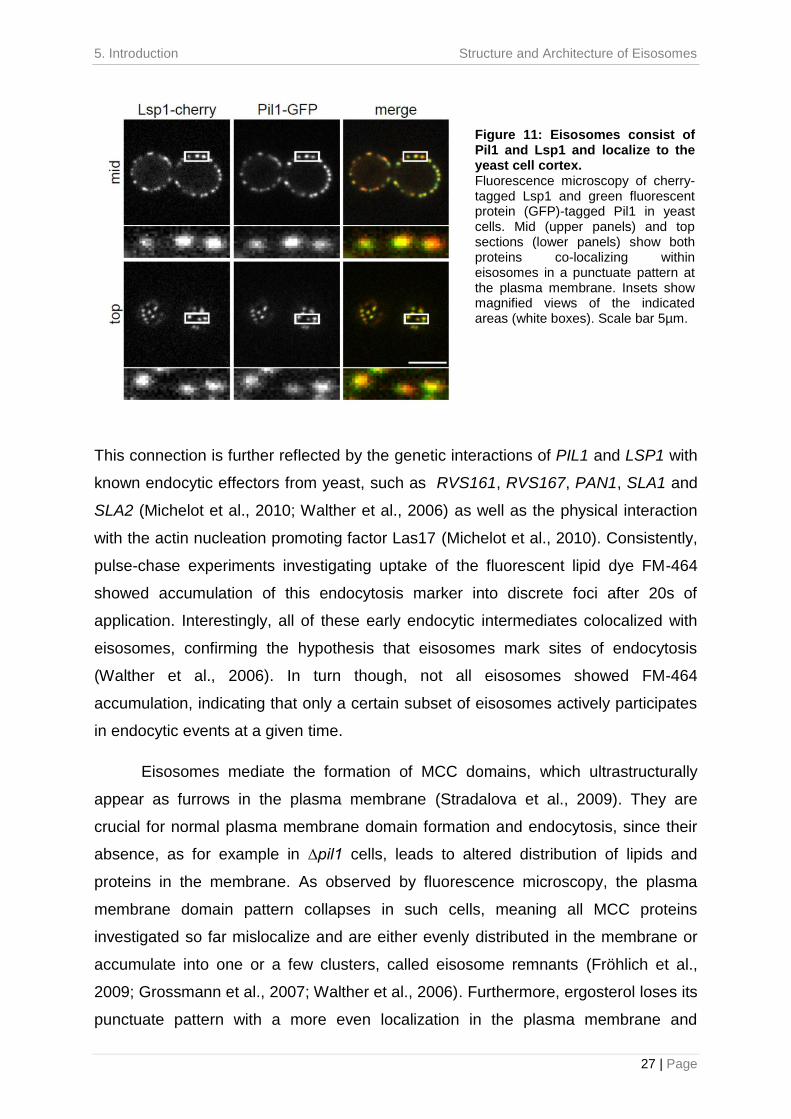
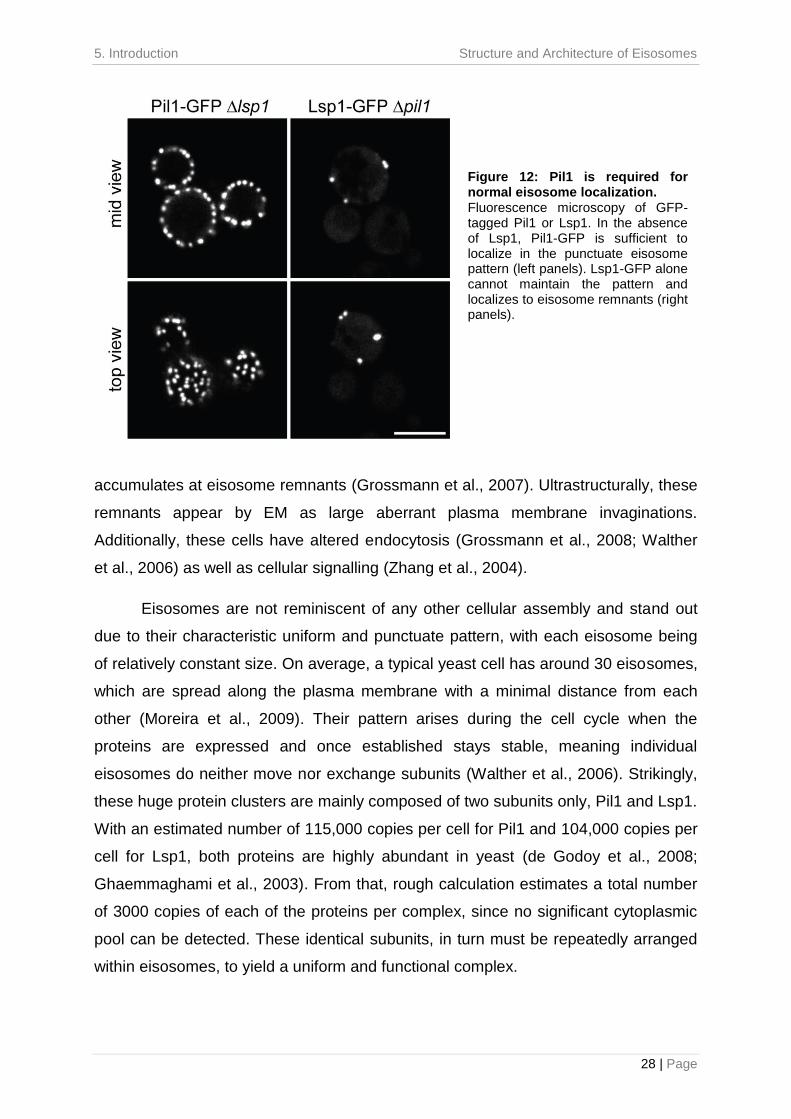
Figure 12: Pil1 is required for normal eisosome localization. Fluorescence microscopy of GFP-tagged Pil1 or Lsp1. In the absence of Lsp1, Pil1-GFP is sufficient to localize in the punctuate eisosome pattern (left panels). Lsp1-GFP alone cannot maintain the pattern and localizes to eisosome remnants (right panels).
5. Introduction Structure and Architecture of Eisosomes
29 | Page
Pil1 and Lsp1 are almost identical in their amino acid sequence. They share
72% of their residues, with the biggest variance in their C-termini, but based on their
primary sequence neither of them contains any discernable functional domain,.
Within eisosomes, each of these two proteins is represented with similar copy
numbers. Consistently, purifications of either Pil1 or Lsp1 from yeast extracts co-
precipitate equimolar amounts of the equivalent partner, respectively, indicating a
stoichiometric complex (Walther et al., 2006). Although, Pil1 and Lsp1 almost
resemble each other in their primary sequence information, they do not function
redundantly in eisosome architecture. While the presence of Pil1 is crucial for
eisosome assembly and plasma membrane organization in general, the equally
abundant Lsp1 surprisingly cannot compensate for Pil1 loss (Figure 12, right panels).
However, the molecular basis for this difference was not known so far.
6.Aim of the thesis Structure and Architecture of Eisosomes
30 | Page
6 Aim of the thesis
In yeast, eisosomes help to organize the plasma membrane into lateral
domains of distinct protein and lipid composition. However, the mechanistic details
explaining how they bind to the membrane and function to organize lipids and
proteins were completely unclear so far. Eisosomes show fascinating structural
characteristics: i) they localize in a stable pattern along the whole plasma membrane
ii) they are uniformly distributed, with each of them being at minimal distance from
each other and iii) they have a constant size, indicating a relatively uniform number of
subunits within each eisosome.
A major question about eisosome biology arises from these features, namely
how are these structures molecularly built? To address this question, the first aim of
my work was to biochemically characterize the structure and architecture of
eisosomes at several levels of resolution. For an efficient analysis of eisosome
structure, I established an in vitro system that allowed me to investigate these
complexes on the basis of recombinant proteins. Therefore, I developped the
expression of recombinant Pil1 and Lsp1 in E.coli and optimized their purification
procedure, in order to yield protein of sufficient quantity and quality. Previous studies
revealed that recombinant Pil1 self-assembles into long filamentous structures. Using
a combination of different biochemical, biophysical and cell biological techniques, I
characterized the self-assembly by eisosome proteins, Pil1 and Lsp1, into higher
order structures. This included techniques such as sedimentation velocity gradients,
fluorescence microscopy as well as negative stain and electron microscopy (EM), For
a more detailed analysis at a higher level of resolution, I studied the structure of the
filaments in their native state by cryo-electron tomography (cryo-ET), cryo-EM and
three-dimensional (3D) image reconstruction. This part of my work was performed in
collaboration with Prof. Dr. Kay Grünewald and Dr. Juha Huiskonen (Max-Planck-
Institute of Biochemistry, Germany and Division of Structural Biology, University of
Oxford, UK).
Building up on the detailed structural analysis of eisosome proteins in vitro, my
second aim was the characterization of membrane binding of recombinant Pil1 and
Lsp1, using different approaches. First, I established spin-down experiments based
on artificially generated lipid vesicles. Thereby, I studied lipid binding affinities, in
6.Aim of the thesis Structure and Architecture of Eisosomes
31 | Page
order to unveil potential preferences for specific lipid species over others. In a second
complementary approach, I visualized the proteins in the presence of liposomes to
study the structure of such protein-liposome mixtures by cryo-ET as well as a
combination of cryo-EM and 3D image reconstruction. Thereby, I generated a 3D
model of the proteins in interaction with the membrane that revealed how the proteins
align relatively to each other as well as to the membrane.
My third aim addressed an obvious paradox about the structure and
architecture of eisosomes: in vitro eisosomes assemble into long helices, while in
vivo they appear as regular dots at the plasma membrane by fluorescent microscopy.
This raised the question how these structures correlate with each other. As an
answer to this question is essential towards the understanding of eisosome function, I
investigated their structure bound to the plasma membrane of yeast cells. Therefore,
I collaborated with the laboratory of Prof. Dr. John Heuser (Washington University
School of Medicine, Saint Louis, USA), in order to perform freeze-fracture and deep-
etch EM (DEEM). Using these techniques creates the unique opportunity to image
true surfaces of biological membranes and allowed me to characterize the eisosome
scaffold in yeast cells from two different perspectives: 1) the view from the outside of
a cell onto the inner leaflet of the plasma membrane with eisosomes bound to it and
2) a direct view onto eisosomes, looking from the cytoplasm onto the plasma
membrane.
7.Discussion Structure and Architecture of Eisosomes
32 | Page
7 Discussion
Plasma membrane organization is a universal phenomenon of all different
types of cells. Although, the lateral segregation of biological reactions constitutes an
essential feature, the molecular mechanisms leading to such compartmentalization
are mostly unknown. In yeast S.cerevisiae, organization of MCC domains is mediated
by eisosomes. As such, they provide an inroad to answering this complex
phenomenon. In this work, I have addressed the mechanistic details of plasma
membrane domain organization by eisosomes using a combination of structural,
biochemical, genetic and cell biological approaches to characterize their main
components, Pil1 and Lsp1. My study revealed a fascinating, previously
unrecognized self-assembling scaffold that directly binds to and organizes the yeast
plasma membrane.
Eisosome proteins stand out due to their stable localization at the plasma
membrane (Walther et al., 2006), as well as their presence in extremely high copy
numbers (Pil1: 115.000 copies/cell; Lsp1: 104.000 copies/cell; (Hua et al., 2006).
These characteristics support the idea of eisosomes playing a role in cellular
architecture. As part of the cytoskelleton, tubulin and actin are prominent examples
for such architectural proteins, which are highly abundant in cells (5.590 copies/cell
for tubulin; 60.000 copies/per cell for actin (Ghaemmaghami et al., 2003; Norbeck
and Blomberg, 1997)). However, in comparison to those, eisosome proteins are
present with much higher copy numbers, so that Pil1 and Lsp1 could be classified as
part of a previously unrecognized cytoskeleton, participating in plasma membrane
organization. Consistent with this idea, my work unveils the mechanism of eisosome-
mediated plasma membrane domain organization, being based on self-assembly of
its two main components Pil1 and Lsp1 into a protein scaffold that directly binds and
locally deforms the membrane in a PI(4,5)P2-specific manner.
7.1 Pil1 and Lsp1 assemble into large multimeric complexes
Although Pil1 and Lsp1 are almost identical in their amino acid sequence, they
play a different architectural role in eisosome structure and assembly. However, the
molecular detail behind this paradox was previously unknown. Simultaneously to my
7.Discussion Structure and Architecture of Eisosomes
33 | Page
work in our laboratory, Dr. Natasza Ziołkowska solved the crystal structure of the
stable core fragment of Lsp1 including residues 36 to 267 of the full-length protein
(named “Lsp1ASIA”) and identified the protein as member of the BAR domain
containing protein superfamily. This protein family is evolutionary conserved and
assembles into complexes on cellular membranes, thereby using the combined
energy of multiple subunits to overcome the rigidity of the membrane in order to
induce curvature. Other examples of BAR domains have been described to be
soluble proteins that assemble into scaffolds upon membrane binding. In contrast,
eisosome proteins Pil1 and Lsp1 self-assemble into higher order structures of
extreme stability even in the absence of membranes. My structural investigation of
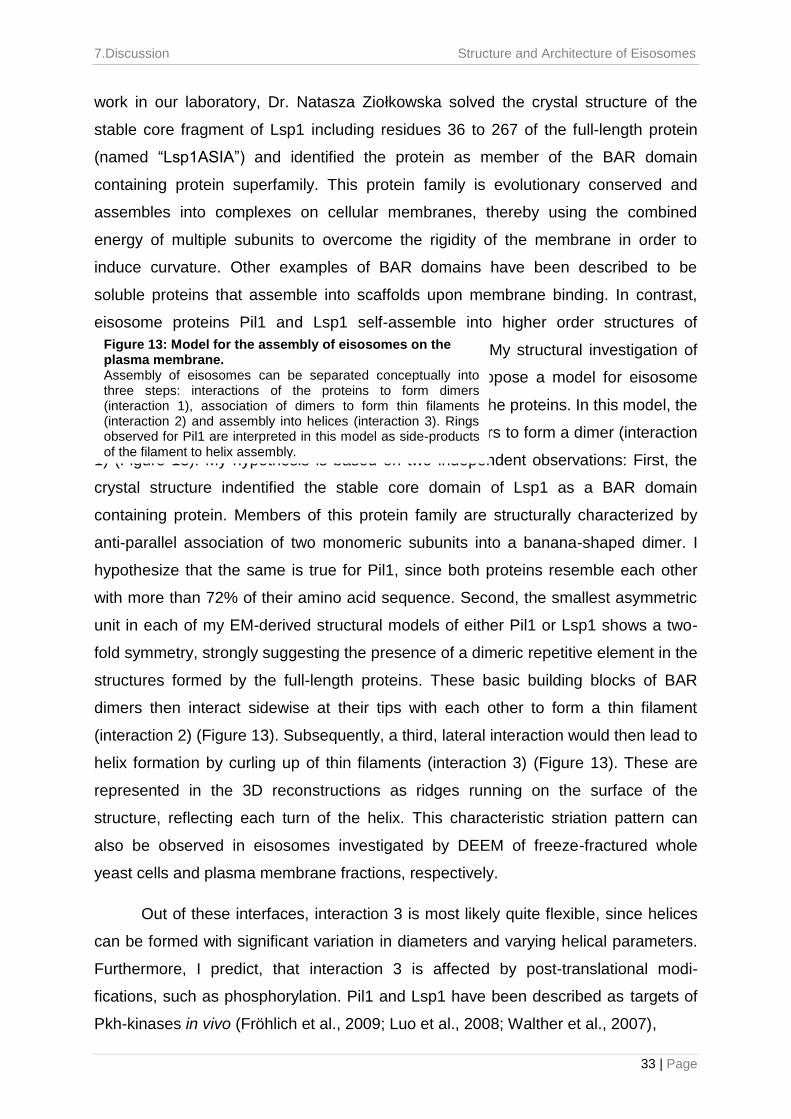
eisosome protein assembly in vitro allowed me to propose a model for eisosome
assembly, involving three distinct interactions between the proteins. In this model, the
assembly reaction starts by association of two monomers to form a dimer (interaction
1) (Figure 13). My hypothesis is based on two independent observations: First, the
crystal structure indentified the stable core domain of Lsp1 as a BAR domain
containing protein. Members of this protein family are structurally characterized by
anti-parallel association of two monomeric subunits into a banana-shaped dimer. I
hypothesize that the same is true for Pil1, since both proteins resemble each other
with more than 72% of their amino acid sequence. Second, the smallest asymmetric
unit in each of my EM-derived structural models of either Pil1 or Lsp1 shows a two-
fold symmetry, strongly suggesting the presence of a dimeric repetitive element in the
structures formed by the full-length proteins. These basic building blocks of BAR
dimers then interact sidewise at their tips with each other to form a thin filament
(interaction 2) (Figure 13). Subsequently, a third, lateral interaction would then lead to
helix formation by curling up of thin filaments (interaction 3) (Figure 13). These are
represented in the 3D reconstructions as ridges running on the surface of the
structure, reflecting each turn of the helix. This characteristic striation pattern can
also be observed in eisosomes investigated by DEEM of freeze-fractured whole
yeast cells and plasma membrane fractions, respectively.
Out of these interfaces, interaction 3 is most likely quite flexible, since helices
can be formed with significant variation in diameters and varying helical parameters.
Furthermore, I predict, that interaction 3 is affected by post-translational modi-
fications, such as phosphorylation. Pil1 and Lsp1 have been described as targets of
Pkh-kinases in vivo (Fröhlich et al., 2009; Luo et al., 2008; Walther et al., 2007),
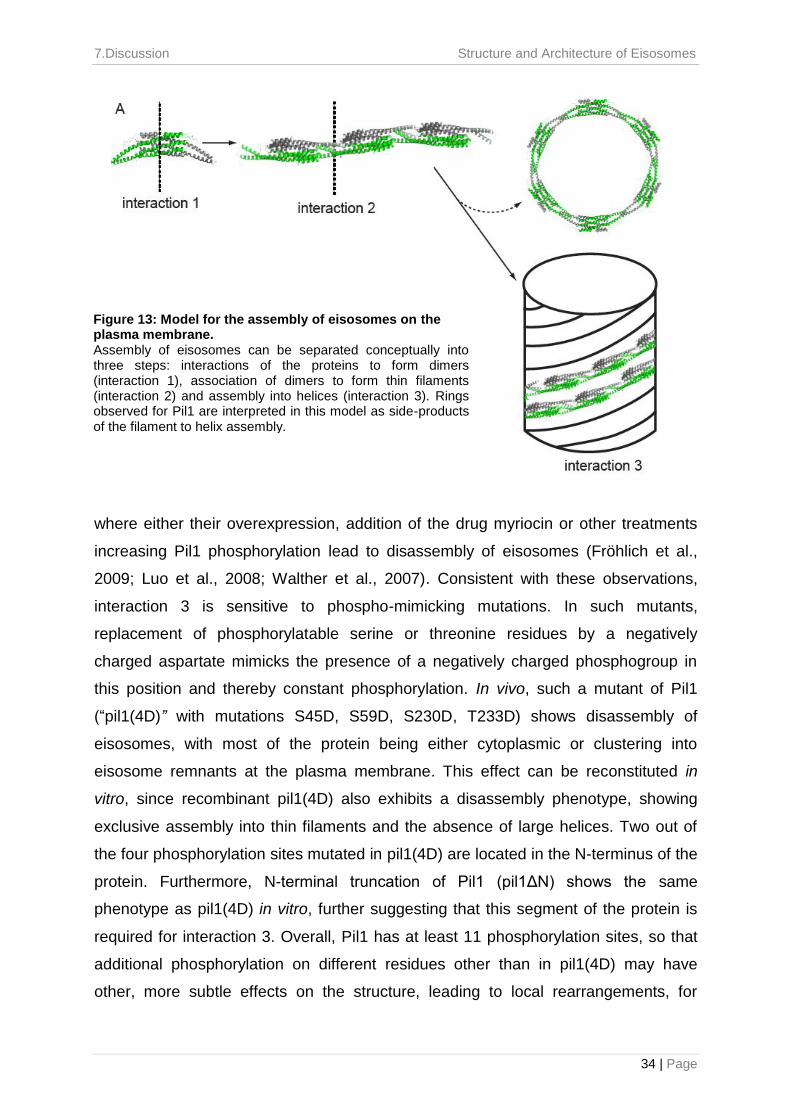
Figure 13: Model for the assembly of eisosomes on the plasma membrane. Assembly of eisosomes can be separated conceptually into three steps: interactions of the proteins to form dimers (interaction 1), association of dimers to form thin filaments (interaction 2) and assembly into helices (interaction 3). Rings observed for Pil1 are interpreted in this model as side-products of the filament to helix assembly.
7.Discussion Structure and Architecture of Eisosomes
34 | Page
where either their overexpression, addition of the drug myriocin or other treatments
increasing Pil1 phosphorylation lead to disassembly of eisosomes (Fröhlich et al.,
2009; Luo et al., 2008; Walther et al., 2007). Consistent with these observations,
interaction 3 is sensitive to phospho-mimicking mutations. In such mutants,
replacement of phosphorylatable serine or threonine residues by a negatively
charged aspartate mimicks the presence of a negatively charged phosphogroup in
this position and thereby constant phosphorylation. In vivo, such a mutant of Pil1
(“pil1(4D)” with mutations S45D, S59D, S230D, T233D) shows disassembly of
eisosomes, with most of the protein being either cytoplasmic or clustering into
eisosome remnants at the plasma membrane. This effect can be reconstituted in
vitro, since recombinant pil1(4D) also exhibits a disassembly phenotype, showing
exclusive assembly into thin filaments and the absence of large helices. Two out of
the four phosphorylation sites mutated in pil1(4D) are located in the N-terminus of the
protein. Furthermore, N-terminal truncation of Pil1 (pil1ΔN) shows the same
phenotype as pil1(4D) in vitro, further suggesting that this segment of the protein is
required for interaction 3. Overall, Pil1 has at least 11 phosphorylation sites, so that
additional phosphorylation on different residues other than in pil1(4D) may have
other, more subtle effects on the structure, leading to local rearrangements, for
Figure 13: Model for the assembly of eisosomes on the plasma membrane. Assembly of eisosomes can be separated conceptually into three steps: interactions of the proteins to form dimers (interaction 1), association of dimers to form thin filaments (interaction 2) and assembly into helices (interaction 3). Rings observed for Pil1 are interpreted in this model as side-products of the filament to helix assembly.
7.Discussion Structure and Architecture of Eisosomes
35 | Page
example to adjust the local curvature of the lattice or the interaction with the
membrane.
Although Pil1 and Lsp1 are almost identical in sequence, they differ in their
significance for eisosome architecture. We propose that this difference is based on
variance in the strength between these three interaction interfaces. In vitro, we
observed different types of oligomeric structures for Pil1: rings, thin filaments and
thick helices. In contrast, Lsp1 primarily formed thick helices highly similar to those of
Pil1. The absence of thin filaments and rings in Lsp1 samples suggests a lower
tendency to assemble into such structures. Hence, their filament forming interaction 2
might be weaker than that of Pil1, which shows prominent formation of filaments and
ring structures. In contrast, Lsp1 helices appear longer and much more ordered in
comparison to Pil1, which in turn argues for a stronger lateral interaction 3, mediating
the formation of these structures. Moreover, we propose that Lsp1 helices are only
stabilized by the collective energy of all end-to-end and lateral interactions. As such,
smaller assemblies like rings and thin filaments are unstable and fall apart, which is
consistent with the observation of barbed, unordered chains at the ends of Lsp1
helices and the much larger pool of free, non-assembled Lsp1 observed in
sedimentation gradients as compared to Pil1. In this model, the formation of ring
structures mostly seen for recombinant Pil1 would represent a side product, which
forms when thin filaments close up on themselves, thereby preventing helix
formation. Interestingly, among the few residues that differ between Lsp1 and Pil1,
three are located directly on the tips of the banana-shaped dimer (E/K152, H/Y155,
P/E167). The presence of these amino acid differences being mostly accumulated in
the tip regions of the dimer, supports the idea of variance in interaction strength
between the different interfaces being the cause for the diverging behavior of Pil1
and Lsp1,.
In the EM-derived structural models of full-length eisosome proteins, the
smallest asymmetric unit was invariably a dimer of either Pil1 or Lsp1. For Lsp1, this
was confirmed by the crystal structure of its core domain, indentifying it as a BAR-
domain containing protein. Since both proteins are highly homologous and purify as a
stoichiometric complex from yeast, it is possible that eisosomes assembled from Pil1
and Lsp1 form heterodimers in vivo, instead of homodimers assessed here. This idea
is supported by homology modeling of a theoretical Pil1 structure based on the Lsp1
7.Discussion Structure and Architecture of Eisosomes
36 | Page
ASIA core domain and subsequent generation of theoretical Pil1 homodimers or
Pil1/Lsp1 heterodimers (NE Ziołkowska, unpublished observation). Subsequent
assessment of energy profiles of such models indicated that Pil1/Lsp1 heterodimers
would be energetically more stable structures than hypothetical Pil1 homodimers (NE
Ziolkowska, unpublished observation). Interestingly, heterodimer formation has been
described for other BAR domain containing proteins in yeast. Rvs161/Rvs167, the
yeast homologues of endophilin/amphiphysin, are both members of the N-BAR
protein family, tubulate liposomes in vitro and are implicated in endocytosis
(Kaksonen et al., 2005; Youn et al., 2010). Interestingly, these proteins show
heterodimer formation (Ren et al., 2006; Youn et al., 2010), but in the absence of
either partner, each of the proteins can compensate the lack by forming homodimers,
which can perform most of the functions of the heterodimer (Lombardi and Riezman,
2001; Navarro et al., 1997). The structural and functional analogy of these proteins,
supports the hypothesis that this is true for Pil1 and Lsp1 as well, meaning that both
proteins are capable of building homodimers, but form heterodimers in the presence
of the other partner. Localization of Pil1 and Lsp1 by immunogold-labeling and EM on
preparations allowing the view from the cytoplasm onto the plasma membrane
showed that both proteins are present within eisosomes covering membrane furrows.
However, in which specific way the proteins associate to form eisosomes and
whether their different properties are used to modulate eisosome structure, is yet
unclear.
7.2 Pil1 and Lsp1 bind phosphoinositides
Eisosomes are a fascinating case of cellular pattern formation. Besides their
uniform size, eisosomes also maintain a minimal distance from each other.
Outstanding questions are what restricts assembly of Pil1 in cells, preventing the
formation of one giant eisosome rod, and how is their punctuate pattern achieved.
When cells are manipulated to increase isotopically in size, new eisosomes form at
maximal distance between existing ones and grow to the same dimension (Moreira et
al., 2009). In order to yield such a system, eisosome size and localization have to be
regulated. Earlier studies showed that eisosome size control is at least partially
regulated by Pil1 expression levels and phosphorylation, with the latter responding to
changes in sphingolipid synthesis (Fröhlich et al., 2009; Moreira et al., 2009). My
7.Discussion Structure and Architecture of Eisosomes
37 | Page
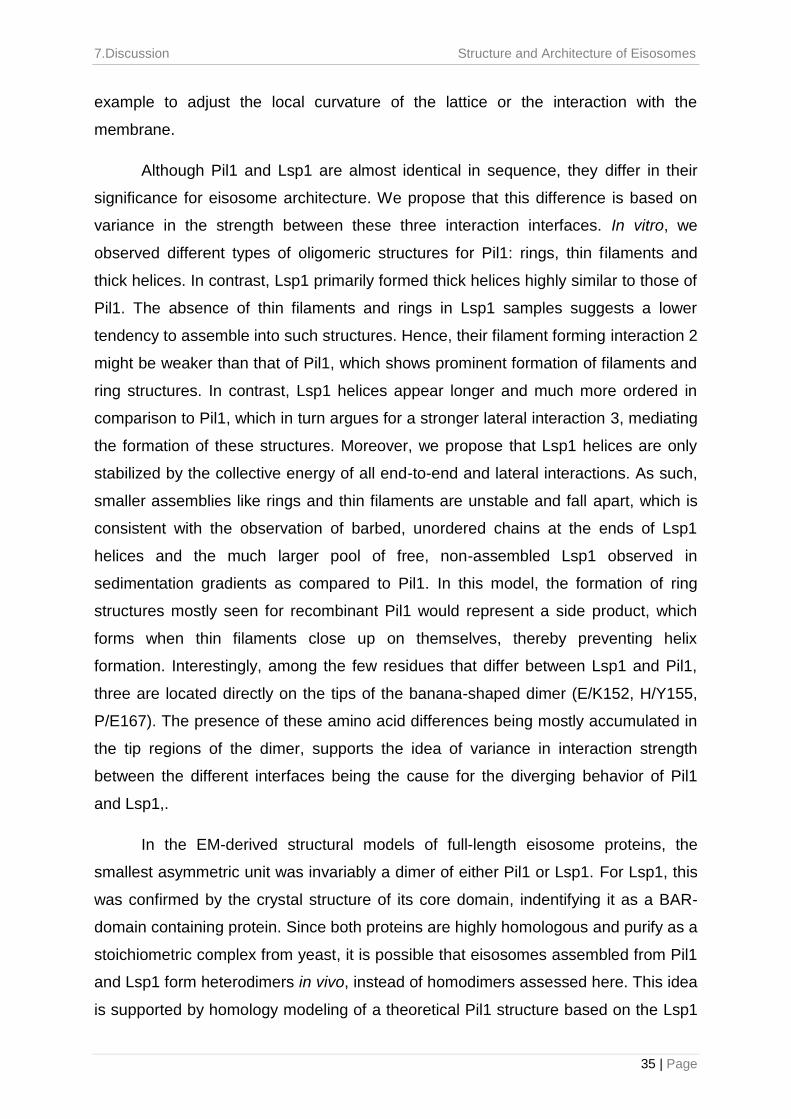
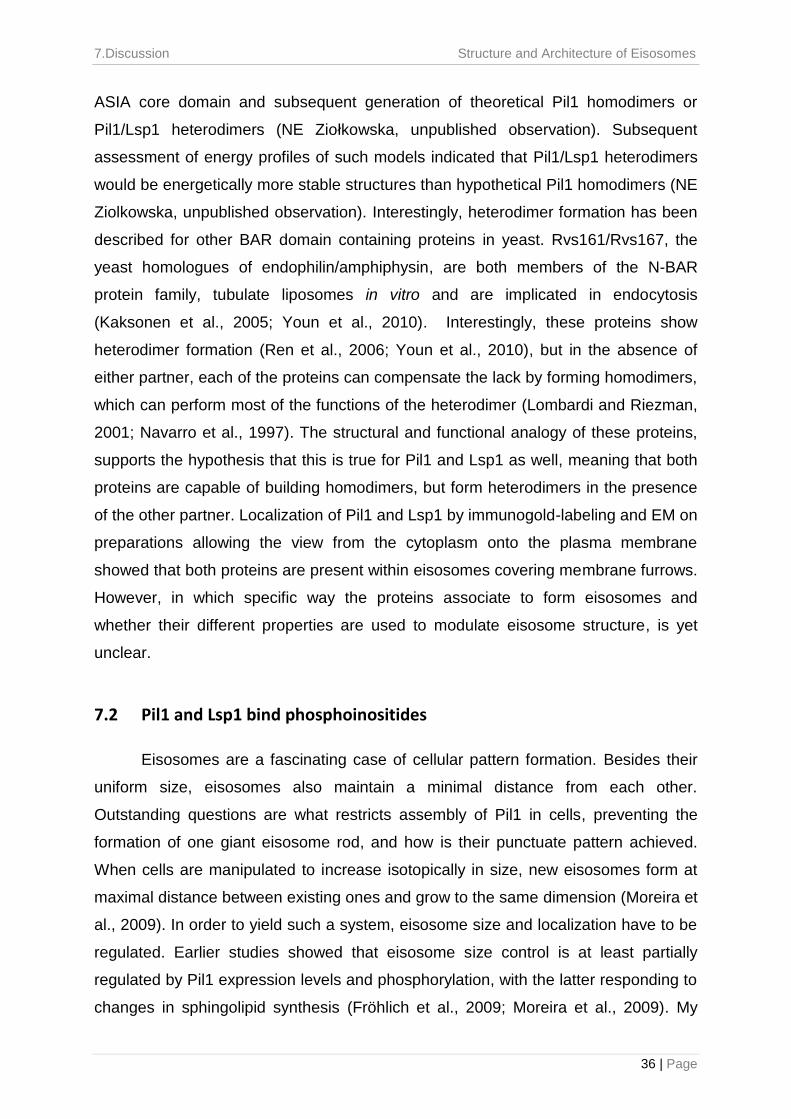
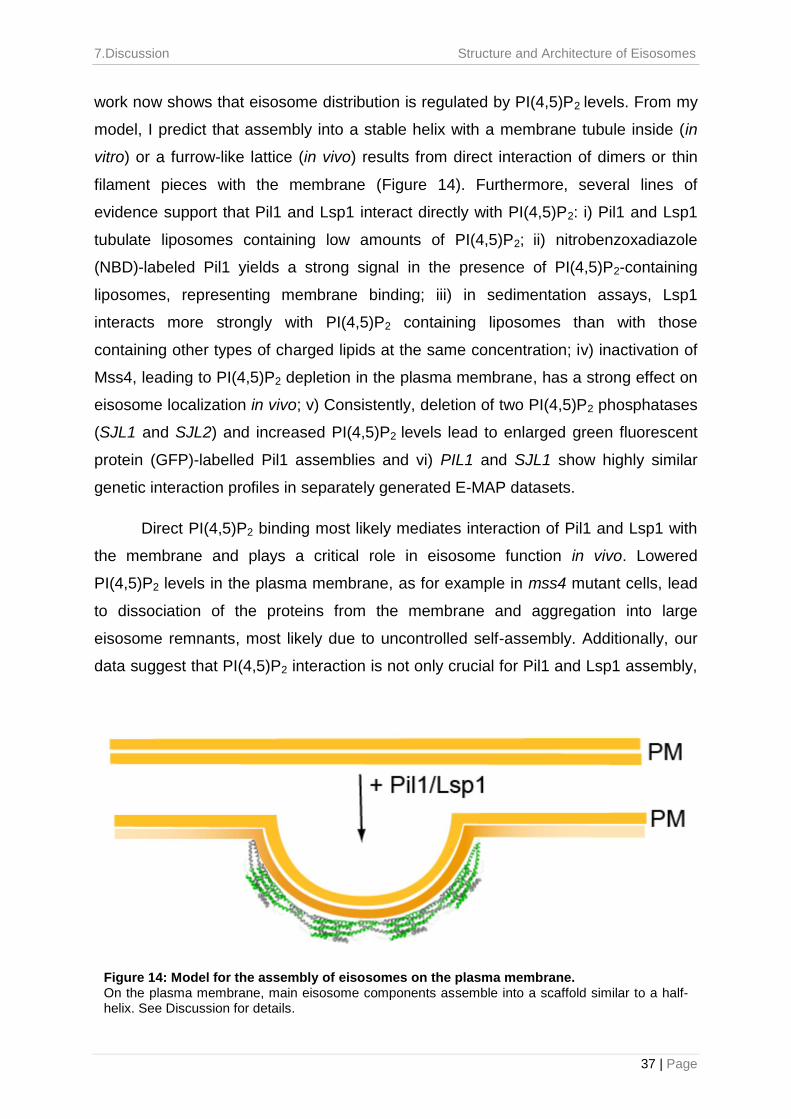
work now shows that eisosome distribution is regulated by PI(4,5)P2 levels. From my
model, I predict that assembly into a stable helix with a membrane tubule inside (in
vitro) or a furrow-like lattice (in vivo) results from direct interaction of dimers or thin
filament pieces with the membrane (Figure 14). Furthermore, several lines of
evidence support that Pil1 and Lsp1 interact directly with PI(4,5)P2: i) Pil1 and Lsp1
tubulate liposomes containing low amounts of PI(4,5)P2; ii) nitrobenzoxadiazole
(NBD)-labeled Pil1 yields a strong signal in the presence of PI(4,5)P2-containing
liposomes, representing membrane binding; iii) in sedimentation assays, Lsp1
interacts more strongly with PI(4,5)P2 containing liposomes than with those
containing other types of charged lipids at the same concentration; iv) inactivation of
Mss4, leading to PI(4,5)P2 depletion in the plasma membrane, has a strong effect on
eisosome localization in vivo; v) Consistently, deletion of two PI(4,5)P2 phosphatases
(SJL1 and SJL2) and increased PI(4,5)P2 levels lead to enlarged green fluorescent
protein (GFP)-labelled Pil1 assemblies and vi) PIL1 and SJL1 show highly similar
genetic interaction profiles in separately generated E-MAP datasets.
Direct PI(4,5)P2 binding most likely mediates interaction of Pil1 and Lsp1 with
the membrane and plays a critical role in eisosome function in vivo. Lowered
PI(4,5)P2 levels in the plasma membrane, as for example in mss4 mutant cells, lead
to dissociation of the proteins from the membrane and aggregation into large
eisosome remnants, most likely due to uncontrolled self-assembly. Additionally, our
data suggest that PI(4,5)P2 interaction is not only crucial for Pil1 and Lsp1 assembly,
Figure 14: Model for the assembly of eisosomes on the plasma membrane. On the plasma membrane, main eisosome components assemble into a scaffold similar to a half-helix. See Discussion for details.
7.Discussion Structure and Architecture of Eisosomes
38 | Page
but also for their function in regulating plasma membrane organization of the MCC
domain. Specifically, the trans-membrane protein Sur7, loses its punctuate MCC
localization and becomes uniformly distributed in the plasma membrane upon
PI(4,5)P2 depletion and consequent collapse of eisosomes in mss4 mutant cells.
Moreover, PI(4,5)P2 interaction and clustering may regulate eisosome distribution. In
such a model, PI(4,5)P2 binding of the many eisosome components would lead to
accumulation of this lipid in the MCC and concomitantly its local depletion in the
surrounding membrane region, by being the limiting factor. This could explain why
new eisosomes never form right next to existing ones, but always at minimal
distance. A prediction from this hypothesis is that PI(4,5)P2 stabilizes Pil1
assemblies. Consistently, I observe such an effect in vitro, where liposome binding
stabilized Pil1 to form very long helices compared to protein alone, thus validating
this hypothesis. Additionally, this may also explain why eisosomes are not formed at
bud-tips, where Pil1 and Lsp1 compete for lipid binding with many higher affinity
PI(4,5)P2-binding proteins that are targeted there. Of course this model does not
exclude that other proteins and regulatory factors may act to fine-tune assembly and
pattern formation. Good candidates for this are proteins encoded by genes whose
mutations affect the eisosome pattern in cells, as for example Eis1/Ymr031c (Fröhlich
et al., 2009) However, it is currently unknown whether these proteins play a direct
structural role or function indirectly, for example by altering the phosphorylation state
of eisosome proteins.
An important question to fully understand eisosome-mediated MCC domain
organization is how the proteins interact with PI(4,5)P2 molecularly. X-ray structure
determination unveiled the stable core domain of Lsp1 as a BAR domain containing
protein. Rigid body fitting of Lsp1 ASIA into EM-derived model of membrane-bound
Lsp1, illustrated that the protein faces the membrane with its concave surface, as
described for other members of this family (Frost et al., 2008). A striking feature of
this region is a patch of positively charged amino acids that is conserved in fungi. I
found that amino acids in this patch are required for efficient membrane binding in
vitro, as well as for Pil1 function in plasma membrane organization in vivo. This
positively charged surface patch likely interacts with the negatively charged
headgroups of PI(4,5)P2, since mutation of these amino acids leads to a loss of
membrane binding affinity in vitro. Furthermore, mutations of residues in the patch
lead to a phenotype of Pil1 localization in vivo, similar to the one observed after
7.Discussion Structure and Architecture of Eisosomes
39 | Page
depleting PI(4,5)P2 by inactivating Mss4, the kinase generating this lipid. Additionally,
one of the phosphorylation sites mimicked in pil1(4D) (S59) is located within this
patch, thereby introducing an opposite charge, which could explain at least in part the
disassembly phenotype of pil1(4D) in vitro and in vivo.
In summary, perturbations in PI(4,5)P2 binding in vivo, either by depletion of
this lipid or mutations in the lipid interaction interface of Pil1 lead to its dissociation
from the membrane, the formation of eisosome remnants as well as the loss of
plasma membrane domain organization. As such, PI(4,5)P2 interaction of eisosome
proteins is crucial for eisosome assembly and function.
7.3 Pil1 and Lsp1 sculpt membranes
How can self-assembly of Pil1 and Lsp1 lead to the formation or stabilization of
curved membranes, such as tubules and furrows? In general, two mechanisms how
proteins generate and stabilize membrane curvature have been described, protein
scaffolding of the membrane and insertion of an amphipathic alpha helix into the
lipid-bilayer, a so-called “wedge” (Zimmerberg and Kozlov, 2006). However, both
mechanisms are not mutually exclusive. Fitting of Lsp1 ASIA crystal structure into the
EM-derived 3D maps of full-length Lsp1 with and without bound membranes showed
that the protein apposes its concave surface towards the membrane, indicating a
scaffolding mechanism. Strikingly, N-BAR domains share the highest structural
similarity to the Lsp1 ASIA model. Members of this protein family are characterized
by their combination of scaffolding and wedge mechanism and comprise an N-
terminal amphipatic segment that inserts into the lipid bilayer for efficient membrane
bending (Gallop et al., 2006; Masuda and Mochizuki, 2010). In addition to a patch of
positively charged amino acids, we identified the N-terminal segment of Pil1 and
Lsp1 as required for efficient membrane binding. Although, this part of the protein is
missing in our crystal structure, fitting in the EM-derived 3D maps shows that the
proteins’ N-termini are located within the concave surface of the BAR domain and
point towards the membrane, theoretically allowing insertion into the lipid bilyer.
Consistently, the reconstruction from full-length membrane-bound Lsp1 shows
additional density pointing towards the surface of the membrane. This could
represent the N-terminal segment of the protein, which is unordered in the absence
of membrane and thereby not detected in the 3D map of the proteins alone, but gains
7.Discussion Structure and Architecture of Eisosomes
40 | Page
higher order upon membrane binding and thus, becomes detectable in the presence
of the membrane. Although this additional density points towards the membrane
surface, there is an obvious gap between the protein coat and the membrane, which
is even larger in all other EM models. One explanation for this could be the cause of
lipid disorder in the outer membrane leaflet due to the insertion of the N-terminus,
thereby leading to the lack of resolved density in this region. Such phenomenon has
been observed earlier for Endophilin, a member of the N-BAR domain protein family
(Suresh and Edwardson, 2010). Hence, insertion of such an N-terminal segment of
Pil1 and Lsp1 could contribute to membrane binding and bending and maybe also to
membrane domain organization by the accumulation of a specific protein/lipid
environment. However, whether the N-termini of eisosome proteins insert an
amphipathic alpha helix into the lipid bilayer according to the wedging mechanism or
rather just externally associate with the membrane by electrostatic interactions with
the lipid headgroups still needs to be confirmed.
Eisosome structure in general appears flexible. DEEM data of yeast plasma
membrane fractions showed that the structures identified as eisosomes vary in their
curvature. While some of them appear rather flat, other ones clearly show higher
curvature (Figure 15A). This is consistent with the diameter variation observed in the
reconstructions of Lsp1 alone, as well as membrane-bound Lsp1 and Pil1. All
structures showed a repeating asymmetric unit with similar morphology, but the
helical arrangement of these units varied with different diameters. This suggests that
individual dimeric Pil1 and/or Lsp1 BAR domains might rotate relative to each other,
leading to these different helical parameters (Figure 15B). This phenomenon has
been described for other BAR domain containing proteins before, where CIP4 F-BAR
domain dimers form tubules with altering diameter by being tilted relatively to the
cylindrical axis (Frost et al., 2008). Such rearrangement could be supported by the
flexibility of the proteins tip regions, as observed in the crystal structure of Lsp1 ASIA.
In vivo, rotation of Pil1 and Lsp1 in eisosomes could result in the constriction or
widening of the membrane furrow. Interestingly, pulse-chase experiments, monitoring
the uptake of fluorescent lipid-dye FM4-64 shows accumulation into foci at some but
not all eisosomes before its uptake. This suggests that a certain subset of eisosomes
exhibits altered plasma membrane morphology in these sites in comparison to
others. However, what leads to altered curvature and whether variation in eisosome
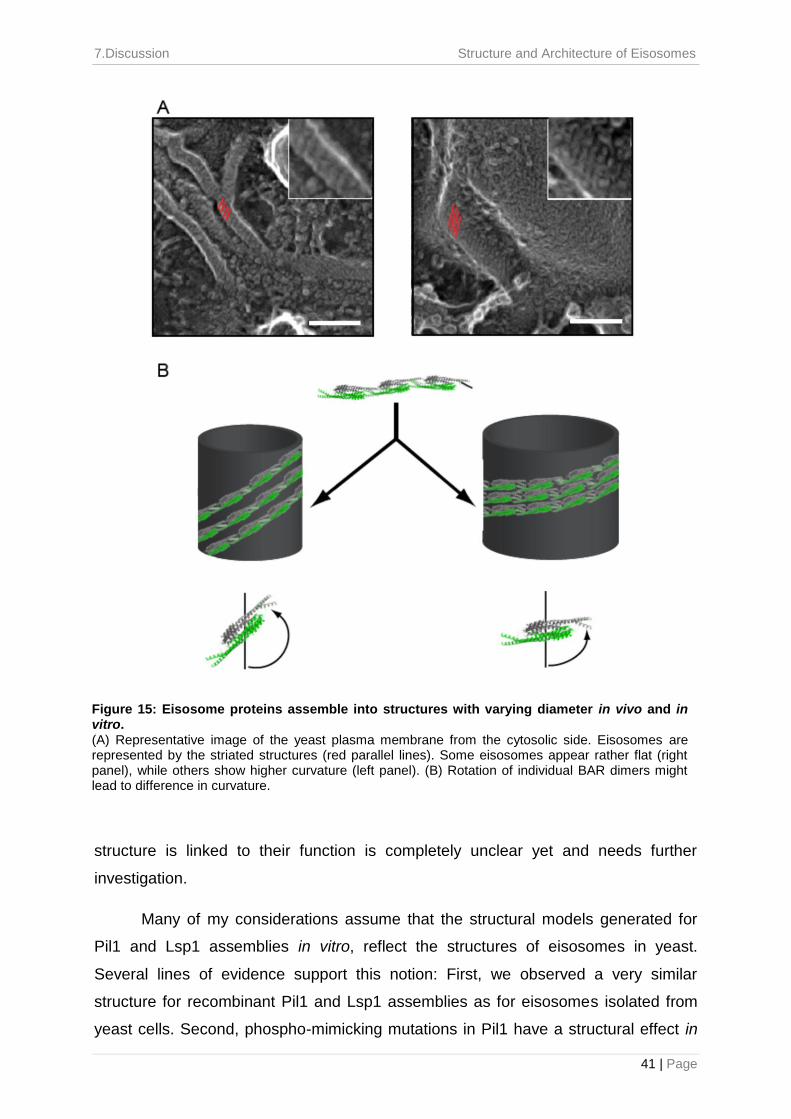
7.Discussion Structure and Architecture of Eisosomes
41 | Page
structure is linked to their function is completely unclear yet and needs further
investigation.
Many of my considerations assume that the structural models generated for
Pil1 and Lsp1 assemblies in vitro, reflect the structures of eisosomes in yeast.
Several lines of evidence support this notion: First, we observed a very similar
structure for recombinant Pil1 and Lsp1 assemblies as for eisosomes isolated from
yeast cells. Second, phospho-mimicking mutations in Pil1 have a structural effect in
Figure 15: Eisosome proteins assemble into structures with varying diameter in vivo and in vitro. (A) Representative image of the yeast plasma membrane from the cytosolic side. Eisosomes are represented by the striated structures (red parallel lines). Some eisosomes appear rather flat (right panel), while others show higher curvature (left panel). (B) Rotation of individual BAR dimers might lead to difference in curvature.
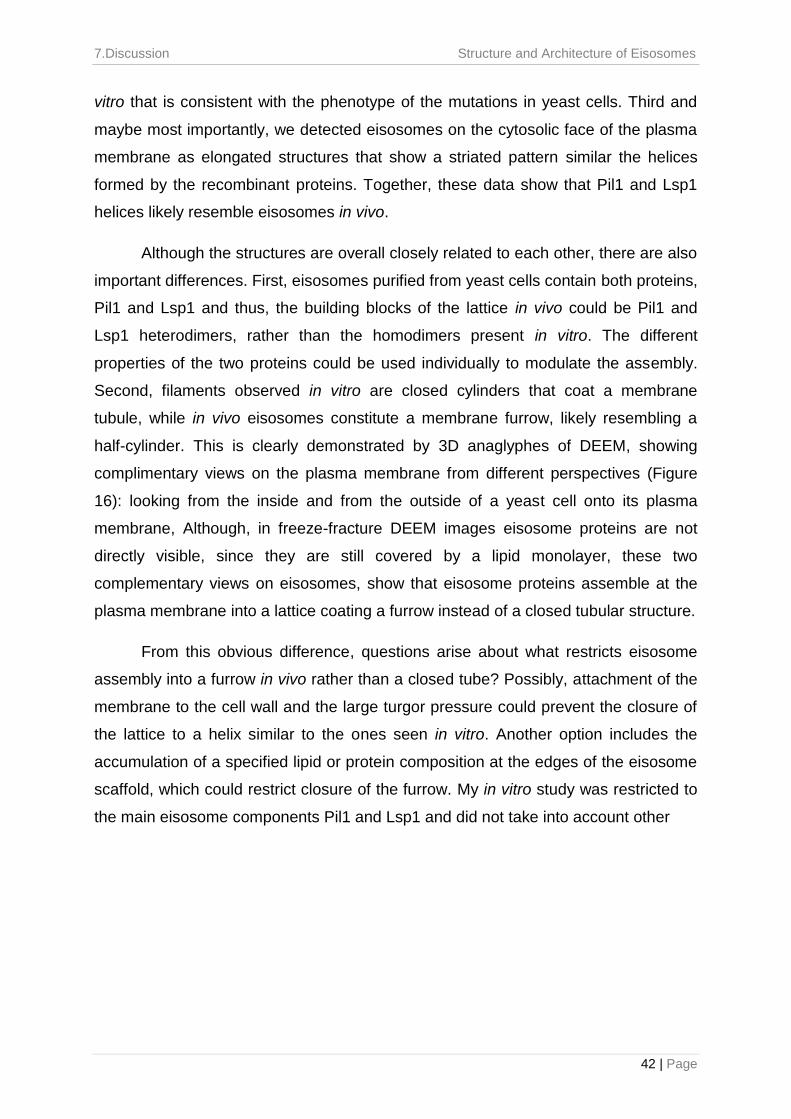
7.Discussion Structure and Architecture of Eisosomes
42 | Page
vitro that is consistent with the phenotype of the mutations in yeast cells. Third and
maybe most importantly, we detected eisosomes on the cytosolic face of the plasma
membrane as elongated structures that show a striated pattern similar the helices
formed by the recombinant proteins. Together, these data show that Pil1 and Lsp1
helices likely resemble eisosomes in vivo.
Although the structures are overall closely related to each other, there are also
important differences. First, eisosomes purified from yeast cells contain both proteins,
Pil1 and Lsp1 and thus, the building blocks of the lattice in vivo could be Pil1 and
Lsp1 heterodimers, rather than the homodimers present in vitro. The different
properties of the two proteins could be used individually to modulate the assembly.
Second, filaments observed in vitro are closed cylinders that coat a membrane
tubule, while in vivo eisosomes constitute a membrane furrow, likely resembling a
half-cylinder. This is clearly demonstrated by 3D anaglyphes of DEEM, showing
complimentary views on the plasma membrane from different perspectives (Figure
16): looking from the inside and from the outside of a yeast cell onto its plasma
membrane, Although, in freeze-fracture DEEM images eisosome proteins are not
directly visible, since they are still covered by a lipid monolayer, these two
complementary views on eisosomes, show that eisosome proteins assemble at the
plasma membrane into a lattice coating a furrow instead of a closed tubular structure.
From this obvious difference, questions arise about what restricts eisosome
assembly into a furrow in vivo rather than a closed tube? Possibly, attachment of the
membrane to the cell wall and the large turgor pressure could prevent the closure of
the lattice to a helix similar to the ones seen in vitro. Another option includes the
accumulation of a specified lipid or protein composition at the edges of the eisosome
scaffold, which could restrict closure of the furrow. My in vitro study was restricted to
the main eisosome components Pil1 and Lsp1 and did not take into account other
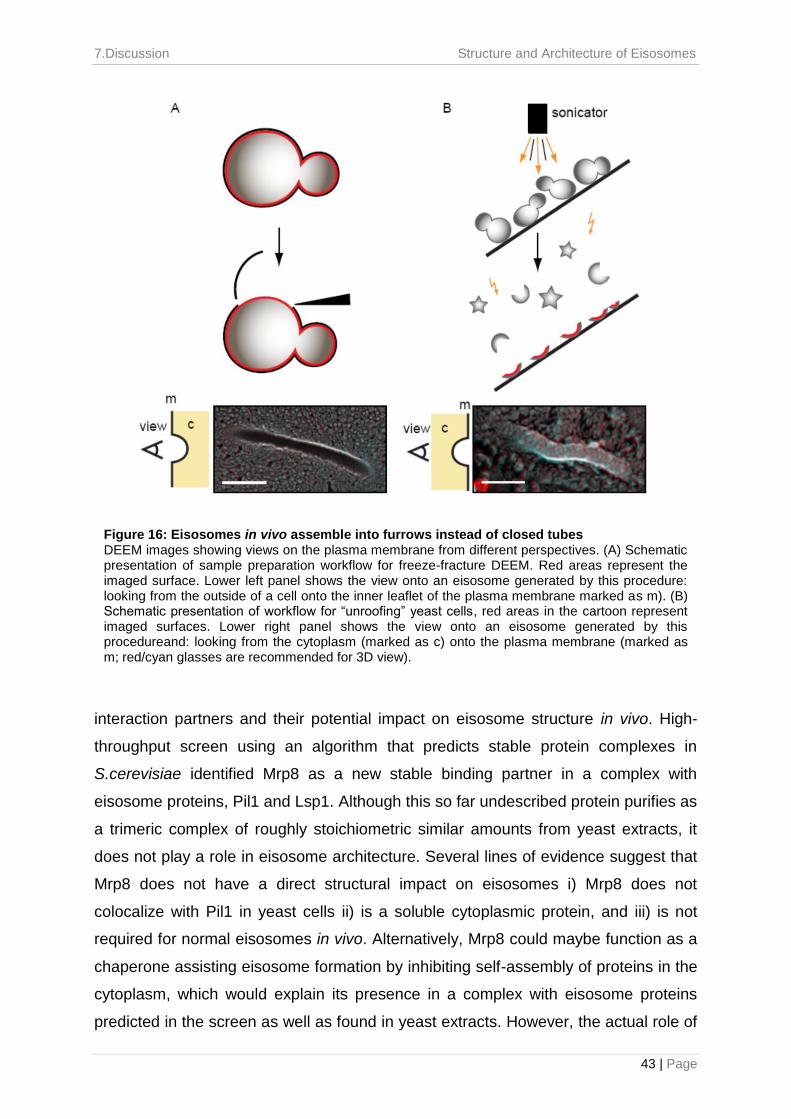
7.Discussion Structure and Architecture of Eisosomes
43 | Page
interaction partners and their potential impact on eisosome structure in vivo. High-
throughput screen using an algorithm that predicts stable protein complexes in
S.cerevisiae identified Mrp8 as a new stable binding partner in a complex with
eisosome proteins, Pil1 and Lsp1. Although this so far undescribed protein purifies as
a trimeric complex of roughly stoichiometric similar amounts from yeast extracts, it
does not play a role in eisosome architecture. Several lines of evidence suggest that
Mrp8 does not have a direct structural impact on eisosomes i) Mrp8 does not
colocalize with Pil1 in yeast cells ii) is a soluble cytoplasmic protein, and iii) is not
required for normal eisosomes in vivo. Alternatively, Mrp8 could maybe function as a
chaperone assisting eisosome formation by inhibiting self-assembly of proteins in the
cytoplasm, which would explain its presence in a complex with eisosome proteins
predicted in the screen as well as found in yeast extracts. However, the actual role of
Figure 16: Eisosomes in vivo assemble into furrows instead of closed tubes DEEM images showing views on the plasma membrane from different perspectives. (A) Schematic presentation of sample preparation workflow for freeze-fracture DEEM. Red areas represent the imaged surface. Lower left panel shows the view onto an eisosome generated by this procedure: looking from the outside of a cell onto the inner leaflet of the plasma membrane marked as m). (B) Schematic presentation of workflow for “unroofing” yeast cells, red areas in the cartoon represent imaged surfaces. Lower right panel shows the view onto an eisosome generated by this procedureand: looking from the cytoplasm (marked as c) onto the plasma membrane (marked as m; red/cyan glasses are recommended for 3D view).
7.Discussion Structure and Architecture of Eisosomes
44 | Page
this abundant interaction partner of eisosome proteins still needs to be further
analyzed, as well as potential other, so far unknown proteins that might have an
impact on eisosome structure in vivo.
7.4 Pil1 and Lsp1 stabilize plasma membrane domains
Formation of the eisosome scaffold can explain how the lateral
compartmentalization of the plasma membrane in domains of distinct lipid and protein
composition is achieved mechanistically, in particular for the MCC. We propose that
lipid binding and self-assembly of Pil1 and Lsp1 into a protein scaffold creates a
specific membrane environment in the overlying MCC. This domain comprises local
curvature and may be enriched in PI(4,5)P2 based on the presence of the many
binding sites for this lipid. This hypothesis is supported by two independently
generated, unbiased, large scale E-MAP datasets that show highest correlation of
genetic profiles between PIL1 and SJL1, a PI(4,5)P2 phosphatase. The absence of
this function would have similar consequences as deletion of an enzyme that
dephosphorylates this lipid –namely a rise in available PI(4,5)P2. This finding
suggests that eisosomes function in PI(4,5)P2 turnover, such as the sequestration or
hydrolysis of this lipid and could constitute a lipid store in the membrane. However, E-
MAP data are biased towards specific set of genes. These findings therefore do not
rule out other functions of eisosomes when a different set is tested. Furthermore,
specific PI(4,5)P2 binding of eisosomes could create a specialized membrane
environment that selects for certain proteins and lipids, thereby excluding others. As
such, eisosome scaffolds could for example cluster and stabilize nano-scale raft
domains into larger micron-scale MCCs (Lingwood and Simons, 2010). Since the
MCC is suggested to be enriched in ergosterol, eisosomes could utilize
sterol/sphingolipid connectivity to form this domain (Grossmann et al., 2007).
According to eisosomes being implicated in endocytosis, the accumulation of
PI(4,5)P2 in the MCC could also introduce a fission point in the membrane due to
line-tension, similar to what has been suggested for clathrin-mediated endocytosis to
induce vesicle scission (Liu et al., 2009). In this respect, it is interesting to note that
we often observed membrane invaginations right next to eisosomes in my DEEM
data of yeast plasma membrane fractions.
7.Discussion Structure and Architecture of Eisosomes
45 | Page
7.5 Evolutionary conservation of eisosomes
One important question about eisosome biology refers to the evolutionary
conservation of their molecular components. So far, the primary structure of
eisosome proteins did not give any hints about homologous proteins in organisms
other than fungi. This study reveals eisosome proteins Pil1 and Lsp1 as members of
the BAR domain protein family, an ancient, evolutionary conserved group of proteins
that binds and deforms membranes and has been implicated in endocytosis.
Strikingly, the amino acid sequence of Pil1 and Lsp1 did not give any indication about
the proteins’ 3D conformation. Only the knowledge of their molecular structure
allowed classification into this protein family. Specifically, the structure of Pil1 and
Lsp1 is closely related to endocytic effectors, such as endophilin and amphiphysin
BAR domains, with whom they also share several other intriguing similarities: both
protein families consist of BAR-domains, can assemble into a membrane scaffold,
are connected to PI(4,5)P2 rich membranes and function with synaptojanin-proteins
(Itoh et al., 2005). Furthermore, both sets of proteins were linked to endocytosis, but
their deletions have mild defects on protein uptake in most systems (Brach et al.,
2011; Grossmann et al., 2008; Schuske et al., 2003; Verstreken et al., 2003; Walther
et al., 2006). In mammalian cells, endophilin recruits synaptojanin, the mammalian
homologue of Sjl1, to endocytic sites through an SH3-domain (Schuske et al., 2003).
Synaptojanin in turn acts preferentially on membranes that were curved for example
by interaction with endophilin (Chang-Ileto et al., 2011). Neither Pil1 nor Lsp1
contains such a SH3 domain. However, it was recently reported that membrane
bending of endophilin is especially important for many of the protein’s functions in
Caenorhabditis elegans (Bai et al., 2010). Also Pil1 is capable of bending
membranes and the high similarity of interaction profiles in pil1 and sjl1 further
supports the idea that both genes participate in the same process, which reflects an
important function of the Pil1 BAR domain. The yeast endophilin/amphiphysin
homologues Rvs161/Rvs167 are also highly similar to Pil1 and Lsp1’s architecture
and molecular shape. These members of the N-BAR domain protein family are
implicated in vesicle scission events of actin patch-dependent endocytosis (Liu et al.,
2006; Liu et al., 2009). Interestingly, deletion of Lsp1 suppresses at least to some
extend Rvs161 function (Walther et al., 2006), which could indicate partially
overlapping tasks.
7.Discussion Structure and Architecture of Eisosomes
46 | Page
Although, the mechanism of plasma membrane organization in mammalian
cells is barely understood, some characterized examples show striking conceptual
similarities to eisosome-driven plasma membrane organization. One example
constitutes flask-shaped caveolae at the plasma membrane of mammalian cells.
Besides their apparent difference in morphology, my data suggests analogous
concepts to eisosomes in yeast: i) their major component caveolin1 self-associates to
form a protein coat at the plasma membrane, ii) caveolae form stable plasma
membrane domains, iii) these domains are thought to be enriched in sphingolipids
and sterols and iii) they are postulated to participate in cargo uptake only under
specific conditions, but not in bulk endocytosis (Fernandez et al., 2002; Grossmann
et al., 2008; Grossmann et al., 2007; Parton and Simons, 2007; Thomsen et al.,
2002; Walther et al., 2006). Caveolae have also been described to function in lipid
and membrane storage (Parton and Simons, 2007). Furthermore, recent studies
showed that Caveolae also function as physiological membrane reservoir that
accommodates to mechanical membrane stress. Based on the flask-shaped
morphology of this membrane domain, they exhibit a larger membrane surface than
flat membranes. Under conditions of osmotic swelling or stretching of the membrane
Caveolae flatten, thereby counterbalancing membrane tension and disappear from
the membrane (Sinha et al., 2011). However, whether eisosomes perform analogous
function to Caveolae still needs to be further investigated.
In summary, formation of the eisosome protein scaffold can mechanistically
explain how the yeast plasma membrane is organized in domains of distinct
composition, in particular for the MCC: We posit that membrane binding and
assembly by Pil1 and Lsp1 will create a specific environment in the overlaying MCC,
which is locally curved and may have increased PI(4,5)P2 concentration due to the
presence of many binding sites for this lipid. This special environment then drives
formation of the MCC domain. Most often, striking features are conserved between
different biological systems. As such, the mechanistic feature of cells to organizing
their plasma membranes into functional domains by self-assembly of a protein
scaffold represents a universal cell biological principle.
8. References Structure and Architecture of Eisosomes
47 | Page
8 References
Babbey, C.M., N. Ahktar, E. Wang, C.C. Chen, B.D. Grant, and K.W. Dunn. 2006. Rab10 regulates membrane transport through early endosomes of polarized Madin-Darby canine kidney cells. Mol Biol Cell. 17:3156-3175.
Bagnat, M., S. Keranen, A. Shevchenko, and K. Simons. 2000. Lipid rafts function in biosynthetic delivery of proteins to the cell surface in yeast. Proc Natl Acad Sci U S A. 97:3254-3259.
Bai, J., Z. Hu, J.S. Dittman, E.C. Pym, and J.M. Kaplan. 2010. Endophilin functions as a membrane-bending molecule and is delivered to endocytic zones by exocytosis. Cell. 143:430-441.
Berchtold, D., and T.C. Walther. 2009. TORC2 plasma membrane localization is essential for cell viability and restricted to a distinct domain. Mol Biol Cell. 20:1565-1575.
Carmosino, M., G. Valenti, M. Caplan, and M. Svelto. 2010. Polarized traffic towards the cell surface: how to find the route. Biol Cell. 102:75-91.
Casal, E., L. Federici, W. Zhang, J. Fernandez-Recio, E.M. Priego, R.N. Miguel, J.B. DuHadaway, G.C. Prendergast, B.F. Luisi, and E.D. Laue. 2006. The crystal structure of the BAR domain from human Bin1/amphiphysin II and its implications for molecular recognition. Biochemistry. 45:12917-12928.
Daum, G., N.D. Lees, M. Bard, and R. Dickson. 1998. Biochemistry, cell biology and molecular biology of lipids of Saccharomyces cerevisiae. Yeast. 14:1471-1510.
Di Paolo, G., and P. De Camilli. 2006. Phosphoinositides in cell regulation and membrane dynamics. Nature. 443:651-657.
Dickson, R.C., C. Sumanasekera, and R.L. Lester. 2006. Functions and metabolism of sphingolipids in Saccharomyces cerevisiae. Prog Lipid Res. 45:447-465.
Drin, G., J.F. Casella, R. Gautier, T. Boehmer, T.U. Schwartz, and B. Antonny. 2007. A general amphipathic alpha-helical motif for sensing membrane curvature. Nat Struct Mol Biol. 14:138-146.
Farsad, K., N. Ringstad, K. Takei, S.R. Floyd, K. Rose, and P. De Camilli. 2001. Generation of high curvature membranes mediated by direct endophilin bilayer interactions. J Cell Biol. 155:193-200.
Ferguson, S.M., A. Raimondi, S. Paradise, H. Shen, K. Mesaki, A. Ferguson, O. Destaing, G. Ko, J. Takasaki, O. Cremona, O.T. E, and P. De Camilli. 2009. Coordinated actions of actin and BAR proteins upstream of dynamin at endocytic clathrin-coated pits. Dev Cell. 17:811-822.
Ford, M.G., I.G. Mills, B.J. Peter, Y. Vallis, G.J. Praefcke, P.R. Evans, and H.T. McMahon. 2002. Curvature of clathrin-coated pits driven by epsin. Nature. 419:361-366.
Fra, A.M., E. Williamson, K. Simons, and R.G. Parton. 1995. De novo formation of caveolae in lymphocytes by expression of VIP21-caveolin. Proc Natl Acad Sci U S A. 92:8655-8659.
Fröhlich, F., K. Moreira, P.S. Aguilar, N.C. Hubner, M. Mann, P. Walter, and T.C. Walther. 2009. A genome-wide screen for genes affecting eisosomes reveals Nce102 function in sphingolipid signaling. J Cell Biol. 185:1227-1242.
Frost, A., R. Perera, A. Roux, K. Spasov, O. Destaing, E.H. Egelman, P. De Camilli, and V.M. Unger. 2008. Structural basis of membrane invagination by F-BAR domains. Cell. 132:807-817.
8. References Structure and Architecture of Eisosomes
48 | Page
Gallop, J.L., C.C. Jao, H.M. Kent, P.J. Butler, P.R. Evans, R. Langen, and H.T. McMahon. 2006. Mechanism of endophilin N-BAR domain-mediated membrane curvature. EMBO J. 25:2898-2910.
Gallop, J.L., and H.T. McMahon. 2005. BAR domains and membrane curvature: bringing your curves to the BAR. Biochem Soc Symp:223-231.
Giuliani, C., F. Troglio, Z. Bai, F.B. Patel, A. Zucconi, M.G. Malabarba, A. Disanza, T.B. Stradal, G. Cassata, S. Confalonieri, J.D. Hardin, M.C. Soto, B.D. Grant, and G. Scita. 2009. Requirements for F-BAR proteins TOCA-1 and TOCA-2 in actin dynamics and membrane trafficking during Caenorhabditis elegans oocyte growth and embryonic epidermal morphogenesis. PLoS Genet. 5:e1000675.
Grossmann, G., J. Malinsky, W. Stahlschmidt, M. Loibl, I. Weig-Meckl, W.B. Frommer, M. Opekarova, and W. Tanner. 2008. Plasma membrane microdomains regulate turnover of transport proteins in yeast. J Cell Biol. 183:1075-1088.
Grossmann, G., M. Opekarova, J. Malinsky, I. Weig-Meckl, and W. Tanner. 2007. Membrane potential governs lateral segregation of plasma membrane proteins and lipids in yeast. EMBO J. 26:1-8.
Guerriero, C.J., Y. Lai, and O.A. Weisz. 2008. Differential sorting and Golgi export requirements for raft-associated and raft-independent apical proteins along the biosynthetic pathway. J Biol Chem. 283:18040-18047.
Hancock, J.F. 2006. Lipid rafts: contentious only from simplistic standpoints. Nat Rev Mol Cell Biol. 7:456-462.
Harder, T., and K. Simons. 1997. Caveolae, DIGs, and the dynamics of sphingolipid-cholesterol microdomains. Curr Opin Cell Biol. 9:534-542.
Harlan, J.E., P.J. Hajduk, H.S. Yoon, and S.W. Fesik. 1994. Pleckstrin homology domains bind to phosphatidylinositol-4,5-bisphosphate. Nature. 371:168-170.
Haslam, R.J., H.B. Koide, and B.A. Hemmings. 1993. Pleckstrin domain homology. Nature. 363:309-310.
Henne, W.M., H.M. Kent, M.G. Ford, B.G. Hegde, O. Daumke, P.J. Butler, R. Mittal, R. Langen, P.R. Evans, and H.T. McMahon. 2007. Structure and analysis of FCHo2 F-BAR domain: a dimerizing and membrane recruitment module that effects membrane curvature. Structure. 15:839-852.
Hoekstra, D., D. Tyteca, and I.S.C. van. 2004. The subapical compartment: a traffic center in membrane polarity development. J Cell Sci. 117:2183-2192.
Honerkamp-Smith, A.R., P. Cicuta, M.D. Collins, S.L. Veatch, M. den Nijs, M. Schick, and S.L. Keller. 2008. Line tensions, correlation lengths, and critical exponents in lipid membranes near critical points. Biophys J. 95:236-246.
Honerkamp-Smith, A.R., S.L. Veatch, and S.L. Keller. 2009. An introduction to critical points for biophysicists; observations of compositional heterogeneity in lipid membranes. Biochim Biophys Acta. 1788:53-63.
Hu, J., Y. Shibata, C. Voss, T. Shemesh, Z. Li, M. Coughlin, M.M. Kozlov, T.A. Rapoport, and W.A. Prinz. 2008. Membrane proteins of the endoplasmic reticulum induce high-curvature tubules. Science. 319:1247-1250.
Hurley, J.H. 2006. Membrane binding domains. Biochim Biophys Acta. 1761:805-811.
Ikonen, E. 2008. Cellular cholesterol trafficking and compartmentalization. Nat Rev Mol Cell Biol. 9:125-138.
Ipsen, J.H., G. Karlstrom, O.G. Mouritsen, H. Wennerstrom, and M.J. Zuckermann. 1987. Phase equilibria in the phosphatidylcholine-cholesterol system. Biochim Biophys Acta. 905:162-172.
8. References Structure and Architecture of Eisosomes
49 | Page
Itoh, T., K.S. Erdmann, A. Roux, B. Habermann, H. Werner, and P. De Camilli. 2005. Dynamin and the actin cytoskeleton cooperatively regulate plasma membrane invagination by BAR and F-BAR proteins. Dev Cell. 9:791-804.
Jacob, R., M. Heine, M. Alfalah, and H.Y. Naim. 2003. Distinct cytoskeletal tracks direct individual vesicle populations to the apical membrane of epithelial cells. Curr Biol. 13:607-612.
Janmey, P.A., and P.K. Kinnunen. 2006. Biophysical properties of lipids and dynamic membranes. Trends Cell Biol. 16:538-546.
Kahya, N., D. Scherfeld, K. Bacia, B. Poolman, and P. Schwille. 2003. Probing lipid mobility of raft-exhibiting model membranes by fluorescence correlation spectroscopy. J Biol Chem. 278:28109-28115.
Kaksonen, M., C.P. Toret, and D.G. Drubin. 2005. A modular design for the clathrin- and actin-mediated endocytosis machinery. Cell. 123:305-320.
Koster, G., M. VanDuijn, B. Hofs, and M. Dogterom. 2003. Membrane tube formation from giant vesicles by dynamic association of motor proteins. Proc Natl Acad Sci U S A. 100:15583-15588.
Kusumi, A., Y. Sako, and M. Yamamoto. 1993. Confined lateral diffusion of membrane receptors as studied by single particle tracking (nanovid microscopy). Effects of calcium-induced differentiation in cultured epithelial cells. Biophys J. 65:2021-2040.
Kutateladze, T.G. 2010. Translation of the phosphoinositide code by PI effectors. Nat Chem Biol. 6:507-513.
Lajoie, P., J.G. Goetz, J.W. Dennis, and I.R. Nabi. 2009. Lattices, rafts, and scaffolds: domain regulation of receptor signaling at the plasma membrane. J Cell Biol. 185:381-385.
Lapierre, L.A., R. Kumar, C.M. Hales, J. Navarre, S.G. Bhartur, J.O. Burnette, D.W. Provance, Jr., J.A. Mercer, M. Bahler, and J.R. Goldenring. 2001. Myosin vb is associated with plasma membrane recycling systems. Mol Biol Cell. 12:1843-1857.
Lee, A.G. 2003. Lipid-protein interactions in biological membranes: a structural perspective. Biochim Biophys Acta. 1612:1-40.
Lee, E., M. Marcucci, L. Daniell, M. Pypaert, O.A. Weisz, G.C. Ochoa, K. Farsad, M.R. Wenk, and P. De Camilli. 2002. Amphiphysin 2 (Bin1) and T-tubule biogenesis in muscle. Science. 297:1193-1196.
Lee, M.C., L. Orci, S. Hamamoto, E. Futai, M. Ravazzola, and R. Schekman. 2005. Sar1p N-terminal helix initiates membrane curvature and completes the fission of a COPII vesicle. Cell. 122:605-617.
Lee, S.H., F. Kerff, D. Chereau, F. Ferron, A. Klug, and R. Dominguez. 2007. Structural basis for the actin-binding function of missing-in-metastasis. Structure. 15:145-155.
Lemmon, M.A. 2008. Membrane recognition by phospholipid-binding domains. Nat Rev Mol Cell Biol. 9:99-111.
Lentz, B.R., D.A. Barrow, and M. Hoechli. 1980. Cholesterol-phosphatidylcholine interactions in multilamellar vesicles. Biochemistry. 19:1943-1954.
Levental, I., M. Grzybek, and K. Simons. 2010. Greasing their way: lipid modifications determine protein association with membrane rafts. Biochemistry. 49:6305-6316.
Lingwood, D., J. Ries, P. Schwille, and K. Simons. 2008. Plasma membranes are poised for activation of raft phase coalescence at physiological temperature. Proc Natl Acad Sci U S A. 105:10005-10010.
8. References Structure and Architecture of Eisosomes
50 | Page
Lingwood, D., and K. Simons. 2010. Lipid rafts as a membrane-organizing principle. Science. 327:46-50.
Lisanti, M.P., P.E. Scherer, J. Vidugiriene, Z. Tang, A. Hermanowski-Vosatka, Y.H. Tu, R.F. Cook, and M. Sargiacomo. 1994. Characterization of caveolin-rich membrane domains isolated from an endothelial-rich source: implications for human disease. J Cell Biol. 126:111-126.
Malinska, K., J. Malinsky, M. Opekarova, and W. Tanner. 2003. Visualization of protein compartmentation within the plasma membrane of living yeast cells. Mol Biol Cell. 14:4427-4436.
Masuda, M., and N. Mochizuki. 2010. Structural characteristics of BAR domain superfamily to sculpt the membrane. Semin Cell Dev Biol. 21:391-398.
Matlin, K.S., and K. Simons. 1984. Sorting of an apical plasma membrane glycoprotein occurs before it reaches the cell surface in cultured epithelial cells. J Cell Biol. 99:2131-2139.
Matter, K. 2000. Epithelial polarity: sorting out the sorters. Curr Biol. 10:R39-42. Mattila, P.K., A. Pykalainen, J. Saarikangas, V.O. Paavilainen, H. Vihinen, E.
Jokitalo, and P. Lappalainen. 2007. Missing-in-metastasis and IRSp53 deform PI(4,5)P2-rich membranes by an inverse BAR domain-like mechanism. J Cell Biol. 176:953-964.
Mayer, B.J., R. Ren, K.L. Clark, and D. Baltimore. 1993. A putative modular domain present in diverse signaling proteins. Cell. 73:629-630.
McMahon, H.T., and J.L. Gallop. 2005. Membrane curvature and mechanisms of dynamic cell membrane remodelling. Nature. 438:590-596.
Mellman, I. 1996. Endocytosis and molecular sorting. Annu Rev Cell Dev Biol. 12:575-625.
Merrifield, C.J., D. Perrais, and D. Zenisek. 2005. Coupling between clathrin-coated-pit invagination, cortactin recruitment, and membrane scission observed in live cells. Cell. 121:593-606.
Michelot, A., M. Costanzo, A. Sarkeshik, C. Boone, J.R. Yates, 3rd, and D.G. Drubin. 2010. Reconstitution and protein composition analysis of endocytic actin patches. Curr Biol. 20:1890-1899.
Moreira, K.E., T.C. Walther, P.S. Aguilar, and P. Walter. 2009. Pil1 controls eisosome biogenesis. Mol Biol Cell. 20:809-818.
Munro, S. 2003. Lipid rafts: elusive or illusive? Cell. 115:377-388. Murata, M., J. Peranen, R. Schreiner, F. Wieland, T.V. Kurzchalia, and K. Simons.
1995. VIP21/caveolin is a cholesterol-binding protein. Proc Natl Acad Sci U S A. 92:10339-10343.
Nelson, W.J., and C. Yeaman. 2001. Protein trafficking in the exocytic pathway of polarized epithelial cells. Trends Cell Biol. 11:483-486.
Opekarova, M., K. Malinska, L. Novakova, and W. Tanner. 2005. Differential effect of phosphatidylethanolamine depletion on raft proteins: further evidence for diversity of rafts in Saccharomyces cerevisiae. Biochim Biophys Acta. 1711:87-95.
Paladino, S., D. Sarnataro, R. Pillich, S. Tivodar, L. Nitsch, and C. Zurzolo. 2004. Protein oligomerization modulates raft partitioning and apical sorting of GPI-anchored proteins. J Cell Biol. 167:699-709.
Parton, R.G., and K. Simons. 2007. The multiple faces of caveolae. Nat Rev Mol Cell Biol. 8:185-194.
Pelkmans, L., and M. Zerial. 2005. Kinase-regulated quantal assemblies and kiss-and-run recycling of caveolae. Nature. 436:128-133.
8. References Structure and Architecture of Eisosomes
51 | Page
Peter, B.J., H.M. Kent, I.G. Mills, Y. Vallis, P.J. Butler, P.R. Evans, and H.T. McMahon. 2004. BAR domains as sensors of membrane curvature: the amphiphysin BAR structure. Science. 303:495-499.
Pfeiffer, S., S.D. Fuller, and K. Simons. 1985. Intracellular sorting and basolateral appearance of the G protein of vesicular stomatitis virus in Madin-Darby canine kidney cells. J Cell Biol. 101:470-476.
Qualmann, B., D. Koch, and M.M. Kessels. 2011. Let's go bananas: revisiting the endocytic BAR code. EMBO J. 30:3501-3515.
Rajendran, L., and K. Simons. 2005. Lipid rafts and membrane dynamics. J Cell Sci. 118:1099-1102.
Roland, J.T., A.K. Kenworthy, J. Peranen, S. Caplan, and J.R. Goldenring. 2007. Myosin Vb interacts with Rab8a on a tubular network containing EHD1 and EHD3. Mol Biol Cell. 18:2828-2837.
Roth, M.G. 2004. Phosphoinositides in constitutive membrane traffic. Physiol Rev. 84:699-730.
Rothberg, K.G., J.E. Heuser, W.C. Donzell, Y.S. Ying, J.R. Glenney, and R.G. Anderson. 1992. Caveolin, a protein component of caveolae membrane coats. Cell. 68:673-682.
Roux, A., G. Cappello, J. Cartaud, J. Prost, B. Goud, and P. Bassereau. 2002. A minimal system allowing tubulation with molecular motors pulling on giant liposomes. Proc Natl Acad Sci U S A. 99:5394-5399.
Salazar, M.A., A.V. Kwiatkowski, L. Pellegrini, G. Cestra, M.H. Butler, K.L. Rossman, D.M. Serna, J. Sondek, F.B. Gertler, and P. De Camilli. 2003. Tuba, a novel protein containing bin/amphiphysin/Rvs and Dbl homology domains, links dynamin to regulation of the actin cytoskeleton. J Biol Chem. 278:49031-49043.
Sargiacomo, M., P.E. Scherer, Z. Tang, E. Kubler, K.S. Song, M.C. Sanders, and M.P. Lisanti. 1995. Oligomeric structure of caveolin: implications for caveolae membrane organization. Proc Natl Acad Sci U S A. 92:9407-9411.
Sargiacomo, M., M. Sudol, Z. Tang, and M.P. Lisanti. 1993. Signal transducing molecules and glycosyl-phosphatidylinositol-linked proteins form a caveolin-rich insoluble complex in MDCK cells. J Cell Biol. 122:789-807.
Schuck, S., M.J. Gerl, A. Ang, A. Manninen, P. Keller, I. Mellman, and K. Simons. 2007. Rab10 is involved in basolateral transport in polarized Madin-Darby canine kidney cells. Traffic. 8:47-60.
Schwencke, C., R.C. Braun-Dullaeus, C. Wunderlich, and R.H. Strasser. 2006. Caveolae and caveolin in transmembrane signaling: Implications for human disease. Cardiovasc Res. 70:42-49.
Seet, L.F., and W. Hong. 2006. The Phox (PX) domain proteins and membrane traffic. Biochim Biophys Acta. 1761:878-896.
Sheetz, M.P., and S.J. Singer. 1974. Biological membranes as bilayer couples. A molecular mechanism of drug-erythrocyte interactions. Proc Natl Acad Sci U S A. 71:4457-4461.
Shenoy-Scaria, A.M., D.J. Dietzen, J. Kwong, D.C. Link, and D.M. Lublin. 1994. Cysteine3 of Src family protein tyrosine kinase determines palmitoylation and localization in caveolae. J Cell Biol. 126:353-363.
Shibata, Y., J. Hu, M.M. Kozlov, and T.A. Rapoport. 2009. Mechanisms shaping the membranes of cellular organelles. Annu Rev Cell Dev Biol. 25:329-354.
Shimada, A., H. Niwa, K. Tsujita, S. Suetsugu, K. Nitta, K. Hanawa-Suetsugu, R. Akasaka, Y. Nishino, M. Toyama, L. Chen, Z.J. Liu, B.C. Wang, M. Yamamoto, T. Terada, A. Miyazawa, A. Tanaka, S. Sugano, M. Shirouzu, K.
8. References Structure and Architecture of Eisosomes
52 | Page
Nagayama, T. Takenawa, and S. Yokoyama. 2007. Curved EFC/F-BAR-domain dimers are joined end to end into a filament for membrane invagination in endocytosis. Cell. 129:761-772.
Simons, K., and E. Ikonen. 1997. Functional rafts in cell membranes. Nature. 387:569-572.
Simons, K., and D. Toomre. 2000. Lipid rafts and signal transduction. Nat Rev Mol Cell Biol. 1:31-39.
Simons, K., and G. van Meer. 1988. Lipid sorting in epithelial cells. Biochemistry. 27:6197-6202.
Simons, K., and W.L. Vaz. 2004. Model systems, lipid rafts, and cell membranes. Annu Rev Biophys Biomol Struct. 33:269-295.
Singer, S.J., and G.L. Nicolson. 1972. The fluid mosaic model of the structure of cell membranes. Science. 175:720-731.
Smart, E.J., Y. Ying, W.C. Donzell, and R.G. Anderson. 1996. A role for caveolin in transport of cholesterol from endoplasmic reticulum to plasma membrane. J Biol Chem. 271:29427-29435.
Soulet, F., D. Yarar, M. Leonard, and S.L. Schmid. 2005. SNX9 regulates dynamin assembly and is required for efficient clathrin-mediated endocytosis. Mol Biol Cell. 16:2058-2067.
Sprong, H., P. van der Sluijs, and G. van Meer. 2001. How proteins move lipids and lipids move proteins. Nat Rev Mol Cell Biol. 2:504-513.
Suetsugu, S., K. Toyooka, and Y. Senju. 2010. Subcellular membrane curvature mediated by the BAR domain superfamily proteins. Semin Cell Dev Biol. 21:340-349.
Suresh, S., and J.M. Edwardson. 2010. The endophilin N-BAR domain perturbs the structure of lipid bilayers. Biochemistry. 49:5766-5771.
Takei, K., V.I. Slepnev, V. Haucke, and P. De Camilli. 1999. Functional partnership between amphiphysin and dynamin in clathrin-mediated endocytosis. Nat Cell Biol. 1:33-39.
Tarricone, C., B. Xiao, N. Justin, P.A. Walker, K. Rittinger, S.J. Gamblin, and S.J. Smerdon. 2001. The structural basis of Arfaptin-mediated cross-talk between Rac and Arf signalling pathways. Nature. 411:215-219.
Toenjes, K.A., M.M. Sawyer, and D.I. Johnson. 1999. The guanine-nucleotide-exchange factor Cdc24p is targeted to the nucleus and polarized growth sites. Curr Biol. 9:1183-1186.
Tsujita, K., S. Suetsugu, N. Sasaki, M. Furutani, T. Oikawa, and T. Takenawa. 2006. Coordination between the actin cytoskeleton and membrane deformation by a novel membrane tubulation domain of PCH proteins is involved in endocytosis. J Cell Biol. 172:269-279.
van der Rest, M.E., A.H. Kamminga, A. Nakano, Y. Anraku, B. Poolman, and W.N. Konings. 1995. The plasma membrane of Saccharomyces cerevisiae: structure, function, and biogenesis. Microbiol Rev. 59:304-322.
van Meer, G. 1989. Lipid traffic in animal cells. Annu Rev Cell Biol. 5:247-275. van Meer, G., E.H. Stelzer, R.W. Wijnaendts-van-Resandt, and K. Simons. 1987.
Sorting of sphingolipids in epithelial (Madin-Darby canine kidney) cells. J Cell Biol. 105:1623-1635.
van Meer, G., D.R. Voelker, and G.W. Feigenson. 2008. Membrane lipids: where they are and how they behave. Nat Rev Mol Cell Biol. 9:112-124.
Veatch, S.L., P. Cicuta, P. Sengupta, A. Honerkamp-Smith, D. Holowka, and B. Baird. 2008. Critical fluctuations in plasma membrane vesicles. ACS Chem Biol. 3:287-293.
8. References Structure and Architecture of Eisosomes
53 | Page
Walther, T.C., J.H. Brickner, P.S. Aguilar, S. Bernales, C. Pantoja, and P. Walter. 2006. Eisosomes mark static sites of endocytosis. Nature. 439:998-1003.
Wang, Q., M.V. Navarro, G. Peng, E. Molinelli, S.L. Goh, B.L. Judson, K.R. Rajashankar, and H. Sondermann. 2009. Molecular mechanism of membrane constriction and tubulation mediated by the F-BAR protein Pacsin/Syndapin. Proc Natl Acad Sci U S A. 106:12700-12705.
Waterman-Storer, C.M., and E.D. Salmon. 1998. Endoplasmic reticulum membrane tubules are distributed by microtubules in living cells using three distinct mechanisms. Curr Biol. 8:798-806.
Weinberg, J., and D.G. Drubin. 2012. Clathrin-mediated endocytosis in budding yeast. Trends Cell Biol. 22:1-13.
Weisz, O.A., and E. Rodriguez-Boulan. 2009. Apical trafficking in epithelial cells: signals, clusters and motors. J Cell Sci. 122:4253-4266.
Wu, M., B. Huang, M. Graham, A. Raimondi, J.E. Heuser, X. Zhuang, and P. De Camilli. 2010. Coupling between clathrin-dependent endocytic budding and F-BAR-dependent tubulation in a cell-free system. Nat Cell Biol. 12:902-908.
Xu, Y., H. Hortsman, L. Seet, S.H. Wong, and W. Hong. 2001. SNX3 regulates endosomal function through its PX-domain-mediated interaction with PtdIns(3)P. Nat Cell Biol. 3:658-666.
Yu, J.W., and M.A. Lemmon. 2001. All phox homology (PX) domains from Saccharomyces cerevisiae specifically recognize phosphatidylinositol 3-phosphate. J Biol Chem. 276:44179-44184.
Zhu, G., J. Chen, J. Liu, J.S. Brunzelle, B. Huang, N. Wakeham, S. Terzyan, X. Li, Z. Rao, G. Li, and X.C. Zhang. 2007. Structure of the APPL1 BAR-PH domain and characterization of its interaction with Rab5. EMBO J. 26:3484-3493.
Zimmerberg, J., and M.M. Kozlov. 2006. How proteins produce cellular membrane curvature. Nat Rev Mol Cell Biol. 7:9-19.

9. Acknowledgments Structure and Architecture of Eisosomes
54 | Page
9 Acknowledgments
I greatly acknowledge Tobias Walther for beeing a great supervisor, for his
contagious enthusiasm and many motivating and inspiring discussions about science
as well as life in general. He inspired me and taught me to always think about the big
picture. Furthermore, I want to thank Kay Grünewald for all the time an effort to teach
me so much about electron microscopy.
I am also very grateful to Prof. Dr. Stefan Jentsch for supervising this thesis. I would
also like to thank the members of my committee Dr. Charles David, Dr. Heinrich Jung
and Dr. Angelika Böttger.
Thanks to the entire Walther lab, Florian Fröhlich, Doris Berchtold, Natalie Krahmer,
Florian Wilfling, Romain Christiano, Natasza Ziolkowska and Michael Rehmann for
creating an atmosphere, which was a pleasure to work in, for many helpful chats
about scientific as well as personal matters and so many great moments we spent
together.
Furthermore, I would like to thank Juha Huiskonen for his unlimited patience in
teaching me electron microscopy, his helpfulness in each phase of this project and
great times in the bunker. Furthermore, I greatly thank Dori, Ira, Janina, Barbara,
Stefan, Christoph, Caro und Milena for being amazing friends and their way of
making me laugh.
Zuletzt und ganz besonders möchte ich meiner Familie, Marita, Volker, Mine und
Julia danken! Für die vielen großen und kleinen Momente der Unterstützung, der
Geduld und Motivation, die mir geholfen haben auch schwierige Situationen zu
meistern. Tommy danke ich für sehr viel, aber vor allem für den Beweis, dass zuletzt
doch alles gut wird. Ganz besonderer Dank gilt auch Elke, ohne sie wäre diese Arbeit
nicht möglich gewesen!
10. Curriculum vitae Structure and Architecture of Eisosomes
55 | Page
10 Curriculum vitae
Lena Karotki Date of birth: 23. May 1982 Nationality: German Home address: Business address: Andechser Strasse 1 Max-Planck-Institute of Biochemistry 81369 München Organelle Dynamics and Architecture cell phone: +49179-1373442 Am Klopferspitz 18 e-mail: [email protected] 82152 Martinsried Phone: +49 (89) 8578-3443 Fax: +49 (89) 8578-2412 PUBLICATIONS
Karotki L, Huiskonen JT, Krogan NJ, Heuser J, Grünewald K, Walther TC. Self-assembly of eisosome core components drives plasma membrane organization; (in preparation; Cell) Ziolkovska N.E, Karotki L, Rehmann M, Walther T.C. Membrane organization by BAR-domain proteins. (in preparation) Wang H, Kakaradov B, Collins SR, Karotki L, Fiedler D, Shales M, Shokat KM, Walther TC, Krogan NJ, Koller D. A Complex-Based Reconstruction of the S. cerevisiae Interactome; Mol Cell Proteomics. 2009 Jan 27 EDUCATION 07/2007 - present Max-Planck-Institute of Biochemistry, Martinsried, Germany PhD thesis 10/2003 - 04/2007 University of Tübingen, Germany Diploma in Biology Major: cell biology / immunology Minors: virology, physiology
10/2001 - 08/2003 University of Hohenheim, Germany Prediploma in Biology RESEARCH EXPERIENCE 07/2007 - present Max-Planck-Institute of Biochemistry, Martinsried, Germany
PhD thesis supervised by Dr. Tobias Walther, Organelle Dynamics and Architecture Title: “Structure and Architecture of Eisosomes”
07/2006 to 03/2007 Massachusetts Institute of Technology, Cambridge, USA
Diploma thesis supervised by Dr. Thomas Schwartz, Department of Biology Title: "Proline isomerization-dependant homodimerization of the ß-subunit of the eukaryotic SRP receptor”
10. Curriculum vitae Structure and Architecture of Eisosomes
56 | Page
07/2004 – 07/2006 Max-Planck-Institute for Developmental Biology, Tübingen, Germany Student assistant in the laboratory of Dr. Robert Geisler 006/2005 – 06/2005 Friedrich-Miescher-Laboratory, Tübingen, Germany Internship in the laboratory of Dr. Anne Spang
05/2005 – 06/20005 Max-Planck-Institute for Developmental Biology, Tübingen, Germany Internship in the laboratory of Dr. Hermann Aberle AWARDS 03/2008 - 06/2010 PhD fellowship Boehringer Ingelheim Fonds (B.I.F.) 08/2006 - 12/2006 Fellowship from the German Academic Exchange Service (DAAD) SKILLS/VOLUNTEER WORK Languages German (native language), English (fluent), Italian (basic), French (basic) 10/2007 – 10/2009 Departmental Spokesperson, Max-Planck-Institute of
Biochemistry
11. Declaration of Individual Contributions Structure and Architecture of Eisosomes
57 | Page
11 Declaration of Individual Contributions
Publication 1: Wang H, Kakaradov B, Collins SR, Karotki L, Fiedler D, Shales M,
Shokat KM, Walther TC, Krogan NJ, and Koller D. (2009). A complex-based
reconstruction of the Saccharomyces cerevisiae interactome. Mol Cell Proteomics 8,
1361-1381
Lena Karotki contributed Figure 4a. She designed and performed the experiment
shown in this Figure.
Publication 2: Ziolkowska NE, Karotki L, Rehman M, Huiskonen JT, and Walther TC
(2011). Eisosome-driven plasma membrane organization is mediated by BAR
domains. Nat Struct Mol Biol 18, 854-856.
Lena Karotki established the protocols for protein expression and purification. She
contributed to the design of the protein construct used for crystallisation. She
contributed to the design and performance corresponding to the membrane binding
characterization. She co-wrote parts of the paper.
Publication 3: Karotki L, Huiskonen JT, Stefan JS, Ziolkowska NE, Roth R, Surma
MA, Krogan NJ, Emr SD, Heuser J, Grünewald K, Walther TC (2011). Eisosome
Proteins Assemble into a Membrane Scaffold. J Cell Biol 195, 889-902.
Lena Karotki designed and performed all experiments except the computational
analysis for the 3D reconstructions and rigid body fitting, the EMAP and the NBD-
fluorescence spectroscopy experiments. She created all figures, except the ones
corresponding to the EMAP and the NBD-fluorescence spectroscopy experiments.
She co-wrote all parts of the paper.
…………………………..
Prof. Dr. Stefan Jentsch

12. Reprints of the Publications Structure and Architecture of Eisosomes
58 | Page
12 Reprints of the Publications
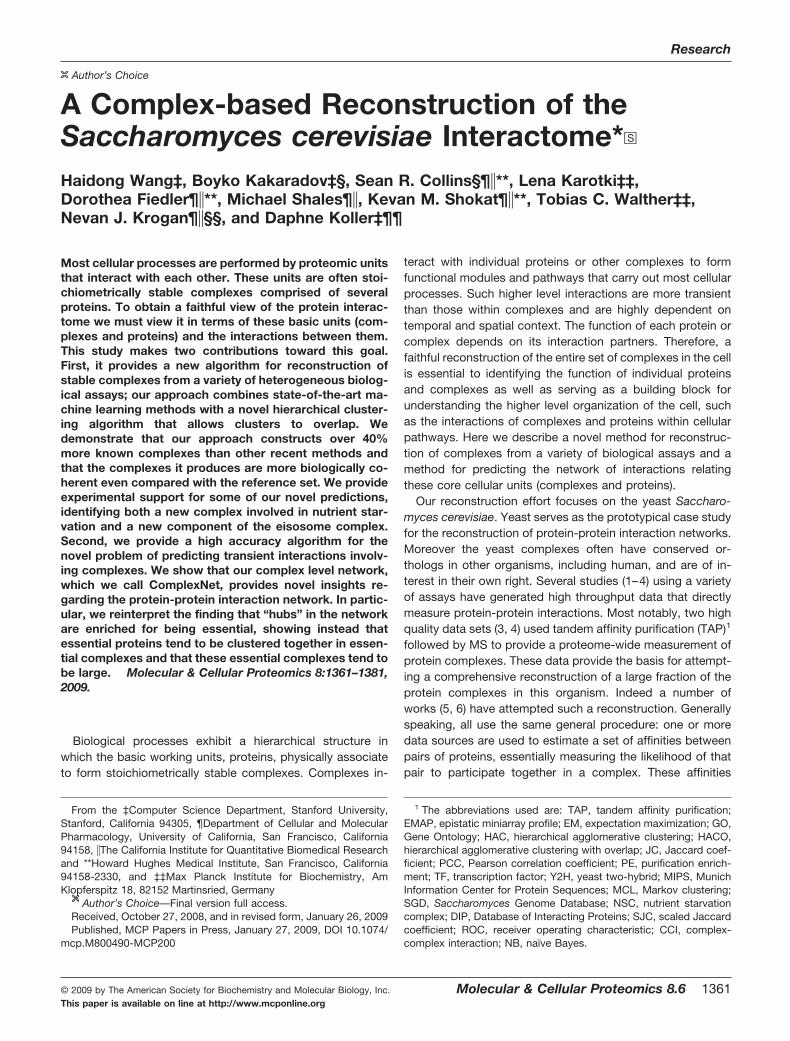
A Complex-based Reconstruction of theSaccharomyces cerevisiae Interactome*□S
Haidong Wang‡, Boyko Kakaradov‡§, Sean R. Collins§¶�**, Lena Karotki‡‡,Dorothea Fiedler¶�**, Michael Shales¶�, Kevan M. Shokat¶�**, Tobias C. Walther‡‡,Nevan J. Krogan¶�§§, and Daphne Koller‡¶¶
Most cellular processes are performed by proteomic unitsthat interact with each other. These units are often stoi-chiometrically stable complexes comprised of severalproteins. To obtain a faithful view of the protein interac-tome we must view it in terms of these basic units (com-plexes and proteins) and the interactions between them.This study makes two contributions toward this goal.First, it provides a new algorithm for reconstruction ofstable complexes from a variety of heterogeneous biolog-ical assays; our approach combines state-of-the-art ma-chine learning methods with a novel hierarchical cluster-ing algorithm that allows clusters to overlap. Wedemonstrate that our approach constructs over 40%more known complexes than other recent methods andthat the complexes it produces are more biologically co-herent even compared with the reference set. We provideexperimental support for some of our novel predictions,identifying both a new complex involved in nutrient star-vation and a new component of the eisosome complex.Second, we provide a high accuracy algorithm for thenovel problem of predicting transient interactions involv-ing complexes. We show that our complex level network,which we call ComplexNet, provides novel insights re-garding the protein-protein interaction network. In partic-ular, we reinterpret the finding that “hubs” in the networkare enriched for being essential, showing instead thatessential proteins tend to be clustered together in essen-tial complexes and that these essential complexes tend tobe large. Molecular & Cellular Proteomics 8:1361–1381,2009.
Biological processes exhibit a hierarchical structure inwhich the basic working units, proteins, physically associateto form stoichiometrically stable complexes. Complexes in-
teract with individual proteins or other complexes to formfunctional modules and pathways that carry out most cellularprocesses. Such higher level interactions are more transientthan those within complexes and are highly dependent ontemporal and spatial context. The function of each protein orcomplex depends on its interaction partners. Therefore, afaithful reconstruction of the entire set of complexes in the cellis essential to identifying the function of individual proteinsand complexes as well as serving as a building block forunderstanding the higher level organization of the cell, suchas the interactions of complexes and proteins within cellularpathways. Here we describe a novel method for reconstruc-tion of complexes from a variety of biological assays and amethod for predicting the network of interactions relatingthese core cellular units (complexes and proteins).
Our reconstruction effort focuses on the yeast Saccharo-myces cerevisiae. Yeast serves as the prototypical case studyfor the reconstruction of protein-protein interaction networks.Moreover the yeast complexes often have conserved or-thologs in other organisms, including human, and are of in-terest in their own right. Several studies (1–4) using a varietyof assays have generated high throughput data that directlymeasure protein-protein interactions. Most notably, two highquality data sets (3, 4) used tandem affinity purification (TAP)1
followed by MS to provide a proteome-wide measurement ofprotein complexes. These data provide the basis for attempt-ing a comprehensive reconstruction of a large fraction of theprotein complexes in this organism. Indeed a number ofworks (5, 6) have attempted such a reconstruction. Generallyspeaking, all use the same general procedure: one or moredata sources are used to estimate a set of affinities betweenpairs of proteins, essentially measuring the likelihood of thatpair to participate together in a complex. These affinities
From the ‡Computer Science Department, Stanford University,Stanford, California 94305, ¶Department of Cellular and MolecularPharmacology, University of California, San Francisco, California94158, �The California Institute for Quantitative Biomedical Researchand **Howard Hughes Medical Institute, San Francisco, California94158-2330, and ‡‡Max Planck Institute for Biochemistry, AmKlopferspitz 18, 82152 Martinsried, Germany
Author’s Choice—Final version full access.Received, October 27, 2008, and in revised form, January 26, 2009Published, MCP Papers in Press, January 27, 2009, DOI 10.1074/
mcp.M800490-MCP200
1 The abbreviations used are: TAP, tandem affinity purification;EMAP, epistatic miniarray profile; EM, expectation maximization; GO,Gene Ontology; HAC, hierarchical agglomerative clustering; HACO,hierarchical agglomerative clustering with overlap; JC, Jaccard coef-ficient; PCC, Pearson correlation coefficient; PE, purification enrich-ment; TF, transcription factor; Y2H, yeast two-hybrid; MIPS, MunichInformation Center for Protein Sequences; MCL, Markov clustering;SGD, Saccharomyces Genome Database; NSC, nutrient starvationcomplex; DIP, Database of Interacting Proteins; SJC, scaled Jaccardcoefficient; ROC, receiver operating characteristic; CCI, complex-complex interaction; NB, naïve Bayes.
Research
Author’s Choice
© 2009 by The American Society for Biochemistry and Molecular Biology, Inc. Molecular & Cellular Proteomics 8.6 1361This paper is available on line at http://www.mcponline.org
induce a weighted graph whose nodes are proteins andwhose edges encode the affinities. A clustering algorithm isthen used to construct complexes, sets of proteins that havehigh affinity in the graph. Although similar at a high level, thedifferent methods differ significantly on the design choicesmade for the key steps in the process.
Recent works (since 2006) all focus on processing theproteome-wide TAP-MS data and using the results to definecomplexes. Gavin et al. (3), Collins et al. (7), and Hart et al. (5)all use probabilistic models that compare the number of in-teractions observed between proteins in the data versus thenumber expected in some null model. Collins et al. (7) andHart et al. (5) both used all three of the available high through-put data sets (2–4) in an attempt to provide a unified interac-tion network. The two unified networks resulting from thesestudies were shown to have large overlap and to achievecomparable agreement with the set of co-complex interac-tions in the MIPS data set (8) that are collated from previoussmall scale studies. The interaction graphs resulting from thecomputed affinity scores are then clustered to produce a setof identified complexes. Gavin et al. (3), Hart et al. (5), and Puet al. (6) all use a Markov clustering (MCL) (9) procedure;Collins et al. (7) use a hierarchical agglomerative clustering(HAC) procedure but do not suggest a computational proce-dure for using the resulting dendrogram to produce specificcomplex predictions.
Despite the fairly high quality of these networks and theagreement between them, they still contain many false posi-tives and negatives. False negatives can arise, for example,from the difficulty in detecting interactions involving low abun-dance proteins or membrane proteins or from cases wherethe tag added to the bait protein during TAP-MS preventsbinding of the bait to its interacting partners. False positivescan arise, for example, from complexes that share compo-nents or from the contaminants that bind to the bait nonspe-cifically after cell lysis. Therefore, the set of complexes de-rived from the protein-protein interaction network alone haslimited accuracy. Less than 20% of the MIPS complexes (8),which are derived from reliable small scale experiments, areexactly captured by the predictions of Pu et al. (6) or by thoseof Hart et al. (5).
In this study, we constructed a method that generates a setof complexes with higher sensitivity and coverage by integrat-ing multiple sources of data, including mRNA gene expressiondata, cellular localization, and yeast two-hybrid data. The dataintegration approach was used in some early works on pre-dicting protein-protein interactions (10, 11) and more recentlyby Qiu and Noble (12), but these studies focus only on pre-dicting pairs of proteins in the same complex and not onreconstructing entire complexes. Many recent studies (13–21)have successfully integrated multiple types of data to predictfunctional linkage between proteins, constructing a graphwhose pairwise affinity score summarizes the informationfrom different sources of data. However, because the data
integration is not trained toward predicting complexes, thehigh affinity pairs contain transient binding partners and evenprotein pairs that never interact directly but merely function inthe same pathways. When these graphs are clustered, theclusters correspond to a variety of cellular entities, includingpathways, functional modules, or co-expression clusters.We developed a data integration approach that is aimeddirectly at the problem of predicting stoichiometrically sta-ble complexes.
We used a two-phase automated procedure that we trainedon a new high quality reference set that we generated fromannotations in MIPS and SGD and from manual curation ofthe literature. In the first phase, we used boosting (22), astate-of-the-art machine learning method, to train an affinityfunction that is specifically aimed at predicting whether twoproteins are co-complexed. Unlike most other learning meth-ods, boosting is capable of inducing useful features by com-bining different aspects of the raw data, making it particularlywell suited to a data integration setting. Once we generatedthe learned affinity graph over pairs of proteins, we predictedcomplexes by using a novel clustering algorithm called hier-archical agglomerative clustering with overlap (HACO). TheHACO algorithm is a simple and elegant extension of HACthat addresses many of its limitations, such as the irreversiblecommitment to a possibly incorrect clustering decision.HACO can be applied to any setting where HAC is applied;given the enormous usefulness of HAC for the analysis ofbiological data sets of many different types (e.g. Refs. 7, 23,and 24), we believe that HACO may be applicable in a broadrange of other tasks.
To validate our approach, we tested the ability of our meth-ods and other methods to predict reference complexes thatwere not used in training. By integrating multiple sources ofdata, we recovered more reference complexes than otherstate-of-the-art methods (5, 6) when applied to the same setof yeast proteins. We also validated our predicted set ofcomplexes against external data sources that are not used inthe training. In all cases, our predictions were shown to bemore coherent than other methods and, in many cases, morecoherent even than the set of reference complexes.
A detailed examination of our predicted complexes sug-gests that many of them were previously known but notincluded in our (comprehensive) reference set, suggestingthat our complexes form a valuable new set of referencecomplexes. In several cases, our predicted complexes werenot previously characterized. We experimentally validated twoof these predictions: a new component in the recently char-acterized eisosome complex (25), which marks the site ofendocytosis in eukaryotes, and a newly characterized six-protein complex, including four phosphatases, that appearsto be involved in the response to nutrient starvation and thatwe named the nutrient starvation complex (NSC).
The complex-based view provides a new perspective onthe analysis and reconstruction of the protein interaction net-
A Complex-based Reconstruction of S. cerevisiae Interactome
1362 Molecular & Cellular Proteomics 8.6
work. In the past, Jeong et al. (26) have suggested that thedegree of a protein in an interaction network is positivelycorrelated with its essentiality and have argued that “hubs” inthe network are more likely to be essential because they areinvolved in more interactions. Our analysis presents a com-plex-based alternative view: essential proteins tend to clustertogether in essential complexes (5), and essential complexestend to be large; thus, the essential hubs in the network areoften members in large complexes comprised mostly of es-sential proteins. We also reformulate the task of reconstruct-ing the protein interaction network. Rather than consideringinteractions between individual proteins (27–29), a somewhatconfusing network that confounds interactions within com-plexes and interactions between complexes, we tackle thenovel task of predicting a comprehensive protein interactionnetwork that involves both individual proteins and larger com-plexes. We argue that these entities are the right buildingblocks in reconstructing cellular processes, providing a viewof cellular interaction networks that is both easier to interpretthan the complex network of interactions between individualproteins and more faithful to biological reality. Moreover acomplex, which is a stable collection of many proteins that acttogether, provides a more robust basis for predicting interac-tions as we can combine signals for all its constituent pro-teins, reducing sensitivity to noise.
To accomplish this goal, we constructed a reference set ofcomplex-complex interactions, considering two complexes tointeract if they are significantly enriched for reliable interac-tions between their components. We further augmented thisset with a hand-curated list of established complex-complexinteractions. We then used a machine learning approach todetect the “signature” of such interactions from a large set ofassays that are likely to be indicative. We explored differentmachine learning methods and showed that a partially super-vised naïve Bayes model, where we learned the model fromboth labeled and unlabeled interactions, provides the bestperformance. This model was applied both to our predictedcomplexes and to individual proteins, providing a new, com-prehensive reconstruction of the S. cerevisiae interaction net-work, which can be downloaded from our project Web page.2
We showed that entities that are predicted to interact aremore likely to share the same functional categories. A detailedinvestigation of our new predicted interactions presents manythat are established in the literature as well as some that arenovel but consistent, presenting plausible hypotheses for fur-ther investigation.
EXPERIMENTAL PROCEDURES
Complex Prediction
Constructing a Set of Reference Complexes—We compiled a ref-erence set of complexes by combining literature-derived results fromsmall scale experiments in MIPS (8) and SGD (31) with a hand-curated
list (see our supporting Web site3) that we generated. The MIPS, SGD,and hand-curated sets contain 225, 195, and 164 complexes, respec-tively (supplemental Fig. S1a). Below we describe our method forestablishing correspondence between the three lists and combiningthem into a high confidence reference set suitable for training ourmethod and for evaluating the accuracy of its predictions.
Our approach consisted of five processing steps. First, we mergedsimilar complexes from the original lists (see below), resulting in a listof 543 complexes. Second, we removed 112 redundant complexesthat were proper subsets of other complexes. Third, we removed thefive largest complexes: the four ribosomal subunits and the smallnucleolar ribonucleoprotein complex; these complexes are so largethat they greatly overwhelm the signal both in training the method andin evaluating the results. Fourth, we restricted the complexes to theset of 2195 proteins that have adequate amount of experimentalevidence (see below). Finally we removed single protein complexes,arriving at the final list of 340 complexes. With at least two and onaverage 4.9 proteins per complex, this set of complexes contained1100 unique proteins and a total of 1661 protein members, showingthat the reference complexes contain notable overlap (proteins thatare shared by multiple complexes).
In the first step of this merging process, we define each candidatecomplex from the three curated lists as a node in an undirected graph(or network). Two complexes are connected by an edge if they over-lap significantly, i.e. their Jaccard similarity coefficient is greater than0.7 (see Jaccard coefficient (JC) metric below) with an edge weightequal to the JC value. We found 422 isolated nodes in the graph,corresponding to unique complexes that do not overlap significantlywith any other complexes in the list. The task of merging similarcomplexes is equivalent to that of finding several types of connectedcomponents in this graph. A complete subgraph with average edgeweight of 1 is equivalent to a group of complexes with identicalprotein content that appear under multiple names in at least two of thecurated lists. We found 66 such groups, which correspond to com-plexes that we regard as very high confidence because of multiplecorroborating evidence. A complete subgraph in the rest of the net-work with average edge weight less than 1 (but greater than 0.7) isequivalent to a group of complexes whose protein contents arereported differently by the different curated lists. We found 45 suchgroups and produced a consensus complex for each, resolving con-flicts by a majority vote: a protein was included in the resultingcomplex only if it was found in more than half of the candidatecomplexes from the conflicted group. The remaining 18 nodes formedfour connected components but no complete subgraphs, each com-ponent indicating non-transitive overlaps between three or more can-didate complexes (e.g. A overlaps with B, and B overlaps with C, butA does not overlap significantly with C). Manual inspection and con-sultation with experts resulted in 10 unique complexes being addedto the reference list. The distribution of complex sizes in our referenceset is shown in supplemental Fig. S2.
Constructing Positive and Negative Co-complex Protein Pairs—The set of positive co-complexed protein pairs consists of all proteinpairs that appear in the same complex in the reference set. For thenegative set, we first consider all protein pairs (P1, P2) such that P1 isin a reference complex and P2 is outside any version of that complexin any of the three hand-curated sets; we then exclude any pair thatis within some other reference complex. The result of this processwas 5065 positive pairs and about one million negative pairs.
Features for Predicting Co-complexed Relations—We constructedfeatures for our protein-protein interaction network using five differentdata sources: the purification enrichment (PE) score from the consol-idated network of Collins et al. (7), a cellular component from a
2 Complex-complex interactions (CCI) (dags.stanford.edu/CCI/). 3 Complex (dags.stanford.edu/Complex/).
A Complex-based Reconstruction of S. cerevisiae Interactome
Molecular & Cellular Proteomics 8.6 1363
truncated version of the Gene Ontology (GO) (33), transmembraneproteins (31), co-expression (34), and yeast two-hybrid (Y2H) interac-tions (35, 36).
Our highest coverage source regarding protein-protein interactioncomes from high throughput TAP-MS data of the Gavin et al. (3) andKrogan et al. (4) data sets. The recent work of Collins et al. (7) providesa coherent and systematic way of integrating the data from theseseparate assays into a high quality score that measures the proba-bility of a protein pair to be co-complexed. The recent work of Hart etal. (5) provides a different integration method, but the results are quitesimilar, providing support for both of these procedures. We derivedfive features from the PE analysis: the direct score is computed basedonly on bait-prey information in the purifications; the indirect score iscomputed based on prey-prey information; the actual PE score is thesum of direct and indirect scores; the scaled score maps the PE scoreto a value between 0 and 1 to approximate the confidence value thatthe pair represents a true interaction; finally each protein is repre-sented by a vector of its scaled PE scores with all the other proteins(where we assign its interaction with itself a score of 1), and we defineour PE-distance feature as the cosine distance between the vectorsof two proteins.
As the PE score provides most of the signals in predicting com-plexes (see “Results”), we only kept the 2390 proteins that have atleast one scaled PE score above 0.2 with some other protein. Al-though this set only covers about 40% of the �6000 yeast genes, itcovers 81% of all protein members in the lists of high quality com-plexes that comprised our reference set. As noted earlier, we ex-cluded proteins that appear exclusively in the four ribosomal subunitsand the small nucleolar ribonucleoprotein complex. This resulted inthe final list of 2195 proteins on which we performed our complexprediction.
Yeast two-hybrid assays also provide a direct measurement ofprotein-protein interactions. We derived these data from the assays ofIto et al. (35) and Uetz et al. (36). Interacting pairs are assigned afeature value of 1. Pairs of proteins that appeared in the assay butwere not observed to interact are assigned a feature value of �1. Allother pairs have 0 as their feature values.
The GO cellular component hierarchy (33) was downloaded onJune 25, 2007. An examination of the hierarchy showed that many ofthe smaller categories (lower in the hierarchy) refer to particular com-plexes whose information is derived from the same small scale ex-periment that informs our reference set. Thus, to achieve a fair eval-uation using the reference set, we removed categories of size lessthan 120 that can potentially contain the answer. The remaining 44 of564 categories represent high level cellular localization information,much of which is obtained through high throughput experiments (37).Some sample categories include “endoplasmic reticulum part,”“nuclear chromosome part,” “mitochondrial membrane,” and“cytoplasm.”
We derived two pairwise localization features from the GO cellularcomponent. One is the semantic distance measure (38), which is thelog size of the smallest category that contains both proteins. How-ever, this feature is a pessimistic assessment regarding the co-local-ization of the two proteins as lack of annotation of a protein in somecategory, particularly one that is a subset of its most specific cate-gory, does not necessarily mean that it cannot belong to this cate-gory. Therefore, we constructed a second feature, which is the logsize of the smallest possible group that could contain both proteins(given the current evidence). It is computed in the following waybetween protein A and protein B whose most specific categories areX and Y, respectively. If X is a subcategory of Y, then the two proteinsmight belong together to any group if they were to be annotated withenough detail. Therefore, we use log of 120, the size of the smallestcategory, as our second feature. On the other hand, if X and Y are not
subcategories of each other, we denote Z to be the smallest commonsupercategory of X and Y. We then denote X� (respectively Y�) to bethe category one level down the path from Z to X (respectively Y).Thus, assuming that A and B belong to the two different categories atX� and Y�, the smallest semantic category that we can form that maycontain them both is X� � Y�. Thus, our second feature is log(�X� �Y��).
A list of membrane proteins is obtained by parsing the transmem-brane annotations in SGD (31). A pair of proteins is considered to bemembrane if at least one of the proteins is found in the membrane.The first membrane feature is 1 if the pair is membrane and 0 other-wise. The second and third features are the product of the first featurewith the direct and indirect PE score of the two proteins, respectively.This allows our boosting model to take into account the known factthat TAP-MS purifications work differently on membrane proteinsfrom non-membrane proteins.
Microarray data were downloaded from the Stanford MicroarrayDatabase (34) on December 5, 2006; it contains a total of 902 exper-iments for yeast divided into 19 categories. The data were normalizedto mean 0 and standard deviation 1. We constructed a feature bycomputing the mean-centered Pearson correlation coefficient be-tween the expression profiles of two proteins.
A final feature is obtained from small scale physical interactions.We downloaded protein-protein interactions from MIPS (8) and DIP(39) on March 21, 2006. We extracted from MIPS those physicalinteractions that are non-high throughput yeast two hybrid or affinitychromatography. For DIP, we picked non-genetic interactions that arederived from small scale experiments or verified by multiple experi-ments. This feature has a value of 1 for observed interactions andfeature value 0 for all other pairs. Importantly there is a risk of cyclicitybetween these small scale interactions and the reference complexes.Therefore, to avoid a positive bias in our results, we omitted thisfeature in the cross-validation runs, which are evaluated against thereference complexes. For those runs that are trained on the entire setof reference complexes, this cyclicity is not a concern, so this featurewas included. There are a total of 12 features for cross-validation runsand 13 features for runs that are trained on the entire reference set.
Integrating Multiple Features Using the LogitBoost—Boosting (22)is a class of algorithms that iteratively combines weak learners to givea representative ensemble. Each weak learner is a simple classifier,such as a decision stump, that may only weakly correlate with thelabels. After a weak learner is trained, we add it to the ensemble withappropriate weight. In the next iteration, the algorithm puts moreweights on the data points that are classified incorrectly by thecurrent ensemble, which the next weak learner will focus on. Boostingis able to perform automatic feature selection and has accuracy thatis better or comparable with other state-of-the-art classifiers such assupport vector machines (40) in many domains. We implemented aversion of boosting algorithms called LogitBoost (22) that uses deci-sion stumps as weak learners and the logit function as the lossfunction. This variant is shown to be more robust to outliers andoverfitting than the standard AdaBoost variant (41). Our experiments(data not shown) showed that this method performs well on our datacompared with other versions of boosting and other classificationalgorithms such as logistic regression and support vector machines.The prediction of the learned ensemble classifier on a given proteinpair is taken to be the affinity of the pair in the clustering algorithmbelow.
The HACO Algorithm—The standard HAC algorithm with averagelinkage (42) maintains a pool of merging candidate sets where thedistance between two non-overlapping sets is as follows.
d�A, B� �1
�A�B� �P�A, Q�B
d�P, Q� (Eq. 1)
A Complex-based Reconstruction of S. cerevisiae Interactome
1364 Molecular & Cellular Proteomics 8.6
In our setting, we take d(P, Q) as the negative of the affinity betweenprotein P and protein Q. Note that d(A, B) is the average of the edgedistance between proteins in A and proteins in B.
In HAC, at each step, we pick the two non-overlapping sets withthe closest distance, A and B, and merge them to create a new set,M. M is added to the pool, while the sets A and B are removed.Therefore in later steps, we could only consider the superset M andwould never be able to use A or B again to merge with some other set.Assume that there is another set C whose distance to A is only slightlylarger than d(A, B). In this case, the decision to merge A with B ratherthan with C is arbitrary and unstable. When the actual clusters over-lap, a more appropriate solution would be to have two overlappingmerged candidates: M � A � B and N � A � C. We adapt HAC toaccommodate this intuition. We define the divergence between A andM as a measure of the cohesiveness of the set M that is outside of A(supplemental Fig. S3),
divergence�A, M� �1�E� �
�P, Q��E
d�P, Q� (Eq. 2)
where E is the set of pairs in M but not in A: E � {(P, Q) � (P, Q) � M �M � A � A, P � Q}. (Here “�” can be any ordering among theproteins, such as alphabetical, to avoid a pair appearing twice in theset E).
If M is not overlapping with C, we have the choice of whether to useA or M to merge with C. If divergence(A, N) � divergence(A, M) issmall, it makes sense to merge A and C to create a new set N that isalmost as coherent as M. On the other hand, if the difference is large,we would prefer to replace A with its superset M as the mergingcandidate to C.
In practice, we use d(A, C) to approximate divergence(A, N): wecheck whether � d(A, C) � divergence(A, M) is small. Divergence(A,N) is the weighted average of d(A, C) and d(C), the distance within C.d(C) tends to be smaller than d(A, C) because pairs within C, which isformed earlier by some merging, are more coherent than pairs be-tween A and C. Therefore, d(A, C) tends to be smaller than divergen-ce(A, N), so keeping small is generally a more stringent requirementfor ensuring that N is almost as coherent as M. Moreover by forcingd(A, C) to be small, we make sure the set N is coherent not justbecause the distance within C is small. With this consideration, wedefined the modified distance between A and C (supplemental Fig.S3) as follows.
d��A, C� � � d�A, C� if � � if � � (Eq. 3)
The modified distance d� is used to pick the two closest sets to mergein the next iteration. If is smaller than a margin, we make d� equalto d and thus allow A and C to merge. On the other hand, if is large,we make d� infinity and thus prohibit A and C from merging in favor ofmerging their supersets. � is the margin parameter: the larger themargin �, the more likely a set A is to be reused, resulting in moreoverlapping subsets constructed by the algorithm. If the margin is 0,it reduces to the standard HAC. Therefore, our HACO algorithm is ageneralization of the HAC. Note that we can eliminate a set from themerging candidate pool when its modified distances to all other setsare . Of course we can define another modified distance as long asit is larger when is large and close to d(A, C) when is small.
In practice, A might have multiple supersets in the pool. Therefore,we look at all of the supersets of A in the pool that are not overlappingwith C and use the set MA, C with smallest divergence from A, i.e. theone that provides the best replacement for A in terms of the proposedmerger with C.
MA, C � arg minMs.t. A�M, C�M � �
divergence�A, M� (Eq. 4)
We do the same thing with C for its proposed merger with A.
MC, A � arg minMs.t. C�M, A�M � �
divergence�C, M� (Eq. 5)
The smaller of divergence(A, MA, C) and divergence(C, MC, A) is usedto compute the modified distance.
The algorithm terminates when there are no more non-overlappingsets to merge. The output is a cluster-lattice where the same clustercan be a child of multiple parents in the lattice. The lattice is cut at acertain threshold to generate a set of overlapping clusters. Thesepredicted clusters are the sets that are still in the candidate pool whenthe distance in the merging process reaches the threshold.
Training and Test Regime—To evaluate our prediction accuracyagainst the reference set, we divided the 340 reference complexesinto five disjoint subsets, or folds. As there are about a million nega-tive pairs, for computational expediency, we randomly sampled one-tenth of the negative pairs to be used in training while setting eachnegative pair to have 10 times the weight of the positive pairs.
For each fold in the 5-fold cross-validation, we hide one set anduse the remaining four sets to train the affinity function for the proteinpairs, the margin � for the HACO, and the cutoff threshold for theresulting cluster-lattice. We use the same training set in all steps ofour pipeline and evaluate the final predictions on complexes in aseparate test set that is hidden during all steps of the training process.We select the cutoff threshold by maximizing the coverage (see belowfor the definition) on the training set. To pick the margin �, we cannotuse coverage alone because our model would always prefer a biggermargin that keeps more sets in the pool. Therefore, we choose � bymaximizing the product of coverage and sensitivity (see below for thedefinition) on the training set. This approach trades off between thematch with the reference set and the number of predicted complexes.
To evaluate our predictions against external data sources, such asbiological coherence and essentiality, we augmented our model witha feature constructed from small scale physical interactions andtrained it on the entire set of 340 reference complexes. To avoidcircularity between features and evaluation, we did not evaluate thepredictions from such runs against the reference complexes.
Evaluation Metrics for Matching between Predictions and Refer-ence Complexes—The overlap between a reference complex R and apredicted complex C can be quantified in several ways (43) (supple-mental Fig. S4).
Jaccard coefficient � �R � C�/�R � C� (Eq. 6)
Hamming distance � �R � C� � �R � C� (Eq. 7)
We use both measures because of the size effect. For example, aHamming distance of 2 between two large complexes, say both ofsize 5, is a good match. In this case JC � 4/6 � 0.67. On the otherhand, a Hamming distance of 2 between two small complexes of size2 implies an overlap of only one protein, which could arise simply bychance. In this case JC � 1/3 � 0.33.
We define the coverage and sensitivity of a set of predictions so wecan systematically evaluate genome-wide predictions. For each ref-erence complex, we find the prediction that has the highest Jaccardcoefficient. We define the scaled Jaccard coefficient (SJC) as follows:SJC(R, C) � max{0, 2JC(R, C) � 1}. We truncate the value at 0because it may represent random overlap. In the above examples, thematching of the two large complexes of size 5 and Hamming distance2 would have SJC � 0.33, whereas the small ones of size 2 andHamming distance 2 would have SJC � 0. We define the coverage asthe average Jaccard coefficient per reference complex,
A Complex-based Reconstruction of S. cerevisiae Interactome
Molecular & Cellular Proteomics 8.6 1365
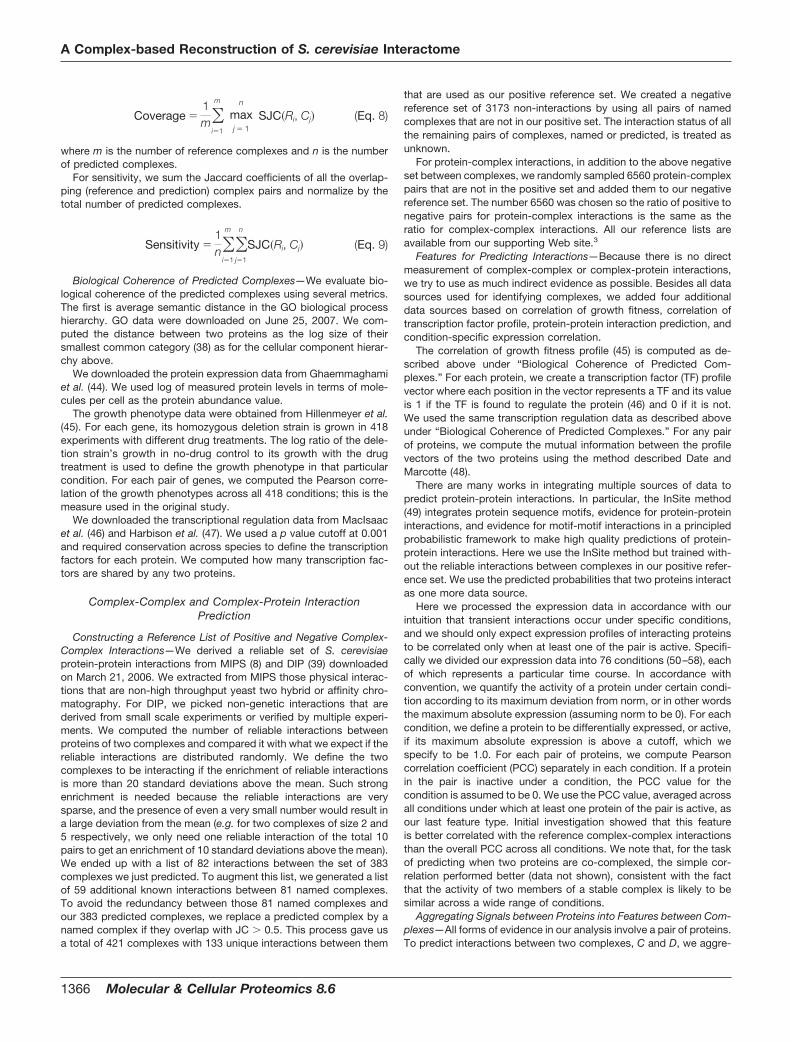
Coverage �1m�
i�1
m n
maxj � 1
SJC�Ri, Cj� (Eq. 8)
where m is the number of reference complexes and n is the numberof predicted complexes.
For sensitivity, we sum the Jaccard coefficients of all the overlap-ping (reference and prediction) complex pairs and normalize by thetotal number of predicted complexes.
Sensitivity �1n�
i�1
m �j�1
n
SJC�Ri, Cj� (Eq. 9)
Biological Coherence of Predicted Complexes—We evaluate bio-logical coherence of the predicted complexes using several metrics.The first is average semantic distance in the GO biological processhierarchy. GO data were downloaded on June 25, 2007. We com-puted the distance between two proteins as the log size of theirsmallest common category (38) as for the cellular component hierar-chy above.
We downloaded the protein expression data from Ghaemmaghamiet al. (44). We used log of measured protein levels in terms of mole-cules per cell as the protein abundance value.
The growth phenotype data were obtained from Hillenmeyer et al.(45). For each gene, its homozygous deletion strain is grown in 418experiments with different drug treatments. The log ratio of the dele-tion strain’s growth in no-drug control to its growth with the drugtreatment is used to define the growth phenotype in that particularcondition. For each pair of genes, we computed the Pearson corre-lation of the growth phenotypes across all 418 conditions; this is themeasure used in the original study.
We downloaded the transcriptional regulation data from MacIsaacet al. (46) and Harbison et al. (47). We used a p value cutoff at 0.001and required conservation across species to define the transcriptionfactors for each protein. We computed how many transcription fac-tors are shared by any two proteins.
Complex-Complex and Complex-Protein InteractionPrediction
Constructing a Reference List of Positive and Negative Complex-Complex Interactions—We derived a reliable set of S. cerevisiaeprotein-protein interactions from MIPS (8) and DIP (39) downloadedon March 21, 2006. We extracted from MIPS those physical interac-tions that are non-high throughput yeast two hybrid or affinity chro-matography. For DIP, we picked non-genetic interactions that arederived from small scale experiments or verified by multiple experi-ments. We computed the number of reliable interactions betweenproteins of two complexes and compared it with what we expect if thereliable interactions are distributed randomly. We define the twocomplexes to be interacting if the enrichment of reliable interactionsis more than 20 standard deviations above the mean. Such strongenrichment is needed because the reliable interactions are verysparse, and the presence of even a very small number would result ina large deviation from the mean (e.g. for two complexes of size 2 and5 respectively, we only need one reliable interaction of the total 10pairs to get an enrichment of 10 standard deviations above the mean).We ended up with a list of 82 interactions between the set of 383complexes we just predicted. To augment this list, we generated a listof 59 additional known interactions between 81 named complexes.To avoid the redundancy between those 81 named complexes andour 383 predicted complexes, we replace a predicted complex by anamed complex if they overlap with JC � 0.5. This process gave usa total of 421 complexes with 133 unique interactions between them
that are used as our positive reference set. We created a negativereference set of 3173 non-interactions by using all pairs of namedcomplexes that are not in our positive set. The interaction status of allthe remaining pairs of complexes, named or predicted, is treated asunknown.
For protein-complex interactions, in addition to the above negativeset between complexes, we randomly sampled 6560 protein-complexpairs that are not in the positive set and added them to our negativereference set. The number 6560 was chosen so the ratio of positive tonegative pairs for protein-complex interactions is the same as theratio for complex-complex interactions. All our reference lists areavailable from our supporting Web site.3
Features for Predicting Interactions—Because there is no directmeasurement of complex-complex or complex-protein interactions,we try to use as much indirect evidence as possible. Besides all datasources used for identifying complexes, we added four additionaldata sources based on correlation of growth fitness, correlation oftranscription factor profile, protein-protein interaction prediction, andcondition-specific expression correlation.
The correlation of growth fitness profile (45) is computed as de-scribed above under “Biological Coherence of Predicted Com-plexes.” For each protein, we create a transcription factor (TF) profilevector where each position in the vector represents a TF and its valueis 1 if the TF is found to regulate the protein (46) and 0 if it is not.We used the same transcription regulation data as described aboveunder “Biological Coherence of Predicted Complexes.” For any pairof proteins, we compute the mutual information between the profilevectors of the two proteins using the method described Date andMarcotte (48).
There are many works in integrating multiple sources of data topredict protein-protein interactions. In particular, the InSite method(49) integrates protein sequence motifs, evidence for protein-proteininteractions, and evidence for motif-motif interactions in a principledprobabilistic framework to make high quality predictions of protein-protein interactions. Here we use the InSite method but trained with-out the reliable interactions between complexes in our positive refer-ence set. We use the predicted probabilities that two proteins interactas one more data source.
Here we processed the expression data in accordance with ourintuition that transient interactions occur under specific conditions,and we should only expect expression profiles of interacting proteinsto be correlated only when at least one of the pair is active. Specifi-cally we divided our expression data into 76 conditions (50–58), eachof which represents a particular time course. In accordance withconvention, we quantify the activity of a protein under certain condi-tion according to its maximum deviation from norm, or in other wordsthe maximum absolute expression (assuming norm to be 0). For eachcondition, we define a protein to be differentially expressed, or active,if its maximum absolute expression is above a cutoff, which wespecify to be 1.0. For each pair of proteins, we compute Pearsoncorrelation coefficient (PCC) separately in each condition. If a proteinin the pair is inactive under a condition, the PCC value for thecondition is assumed to be 0. We use the PCC value, averaged acrossall conditions under which at least one protein of the pair is active, asour last feature type. Initial investigation showed that this featureis better correlated with the reference complex-complex interactionsthan the overall PCC across all conditions. We note that, for the taskof predicting when two proteins are co-complexed, the simple cor-relation performed better (data not shown), consistent with the factthat the activity of two members of a stable complex is likely to besimilar across a wide range of conditions.
Aggregating Signals between Proteins into Features between Com-plexes—All forms of evidence in our analysis involve a pair of proteins.To predict interactions between two complexes, C and D, we aggre-
A Complex-based Reconstruction of S. cerevisiae Interactome
1366 Molecular & Cellular Proteomics 8.6
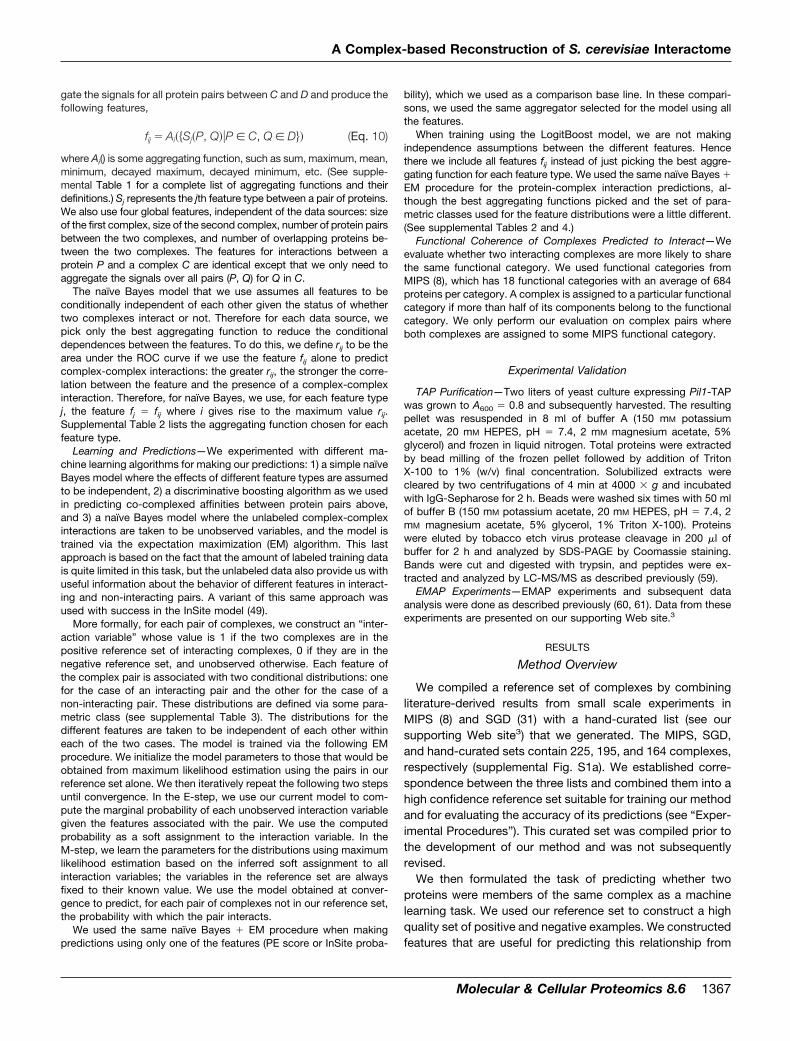
gate the signals for all protein pairs between C and D and produce thefollowing features,
fij � Ai��Sj�P, Q��P � C, Q � D � (Eq. 10)
where Ai() is some aggregating function, such as sum, maximum, mean,minimum, decayed maximum, decayed minimum, etc. (See supple-mental Table 1 for a complete list of aggregating functions and theirdefinitions.) Sj represents the jth feature type between a pair of proteins.We also use four global features, independent of the data sources: sizeof the first complex, size of the second complex, number of protein pairsbetween the two complexes, and number of overlapping proteins be-tween the two complexes. The features for interactions between aprotein P and a complex C are identical except that we only need toaggregate the signals over all pairs (P, Q) for Q in C.
The naïve Bayes model that we use assumes all features to beconditionally independent of each other given the status of whethertwo complexes interact or not. Therefore for each data source, wepick only the best aggregating function to reduce the conditionaldependences between the features. To do this, we define rij to be thearea under the ROC curve if we use the feature fij alone to predictcomplex-complex interactions: the greater rij, the stronger the corre-lation between the feature and the presence of a complex-complexinteraction. Therefore, for naïve Bayes, we use, for each feature typej, the feature fj � fij where i gives rise to the maximum value rij.Supplemental Table 2 lists the aggregating function chosen for eachfeature type.
Learning and Predictions—We experimented with different ma-chine learning algorithms for making our predictions: 1) a simple naïveBayes model where the effects of different feature types are assumedto be independent, 2) a discriminative boosting algorithm as we usedin predicting co-complexed affinities between protein pairs above,and 3) a naïve Bayes model where the unlabeled complex-complexinteractions are taken to be unobserved variables, and the model istrained via the expectation maximization (EM) algorithm. This lastapproach is based on the fact that the amount of labeled training datais quite limited in this task, but the unlabeled data also provide us withuseful information about the behavior of different features in interact-ing and non-interacting pairs. A variant of this same approach wasused with success in the InSite model (49).
More formally, for each pair of complexes, we construct an “inter-action variable” whose value is 1 if the two complexes are in thepositive reference set of interacting complexes, 0 if they are in thenegative reference set, and unobserved otherwise. Each feature ofthe complex pair is associated with two conditional distributions: onefor the case of an interacting pair and the other for the case of anon-interacting pair. These distributions are defined via some para-metric class (see supplemental Table 3). The distributions for thedifferent features are taken to be independent of each other withineach of the two cases. The model is trained via the following EMprocedure. We initialize the model parameters to those that would beobtained from maximum likelihood estimation using the pairs in ourreference set alone. We then iteratively repeat the following two stepsuntil convergence. In the E-step, we use our current model to com-pute the marginal probability of each unobserved interaction variablegiven the features associated with the pair. We use the computedprobability as a soft assignment to the interaction variable. In theM-step, we learn the parameters for the distributions using maximumlikelihood estimation based on the inferred soft assignment to allinteraction variables; the variables in the reference set are alwaysfixed to their known value. We use the model obtained at conver-gence to predict, for each pair of complexes not in our reference set,the probability with which the pair interacts.
We used the same naïve Bayes � EM procedure when makingpredictions using only one of the features (PE score or InSite proba-
bility), which we used as a comparison base line. In these compari-sons, we used the same aggregator selected for the model using allthe features.
When training using the LogitBoost model, we are not makingindependence assumptions between the different features. Hencethere we include all features fij instead of just picking the best aggre-gating function for each feature type. We used the same naïve Bayes �EM procedure for the protein-complex interaction predictions, al-though the best aggregating functions picked and the set of para-metric classes used for the feature distributions were a little different.(See supplemental Tables 2 and 4.)
Functional Coherence of Complexes Predicted to Interact—Weevaluate whether two interacting complexes are more likely to sharethe same functional category. We used functional categories fromMIPS (8), which has 18 functional categories with an average of 684proteins per category. A complex is assigned to a particular functionalcategory if more than half of its components belong to the functionalcategory. We only perform our evaluation on complex pairs whereboth complexes are assigned to some MIPS functional category.
Experimental Validation
TAP Purification—Two liters of yeast culture expressing Pil1-TAPwas grown to A600 � 0.8 and subsequently harvested. The resultingpellet was resuspended in 8 ml of buffer A (150 mM potassiumacetate, 20 mM HEPES, pH � 7.4, 2 mM magnesium acetate, 5%glycerol) and frozen in liquid nitrogen. Total proteins were extractedby bead milling of the frozen pellet followed by addition of TritonX-100 to 1% (w/v) final concentration. Solubilized extracts werecleared by two centrifugations of 4 min at 4000 � g and incubatedwith IgG-Sepharose for 2 h. Beads were washed six times with 50 mlof buffer B (150 mM potassium acetate, 20 mM HEPES, pH � 7.4, 2mM magnesium acetate, 5% glycerol, 1% Triton X-100). Proteinswere eluted by tobacco etch virus protease cleavage in 200 �l ofbuffer for 2 h and analyzed by SDS-PAGE by Coomassie staining.Bands were cut and digested with trypsin, and peptides were ex-tracted and analyzed by LC-MS/MS as described previously (59).
EMAP Experiments—EMAP experiments and subsequent dataanalysis were done as described previously (60, 61). Data from theseexperiments are presented on our supporting Web site.3
RESULTS
Method Overview
We compiled a reference set of complexes by combiningliterature-derived results from small scale experiments inMIPS (8) and SGD (31) with a hand-curated list (see oursupporting Web site3) that we generated. The MIPS, SGD,and hand-curated sets contain 225, 195, and 164 complexes,respectively (supplemental Fig. S1a). We established corre-spondence between the three lists and combined them into ahigh confidence reference set suitable for training our methodand for evaluating the accuracy of its predictions (see “Exper-imental Procedures”). This curated set was compiled prior tothe development of our method and was not subsequentlyrevised.
We then formulated the task of predicting whether twoproteins were members of the same complex as a machinelearning task. We used our reference set to construct a highquality set of positive and negative examples. We constructedfeatures that are useful for predicting this relationship from
A Complex-based Reconstruction of S. cerevisiae Interactome
Molecular & Cellular Proteomics 8.6 1367
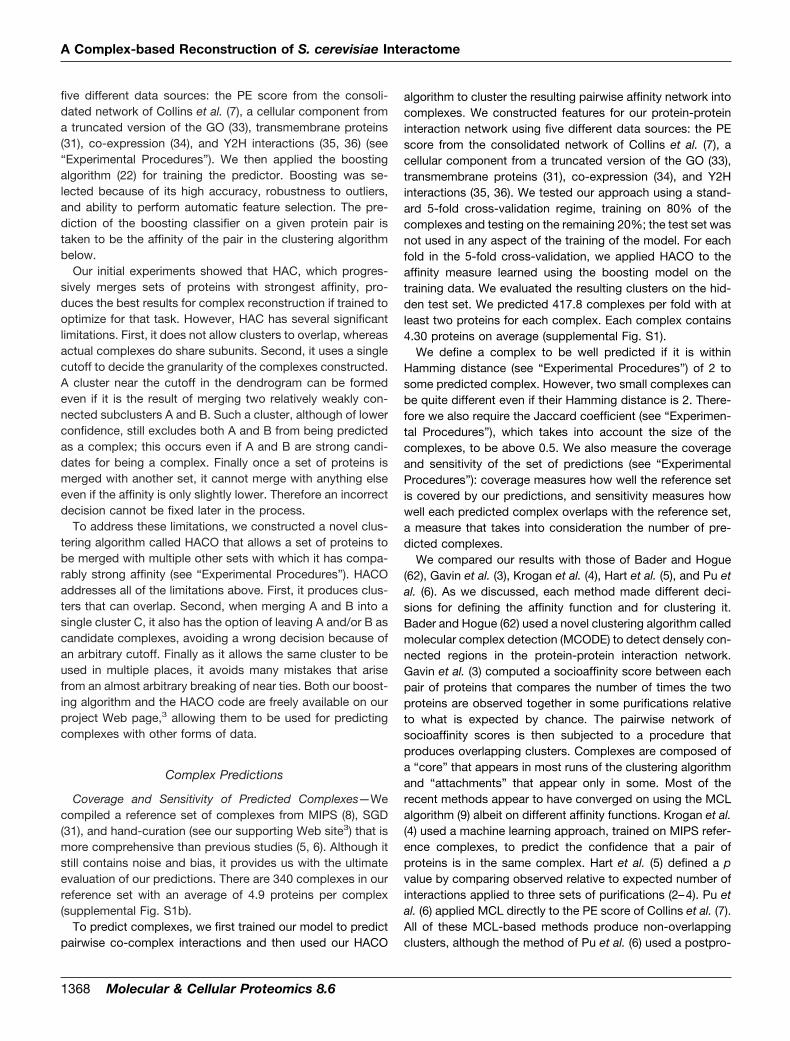
five different data sources: the PE score from the consoli-dated network of Collins et al. (7), a cellular component froma truncated version of the GO (33), transmembrane proteins(31), co-expression (34), and Y2H interactions (35, 36) (see“Experimental Procedures”). We then applied the boostingalgorithm (22) for training the predictor. Boosting was se-lected because of its high accuracy, robustness to outliers,and ability to perform automatic feature selection. The pre-diction of the boosting classifier on a given protein pair istaken to be the affinity of the pair in the clustering algorithmbelow.
Our initial experiments showed that HAC, which progres-sively merges sets of proteins with strongest affinity, pro-duces the best results for complex reconstruction if trained tooptimize for that task. However, HAC has several significantlimitations. First, it does not allow clusters to overlap, whereasactual complexes do share subunits. Second, it uses a singlecutoff to decide the granularity of the complexes constructed.A cluster near the cutoff in the dendrogram can be formedeven if it is the result of merging two relatively weakly con-nected subclusters A and B. Such a cluster, although of lowerconfidence, still excludes both A and B from being predictedas a complex; this occurs even if A and B are strong candi-dates for being a complex. Finally once a set of proteins ismerged with another set, it cannot merge with anything elseeven if the affinity is only slightly lower. Therefore an incorrectdecision cannot be fixed later in the process.
To address these limitations, we constructed a novel clus-tering algorithm called HACO that allows a set of proteins tobe merged with multiple other sets with which it has compa-rably strong affinity (see “Experimental Procedures”). HACOaddresses all of the limitations above. First, it produces clus-ters that can overlap. Second, when merging A and B into asingle cluster C, it also has the option of leaving A and/or B ascandidate complexes, avoiding a wrong decision because ofan arbitrary cutoff. Finally as it allows the same cluster to beused in multiple places, it avoids many mistakes that arisefrom an almost arbitrary breaking of near ties. Both our boost-ing algorithm and the HACO code are freely available on ourproject Web page,3 allowing them to be used for predictingcomplexes with other forms of data.
Complex Predictions
Coverage and Sensitivity of Predicted Complexes—Wecompiled a reference set of complexes from MIPS (8), SGD(31), and hand-curation (see our supporting Web site3) that ismore comprehensive than previous studies (5, 6). Although itstill contains noise and bias, it provides us with the ultimateevaluation of our predictions. There are 340 complexes in ourreference set with an average of 4.9 proteins per complex(supplemental Fig. S1b).
To predict complexes, we first trained our model to predictpairwise co-complex interactions and then used our HACO
algorithm to cluster the resulting pairwise affinity network intocomplexes. We constructed features for our protein-proteininteraction network using five different data sources: the PEscore from the consolidated network of Collins et al. (7), acellular component from a truncated version of the GO (33),transmembrane proteins (31), co-expression (34), and Y2Hinteractions (35, 36). We tested our approach using a stand-ard 5-fold cross-validation regime, training on 80% of thecomplexes and testing on the remaining 20%; the test set wasnot used in any aspect of the training of the model. For eachfold in the 5-fold cross-validation, we applied HACO to theaffinity measure learned using the boosting model on thetraining data. We evaluated the resulting clusters on the hid-den test set. We predicted 417.8 complexes per fold with atleast two proteins for each complex. Each complex contains4.30 proteins on average (supplemental Fig. S1).
We define a complex to be well predicted if it is withinHamming distance (see “Experimental Procedures”) of 2 tosome predicted complex. However, two small complexes canbe quite different even if their Hamming distance is 2. There-fore we also require the Jaccard coefficient (see “Experimen-tal Procedures”), which takes into account the size of thecomplexes, to be above 0.5. We also measure the coverageand sensitivity of the set of predictions (see “ExperimentalProcedures”): coverage measures how well the reference setis covered by our predictions, and sensitivity measures howwell each predicted complex overlaps with the reference set,a measure that takes into consideration the number of pre-dicted complexes.
We compared our results with those of Bader and Hogue(62), Gavin et al. (3), Krogan et al. (4), Hart et al. (5), and Pu etal. (6). As we discussed, each method made different deci-sions for defining the affinity function and for clustering it.Bader and Hogue (62) used a novel clustering algorithm calledmolecular complex detection (MCODE) to detect densely con-nected regions in the protein-protein interaction network.Gavin et al. (3) computed a socioaffinity score between eachpair of proteins that compares the number of times the twoproteins are observed together in some purifications relativeto what is expected by chance. The pairwise network ofsocioaffinity scores is then subjected to a procedure thatproduces overlapping clusters. Complexes are composed ofa “core” that appears in most runs of the clustering algorithmand “attachments” that appear only in some. Most of therecent methods appear to have converged on using the MCLalgorithm (9) albeit on different affinity functions. Krogan et al.(4) used a machine learning approach, trained on MIPS refer-ence complexes, to predict the confidence that a pair ofproteins is in the same complex. Hart et al. (5) defined a pvalue by comparing observed relative to expected number ofinteractions applied to three sets of purifications (2–4). Pu etal. (6) applied MCL directly to the PE score of Collins et al. (7).All of these MCL-based methods produce non-overlappingclusters, although the method of Pu et al. (6) used a postpro-
A Complex-based Reconstruction of S. cerevisiae Interactome
1368 Molecular & Cellular Proteomics 8.6
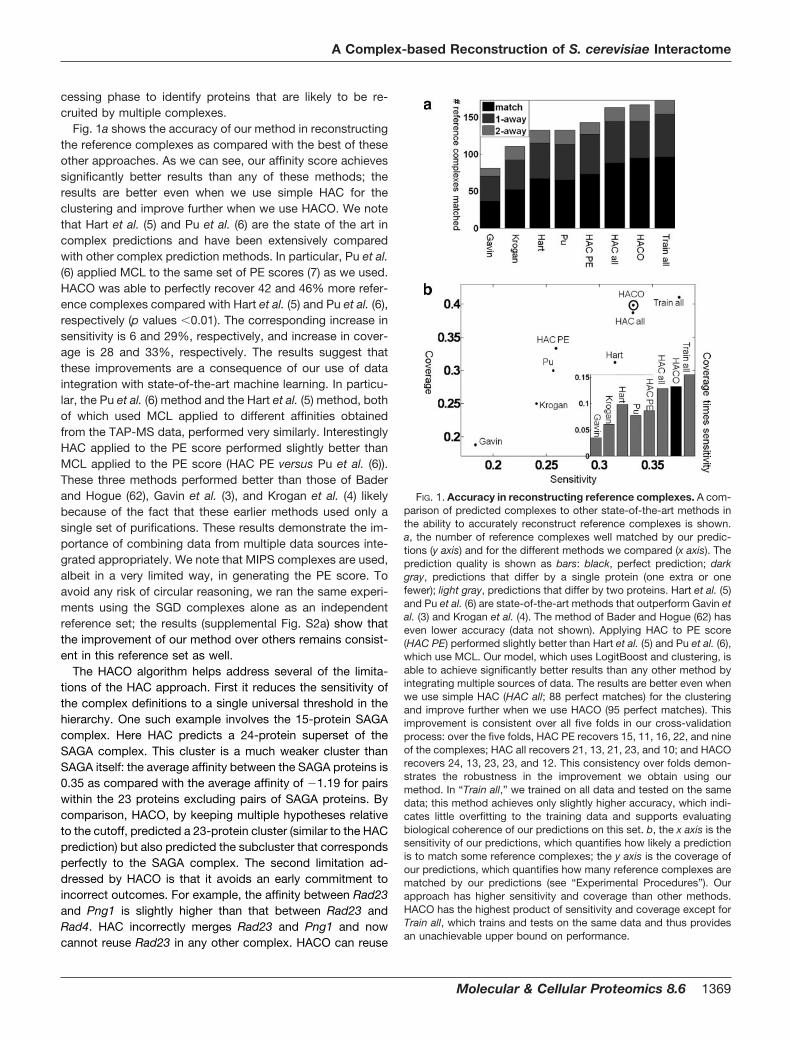
cessing phase to identify proteins that are likely to be re-cruited by multiple complexes.
Fig. 1a shows the accuracy of our method in reconstructingthe reference complexes as compared with the best of theseother approaches. As we can see, our affinity score achievessignificantly better results than any of these methods; theresults are better even when we use simple HAC for theclustering and improve further when we use HACO. We notethat Hart et al. (5) and Pu et al. (6) are the state of the art incomplex predictions and have been extensively comparedwith other complex prediction methods. In particular, Pu et al.(6) applied MCL to the same set of PE scores (7) as we used.HACO was able to perfectly recover 42 and 46% more refer-ence complexes compared with Hart et al. (5) and Pu et al. (6),respectively (p values �0.01). The corresponding increase insensitivity is 6 and 29%, respectively, and increase in cover-age is 28 and 33%, respectively. The results suggest thatthese improvements are a consequence of our use of dataintegration with state-of-the-art machine learning. In particu-lar, the Pu et al. (6) method and the Hart et al. (5) method, bothof which used MCL applied to different affinities obtainedfrom the TAP-MS data, performed very similarly. InterestinglyHAC applied to the PE score performed slightly better thanMCL applied to the PE score (HAC PE versus Pu et al. (6)).These three methods performed better than those of Baderand Hogue (62), Gavin et al. (3), and Krogan et al. (4) likelybecause of the fact that these earlier methods used only asingle set of purifications. These results demonstrate the im-portance of combining data from multiple data sources inte-grated appropriately. We note that MIPS complexes are used,albeit in a very limited way, in generating the PE score. Toavoid any risk of circular reasoning, we ran the same experi-ments using the SGD complexes alone as an independentreference set; the results (supplemental Fig. S2a) show thatthe improvement of our method over others remains consist-ent in this reference set as well.
The HACO algorithm helps address several of the limita-tions of the HAC approach. First it reduces the sensitivity ofthe complex definitions to a single universal threshold in thehierarchy. One such example involves the 15-protein SAGAcomplex. Here HAC predicts a 24-protein superset of theSAGA complex. This cluster is a much weaker cluster thanSAGA itself: the average affinity between the SAGA proteins is0.35 as compared with the average affinity of �1.19 for pairswithin the 23 proteins excluding pairs of SAGA proteins. Bycomparison, HACO, by keeping multiple hypotheses relativeto the cutoff, predicted a 23-protein cluster (similar to the HACprediction) but also predicted the subcluster that correspondsperfectly to the SAGA complex. The second limitation ad-dressed by HACO is that it avoids an early commitment toincorrect outcomes. For example, the affinity between Rad23and Png1 is slightly higher than that between Rad23 andRad4. HAC incorrectly merges Rad23 and Png1 and nowcannot reuse Rad23 in any other complex. HACO can reuse
FIG. 1. Accuracy in reconstructing reference complexes. A com-parison of predicted complexes to other state-of-the-art methods inthe ability to accurately reconstruct reference complexes is shown.a, the number of reference complexes well matched by our predic-tions (y axis) and for the different methods we compared (x axis). Theprediction quality is shown as bars: black, perfect prediction; darkgray, predictions that differ by a single protein (one extra or onefewer); light gray, predictions that differ by two proteins. Hart et al. (5)and Pu et al. (6) are state-of-the-art methods that outperform Gavin etal. (3) and Krogan et al. (4). The method of Bader and Hogue (62) haseven lower accuracy (data not shown). Applying HAC to PE score(HAC PE) performed slightly better than Hart et al. (5) and Pu et al. (6),which use MCL. Our model, which uses LogitBoost and clustering, isable to achieve significantly better results than any other method byintegrating multiple sources of data. The results are better even whenwe use simple HAC (HAC all; 88 perfect matches) for the clusteringand improve further when we use HACO (95 perfect matches). Thisimprovement is consistent over all five folds in our cross-validationprocess: over the five folds, HAC PE recovers 15, 11, 16, 22, and nineof the complexes; HAC all recovers 21, 13, 21, 23, and 10; and HACOrecovers 24, 13, 23, 23, and 12. This consistency over folds demon-strates the robustness in the improvement we obtain using ourmethod. In “Train all,” we trained on all data and tested on the samedata; this method achieves only slightly higher accuracy, which indi-cates little overfitting to the training data and supports evaluatingbiological coherence of our predictions on this set. b, the x axis is thesensitivity of our predictions, which quantifies how likely a predictionis to match some reference complexes; the y axis is the coverage ofour predictions, which quantifies how many reference complexes arematched by our predictions (see “Experimental Procedures”). Ourapproach has higher sensitivity and coverage than other methods.HACO has the highest product of sensitivity and coverage except forTrain all, which trains and tests on the same data and thus providesan unachievable upper bound on performance.
A Complex-based Reconstruction of S. cerevisiae Interactome
Molecular & Cellular Proteomics 8.6 1369
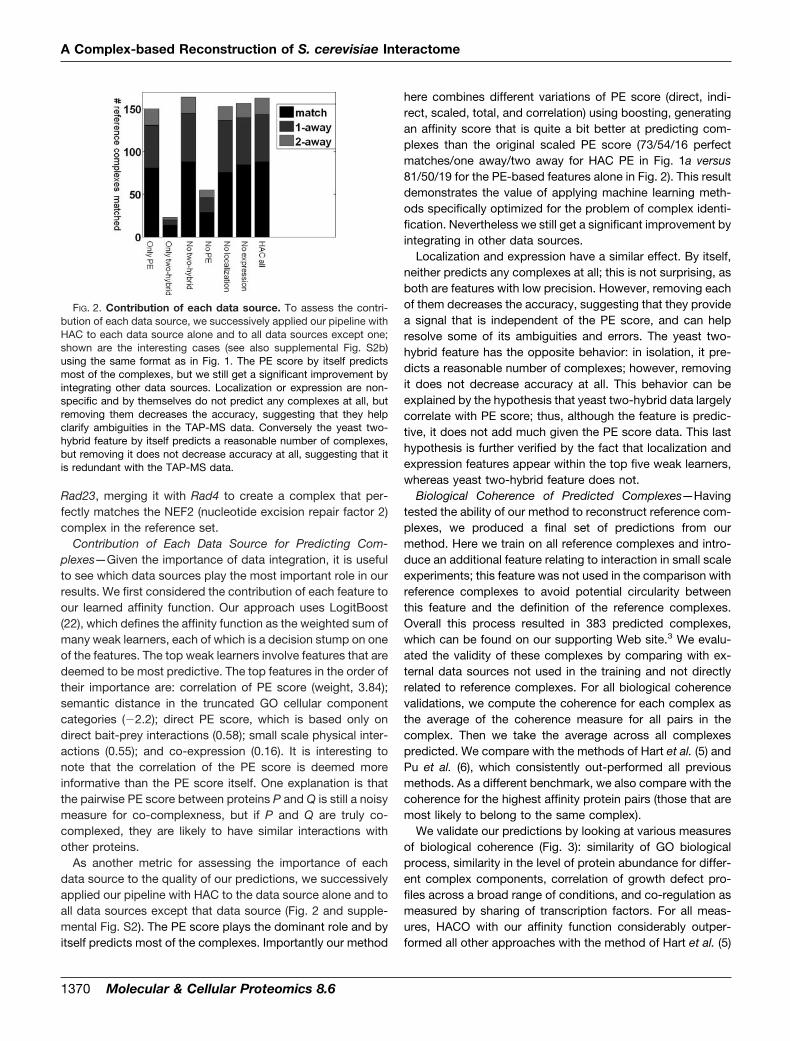
Rad23, merging it with Rad4 to create a complex that per-fectly matches the NEF2 (nucleotide excision repair factor 2)complex in the reference set.
Contribution of Each Data Source for Predicting Com-plexes—Given the importance of data integration, it is usefulto see which data sources play the most important role in ourresults. We first considered the contribution of each feature toour learned affinity function. Our approach uses LogitBoost(22), which defines the affinity function as the weighted sum ofmany weak learners, each of which is a decision stump on oneof the features. The top weak learners involve features that aredeemed to be most predictive. The top features in the order oftheir importance are: correlation of PE score (weight, 3.84);semantic distance in the truncated GO cellular componentcategories (�2.2); direct PE score, which is based only ondirect bait-prey interactions (0.58); small scale physical inter-actions (0.55); and co-expression (0.16). It is interesting tonote that the correlation of the PE score is deemed moreinformative than the PE score itself. One explanation is thatthe pairwise PE score between proteins P and Q is still a noisymeasure for co-complexness, but if P and Q are truly co-complexed, they are likely to have similar interactions withother proteins.
As another metric for assessing the importance of eachdata source to the quality of our predictions, we successivelyapplied our pipeline with HAC to the data source alone and toall data sources except that data source (Fig. 2 and supple-mental Fig. S2). The PE score plays the dominant role and byitself predicts most of the complexes. Importantly our method
here combines different variations of PE score (direct, indi-rect, scaled, total, and correlation) using boosting, generatingan affinity score that is quite a bit better at predicting com-plexes than the original scaled PE score (73/54/16 perfectmatches/one away/two away for HAC PE in Fig. 1a versus81/50/19 for the PE-based features alone in Fig. 2). This resultdemonstrates the value of applying machine learning meth-ods specifically optimized for the problem of complex identi-fication. Nevertheless we still get a significant improvement byintegrating in other data sources.
Localization and expression have a similar effect. By itself,neither predicts any complexes at all; this is not surprising, asboth are features with low precision. However, removing eachof them decreases the accuracy, suggesting that they providea signal that is independent of the PE score, and can helpresolve some of its ambiguities and errors. The yeast two-hybrid feature has the opposite behavior: in isolation, it pre-dicts a reasonable number of complexes; however, removingit does not decrease accuracy at all. This behavior can beexplained by the hypothesis that yeast two-hybrid data largelycorrelate with PE score; thus, although the feature is predic-tive, it does not add much given the PE score data. This lasthypothesis is further verified by the fact that localization andexpression features appear within the top five weak learners,whereas yeast two-hybrid feature does not.
Biological Coherence of Predicted Complexes—Havingtested the ability of our method to reconstruct reference com-plexes, we produced a final set of predictions from ourmethod. Here we train on all reference complexes and intro-duce an additional feature relating to interaction in small scaleexperiments; this feature was not used in the comparison withreference complexes to avoid potential circularity betweenthis feature and the definition of the reference complexes.Overall this process resulted in 383 predicted complexes,which can be found on our supporting Web site.3 We evalu-ated the validity of these complexes by comparing with ex-ternal data sources not used in the training and not directlyrelated to reference complexes. For all biological coherencevalidations, we compute the coherence for each complex asthe average of the coherence measure for all pairs in thecomplex. Then we take the average across all complexespredicted. We compare with the methods of Hart et al. (5) andPu et al. (6), which consistently out-performed all previousmethods. As a different benchmark, we also compare with thecoherence for the highest affinity protein pairs (those that aremost likely to belong to the same complex).
We validate our predictions by looking at various measuresof biological coherence (Fig. 3): similarity of GO biologicalprocess, similarity in the level of protein abundance for differ-ent complex components, correlation of growth defect pro-files across a broad range of conditions, and co-regulation asmeasured by sharing of transcription factors. For all meas-ures, HACO with our affinity function considerably outper-formed all other approaches with the method of Hart et al. (5)
FIG. 2. Contribution of each data source. To assess the contri-bution of each data source, we successively applied our pipeline withHAC to each data source alone and to all data sources except one;shown are the interesting cases (see also supplemental Fig. S2b)using the same format as in Fig. 1. The PE score by itself predictsmost of the complexes, but we still get a significant improvement byintegrating other data sources. Localization or expression are non-specific and by themselves do not predict any complexes at all, butremoving them decreases the accuracy, suggesting that they helpclarify ambiguities in the TAP-MS data. Conversely the yeast two-hybrid feature by itself predicts a reasonable number of complexes,but removing it does not decrease accuracy at all, suggesting that itis redundant with the TAP-MS data.
A Complex-based Reconstruction of S. cerevisiae Interactome
1370 Molecular & Cellular Proteomics 8.6
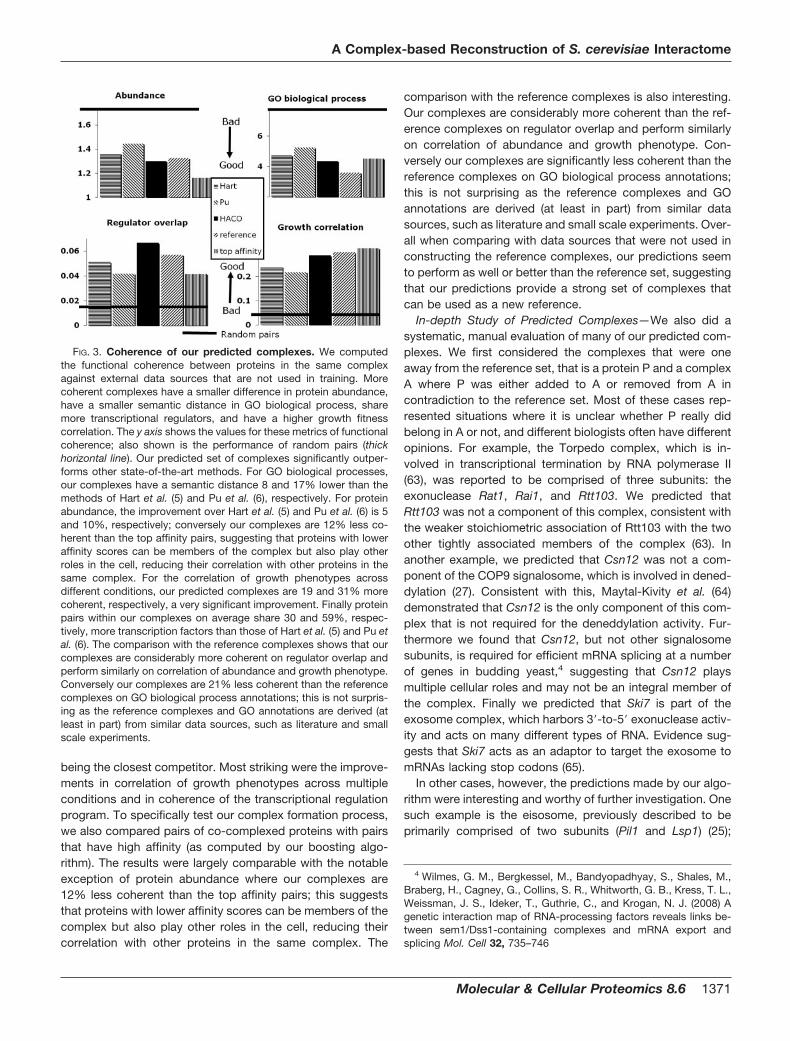
being the closest competitor. Most striking were the improve-ments in correlation of growth phenotypes across multipleconditions and in coherence of the transcriptional regulationprogram. To specifically test our complex formation process,we also compared pairs of co-complexed proteins with pairsthat have high affinity (as computed by our boosting algo-rithm). The results were largely comparable with the notableexception of protein abundance where our complexes are12% less coherent than the top affinity pairs; this suggeststhat proteins with lower affinity scores can be members of thecomplex but also play other roles in the cell, reducing theircorrelation with other proteins in the same complex. The
comparison with the reference complexes is also interesting.Our complexes are considerably more coherent than the ref-erence complexes on regulator overlap and perform similarlyon correlation of abundance and growth phenotype. Con-versely our complexes are significantly less coherent than thereference complexes on GO biological process annotations;this is not surprising as the reference complexes and GOannotations are derived (at least in part) from similar datasources, such as literature and small scale experiments. Over-all when comparing with data sources that were not used inconstructing the reference complexes, our predictions seemto perform as well or better than the reference set, suggestingthat our predictions provide a strong set of complexes thatcan be used as a new reference.
In-depth Study of Predicted Complexes—We also did asystematic, manual evaluation of many of our predicted com-plexes. We first considered the complexes that were oneaway from the reference set, that is a protein P and a complexA where P was either added to A or removed from A incontradiction to the reference set. Most of these cases rep-resented situations where it is unclear whether P really didbelong in A or not, and different biologists often have differentopinions. For example, the Torpedo complex, which is in-volved in transcriptional termination by RNA polymerase II(63), was reported to be comprised of three subunits: theexonuclease Rat1, Rai1, and Rtt103. We predicted thatRtt103 was not a component of this complex, consistent withthe weaker stoichiometric association of Rtt103 with the twoother tightly associated members of the complex (63). Inanother example, we predicted that Csn12 was not a com-ponent of the COP9 signalosome, which is involved in dened-dylation (27). Consistent with this, Maytal-Kivity et al. (64)demonstrated that Csn12 is the only component of this com-plex that is not required for the deneddylation activity. Fur-thermore we found that Csn12, but not other signalosomesubunits, is required for efficient mRNA splicing at a numberof genes in budding yeast,4 suggesting that Csn12 playsmultiple cellular roles and may not be an integral member ofthe complex. Finally we predicted that Ski7 is part of theexosome complex, which harbors 3�-to-5� exonuclease activ-ity and acts on many different types of RNA. Evidence sug-gests that Ski7 acts as an adaptor to target the exosome tomRNAs lacking stop codons (65).
In other cases, however, the predictions made by our algo-rithm were interesting and worthy of further investigation. Onesuch example is the eisosome, previously described to beprimarily comprised of two subunits (Pil1 and Lsp1) (25);
4 Wilmes, G. M., Bergkessel, M., Bandyopadhyay, S., Shales, M.,Braberg, H., Cagney, G., Collins, S. R., Whitworth, G. B., Kress, T. L.,Weissman, J. S., Ideker, T., Guthrie, C., and Krogan, N. J. (2008) Agenetic interaction map of RNA-processing factors reveals links be-tween sem1/Dss1-containing complexes and mRNA export andsplicing Mol. Cell 32, 735–746
FIG. 3. Coherence of our predicted complexes. We computedthe functional coherence between proteins in the same complexagainst external data sources that are not used in training. Morecoherent complexes have a smaller difference in protein abundance,have a smaller semantic distance in GO biological process, sharemore transcriptional regulators, and have a higher growth fitnesscorrelation. The y axis shows the values for these metrics of functionalcoherence; also shown is the performance of random pairs (thickhorizontal line). Our predicted set of complexes significantly outper-forms other state-of-the-art methods. For GO biological processes,our complexes have a semantic distance 8 and 17% lower than themethods of Hart et al. (5) and Pu et al. (6), respectively. For proteinabundance, the improvement over Hart et al. (5) and Pu et al. (6) is 5and 10%, respectively; conversely our complexes are 12% less co-herent than the top affinity pairs, suggesting that proteins with loweraffinity scores can be members of the complex but also play otherroles in the cell, reducing their correlation with other proteins in thesame complex. For the correlation of growth phenotypes acrossdifferent conditions, our predicted complexes are 19 and 31% morecoherent, respectively, a very significant improvement. Finally proteinpairs within our complexes on average share 30 and 59%, respec-tively, more transcription factors than those of Hart et al. (5) and Pu etal. (6). The comparison with the reference complexes shows that ourcomplexes are considerably more coherent on regulator overlap andperform similarly on correlation of abundance and growth phenotype.Conversely our complexes are 21% less coherent than the referencecomplexes on GO biological process annotations; this is not surpris-ing as the reference complexes and GO annotations are derived (atleast in part) from similar data sources, such as literature and smallscale experiments.
A Complex-based Reconstruction of S. cerevisiae Interactome
Molecular & Cellular Proteomics 8.6 1371
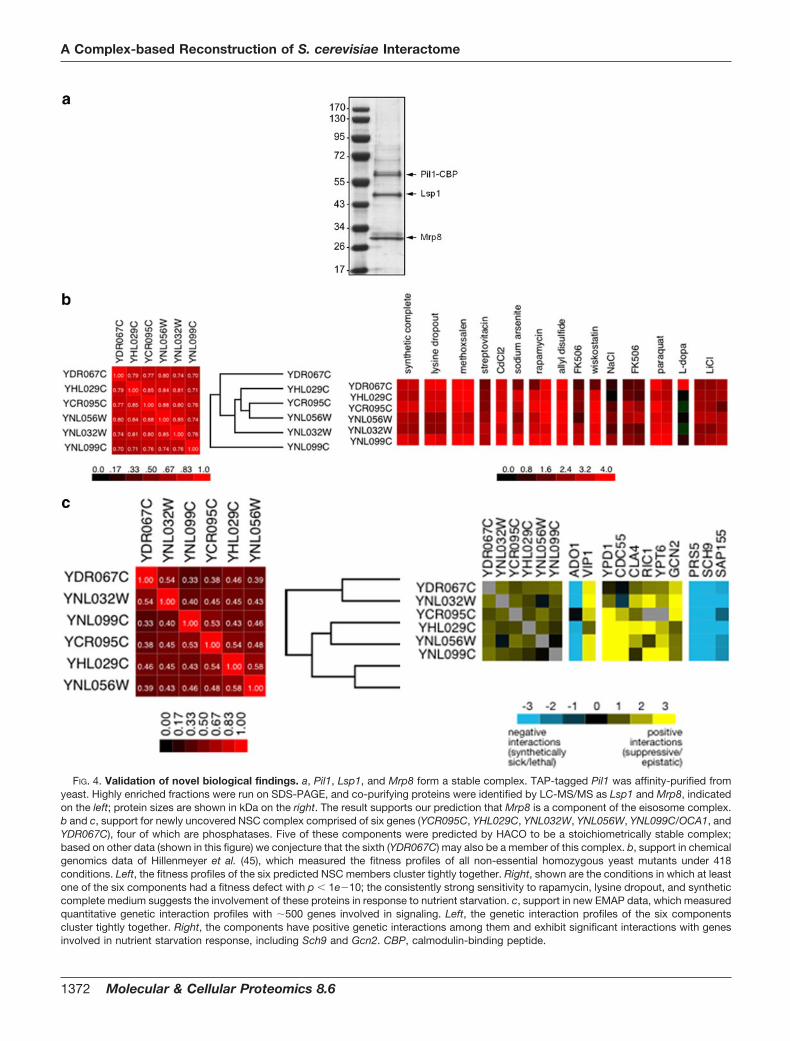
FIG. 4. Validation of novel biological findings. a, Pil1, Lsp1, and Mrp8 form a stable complex. TAP-tagged Pil1 was affinity-purified fromyeast. Highly enriched fractions were run on SDS-PAGE, and co-purifying proteins were identified by LC-MS/MS as Lsp1 and Mrp8, indicatedon the left; protein sizes are shown in kDa on the right. The result supports our prediction that Mrp8 is a component of the eisosome complex.b and c, support for newly uncovered NSC complex comprised of six genes (YCR095C, YHL029C, YNL032W, YNL056W, YNL099C/OCA1, andYDR067C), four of which are phosphatases. Five of these components were predicted by HACO to be a stoichiometrically stable complex;based on other data (shown in this figure) we conjecture that the sixth (YDR067C) may also be a member of this complex. b, support in chemicalgenomics data of Hillenmeyer et al. (45), which measured the fitness profiles of all non-essential homozygous yeast mutants under 418conditions. Left, the fitness profiles of the six predicted NSC members cluster tightly together. Right, shown are the conditions in which at leastone of the six components had a fitness defect with p � 1e�10; the consistently strong sensitivity to rapamycin, lysine dropout, and syntheticcomplete medium suggests the involvement of these proteins in response to nutrient starvation. c, support in new EMAP data, which measuredquantitative genetic interaction profiles with �500 genes involved in signaling. Left, the genetic interaction profiles of the six componentscluster tightly together. Right, the components have positive genetic interactions among them and exhibit significant interactions with genesinvolved in nutrient starvation response, including Sch9 and Gcn2. CBP, calmodulin-binding peptide.
A Complex-based Reconstruction of S. cerevisiae Interactome
1372 Molecular & Cellular Proteomics 8.6
however, we predicted that the complex contains another, pre-viously undescribed component, Mrp8. Consistent with thisprediction, TAP purification of Mrp8 reveals that it is indeed astoichiometrically stable member of the eisosome complex (seeFig. 4a). Further work will be required to determine the role thatthis novel subunit plays in eisosome function.
We also studied the novel complex predictions, those thatdid not match any of the reference complexes above our matchthreshold. A number of these turned out to be well characterizedcomplexes that, for some reason, had not (yet) been includedinto any of our three reference sets. For example, we identifiedthe Sit4/Sap185 heterodimer phosphatase complex (66); acomplex comprised of Yos9, Hrd3, Usa1, and Hrd1 that isinvolved in endoplasmic reticulum-associated degradation (67,68); and the U3-processome complex (complex 1129) involvedin the generation and regulation of the small ribosomal particle(69). Many others comprised plausible complexes that, to ourknowledge, have not yet been characterized and are worthycandidates for further investigation.
One such example is a complex (complex 1014) comprisedof five components (YNL099C/OCA1, YNL056W/OCA2,YNL032W/SIW14/OCA3, YCR095C/OCA4, and YHL029C/OCA5), four of which are putative phosphatases. One of theproteins (Oca1) has been previously shown to be required forcell cycle arrest in response to exposure to a lipid peroxide(70). We note that the individual pairwise connections be-tween these proteins were observed before and that variousforms of evidence support their shared function (14), includinga shared phenotype of oxidant-induced cell cycle arrest,which underlies the current name of many of these genes inSGD. However, this group was not previously identified as acomplex nor was its function characterized. Further support-ing our prediction of this group as a complex is the fact thatthe chemical-genetic interaction profiles of the five geneswere tightly clustered in a recent high throughput study (45)(Fig. 4b). Mutations in the components of the complex re-sulted in significant sensitivity to a number of conditions,including several that are related to nutrient starvation, includ-ing exposure to rapamycin, lysine dropout, and syntheticcomplete medium. To further characterize the functions ofthese factors, we subjected the mutants to quantitative ge-netic interaction profiling using an EMAP (60, 61, 71) focusedon genes implicated in signaling, including protein and smallmolecule kinases and phosphatases (see our supporting Website3). Again we found that the components of the complexhad strong positive genetic interactions between them andclustered tightly together within the set of �500 genes in-cluded in the EMAP, both factors that indicate a strong func-tional connection (60). Specifically we found that all compo-nents have strong negative genetic interactions with Sch9, theyeast homolog of S6 kinase and a central node in nutrientsignaling (72, 73). Conversely we found strong positive ge-netic interactions with GCN2, a protein kinase that phospho-rylates the subunit of translation initiation factor eIF2 (Sui2)
in response to nutrient starvation (74). Collectively these datasuggest an involvement of these proteins in response to nu-trient starvation. Interestingly both the chemogenomic pro-filing and the genetic interactions suggested a functionalconnection to another uncharacterized gene, YDR067C,which may form a sixth member of the complex. Based onthe coherence of this complex and its strong links to nutri-ent starvation, we propose to name this six-proteincomplex NSC.
The predictions made by our algorithm also contained anumber of mistakes, which fell into two main categories. Thefirst comprised subsets of known complexes, such as subsetsof the pre-60 S ribosomal particle (complexes 1088 and1106). These may represent functionally distinct submoduleswithin larger complexes and therefore may provide usefulinsight about complex structure. Consistent with this notion,we identified the deubiquitination unit of SAGA (Ubp8/Sgf11)(75–77). The other category of error involved pairs of com-plexes that either interact or share subunits and were mergedby the HACO procedure into a single complex. For example,complex 1125 is comprised of two chromatin-remodelingcomplexes, INO80-C and SWR-C, which have shared com-ponents, including Rvb1 and Rvb2, members of the RuvBfamily of helicases (78). These two error modes illustrate thedifficulty in selecting the appropriate granularity for makingcomplex predictions where some complexes occur fairly lowin the clustergram so that they have very high affinity withcomponents outside the complex, whereas others occur veryhigh in the clustergram so that they contain components thathave low affinity among themselves. This difficulty is perhapsone of the biggest challenges in accurately determining com-plexes. We note, however, that in some cases (such as theSAGA complex described above), the correct complexesthemselves (or a slight variant) were sometimes also membersin our set of predictions, a situation possible because of theability of HACO to make predictions at multiple levels ofgranularity. Thus, HACO is occasionally able to circumventthis challenge by trading off coverage for precision.
A Comprehensive Interaction Network
Complexes together with individual proteins comprise thebasic units of the interaction network of the cell. So far, mostof the work (27–29) has focused on predictions of interactionsbetween pairs of individual proteins. However, the view of thenetwork in terms of pairwise interactions loses much of itsstructure. Many interactions arise from co-complexness sothat a single large complex can give rise to a very dense(almost complete) subgraph in the network. Other pairwiseinteractions are representatives of interactions between largercomplexes. We therefore set out to construct a comprehen-sive network of interactions between all basic units in theproteome, both complexes and proteins.
We compiled a reference set of CCIs and protein-complexinteractions from reliable protein-protein interactions and
A Complex-based Reconstruction of S. cerevisiae Interactome
Molecular & Cellular Proteomics 8.6 1373
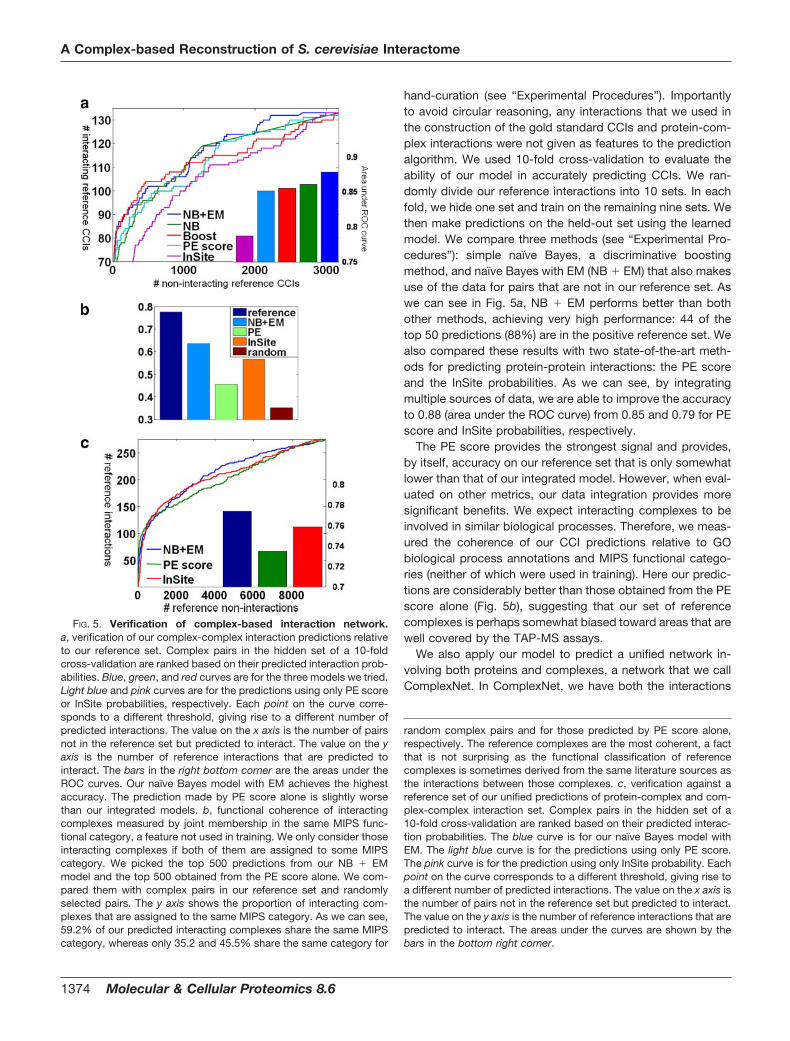
hand-curation (see “Experimental Procedures”). Importantlyto avoid circular reasoning, any interactions that we used inthe construction of the gold standard CCIs and protein-com-plex interactions were not given as features to the predictionalgorithm. We used 10-fold cross-validation to evaluate theability of our model in accurately predicting CCIs. We ran-domly divide our reference interactions into 10 sets. In eachfold, we hide one set and train on the remaining nine sets. Wethen make predictions on the held-out set using the learnedmodel. We compare three methods (see “Experimental Pro-cedures”): simple naïve Bayes, a discriminative boostingmethod, and naïve Bayes with EM (NB � EM) that also makesuse of the data for pairs that are not in our reference set. Aswe can see in Fig. 5a, NB � EM performs better than bothother methods, achieving very high performance: 44 of thetop 50 predictions (88%) are in the positive reference set. Wealso compared these results with two state-of-the-art meth-ods for predicting protein-protein interactions: the PE scoreand the InSite probabilities. As we can see, by integratingmultiple sources of data, we are able to improve the accuracyto 0.88 (area under the ROC curve) from 0.85 and 0.79 for PEscore and InSite probabilities, respectively.
The PE score provides the strongest signal and provides,by itself, accuracy on our reference set that is only somewhatlower than that of our integrated model. However, when eval-uated on other metrics, our data integration provides moresignificant benefits. We expect interacting complexes to beinvolved in similar biological processes. Therefore, we meas-ured the coherence of our CCI predictions relative to GObiological process annotations and MIPS functional catego-ries (neither of which were used in training). Here our predic-tions are considerably better than those obtained from the PEscore alone (Fig. 5b), suggesting that our set of referencecomplexes is perhaps somewhat biased toward areas that arewell covered by the TAP-MS assays.
We also apply our model to predict a unified network in-volving both proteins and complexes, a network that we callComplexNet. In ComplexNet, we have both the interactions
FIG. 5. Verification of complex-based interaction network.a, verification of our complex-complex interaction predictions relativeto our reference set. Complex pairs in the hidden set of a 10-foldcross-validation are ranked based on their predicted interaction prob-abilities. Blue, green, and red curves are for the three models we tried.Light blue and pink curves are for the predictions using only PE scoreor InSite probabilities, respectively. Each point on the curve corre-sponds to a different threshold, giving rise to a different number ofpredicted interactions. The value on the x axis is the number of pairsnot in the reference set but predicted to interact. The value on the yaxis is the number of reference interactions that are predicted tointeract. The bars in the right bottom corner are the areas under theROC curves. Our naïve Bayes model with EM achieves the highestaccuracy. The prediction made by PE score alone is slightly worsethan our integrated models. b, functional coherence of interactingcomplexes measured by joint membership in the same MIPS func-tional category, a feature not used in training. We only consider thoseinteracting complexes if both of them are assigned to some MIPScategory. We picked the top 500 predictions from our NB � EMmodel and the top 500 obtained from the PE score alone. We com-pared them with complex pairs in our reference set and randomlyselected pairs. The y axis shows the proportion of interacting com-plexes that are assigned to the same MIPS category. As we can see,59.2% of our predicted interacting complexes share the same MIPScategory, whereas only 35.2 and 45.5% share the same category for
random complex pairs and for those predicted by PE score alone,respectively. The reference complexes are the most coherent, a factthat is not surprising as the functional classification of referencecomplexes is sometimes derived from the same literature sources asthe interactions between those complexes. c, verification against areference set of our unified predictions of protein-complex and com-plex-complex interaction set. Complex pairs in the hidden set of a10-fold cross-validation are ranked based on their predicted interac-tion probabilities. The blue curve is for our naïve Bayes model withEM. The light blue curve is for the predictions using only PE score.The pink curve is for the prediction using only InSite probability. Eachpoint on the curve corresponds to a different threshold, giving rise toa different number of predicted interactions. The value on the x axis isthe number of pairs not in the reference set but predicted to interact.The value on the y axis is the number of reference interactions that arepredicted to interact. The areas under the curves are shown by thebars in the bottom right corner.
A Complex-based Reconstruction of S. cerevisiae Interactome
1374 Molecular & Cellular Proteomics 8.6
between two complexes and the interactions between a pro-tein and a complex. As we can see from Fig. 5c, by integratingmultiple data sources, our naïve Bayes model with EM is ableto achieve higher accuracy than using either PE score orInSite probability alone. We generated predictions for all pro-tein-complex pairs and complex-complex pairs by training onthe entire reference set (see our supporting Web site3 for thecomplete list of the predictions). Overall our predictions pro-vide a comprehensive network of all of the interactions involv-ing complexes. It can be combined with a set of high qualityprotein-protein interactions (such as Ref. 49) to provide acomplete set of predictions for the S. cerevisiae protein inter-action network. Fig. 6 presents a fragment of the network.
We identified many CCIs that were expected and well char-acterized but not in the reference set, such as interactionsbetween histones and several chromatin-modifying com-plexes including the ISW1 complex, the HAT1 complex, andRSC. ComplexNet also suggests novel hypotheses, several ofwhich have support in the literature. For example, we pre-dicted an interaction between complex 1035, which consistsof the poorly characterized proteins Yer071c and Yir003w/Aim21, with the yeast actin-capping protein (a Cap1-Cap2heterodimer). Consistent with this prediction, high throughputfluorescence microscopy found that Yir003w co-localizes withcomponents of the actin cytoskeleton (37), and two-hybriddata has connected Yir003w to the actin-binding proteinAbp1 (79). Additionally like deletion of CAP1 or CAP2, dele-tion of YER071C or YIR003W results in strong sensitivity tothe actin-depolymerizing agent latrunculin (45). Our observa-tion suggests a more specific placement of this complexamong the actin regulatory machinery. We also found severalinteresting interactions involving the centromere-localizedkinetochore complex (Fig. 6), some of which have independ-ent support. Our prediction of an interaction between thekinetochore and the proteasome is supported by a recentreport that levels of Cse4, a centromere-localized histone, areregulated by ubiquitin-proteasome-mediated proteolysis (80).Our predicted link between the kinetochore and the spliceo-some is consistent with evidence of a functional connectionbetween these two factors (81). The remaining connectionswe observed with the kinetochore (pre-60 S ribosomal par-ticle and RNA polymerase III) are intriguing, but more workwill be required to determine the validity and functionalsignificance of these predicted relationships. We can alsolearn from the false positive predictions of CCIs. Our algo-rithm does make some apparently false positive predictions,and many of them fall into two main categories. Pairs ofcomplexes that share a substantial number of common com-ponents, such as the SWR complex and NuA4, are sometimesidentified as interacting. Additionally pairs of complexes thatdo not interact directly but are one link away in the interactionnetwork are sometimes identified. Along these lines, we iden-tified an interaction between the NuA4 histone acetylase com-plex and the opposing RPD3(L) deacetylase complex. Both
complexes have subunits with specificity for binding Lys4-trimethylated histone H3 (82) and have been found to beregulated by binding to 14-3-3 proteins (83). Thus, even sucha false positive may still provide interesting biological insights.
Essentiality and Complex Size
Much discussion has occurred regarding the relationshipbetween essentiality and the structure of the protein-proteininteraction network. Early work of Jeong et al. (26) and Han etal. (84) found that hub proteins in a protein-protein interactionnetwork are more likely to be encoded by essential genes.More recent work (85) suggests that highly connected pro-teins are simply more likely to participate in essential protein-protein interactions and are therefore more likely to be essen-tial. However, a deeper insight on the relationship betweenthe protein network and essentiality can be obtained by con-sidering the network at the level of complexes rather thanpairwise interactions. Such an analysis was recently per-formed by Hart et al. (5), who showed that essential proteinsare concentrated in certain complexes, resulting in a dichot-omy of essential and non-essential complexes. This phenom-enon was also found in our predicted complexes (Fig. 7a).However, that finding does not explain why hubs in the net-work are more likely to be essential. We therefore looked intothe distribution of essential proteins in complexes of differentsizes and found that the fraction of essential components in acomplex tends to increase with complex size (Fig. 7b). More-over when we aggregate over all complexes of a given size,larger complexes tend to have a far greater proportion ofessential proteins among their components (Fig. 7b). Compo-nents in a large complex are naturally highly connected in theprotein interaction network and therefore often form hubs.Thus, the finding regarding the essentiality of hubs very likelyarises from the fact that large complexes are more likely tohave a much higher ratio of essential genes. Our finding isconsistent with the recent work of Zotenko et al. (86), whoargue that essential hubs are often members of a denselyconnected set of proteins performing an essential cellularfunction. However, this analysis is still performed on the pair-wise protein network and hence is unable to identify thestrong dependence between the size of a complex and itsessentiality.
To test whether our finding truly explains the phenomenonof essential hubs, we tested whether essentiality is betterexplained by complex size or by hubness. We rank everyprotein based on the size of the largest complex to which itbelongs and for the K top-ranked proteins (for different valuesof K) plot the number of essential versus non-essential pro-teins (Fig. 7c). We plotted a similar curve by using the hubnessof the protein, the degree in the yeast two-hybrid protein-protein interaction network (35, 36). As we can see, complexsize is a much better predictor for essentiality than hubness.We note that if we use the scaled PE score (at threshold �0.5)
A Complex-based Reconstruction of S. cerevisiae Interactome
Molecular & Cellular Proteomics 8.6 1375
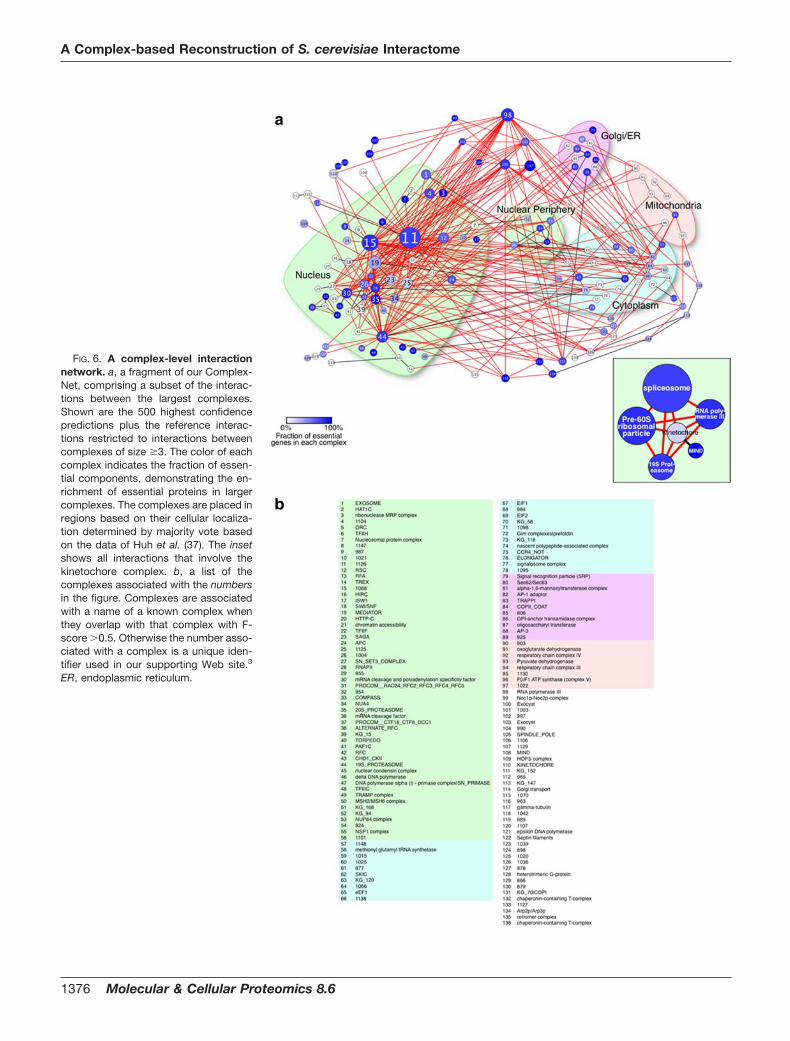
FIG. 6. A complex-level interactionnetwork. a, a fragment of our Complex-Net, comprising a subset of the interac-tions between the largest complexes.Shown are the 500 highest confidencepredictions plus the reference interac-tions restricted to interactions betweencomplexes of size �3. The color of eachcomplex indicates the fraction of essen-tial components, demonstrating the en-richment of essential proteins in largercomplexes. The complexes are placed inregions based on their cellular localiza-tion determined by majority vote basedon the data of Huh et al. (37). The insetshows all interactions that involve thekinetochore complex. b, a list of thecomplexes associated with the numbersin the figure. Complexes are associatedwith a name of a known complex whenthey overlap with that complex with F-score �0.5. Otherwise the number asso-ciated with a complex is a unique iden-tifier used in our supporting Web site.3
ER, endoplasmic reticulum.
A Complex-based Reconstruction of S. cerevisiae Interactome
1376 Molecular & Cellular Proteomics 8.6
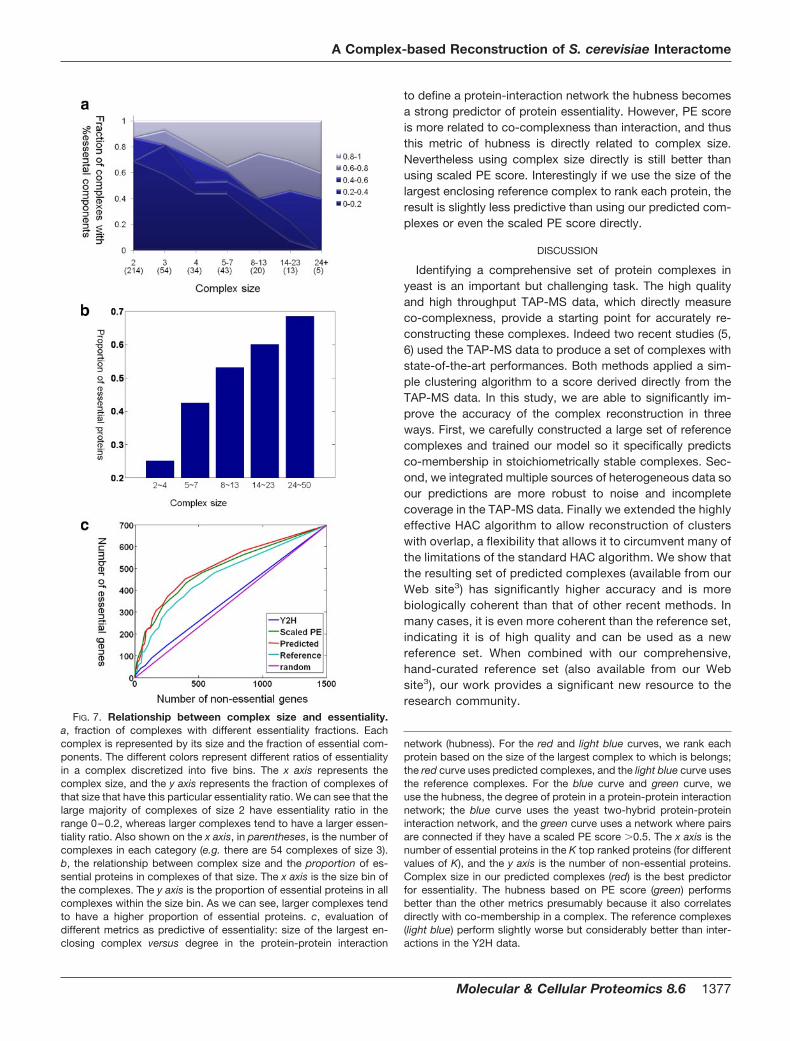
to define a protein-interaction network the hubness becomesa strong predictor of protein essentiality. However, PE scoreis more related to co-complexness than interaction, and thusthis metric of hubness is directly related to complex size.Nevertheless using complex size directly is still better thanusing scaled PE score. Interestingly if we use the size of thelargest enclosing reference complex to rank each protein, theresult is slightly less predictive than using our predicted com-plexes or even the scaled PE score directly.
DISCUSSION
Identifying a comprehensive set of protein complexes inyeast is an important but challenging task. The high qualityand high throughput TAP-MS data, which directly measureco-complexness, provide a starting point for accurately re-constructing these complexes. Indeed two recent studies (5,6) used the TAP-MS data to produce a set of complexes withstate-of-the-art performances. Both methods applied a sim-ple clustering algorithm to a score derived directly from theTAP-MS data. In this study, we are able to significantly im-prove the accuracy of the complex reconstruction in threeways. First, we carefully constructed a large set of referencecomplexes and trained our model so it specifically predictsco-membership in stoichiometrically stable complexes. Sec-ond, we integrated multiple sources of heterogeneous data soour predictions are more robust to noise and incompletecoverage in the TAP-MS data. Finally we extended the highlyeffective HAC algorithm to allow reconstruction of clusterswith overlap, a flexibility that allows it to circumvent many ofthe limitations of the standard HAC algorithm. We show thatthe resulting set of predicted complexes (available from ourWeb site3) has significantly higher accuracy and is morebiologically coherent than that of other recent methods. Inmany cases, it is even more coherent than the reference set,indicating it is of high quality and can be used as a newreference set. When combined with our comprehensive,hand-curated reference set (also available from our Website3), our work provides a significant new resource to theresearch community.
FIG. 7. Relationship between complex size and essentiality.a, fraction of complexes with different essentiality fractions. Eachcomplex is represented by its size and the fraction of essential com-ponents. The different colors represent different ratios of essentialityin a complex discretized into five bins. The x axis represents thecomplex size, and the y axis represents the fraction of complexes ofthat size that have this particular essentiality ratio. We can see that thelarge majority of complexes of size 2 have essentiality ratio in therange 0–0.2, whereas larger complexes tend to have a larger essen-tiality ratio. Also shown on the x axis, in parentheses, is the number ofcomplexes in each category (e.g. there are 54 complexes of size 3).b, the relationship between complex size and the proportion of es-sential proteins in complexes of that size. The x axis is the size bin ofthe complexes. The y axis is the proportion of essential proteins in allcomplexes within the size bin. As we can see, larger complexes tendto have a higher proportion of essential proteins. c, evaluation ofdifferent metrics as predictive of essentiality: size of the largest en-closing complex versus degree in the protein-protein interaction
network (hubness). For the red and light blue curves, we rank eachprotein based on the size of the largest complex to which is belongs;the red curve uses predicted complexes, and the light blue curve usesthe reference complexes. For the blue curve and green curve, weuse the hubness, the degree of protein in a protein-protein interactionnetwork; the blue curve uses the yeast two-hybrid protein-proteininteraction network, and the green curve uses a network where pairsare connected if they have a scaled PE score �0.5. The x axis is thenumber of essential proteins in the K top ranked proteins (for differentvalues of K), and the y axis is the number of non-essential proteins.Complex size in our predicted complexes (red) is the best predictorfor essentiality. The hubness based on PE score (green) performsbetter than the other metrics presumably because it also correlatesdirectly with co-membership in a complex. The reference complexes(light blue) perform slightly worse but considerably better than inter-actions in the Y2H data.
A Complex-based Reconstruction of S. cerevisiae Interactome
Molecular & Cellular Proteomics 8.6 1377
With our high quality set of complexes, we are able to takea higher level perspective on the protein-protein interactionnetwork, viewing it in terms of interactions between atomicunits (whether individual proteins or stable complexes). Therehas been much work on predicting protein-protein interac-tions. However, these pairwise interactions are often inducedby higher level relationships: those within a complex andthose between complexes. Interactions within a complex giverise to densely connected subgraphs in the interaction net-work; interactions between complexes can give rise to anetwork of interconnections involving different members ofthe two complexes. Viewing the network in terms of its atomicunits can help clarify its structure and its basic properties. Wetherefore defined the novel problem of predicting interactionsbetween complexes and other complexes or proteins andconstructed a new, high accuracy method for making suchpredictions. The result of our analysis is ComplexNet, a uni-fied interaction network involving both proteins and com-plexes. We can now analyze the properties of this network,which better captures the true interactions underlying cellularprocesses. In particular, this network provides a new per-spective on the previously observed relationship between the“hubness” of a protein in the network and its essentiality,demonstrating that larger complexes are more likely to beessential and comprise a large fraction of essential proteins. Itwould also be of interest to study other properties of thisnetwork, such as its connectivity or hierarchical structure.
To find a coherent set of proteins that form a complex, wehave the choice of many different clustering algorithms. Bro-hee and van Helden (87) showed that MCL works well on aprotein-protein interaction network by comparing it with threeother clustering algorithms in the literature. So not surpris-ingly, Pu et al. (6) and Hart et al. (5) applied MCL to theTAP-MS network; MCL is confirmed by our results to bebetter than other existing methods in terms of reconstructingreference complexes and biological coherence. On the otherhand, we found that HAC achieves about the same accuracyas MCL. Therefore, we focus on the best proven method andtry to further improve it by addressing some of its limitations.One of the significant advantages of our HACO algorithm,which extends the HAC, is its ability to create overlappingcomplexes. Indeed the inability of traditional HAC to generateoverlapping clusters is one of its major deficiencies in othertypes of data as well. Interestingly in our results, there wererelatively few cases where two “correct” complexes sharedsubcomponents. Most of the benefit of HACO arose fromavoiding mistakes arising from the greedy decisions of HACand from allowing predictions at different levels of granularity(e.g. a complex and one of its subunits). Nevertheless the lackof extensive sharing of components between complexes wassurprising given that such sharing is present in the referenceset. To some extent, this phenomenon is due to the trade-offin HACO parameters between increasing the amount of com-ponent sharing and errors arising from merging of distinct
complexes. However, HACO applied to other data sets (datanot shown) did give rise to much more extensive sharingamong different clusters. Thus, a complementary hypothesisis that some of the sharing of components between com-plexes arises when a protein plays roles in different com-plexes in different conditions. Our data, having been acquiredalmost entirely in YPD, would not reveal this condition-spe-cific pleiotropy. It would be of great interest to acquireTAP-MS data in different conditions and study the extent towhich complex structure is condition-specific.
We note that there are other clustering algorithms (88, 89)that also generate overlapping complexes. However, both ofthem are applicable only to a binary interaction network so anapplication to our task would require that we discretize thecontinuous affinities between protein pairs into two values(interacting and non-interacting) using some fixed threshold.Our analysis of the affinities for reference complexes sug-gested strongly that proteins that are co-complexed oftenexhibit affinities over a very broad range so that such a dis-cretization would result in an unacceptable loss of usefulinformation. On the other hand, HACO uses the continuousvalued affinities directly, allowing the finer resolution of thecomputed affinities to be used by the algorithm. We also notethat we devised several other novel methods that attempt toconstruct overlapping clusters. For example, one method di-rectly learns an affinity function to predict the likelihood that aset of proteins forms a complex, aiming to take advantage offeatures involving more than two proteins. HACO significantlyoutperformed all of our other proposed methods, and so weomit details.
There are still many reference complexes that are notmatched by our predicted complexes. Many of them fall intoroughly two categories. In the first category, proteins in thereference complex have high affinities with each other and aregrouped as a set during the HACO procedure. However, theyare not selected in our predictions because they are not at thegranularity where we cut our HACO cluster-lattice. They thenbecome subsets or supersets of some predicted complexes.In fact, if we use all the sets generated during our HACOprocedure as predicted complexes, 136 reference complexeswould be perfectly predicted and 243 would be well matchedby some predicted complexes in comparison with 95 perfectmatches and 189 good matches in our current predictions.However, this approach would result in far too many predic-tions (3478), greatly reducing sensitivity. This fact highlightsthe limitations in defining a universal level of affinity at whichone determines that a group of proteins forms a stable com-plex and suggests that a more flexible technique may be auseful direction for future work. In the second category, theproteins in the reference complex do not have high affinitieswith each other. This situation arises when the signal in thedata is not sufficiently strong to indicate that two proteins arelikely to interact. As most of our signal comes from theTAP-MS data, such “blind spots” can arise from limitations of
A Complex-based Reconstruction of S. cerevisiae Interactome
1378 Molecular & Cellular Proteomics 8.6
this assay, such as complexes of low abundance or that aremembrane-bound. In particular, we note that the TAP-MSdata were all acquired in a single condition (rich media), andsome complexes may simply not be present in the cell in thatcondition. Our inability to recover such complexes arises notfrom computational limitation, but from limitations in the data.New experimental assays are needed before these complexescan be reconstructed.
Like other previous approaches, our method was devel-oped in the context of S. cerevisiae where we have the mostdata relevant to protein-protein interactions. Having a highquality set of predicted complexes is of significant value evenin yeast as yeast provides an excellent model for many corebiological processes. Moreover many key complexes are con-served from yeast to human, making our complex predictionsvaluable also to analysis of higher level organisms. Finally ourmethod is general purpose and can easily be applied morebroadly. Its ability to integrate multiple sets of diverse datamakes it suitable for other organisms where we may not havethe same type of data available as in yeast. With the increas-ing amount of high throughput protein-protein interactiondata, both from TAP-MS (90) and other assays (30, 32), weshould soon be able to provide a high quality reconstructionof protein complexes in other organisms, including human.
Our work takes a step toward a more hierarchical view ofthe protein-protein interaction network, moving up from indi-vidual proteins to complexes as the basic interacting units.The next level of the hierarchy is the pathways that comprisecellular pathways. Although the notion of a “pathway” is notas well defined, it would nevertheless be very useful to recon-struct pathways that are comprised of interacting complexesand proteins. This type of analysis will give us a unified per-spective on the underlying hierarchical organization of the celland provide significant insight.
Acknowledgment—We thank Maureen Hillenmeyer for useful dis-cussions and for early access to the chemical genomics data.
* This work was supported by the National Science Foundation andthe Defense Advanced Research Projects Agency under the programCognitive Assistant that Learns and Organizes (to H. W., B. K., andD. K.), the Howard Hughes Medical Institute (to S. R. C. and K. M. S.),an Ernst Schering postdoctoral fellowship (to D. F.), and SandlerFamily funding (to N. J. K.).
□S The on-line version of this article (available at http://www.mcponline.org) contains supplemental material.
§ Both authors contributed equally to this work.§§ To whom correspondence may be addressed. Tel.: 415-476-
2980; Fax: 415-514-9736; E-mail: [email protected].¶¶ To whom correspondence may be addressed. Tel.: 650-723-
6598; Fax: 650-725-1449; E-mail: [email protected].
REFERENCES
1. Gavin, A. C., Bosche, M., Krause, R., Grandi, P., Marzioch, M., Bauer, A.,Schultz, J., Rick, J. M., Michon, A. M., Cruciat, C. M., Remor, M., Hofert,C., Schelder, M., Brajenovic, M., Ruffner, H., Merino, A., Klein, K., Hudak,M., Dickson, D., Rudi, T., Gnau, V., Bauch, A., Bastuck, S., Huhse, B.,Leutwein, C., Heurtier, M. A., Copley, R. R., Edelmann, A., Querfurth, E.,Rybin, V., Drewes, G., Raida, M., Bouwmeester, T., Bork, P., Seraphin,
B., Kuster, B., Neubauer, G., and Superti-Furga, G. (2002) Functionalorganization of the yeast proteome by systematic analysis of proteincomplexes. Nature 415, 141–147
2. Ho, Y., Gruhler, A., Heilbut, A., Bader, G. D., Moore, L., Adams, S. L., Millar,A., Taylor, P., Bennett, K., Boutilier, K., Yang, L., Wolting, C., Donaldson,I., Schandorff, S., Shewnarane, J., Vo, M., Taggart, J., Goudreault, M.,Muskat, B., Alfarano, C., Dewar, D., Lin, Z., Michalickova, K., Willems,A. R., Sassi, H., Nielsen, P. A., Rasmussen, K. J., Andersen, J. R.,Johansen, L. E., Hansen, L. H., Jespersen, H., Podtelejnikov, A., Nielsen,E., Crawford, J., Poulsen, V., Sorensen, B. D., Matthiesen, J., Hendrick-son, R. C., Gleeson, F., Pawson, T., Moran, M. F., Durocher, D., Mann,M., Hogue, C. W., Figeys, D., and Tyers, M. (2002) Systematic identifi-cation of protein complexes in Saccharomyces cerevisiae by mass spec-trometry. Nature 415, 180–183
3. Gavin, A. C., Aloy, P., Grandi, P., Krause, R., Boesche, M., Marzioch, M.,Rau, C., Jensen, L. J., Bastuck, S., Dumpelfeld, B., Edelmann, A., Heu-rtier, M. A., Hoffman, V., Hoefert, C., Klein, K., Hudak, M., Michon, A. M.,Schelder, M., Schirle, M., Remor, M., Rudi, T., Hooper, S., Bauer, A.,Bouwmeester, T., Casari, G., Drewes, G., Neubauer, G., Rick, J. M.,Kuster, B., Bork, P., Russell, R. B., and Superti-Furga, G. (2006) Pro-teome survey reveals modularity of the yeast cell machinery. Nature 440,631–636
4. Krogan, N. J., Cagney, G., Yu, H., Zhong, G., Guo, X., Ignatchenko, A., Li,J., Pu, S., Datta, N., Tikuisis, A. P., Punna, T., Peregrin-Alvarez, J. M.,Shales, M., Zhang, X., Davey, M., Robinson, M. D., Paccanaro, A., Bray,J. E., Sheung, A., Beattie, B., Richards, D. P., Canadien, V., Lalev, A.,Mena, F., Wong, P., Starostine, A., Canete, M. M., Vlasblom, J., Wu, S.,Orsi, C., Collins, S. R., Chandran, S., Haw, R., Rilstone, J. J., Gandi, K.,Thompson, N. J., Musso, G., St Onge, P., Ghanny, S., Lam, M. H.,Butland, G., Altaf-Ul, A. M., Kanaya, S., Shilatifard, A., O’Shea, E.,Weissman, J. S., Ingles, C. J., Hughes, T. R., Parkinson, J., Gerstein, M.,Wodak, S. J., Emili, A., and Greenblatt, J. F. (2006) Global landscape ofprotein complexes in the yeast Saccharomyces cerevisiae. Nature 440,637–643
5. Hart, G. T., Lee, I., and Marcotte, E. R. (2007) A high-accuracy consensusmap of yeast protein complexes reveals modular nature of gene essen-tiality. BMC Bioinformatics 8, 236
6. Pu, S., Vlasblom, J., Emili, A., Greenblatt, J., and Wodak, S. J. (2007)Identifying functional modules in the physical interactome of Saccharo-myces cerevisiae. Proteomics 7, 944–960
7. Collins, S. R., Kemmeren, P., Zhao, X. C., Greenblatt, J. F., Spencer, F.,Holstege, F. C., Weissman, J. S., and Krogan, N. J. (2007) Toward acomprehensive atlas of the physical interactome of Saccharomycescerevisiae. Mol. Cell. Proteomics 6, 439–450
8. Mewes, H. W., Frishman, D., Mayer, K. F., Munsterkotter, M., Noubibou, O.,Pagel, P., Rattei, T., Oesterheld, M., Ruepp, A., and Stumpflen, V. (2006)MIPS: analysis and annotation of proteins from whole genomes in 2005.Nucleic Acids Res. 34, D169–D172
9. Enright, A. J., Van Dongen, S., and Ouzounis, C. A. (2002) An efficientalgorithm for large-scale detection of protein families. Nucleic Acids Res.30, 1575–1584
10. Jansen, R., Yu, H., Greenbaum, D., Kluger, Y., Krogan, N. J., Chung, S.,Emili, A., Snyder, M., Greenblatt, J. F., and Gerstein, M. (2003) ABayesian networks approach for predicting protein-protein interactionsfrom genomic data. Science 302, 449–453
11. Zhang, L. V., Wong, S. L., King, O. D., and Roth, F. P. (2004) Predictingco-complexed protein pairs using genomic and proteomic data integra-tion. BMC Bioinformatics 5, 38
12. Qiu, J., and Noble, W. S. (2008) Predicting co-complexed protein pairs fromheterogeneous data. PLoS Comput. Biol. 4, e1000054
13. Chen, J., and Yuan, B. (2006) Detecting functional modules in the yeastprotein-protein interaction network. Bioinformatics 22, 2283–2290
14. Lee, I., Li, Z., and Marcotte, E. M. (2007) An improved, bias-reducedprobabilistic functional gene network of baker’s yeast, Saccharomycescerevisiae. PLoS ONE 2, e988
15. Marcotte, E. M., Pellegrini, M., Thompson, M. J., Yeates, T. O., and Eisen-berg, D. (1999) A combined algorithm for genome-wide prediction ofprotein function. Nature 402, 83–86
16. Schlitt, T., Palin, K., Rung, J., Dietmann, S., Lappe, M., Ukkonen, E., andBrazma, A. (2003) From gene networks to gene function. Genome Res.13, 2568–2576
A Complex-based Reconstruction of S. cerevisiae Interactome
Molecular & Cellular Proteomics 8.6 1379
17. Strong, M., Mallick, P., Pellegrini, M., Thompson, M. J., and Eisenberg, D.(2003) Inference of protein function and protein linkages in Mycobacte-rium tuberculosis based on prokaryotic genome organization: a com-bined computational approach. Genome Biol. 4, R59
18. von Mering, C., Zdobnov, E. M., Tsoka, S., Ciccarelli, F. D., Pereira-Leal,J. B., Ouzounis, C. A., and Bork, P. (2003) Genome evolution revealsbiochemical networks and functional modules. Proc. Natl. Acad. Sci.U. S. A. 100, 15428–15433
19. von Mering, C., Huynen, M., Jaeggi, D., Schmidt, S., Bork, P., and Snel, B.(2003) STRING: a database of predicted functional associations betweenproteins. Nucleic Acids Res. 31, 258–261
20. Yanai, I., and DeLisi, C. (2002) The society of genes: networks of functionallinks between genes from comparative genomics. Genome Biol. 3,research0064
21. Yellaboina, S., Goyal, K., and Mande, S. C. (2007) Inferring genome-widefunctional linkages in E. coli by combining improved genome contextmethods: comparison with high-throughput experimental data. GenomeRes. 17, 527–535
22. Collins, M., Schapire, R., and Singer, Y. (2002) Logistic regression, Ada-Boost and Bregman distances. Mach. Learn. 48, 253–285
23. Eisen, M. B., Spellman, P. T., Brown, P. O., and Botstein, D. (1998) Clusteranalysis and display of genome-wide expression patterns. Proc. Natl.Acad. Sci. U. S. A. 95, 14863–14868
24. Collins, S. R., Miller, K. M., Maas, N. L., Roguev, A., Fillingham, J., Chu,C. S., Schuldiner, M., Gebbia, M., Recht, J., Shales, M., Ding, H., Xu, H.,Han, J., Ingvarsdottir, K., Cheng, B., Andrews, B., Boone, C., Berger,S. L., Hieter, P., Zhang, Z., Brown, G. W., Ingles, C. J., Emili, A., Allis,C. D., Toczyski, D. P., Weissman, J. S., Greenblatt, J. F., and Krogan,N. J. (2007) Functional dissection of protein complexes involved in yeastchromosome biology using a genetic interaction map. Nature 446,806–810
25. Walther, T. C., Brickner, J. H., Aguilar, P. S., Bernales, S., Pantoja, C., andWalter, P. (2006) Eisosomes mark static sites of endocytosis. Nature 439,998–1003
26. Jeong, H., Mason, S. P., Barabasi, A. L., and Oltvai, Z. N. (2001) Lethalityand centrality in protein networks. Nature 411, 41–42
27. Wei, N., and Deng, X. W. (2003) The COP9 signalosome. Annu. Rev. CellDev. Biol. 19, 261–286
28. Liu, Y., Liu, N., and Zhao, H. (2005) Inferring protein-protein interactionsthrough high-throughput interaction data from diverse organisms. Bioin-formatics 21, 3279–3285
29. Bock, J. R., and Gough, D. A. (2001) Predicting protein-protein interactionsfrom primary structure. Bioinformatics 17, 455–460
30. Stelzl, U., Worm, U., Lalowski, M., Haenig, C., Brembeck, F. H., Goehler, H.,Stroedicke, M., Zenkner, M., Schoenherr, A., Koeppen, S., Timm, J.,Mintzlaff, S., Abraham, C., Bock, N., Kietzmann, S., Goedde, A., Toksoz,E., Droege, A., Krobitsch, S., Korn, B., Birchmeier, W., Lehrach, H., andWanker, E. E. (2005) A human protein-protein interaction network: aresource for annotating the proteome. Cell 122, 957–968
31. Cherry, J. M., Adler, C., Ball, C., Chervitz, S. A., Dwight, S. S., Hester, E. T.,Jia, Y., Juvik, G., Roe, T., Schroeder, M., Weng, S., and Botstein, D.(1998) SGD: Saccharomyces Genome Database. Nucleic Acids Res. 26,73–79
32. Peri, S., Navarro, J. D., Amanchy, R., Kristiansen, T. Z., Jonnalagadda,C. K., Surendranath, V., Niranjan, V., Muthusamy, B., Gandhi, T. K.,Gronborg, M., Ibarrola, N., Deshpande, N., Shanker, K., Shivashankar,H. N., Rashmi, B. P., Ramya, M. A., Zhao, Z., Chandrika, K. N., Padma,N., Harsha, H. C., Yatish, A. J., Kavitha, M. P., Menezes, M., Choudhury,D. R., Suresh, S., Ghosh, N., Saravana, R., Chandran, S., Krishna, S.,Joy, M., Anand, S. K., Madavan, V., Joseph, A., Wong, G. W., Schi-emann, W. P., Constantinescu, S. N., Huang, L., Khosravi-Far, R., Steen,H., Tewari, M., Ghaffari, S., Blobe, G. C., Dang, C. V., Garcia, J. G.,Pevsner, J., Jensen, O. N., Roepstorff, P., Deshpande, K. S., Chinnaiyan,A. M., Hamosh, A., Chakravarti, A., and Pandey, A. (2003) Developmentof human protein reference database as an initial platform for approach-ing systems biology in humans. Genome Res. 13, 2363–2371
33. Ashburner, M., Ball, C. A., Blake, J. A., Botstein, D., Butler, H., Cherry, J. M.,Davis, A. P., Dolinski, K., Dwight, S. S., Eppig, J. T., Harris, M. A., Hill,D. P., Issel-Tarver, L., Kasarskis, A., Lewis, S., Matese, J. C., Richardson,J. E., Ringwald, M., Rubin, G. M., and Sherlock, G. (2000) Gene ontology:tool for the unification of biology. The Gene Ontology Consortium. Nat.
Genet. 25, 25–2934. Gollub, J., Ball, C. A., Binkley, G., Demeter, J., Finkelstein, D. B., Hebert,
J. M., Hernandez-Boussard, T., Jin, H., Kaloper, M., Matese, J. C.,Schroeder, M., Brown, P. O., Botstein, D., and Sherlock, G. (2003) TheStanford Microarray Database: data access and quality assessmenttools. Nucleic Acids Res. 31, 94–96
35. Ito, T., Chiba, T., Ozawa, R., Yoshida, M., Hattori, M., and Sakaki, Y. (2001)A comprehensive two-hybrid analysis to explore the yeast protein inter-actome. Proc. Natl. Acad. Sci. U. S. A. 98, 4569–4574
36. Uetz, P., Giot, L., Cagney, G., Mansfield, T. A., Judson, R. S., Knight, J. R.,Lockshon, D., Narayan, V., Srinivasan, M., Pochart, P., Qureshi-Emili, A.,Li, Y., Godwin, B., Conover, D., Kalbfleisch, T., Vijayadamodar, G., Yang,M., Johnston, M., Fields, S., and Rothberg, J. M. (2000) A comprehensiveanalysis of protein-protein interactions in Saccharomyces cerevisiae.Nature 403, 623–627
37. Huh, W. K., Falvo, J. V., Gerke, L. C., Carroll, A. S., Howson, R. W.,Weissman, J. S., and O’Shea, E. K. (2003) Global analysis of proteinlocalization in budding yeast. Nature 425, 686–691
38. Lord, P. W., Stevens, R. D., Brass, A., and Goble, C. A. (2003) Investigatingsemantic similarity measures across the Gene Ontology: the relationshipbetween sequence and annotation. Bioinformatics 19, 1275–1283
39. Xenarios, I., Salwinski, L., Duan, X. Q. J., Higney, P., Kim, S. M., andEisenberg, D. (2002) DIP; the Database of Interacting Proteins: a re-search tool for studying cellular networks of protein interactions. NucleicAcids Res. 30, 303–305
40. Vapnik, V. (1999) The Nature of Statistical Learning Theory, 2nd Ed., Springer-Verlag, New York
41. Freund, Y., and Schapire, R. (1997) A decision-theoretic generalization ofon-line learning and an application to boosting. J. Comput. Syst. Sci. 55,119–139
42. Sokal, R., and Michener, C. (1958) A statistical method for evaluatingsystematic relationships. Univ. Kans. Sci. Bull. 38, 1409–1438
43. Krause, R., von Mering, C., and Bork, P. (2003) A comprehensive set ofprotein complexes in yeast: mining large scale protein-protein interactionscreens. Bioinformatics 19, 1901–1908
44. Ghaemmaghami, S., Huh, W. K., Bower, K., Howson, R. W., Belle, A.,Dephoure, N., O’Shea, E. K., and Weissman, J. S. (2003) Global analysisof protein expression in yeast. Nature 425, 737–741
45. Hillenmeyer, M. E., Fung, E., Wildenhain, J., Pierce, S. E., Hoon, S., Lee, W.,Proctor, M., St Onge, R. P., Tyers, M., Koller, D., Altman, R. B., Davis,R. W., Nislow, C., and Giaever, G. (2008) The chemical genomic portraitof yeast: uncovering a phenotype for all genes. Science 320, 362–365
46. MacIsaac, K. D., Wang, T., Gordon, D. B., Gifford, D. K., Stormo, G. D., andFraenkel, E. (2006) An improved map of conserved regulatory sites forSaccharomyces cerevisiae. BMC Bioinformatics 7, 113
47. Harbison, C. T., Gordon, D. B., Lee, T. I., Rinaldi, N. J., Macisaac, K. D.,Danford, T. W., Hannett, N. M., Tagne, J. B., Reynolds, D. B., Yoo, J.,Jennings, E. G., Zeitlinger, J., Pokholok, D. K., Kellis, M., Rolfe, P. A.,Takusagawa, K. T., Lander, E. S., Gifford, D. K., Fraenkel, E., and Young,R. A. (2004) Transcriptional regulatory code of a eukaryotic genome.Nature 431, 99–104
48. Date, S. V., and Marcotte, E. M. (2003) Discovery of uncharacterized cellularsystems by genome-wide analysis of functional linkages. Nat. Biotech-nol. 21, 1055–1062
49. Wang, H., Segal, E., Ben-Hur, A., Li, Q. R., Vidal, M., and Koller, D. (2007)InSite: a computational method for identifying protein-protein interactionbinding sites on a proteome-wide scale. Genome Biol. 8, R192
50. Zakrzewska, A., Boorsma, A., Brul, S., Hellingwerf, K. J., and Klis, F. M.(2005) Transcriptional response of Saccharomyces cerevisiae to theplasma membrane-perturbing compound chitosan. Eukaryot. Cell 4,703–715
51. Mercier, G., Berthault, N., Touleimat, N., Kepes, F., Fourel, G., Gilson, E.,and Dutreix, M. (2005) A haploid-specific transcriptional response toirradiation in Saccharomyces cerevisiae. Nucleic Acids Res. 33,6635–6643
52. Causton, H. C., Ren, B., Koh, S. S., Harbison, C. T., Kanin, E., Jennings,E. G., Lee, T. I., True, H. L., Lander, E. S., and Young, R. A. (2001)Remodeling of yeast genome expression in response to environmentalchanges. Mol. Biol. Cell 12, 323–337
53. Lai, L. C., Kosorukoff, A. L., Burke, P. V., and Kwast, K. E. (2005) Dynamicalremodeling of the transcriptome during short-term anaerobiosis in Sac-
A Complex-based Reconstruction of S. cerevisiae Interactome
1380 Molecular & Cellular Proteomics 8.6
charomyces cerevisiae: differential response and role of Msn2 and/orMsn4 and other factors in galactose and glucose media. Mol. Cell. Biol.25, 4075–4091
54. O’Rourke, S. M., and Herskowitz, I. (2002) A third osmosensing branch inSaccharomyces cerevisiae requires the Msb2 protein and functions inparallel with the Sho1 branch. Mol. Cell. Biol. 22, 4739–4749
55. Gasch, A. P., Spellman, P. T., Kao, C. M., Carmel-Harel, O., Eisen, M. B.,Storz, G., Botstein, D., and Brown, P. O. (2000) Genomic expressionprograms in the response of yeast cells to environmental changes. Mol.Biol. Cell 11, 4241–4257
56. Gasch, A. P., Huang, M., Metzner, S., Botstein, D., Elledge, S. J., andBrown, P. O. (2001) Genomic expression responses to DNA-damagingagents and the regulatory role of the yeast ATR homolog Mec1p. Mol.Biol. Cell 12, 2987–3003
57. DeRisi, J. L., Iyer, V. R., and Brown, P. O. (1997) Exploring the metabolicand genetic control of gene expression on a genomic scale. Science 278,680–686
58. Kitagawa, E., Akama, K., and Iwahashi, H. (2005) Effects of iodine on globalgene expression in Saccharomyces cerevisiae. Biosci. Biotechnol. Bio-chem. 69, 2285–2293
59. Shevchenko, A., Wilm, M., Vorm, O., and Mann, M. (1996) Mass spectro-metric sequencing of proteins silver-stained polyacrylamide gels. Anal.Chem. 68, 850–858
60. Collins, S. R., Schuldiner, M., Krogan, N. J., and Weissman, J. S. (2006) Astrategy for extracting and analyzing large-scale quantitative epistaticinteraction data. Genome Biol. 7, R63
61. Schuldiner, M., Collins, S. R., Thompson, N. J., Denic, V., Bhamidipati, A.,Punna, T., Ihmels, J., Andrews, B., Boone, C., Greenblatt, J. F., Weiss-man, J. S., and Krogan, N. J. (2005) Exploration of the function andorganization of the yeast early secretory pathway through an epistaticminiarray profile. Cell 123, 507–519
62. Bader, G. D., and Hogue, C. W. (2003) An automated method for findingmolecular complexes in large protein interaction networks. BMC Bioin-formatics 4, 2
63. Kim, M., Krogan, N. J., Vasiljeva, L., Rando, O. J., Nedea, E., Greenblatt,J. F., and Buratowski, S. (2004) The yeast Rat1 exonuclease promotestranscription termination by RNA polymerase II. Nature 432, 517–522
64. Maytal-Kivity, V., Piran, R., Pick, E., Hofmann, K., and Glickman, M. H.(2002) COP9 signalosome components play a role in the mating phero-mone response of S. cerevisiae. EMBO Rep. 3, 1215–1221
65. van Hoof, A., Staples, R. R., Baker, R. E., and Parker, R. (2000) Function ofthe ski4p (Csl4p) and Ski7p proteins in 3�-to-5� degradation of mRNA.Mol. Cell. Biol. 20, 8230–8243
66. Luke, M. M., Della Seta, F., Di Como, C. J., Sugimoto, H., Kobayashi, R.,and Arndt, K. T. (1996) The SAP, a new family of proteins, associate andfunction positively with the SIT4 phosphatase. Mol. Cell. Biol. 16,2744–2755
67. Denic, V., Quan, E. M., and Weissman, J. S. (2006) A luminal surveillancecomplex that selects misfolded glycoproteins for ER-associated degra-dation. Cell 126, 349–359
68. Carvalho, P., Goder, V., and Rapoport, T. A. (2006) Distinct ubiquitin-ligasecomplexes define convergent pathways for the degradation of ER pro-teins. Cell 126, 361–373
69. Dragon, F., Gallagher, J. E., Compagnone-Post, P. A., Mitchell, B. M.,Porwancher, K. A., Wehner, K. A., Wormsley, S., Settlage, R. E., Sha-banowitz, J., Osheim, Y., Beyer, A. L., Hunt, D. F., and Baserga, S. J.(2002) A large nucleolar U3 ribonucleoprotein required for 18S ribosomalRNA biogenesis. Nature 417, 967–970
70. Alic, N., Higgins, V. J., and Dawes, I. W. (2001) Identification of a Saccha-romyces cerevisiae gene that is required for G1 arrest in response to thelipid oxidation product linoleic acid hydroperoxide. Mol. Biol. Cell 12,1801–1810
71. Fiedler, D., Braberg, H., Mehta, M., Chechik, G., Cagney, G., Mukherjee, P.,Silva, A. C., Shales, M., Collins, S. R., van Wageningen, S., Kemmeren,P., Holstege, F. C. P., Weissman, J. S., Christopher-Keogh, M., Koller,D., Shokat, K. M., and Krogan, N. J. (2009) Functional organization of theS. cerevisiae phosphorylation network. Cell 136, 952–963
72. Jorgensen, P., Rupes, I., Sharom, J. R., Schneper, L., Broach, J. R., andTyers, M. (2004) A dynamic transcriptional network communicatesgrowth potential to ribosome synthesis and critical cell size. Genes Dev.18, 2491–2505
73. Urban, J., Soulard, A., Huber, A., Lippman, S., Mukhopadhyay, D., Deloche,O., Wanke, V., Anrather, D., Ammerer, G., Riezman, H., Broach, J. R., DeVirgilio, C., Hall, M. N., and Loewith, R. (2007) Sch9 is a major target ofTORC1 in Saccharomyces cerevisiae. Mol. Cell 26, 663–674
74. Garcia-Barrio, M., Dong, J., Ufano, S., and Hinnebusch, A. G. (2000)Association of GCN1-GCN20 regulatory complex with the N-terminus ofeIF2alpha kinase GCN2 is required for GCN2 activation. EMBO J. 19,1887–1899
75. Powell, D. W., Weaver, C. M., Jennings, J. L., McAfee, K. J., He, Y., Weil,P. A., and Link, A. J. (2004) Cluster analysis of mass spectrometry datareveals a novel component of SAGA. Mol. Cell. Biol. 24, 7249–7259
76. Ingvarsdottir, K., Krogan, N. J., Emre, N. C., Wyce, A., Thompson, N. J.,Emili, A., Hughes, T. R., Greenblatt, J. F., and Berger, S. L. (2005) H2Bubiquitin protease Ubp8 and Sgf11 constitute a discrete functional mod-ule within the Saccharomyces cerevisiae SAGA complex. Mol. Cell. Biol.25, 1162–1172
77. Lee, K. K., Florens, L., Swanson, S. K., Washburn, M. P., and Workman,J. L. (2005) The deubiquitylation activity of Ubp8 is dependent uponSgf11 and its association with the SAGA complex. Mol. Cell. Biol. 25,1173–1182
78. Caruthers, J. M., and McKay, D. B. (2002) Helicase structure and mecha-nism. Curr. Opin. Struct. Biol. 12, 123–133
79. Fazi, B., Cope, M., Douangamath, A., Ferracuti, S., Schirwitz, K., Zucconi,A., Drubin, D., Wilmanns, M., Cesareni, G., and Castagnoli, L. (2002)Unusual binding properties of the SH3 domain of the yeast actin-bindingprotein Abp1: structural and functional analysis. J. Biol. Chem. 277,5290–5298
80. Collins, K. A., Furuyama, S., and Biggins, S. (2004) Proteolysis contributesto the exclusive centromere localization of the yeast Cse4/CENP-A his-tone H3 variant. Curr. Biol. 14, 1968–1972
81. Bialkowska, A., and Kurlandzka, A. (2002) Proteins interacting with Lin 1p,a putative link between chromosome segregation, mRNA splicing andDNA replication in Saccharomyces cerevisiae. Yeast 19, 1323–1333
82. Shi, X., Kachirskaia, I., Walter, K. L., Kuo, J. H., Lake, A., Davrazou, F.,Chan, S. M., Martin, D. G., Fingerman, I. M., Briggs, S. D., Howe, L., Utz,P. J., Kutateladze, T. G., Lugovskoy, A. A., Bedford, M. T., and Gozani,O. (2007) Proteome-wide analysis in Saccharomyces cerevisiae identi-fies several PHD fingers as novel direct and selective binding modules ofhistone H3 methylated at either lysine 4 or lysine 36. J. Biol. Chem. 282,2450–2455
83. Lottersberger, F., Panza, A., Lucchini, G., and Longhese, M. P. (2007)Functional and physical interactions between yeast 14-3-3 proteins,acetyltransferases, and deacetylases in response to DNA replicationperturbations. Mol. Cell. Biol. 27, 3266–3281
84. Han, J. D., Bertin, N., Hao, T., Goldberg, D. S., Berriz, G. F., Zhang, L. V.,Dupuy, D., Walhout, A. J., Cusick, M. E., Roth, F. P., and Vidal, M. (2004)Evidence for dynamically organized modularity in the yeast protein-protein interaction network. Nature 430, 88–93
85. He, X., and Zhang, J. (2006) Why do hubs tend to be essential in proteinnetworks? PLoS Genet. 2, e88
86. Zotenko, E., Mestre, J., O’Leary, D. P., and Przytycka, T. M. (2008) Why dohubs in the yeast protein interaction network tend to be essential: reex-amining the connection between the network topology and essentiality.PLoS Comput. Biol. 4, e1000140
87. Brohee, S., and van Helden, J. (2006) Evaluation of clustering algorithms forprotein-protein interaction networks. BMC Bioinformatics 7, 488
88. Palla, G., Derenyi, I., Farkas, I., and Vicsek, T. (2005) Uncovering theoverlapping community structure of complex networks in nature andsociety. Nature 435, 814–818
89. Yu, H., Paccanaro, A., Trifonov, V., and Gerstein, M. (2006) Predictinginteractions in protein networks by completing defective cliques. Bioin-formatics 22, 823–829
90. Ewing, R. M., Chu, P., Elisma, F., Li, H., Taylor, P., Climie, S., McBroom-Cerajewski, L., Robinson, M. D., O’Connor, L., Li, M., Taylor, R., Dharsee,M., Ho, Y., Heilbut, A., Moore, L., Zhang, S., Ornatsky, O., Bukhman,Y. V., Ethier, M., Sheng, Y., Vasilescu, J., Abu-Farha, M., Lambert, J. P.,Duewel, H. S., Stewart, I. I., Kuehl, B., Hogue, K., Colwill, K., Gladwish,K., Muskat, B., Kinach, R., Adams, S. L., Moran, M. F., Morin, G. B.,Topaloglou, T., and Figeys, D. (2007) Large-scale mapping of humanprotein-protein interactions by mass spectrometry. Mol. Syst. Biol. 3, 89
A Complex-based Reconstruction of S. cerevisiae Interactome
Molecular & Cellular Proteomics 8.6 1381

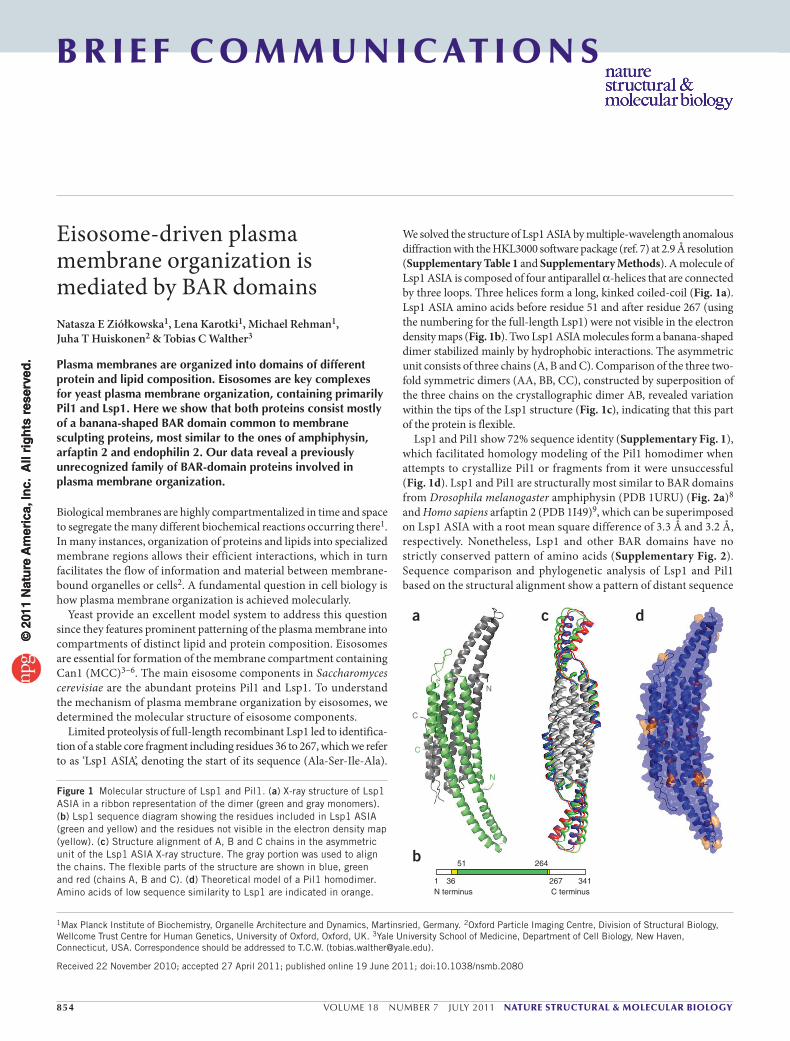
854 VOLUME 18 NUMBER 7 JULY 2011 nature structural & molecular biology
b r i e F co m m u n i c at i o n s
Eisosome-driven plasma membrane organization is mediated by BAR domainsNatasza E Ziółkowska1, Lena Karotki1, Michael Rehman1, Juha T Huiskonen2 & Tobias C Walther3
Plasmamembranesareorganizedintodomainsofdifferentproteinandlipidcomposition.Eisosomesarekeycomplexesforyeastplasmamembraneorganization,containingprimarilyPil1andLsp1.Hereweshowthatbothproteinsconsistmostlyofabanana-shapedBARdomaincommontomembranesculptingproteins,mostsimilartotheonesofamphiphysin,arfaptin2andendophilin2.OurdatarevealapreviouslyunrecognizedfamilyofBAR-domainproteinsinvolvedinplasmamembraneorganization.
Biological membranes are highly compartmentalized in time and space to segregate the many different biochemical reactions occurring there1. In many instances, organization of proteins and lipids into specialized membrane regions allows their efficient interactions, which in turn facilitates the flow of information and material between membrane-bound organelles or cells2. A fundamental question in cell biology is how plasma membrane organization is achieved molecularly.
Yeast provide an excellent model system to address this question since they features prominent patterning of the plasma membrane into compartments of distinct lipid and protein composition. Eisosomes are essential for formation of the membrane compartment containing Can1 (MCC)3–6. The main eisosome components in Saccharomyces cerevisiae are the abundant proteins Pil1 and Lsp1. To understand the mechanism of plasma membrane organization by eisosomes, we determined the molecular structure of eisosome components.
Limited proteolysis of full-length recombinant Lsp1 led to identifica-tion of a stable core fragment including residues 36 to 267, which we refer to as ‘Lsp1 ASIA’, denoting the start of its sequence (Ala-Ser-Ile-Ala).
We solved the structure of Lsp1 ASIA by multiple-wavelength anomalous diffraction with the HKL3000 software package (ref. 7) at 2.9 Å resolution (Supplementary Table 1 and Supplementary Methods). A molecule of Lsp1 ASIA is composed of four antiparallel α-helices that are connected by three loops. Three helices form a long, kinked coiled-coil (Fig. 1a). Lsp1 ASIA amino acids before residue 51 and after residue 267 (using the numbering for the full-length Lsp1) were not visible in the electron density maps (Fig. 1b). Two Lsp1 ASIA molecules form a banana-shaped dimer stabilized mainly by hydrophobic interactions. The asymmetric unit consists of three chains (A, B and C). Comparison of the three two-fold symmetric dimers (AA, BB, CC), constructed by superposition of the three chains on the crystallographic dimer AB, revealed variation within the tips of the Lsp1 structure (Fig. 1c), indicating that this part of the protein is flexible.
Lsp1 and Pil1 show 72% sequence identity (Supplementary Fig. 1), which facilitated homology modeling of the Pil1 homodimer when attempts to crystallize Pil1 or fragments from it were unsuccessful (Fig. 1d). Lsp1 and Pil1 are structurally most similar to BAR domains from Drosophila melanogaster amphiphysin (PDB 1URU) (Fig. 2a)8 and Homo sapiens arfaptin 2 (PDB 1I49)9, which can be superimposed on Lsp1 ASIA with a root mean square difference of 3.3 Å and 3.2 Å, respectively. Nonetheless, Lsp1 and other BAR domains have no strictly conserved pattern of amino acids (Supplementary Fig. 2). Sequence comparison and phylogenetic analysis of Lsp1 and Pil1 based on the structural alignment show a pattern of distant sequence
1Max Planck Institute of Biochemistry, Organelle Architecture and Dynamics, Martinsried, Germany. 2Oxford Particle Imaging Centre, Division of Structural Biology, Wellcome Trust Centre for Human Genetics, University of Oxford, Oxford, UK. 3Yale University School of Medicine, Department of Cell Biology, New Haven, Connecticut, USA. Correspondence should be addressed to T.C.W. ([email protected]).
Received 22 November 2010; accepted 27 April 2011; published online 19 June 2011; doi:10.1038/nsmb.2080
N
N
C
C
a
b
c d
51 264
267C terminus
341361N terminus
Figure 1 Molecular structure of Lsp1 and Pil1. (a) X-ray structure of Lsp1 ASIA in a ribbon representation of the dimer (green and gray monomers). (b) Lsp1 sequence diagram showing the residues included in Lsp1 ASIA (green and yellow) and the residues not visible in the electron density map (yellow). (c) Structure alignment of A, B and C chains in the asymmetric unit of the Lsp1 ASIA X-ray structure. The gray portion was used to align the chains. The flexible parts of the structure are shown in blue, green and red (chains A, B and C). (d) Theoretical model of a Pil1 homodimer. Amino acids of low sequence similarity to Lsp1 are indicated in orange.
© 2
011
Nat
ure
Am
eric
a, In
c. A
ll ri
gh
ts r
eser
ved
.©
201
1 N
atu
re A
mer
ica,
Inc.
All
rig
hts
res
erve
d.
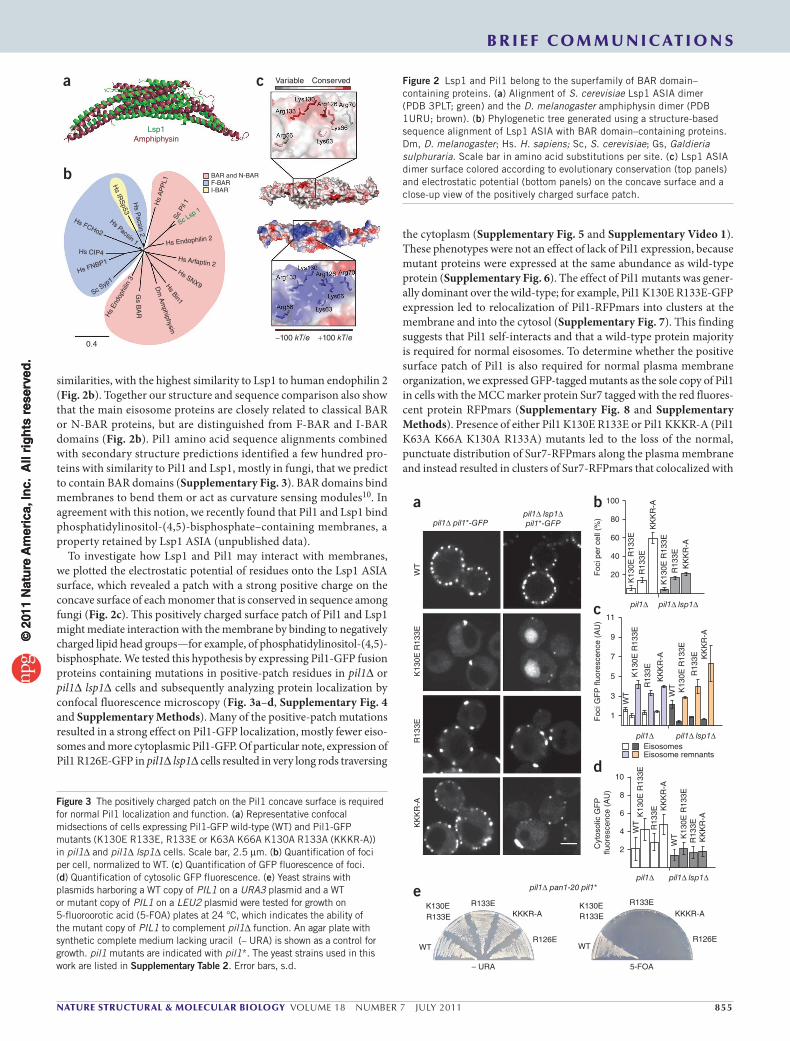
nature structural & molecular biology VOLUME 18 NUMBER 7 JULY 2011 855
b r i e F com m u n i c at i o n s
similarities, with the highest similarity to Lsp1 to human endophilin 2 (Fig. 2b). Together our structure and sequence comparison also show that the main eisosome proteins are closely related to classical BAR or N-BAR proteins, but are distinguished from F-BAR and I-BAR domains (Fig. 2b). Pil1 amino acid sequence alignments combined with secondary structure predictions identified a few hundred pro-teins with similarity to Pil1 and Lsp1, mostly in fungi, that we predict to contain BAR domains (Supplementary Fig. 3). BAR domains bind membranes to bend them or act as curvature sensing modules10. In agreement with this notion, we recently found that Pil1 and Lsp1 bind phosphatidylinositol-(4,5)-bisphosphate–containing membranes, a property retained by Lsp1 ASIA (unpublished data).
To investigate how Lsp1 and Pil1 may interact with membranes, we plotted the electrostatic potential of residues onto the Lsp1 ASIA surface, which revealed a patch with a strong positive charge on the concave surface of each monomer that is conserved in sequence among fungi (Fig. 2c). This positively charged surface patch of Pil1 and Lsp1 might mediate interaction with the membrane by binding to negatively charged lipid head groups—for example, of phosphatidylinositol-(4,5)-bisphosphate. We tested this hypothesis by expressing Pil1-GFP fusion proteins containing mutations in positive-patch residues in pil1∆ or pil1∆ lsp1∆ cells and subsequently analyzing protein localization by confocal fluorescence microscopy (Fig. 3a–d, Supplementary Fig. 4 and Supplementary Methods). Many of the positive-patch mutations resulted in a strong effect on Pil1-GFP localization, mostly fewer eiso-somes and more cytoplasmic Pil1-GFP. Of particular note, expression of Pil1 R126E-GFP in pil1∆ lsp1∆ cells resulted in very long rods traversing
the cytoplasm (Supplementary Fig. 5 and Supplementary Video 1). These phenotypes were not an effect of lack of Pil1 expression, because mutant proteins were expressed at the same abundance as wild-type protein (Supplementary Fig. 6). The effect of Pil1 mutants was gener-ally dominant over the wild-type; for example, Pil1 K130E R133E-GFP expression led to relocalization of Pil1-RFPmars into clusters at the membrane and into the cytosol (Supplementary Fig. 7). This finding suggests that Pil1 self-interacts and that a wild-type protein majority is required for normal eisosomes. To determine whether the positive surface patch of Pil1 is also required for normal plasma membrane organization, we expressed GFP-tagged mutants as the sole copy of Pil1 in cells with the MCC marker protein Sur7 tagged with the red fluores-cent protein RFPmars (Supplementary Fig. 8 and Supplementary Methods). Presence of either Pil1 K130E R133E or Pil1 KKKR-A (Pil1 K63A K66A K130A R133A) mutants led to the loss of the normal, punctuate distribution of Sur7-RFPmars along the plasma membrane and instead resulted in clusters of Sur7-RFPmars that colocalized with
Sc P
il 1Hs
AP
PL1
Hs P
acsin 2
Hs IR
Sp53
Hs Pacsin 1
Hs FCHo2
Hs CIP4
Hs FNBP1
Sc Syp
1
Sc Lsp
1
Hs Endophilin 2
Hs Arfaptin 2Hs SNX9Hs Bin1
Gs B
AR
Hs
Endo
philin
3
Dm
Am
phiphysin
0.4
BAR and N-BARF-BARI-BAR
Lsp1Amphiphysin
Variable Conserved
−100 kT/e +100 kT/e
a c
b
Figure 2 Lsp1 and Pil1 belong to the superfamily of BAR domain–containing proteins. (a) Alignment of S. cerevisiae Lsp1 ASIA dimer (PDB 3PLT; green) and the D. melanogaster amphiphysin dimer (PDB 1URU; brown). (b) Phylogenetic tree generated using a structure-based sequence alignment of Lsp1 ASIA with BAR domain–containing proteins. Dm, D. melanogaster; Hs. H. sapiens; Sc, S. cerevisiae; Gs, Galdieria sulphuraria. Scale bar in amino acid substitutions per site. (c) Lsp1 ASIA dimer surface colored according to evolutionary conservation (top panels) and electrostatic potential (bottom panels) on the concave surface and a close-up view of the positively charged surface patch.
a
R133EK130E K130E R133E
5-FOA
KKKR-A
R126E
R133E
WT
R133E
WT
– URA
R126E
KKKR-A
pil1∆ pan1-20 pil1*e
pil1∆ pil1*-GFP
WT
K13
0E R
133E
R13
3EK
KK
R-A
pil1∆ lsp1∆pil1*-GFP
b
Foc
i per
cel
l (%
)
100
K13
0E R
133E
K13
0E R
133E
KK
KR
-A
KK
KR
-A
R13
3E
R13
3E
pil1∆ pil1∆ lsp1∆
80
60
40
20
d
Cyt
osol
ic G
FP
�u
ores
cenc
e (A
U)
K13
0E R
133E
WT
KK
KR
-AR
133E
K13
0E R
133E
WT KK
KR
-AR
133E
pil1∆ pil1∆ lsp1∆
10
8
6
4
2
cF
oci G
FP
�uo
resc
ence
(A
U)
K13
0E R
133E
WT
KK
KR
-A
R13
3E
EisosomesEisosome remnants
K13
0E R
133E
WT
KK
KR
-AR
133E
pil1∆ pil1∆ lsp1∆
11
9
7
5
3
1
Figure 3 The positively charged patch on the Pil1 concave surface is required for normal Pil1 localization and function. (a) Representative confocal midsections of cells expressing Pil1-GFP wild-type (WT) and Pil1-GFP mutants (K130E R133E, R133E or K63A K66A K130A R133A (KKKR-A)) in pil1∆ and pil1∆ lsp1∆ cells. Scale bar, 2.5 µm. (b) Quantification of foci per cell, normalized to WT. (c) Quantification of GFP fluorescence of foci. (d) Quantification of cytosolic GFP fluorescence. (e) Yeast strains with plasmids harboring a WT copy of PIL1 on a URA3 plasmid and a WT or mutant copy of PIL1 on a LEU2 plasmid were tested for growth on 5-fluoroorotic acid (5-FOA) plates at 24 °C, which indicates the ability of the mutant copy of PIL1 to complement pil1∆ function. An agar plate with synthetic complete medium lacking uracil (– URA) is shown as a control for growth. pil1 mutants are indicated with pil1*. The yeast strains used in this work are listed in Supplementary Table 2. Error bars, s.d.
© 2
011
Nat
ure
Am
eric
a, In
c. A
ll ri
gh
ts r
eser
ved
.©
201
1 N
atu
re A
mer
ica,
Inc.
All
rig
hts
res
erve
d.
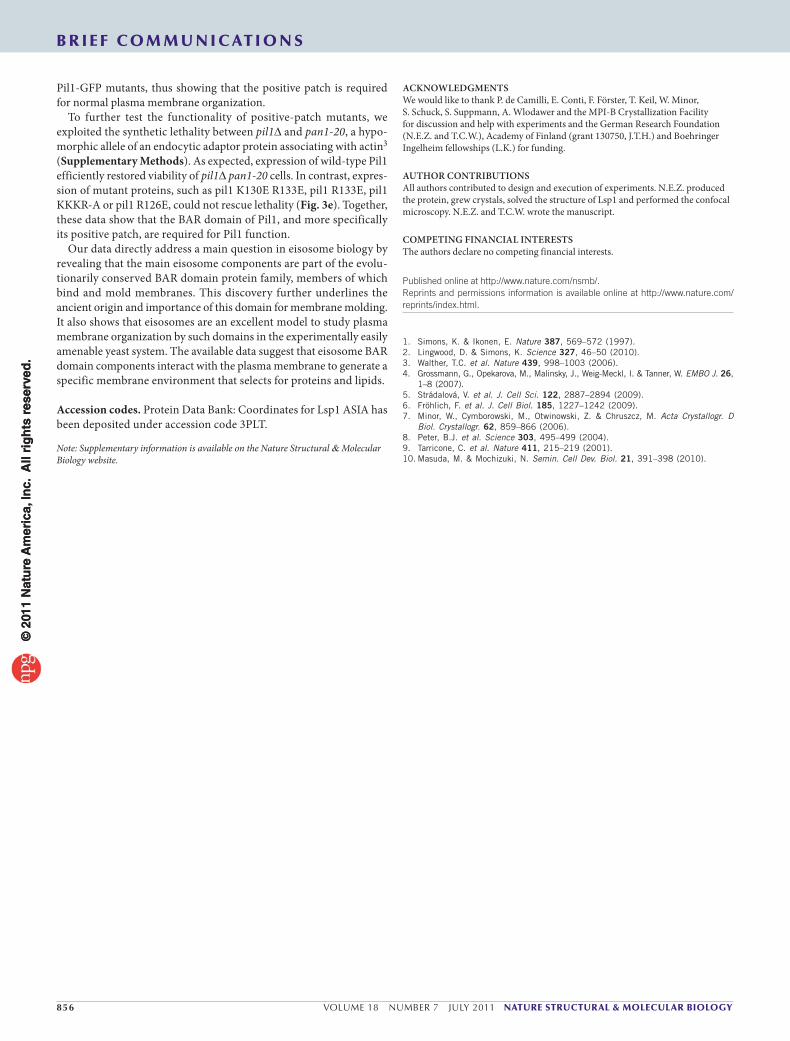
856 VOLUME 18 NUMBER 7 JULY 2011 nature structural & molecular biology
Pil1-GFP mutants, thus showing that the positive patch is required for normal plasma membrane organization.
To further test the functionality of positive-patch mutants, we exploited the synthetic lethality between pil1∆ and pan1-20, a hypo-morphic allele of an endocytic adaptor protein associating with actin3 (Supplementary Methods). As expected, expression of wild-type Pil1 efficiently restored viability of pil1∆ pan1-20 cells. In contrast, expres-sion of mutant proteins, such as pil1 K130E R133E, pil1 R133E, pil1 KKKR-A or pil1 R126E, could not rescue lethality (Fig. 3e). Together, these data show that the BAR domain of Pil1, and more specifically its positive patch, are required for Pil1 function.
Our data directly address a main question in eisosome biology by revealing that the main eisosome components are part of the evolu-tionarily conserved BAR domain protein family, members of which bind and mold membranes. This discovery further underlines the ancient origin and importance of this domain for membrane molding. It also shows that eisosomes are an excellent model to study plasma membrane organization by such domains in the experimentally easily amenable yeast system. The available data suggest that eisosome BAR domain components interact with the plasma membrane to generate a specific membrane environment that selects for proteins and lipids.
Accession codes. Protein Data Bank: Coordinates for Lsp1 ASIA has been deposited under accession code 3PLT.
Note: Supplementary information is available on the Nature Structural & Molecular Biology website.
ACKNoWLEdgMENTsWe would like to thank P. de Camilli, E. Conti, F. Förster, T. Keil, W. Minor, S. Schuck, S. Suppmann, A. Wlodawer and the MPI-B Crystallization Facility for discussion and help with experiments and the German Research Foundation (N.E.Z. and T.C.W.), Academy of Finland (grant 130750, J.T.H.) and Boehringer Ingelheim fellowships (L.K.) for funding.
AUTHoR CoNTRIBUTIoNsAll authors contributed to design and execution of experiments. N.E.Z. produced the protein, grew crystals, solved the structure of Lsp1 and performed the confocal microscopy. N.E.Z. and T.C.W. wrote the manuscript.
CoMPETINg FINANCIAL INTEREsTsThe authors declare no competing financial interests.
Published online at http://www.nature.com/nsmb/. Reprints and permissions information is available online at http://www.nature.com/reprints/index.html.
1. Simons, K. & Ikonen, E. Nature 387, 569–572 (1997).2. Lingwood, D. & Simons, K. Science 327, 46–50 (2010).3. Walther, T.C. et al. Nature 439, 998–1003 (2006).4. Grossmann, G., Opekarova, M., Malinsky, J., Weig-Meckl, I. & Tanner, W. EMBO J. 26,
1–8 (2007).5. Strádalová, V. et al. J. Cell Sci. 122, 2887–2894 (2009).6. Fröhlich, F. et al. J. Cell Biol. 185, 1227–1242 (2009).7. Minor, W., Cymborowski, M., Otwinowski, Z. & Chruszcz, M. Acta Crystallogr. D
Biol. Crystallogr. 62, 859–866 (2006).8. Peter, B.J. et al. Science 303, 495–499 (2004).9. Tarricone, C. et al. Nature 411, 215–219 (2001).10. Masuda, M. & Mochizuki, N. Semin. Cell Dev. Biol. 21, 391–398 (2010).
b r i e F com m u n i c at i o n s©
201
1 N
atu
re A
mer
ica,
Inc.
All
rig
hts
res
erve
d.
© 2
011
Nat
ure
Am
eric
a, In
c. A
ll ri
gh
ts r
eser
ved
.
Online Supplemental Material
Eisosome-driven plasma membrane organization is mediated by
BAR domains
Natasza E. Ziółkowska, Lena Karotki, Michael Rehman, Juha T. Huiskonen
and Tobias C. Walther
Nature Structural & Molecular Biology: doi:10.1038/nsmb.2080
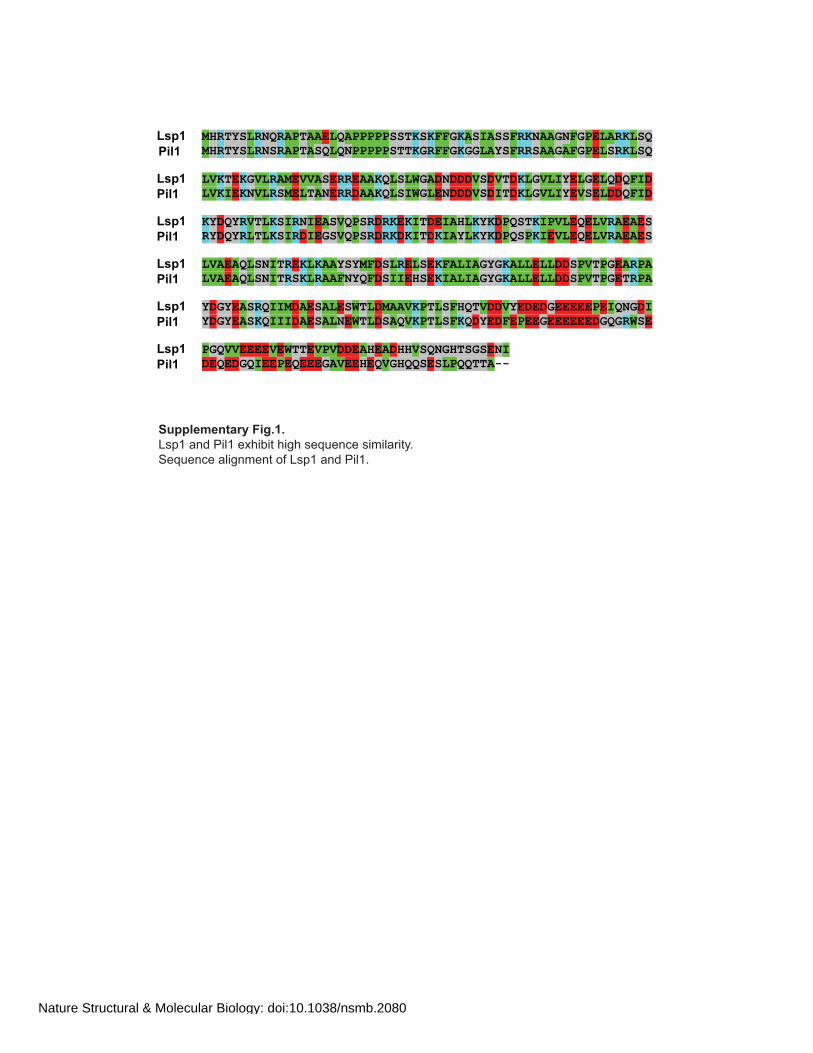
Supplementary Fig.1.
Lsp1 and Pil1 exhibit high sequence similarity.
Sequence alignment of Lsp1 and Pil1.
Lsp1 MHRTYSLRNQRAPTAAELQAPPPPPSSTKSKFFGKASIASSFRKNAAGNFGPELARKLSQ
Pil1 MHRTYSLRNSRAPTASQLQNPPPPPSTTKGRFFGKGGLAYSFRRSAAGAFGPELSRKLSQ
Lsp1 LVKTEKGVLRAMEVVASERREAAKQLSLWGADNDDDVSDVTDKLGVLIYELGELQDQFID
Pil1 LVKIEKNVLRSMELTANERRDAAKQLSIWGLENDDDVSDITDKLGVLIYEVSELDDQFID
Lsp1 KYDQYRVTLKSIRNIEASVQPSRDRKEKITDEIAHLKYKDPQSTKIPVLEQELVRAEAES
Pil1 RYDQYRLTLKSIRDIEGSVQPSRDRKDKITDKIAYLKYKDPQSPKIEVLEQELVRAEAES
Lsp1 LVAEAQLSNITREKLKAAYSYMFDSLRELSEKFALIAGYGKALLELLDDSPVTPGEARPA
Pil1 LVAEAQLSNITRSKLRAAFNYQFDSIIEHSEKIALIAGYGKALLELLDDSPVTPGETRPA
Lsp1 YDGYEASRQIIMDAESALESWTLDMAAVKPTLSFHQTVDDVYEDEDGEEEEEPEIQNGDI
Pil1 YDGYEASKQIIIDAESALNEWTLDSAQVKPTLSFKQDYEDFEPEEGEEEEEEDGQGRWSE
Lsp1 PGQVVEEEEVEWTTEVPVDDEAHEADHHVSQNGHTSGSENI
Pil1 DEQEDGQIEEPEQEEEGAVEEHEQVGHQQSESLPQQTTA--
Nature Structural & Molecular Biology: doi:10.1038/nsmb.2080
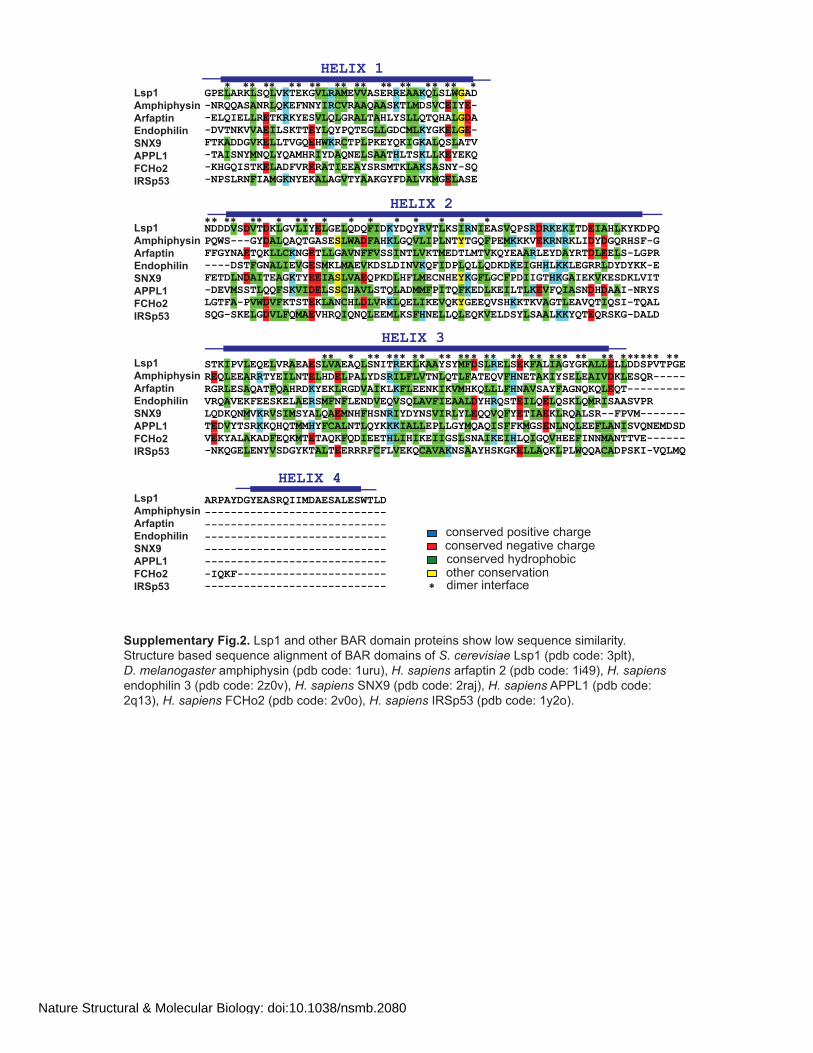
Supplementary Fig.2. Lsp1 and other BAR domain proteins show low sequence similarity.
Structure based sequence alignment of BAR domains of S. cerevisiae Lsp1 (pdb code: 3plt),
D. melanogaster amphiphysin (pdb code: 1uru), H. sapiens arfaptin 2 (pdb code: 1i49), H. sapiens
endophilin 3 (pdb code: 2z0v), H. sapiens SNX9 (pdb code: 2raj), H. sapiens APPL1 (pdb code:
2q13), H. sapiens FCHo2 (pdb code: 2v0o), H. sapiens IRSp53 (pdb code: 1y2o).
conserved negative chargeconserved hydrophobicother conservation
conserved positive charge
HELIX 4
HELIX 3
HELIX 2
HELIX 1
GPELARKLSQLVKTEKGVLRAMEVVASERREAAKQLSLWGAD
-NRQQASANRLQKEFNNYIRCVRAAQAASKTLMDSVCEIYE-
-ELQIELLRETKRKYESVLQLGRALTAHLYSLLQTQHALGDA
-DVTNKVVAEILSKTTEYLQYPQTEGLLGDCMLKYGKELGE-
FTKADDGVKELLTVGQEHWKRCTPLPKEYQKIGKALQSLATV
-TAISNYMNQLYQAMHRIYDAQNELSAATHLTSKLLKEYEKQ
-KHGQISTKELADFVRERATIEEAYSRSMTKLAKSASNY-SQ
-NPSLRNFIAMGKNYEKALAGVTYAAKGYFDALVKMGELASE
NDDDVSDVTDKLGVLIYELGELQDQFIDKYDQYRVTLKSIRNIEASVQPSRDRKEKITDEIAHLKYKDPQ
PQWS---GYDALQAQTGASESLWADFAHKLGQVLIPLNTYTGQFPEMKKKVEKRNRKLIDYDGQRHSF-G
FFGYNAETQKLLCKNGETLLGAVNFFVSSINTLVKTMEDTLMTVKQYEAARLEYDAYRTDLEELS-LGPR
----DSTFGNALIEVGESMKLMAEVKDSLDINVKQFIDPLQLLQDKDKEIGHHLKKLEGRRLDYDYKK-E
FETDLNDAITEAGKTYEEIASLVAEQPKDLHFLMECNHEYKGFLGCFPDIIGTHKGAIEKVKESDKLVIT
-DEVMSSTLQQFSKVIDELSSCHAVLSTQLADMMFPITQFKEDLKEILTLKEVFQIASNDHDAAI-NRYS
LGTFA-PVWDVFKTSTEKLANCHLDLVRKLQELIKEVQKYGEEQVSHKKTKVAGTLEAVQTIQSI-TQAL
SQG-SKELGDVLFQMAEVHRQIQNQLEEMLKSFHNELLQLEQKVELDSYLSAALKKYQTEQRSKG-DALD
STKIPVLEQELVRAEAESLVAEAQLSNITREKLKAAYSYMFDSLRELSEKFALIAGYGKALLELLDDSPVTPGE
REQLEEARRTYEILNTELHDELPALYDSRILFLVTNLQTLFATEQVFHNETAKIYSELEAIVDKLESQR-----
RGRLESAQATFQAHRDKYEKLRGDVAIKLKFLEENKIKVMHKQLLLFHNAVSAYFAGNQKQLEQT---------
VRQAVEKFEESKELAERSMFNFLENDVEQVSQLAVFIEAALDYHRQSTEILQELQSKLQMRISAASVPR
LQDKQNMVKRVSIMSYALQAEMNHFHSNRIYDYNSVIRLYLEQQVQFYETIAEKLRQALSR--FPVM-------
TEDVYTSRKKQHQTMMHYFCALNTLQYKKKIALLEPLLGYMQAQISFFKMGSENLNQLEEFLANISVQNEMDSD
VEKYALAKADFEQKMTETAQKFQDIEETHLIHIKEIIGSLSNAIKEIHLQIGQVHEEFINNMANTTVE------
-NKQGELENYVSDGYKTALTEERRRFCFLVEKQCAVAKNSAAYHSKGKELLAQKLPLWQQACADPSKI-VQLMQ
ARPAYDGYEASRQIIMDAESALESWTLD
----------------------------
----------------------------
----------------------------
----------------------------
----------------------------
-IQKF-----------------------
----------------------------
Lsp1
Amphiphysin
Arfaptin
Endophilin
SNX9
APPL1
FCHo2
IRSp53
Lsp1
Amphiphysin
Arfaptin
Endophilin
SNX9
APPL1
FCHo2
IRSp53
Lsp1
Amphiphysin
Arfaptin
Endophilin
SNX9
APPL1
FCHo2
IRSp53
Lsp1
Amphiphysin
Arfaptin
Endophilin
SNX9
APPL1
FCHo2
IRSp53
** * * * ** ** * * ** *
* * * *
** * * * * * * * * ***
* dimer interface
*
* * * * * * * *
** * * * * * * * ** * *
** * * * * * * * * ** * * * * * *** **
Nature Structural & Molecular Biology: doi:10.1038/nsmb.2080
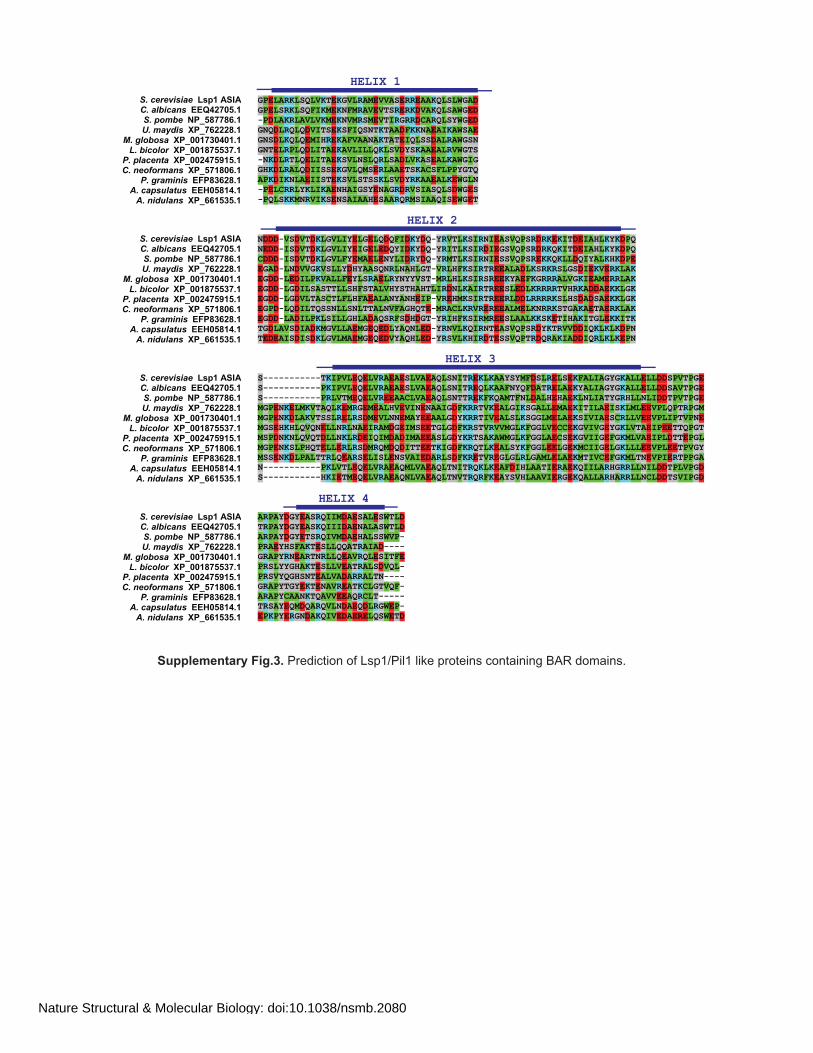
GPELARKLSQLVKTEKGVLRAMEVVASERREAAKQLSLWGAD
GPELSRKLSQFIKMEKNFMRAVEVTSRERKDVAKQLSAWGED
-PDLAKRLAVLVKMEKNVMRSMEVTIRGRRDCARQLSYWGED
GNQDLRQLQDVITSEKSFIQSNTKTAADFKKNAEAIKAWSAE
GNSDLKQLQEMIHREKAFVAANAKTATEIQLSSDALRAWGSN
GNTELRPLQDLITAEKAVLILLQKLSVDYSKAAEALRVWGTS
-NKDLRTLQELITAEKSVLNSLQRLSADLVKASEALKAWGIG
GHKDLRALQDIISSEKGVLQMSERLAAETSKACSFLPPYGTQ
APKDIKNLAEIISTEKSVLSTSSKLSVDYRKAAEALKEWGLN
-PELCRRLYKLIKAENHAIGSYENAGRDRVSIASQLSDWGES
-PQLSKKMNRVIKSENSAIAAHESAARQRMSIAAQISEWGET
NDDD-VSDVTDKLGVLIYELGELQDQFIDKYDQ-YRVTLKSIRNIEASVQPSRDRKEKITDEIAHLKYKDPQ
NEDD-ISDVTDKLGVLIYEIGELEDQYIDKYDQ-YRITLKSIRDIEGSVQPSRDRKQKITDEIAHLKYKDPQ
CDDD-ISDVTDKLGVLFYEMAELENYLIDRYDQ-YRMTLKSIRNIESSVQPSREKKQKLLDQIYALKHKDPE
EGAD-LNDVVGKVSLLYDHYAASQNRLNAHLGT-VRLHFKSIRTREEALADLKSRKRSLGSDIEKVERKLAK
EGDD-LEDILPKVALLFEYLSRAELRYNYYVST-MRLHLKSIRSREEKYAEFKGRRRALVGKIEAMERRLAK
EGDD-LGDILSASTTLLSHFSTALVHYSTHAHTLIRDNLKAIRTREESLEDLKRRRRTVHRKADDAEKKLGK
EGDD-LGDVLTASCTLFLHFAEALANYANHEIP-VREHMKSIRTREERLDDLRRRRKSLHSDADSAEKKLGK
EGPD-LQDILTQSSNLLSNLTTALNVFAGHQTE-MRACLKRVREREEALMELKNRRKSTGAKAETAERKLAK
EGDD-LADILPKLSILLGHLADAQSRFSDHDGT-YRIHFKSIRMREESLAALKKSKETIHAKITGLEKKITK
TGDLAVSDIADKMGVLLAEMGEQEDLYAQNLED-YRNVLKQIRNTEASVQPSRDYKTRVVDDIQKLKLKDPN
TEDEAISDISDKLGVLMAEMGEQEDVYAQHLED-YRSVLKHIRDTESSVQPTRDQRAKIADDIQRLKLKEPN
S-----------TKIPVLEQELVRAEAESLVAEAQLSNITREKLKAAYSYMFDSLRELSEKFALIAGYGKALLELLDDSPVTPGE
S-----------PKIPVLEQELVRAEAESLVAEAQLSNITREQLKAAFNYQFDATRELAEKYALIAGYGKALLELLDDSAVTPGE
S-----------PRLVTMEQELVREEAACLVAEAQLSNTTREKFKQAMTFNLDALHEHAEKLNLIATYGRHLLNLIDDTPVTPGE
MGPENKELMKVTAQLKEMRGEMEALHVEVINENAAIGDFKRRTVKEALGIKSGALLEMAEKITILAEISKLMLEEVPLQPTRPGM
MGPENKDLAKVTSSLRELRSDMEVLNNEMAYEEAALGDYKRRTIVEALSLKSGGLMELAEKSIVIAESCRLLVEEVPLIPTVPNE
MGSEHKHLQVQNELLNRLNAEIRAMDGEIMSEETGLGDFKRSTVRVVMGLKFGGLVECCEKGVIVGEYGKLVTAEIPEETTQPGT
MSPDNKNLQVQTDLLNKLRDEIQIMDADIMAEEASLGDYKRTSAKAWMGLKFGGLAECSEKGVIIGEFGKMLVAEIPLDTTEPGL
MGPENKSLPHQTELLERLRSDMRQMDQDITTEETKIGDFKRQTLKEALSYKFGGLEELGEKMCIIGELGKLLLEEVPLEETPVGY
MSSENKDLPALTTRLQEARSELISLENSVAIEDARLSDFKRETVREGLGLRLGAMLELAEKMTIVCEFGKMLTNEVPIERTPPGA
N-----------PKLVTLEQELVRAEAQMLVAEAQLTNITRQKLKEAFDIHLAATIERAEKQIILARHGRRLLNILDDTPLVPGD
S-----------HKIETMEQELVRAEAQNLVAEAQLTNVTRQRFKEAYSVHLAAVIERGEKQALLARHARRLLNCLDDTSVIPGD
ARPAYDGYEASRQIIMDAESALESWTLD
TRPAYDGYEASKQIIIDAENALASWTLD
ARPAYDGYETSRQIVMDAEHALSSWVP-
PRAEYHSFAKTESLLQQATRAIAD----
GRAPYRNEARTNRLLQEAVRQLESITFE
PRSLYYGHAKTESLLVEATRALSDVQL-
PRSVYQGHSNTEALVADARRALTN----
GRAPYTGYEKTENAVREATKCLGTVQF-
ARAPYCAANKTQAVVEEAQRCLT-----
TRSAYEQMDQARQVLNDAEQDLRGWEP-
EPKPYERGNDAKQIVEDAERELQSWETD
Supplementary Fig.3. Prediction of Lsp1/Pil1 like proteins containing BAR domains.
HELIX 1
HELIX 4
HELIX 3
HELIX 2
S. cerevisiae Lsp1 ASIA C. albicans EEQ42705.1 S. pombe NP_587786.1 U. maydis XP_762228.1
M. globosa XP_001730401.1 L. bicolor XP_001875537.1
P. placenta XP_002475915.1 C. neoformans XP_571806.1
P. graminis EFP83628.1 A. capsulatus EEH05814.1 A. nidulans XP_661535.1
S. cerevisiae Lsp1 ASIA C. albicans EEQ42705.1 S. pombe NP_587786.1 U. maydis XP_762228.1
M. globosa XP_001730401.1 L. bicolor XP_001875537.1
P. placenta XP_002475915.1 C. neoformans XP_571806.1
P. graminis EFP83628.1 A. capsulatus EEH05814.1 A. nidulans XP_661535.1
S. cerevisiae Lsp1 ASIA C. albicans EEQ42705.1 S. pombe NP_587786.1 U. maydis XP_762228.1
M. globosa XP_001730401.1 L. bicolor XP_001875537.1
P. placenta XP_002475915.1 C. neoformans XP_571806.1
P. graminis EFP83628.1 A. capsulatus EEH05814.1 A. nidulans XP_661535.1
S. cerevisiae Lsp1 ASIA C. albicans EEQ42705.1 S. pombe NP_587786.1 U. maydis XP_762228.1
M. globosa XP_001730401.1 L. bicolor XP_001875537.1
P. placenta XP_002475915.1 C. neoformans XP_571806.1
P. graminis EFP83628.1 A. capsulatus EEH05814.1 A. nidulans XP_661535.1
Nature Structural & Molecular Biology: doi:10.1038/nsmb.2080
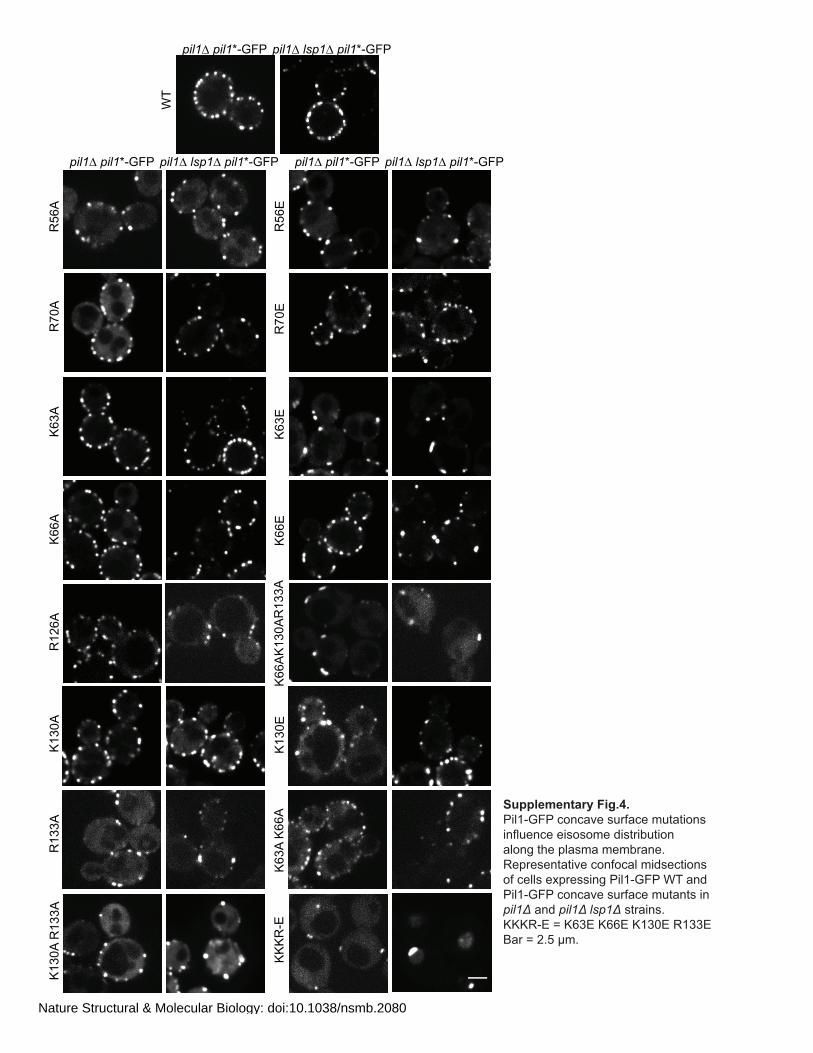
K130A
K130E
K66E
K1
30
A R
13
3A
R56A
KK
KR
-ER
56E
R70A
R133A
K6
3A
K6
6A
K66A
K63A
K63E
R70E
WT
R126A
K6
6A
K1
30
AR
13
3A
pil1 pil1*-GFP pil1 lsp1 pil1*-GFP pil1 pil1*-GFP pil1 lsp1 pil1*-GFP
pil1 pil1*-GFP pil1 lsp1 pil1*-GFP
Supplementary Fig.4.
Pil1-GFP concave surface mutations
influence eisosome distribution
along the plasma membrane.
Representative confocal midsections
of cells expressing Pil1-GFP WT and
Pil1-GFP concave surface mutants in
!"#$ and !"#$%"& #$ strains.
KKKR-E = K63E K66E K130E R133E
Bar = 2.5 µm.
Nature Structural & Molecular Biology: doi:10.1038/nsmb.2080
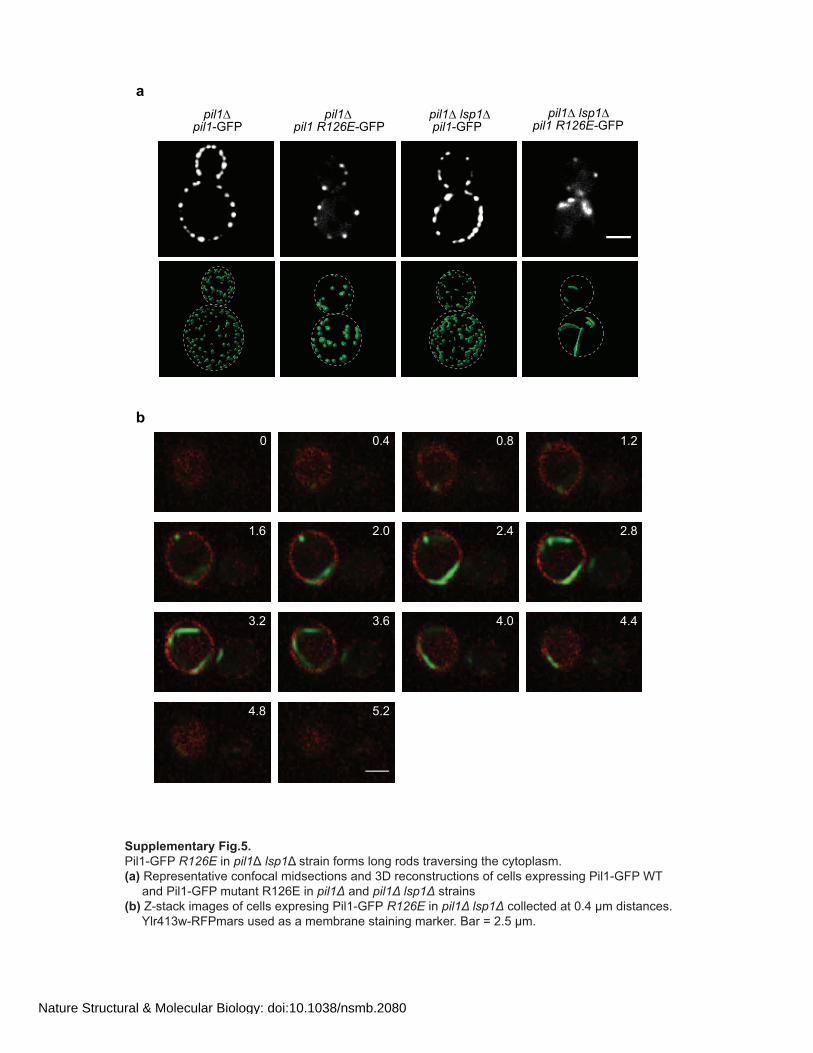
Supplementary Fig.5.
Pil1-GFP R126E in pil1 lsp1 !"#$%&'!()$*"!+)',!$)-"!#$%./$"&',!#0/!12#)3+%"*4!
(a)!5/3$/"/'#%#&./!1)'()1%+!*&-"/1#&)'"!%'-!67!$/1)'"#$81#&)'"!)(!1/++"!/93$/""&',!:&+;<=>:!?@
!!!!!%'-!:&+;<=>:!*8#%'#!5;ABC!&'! !"#$!%'-! !"#$%"& #$!"#$%&'"
(b) D<"#%1E!&*%,/"!)(!1/++"!/93$/"&',!:&+;<=>: R126E in !"#$%"& #$ 1)++/1#/-!%#!F4G!H*!-&"#%'1/"4!
!!!!!I+$G;6J<5>:*%$"!8"/-!%"!%!*/*K$%'/!"#%&'&',!*%$E/$4!L%$!M!A4N!H*4
F4G F4O ;4A
;4B A4F A4G A4O
64A 64B G4F G4G
G4O N4A
F
a
pil1 pil1 lsp1 pil1-GFP
pil1 pil1 lsp1 pil1 R126E-GFPpil1-GFP pil1 R126E-GFP
b
Nature Structural & Molecular Biology: doi:10.1038/nsmb.2080
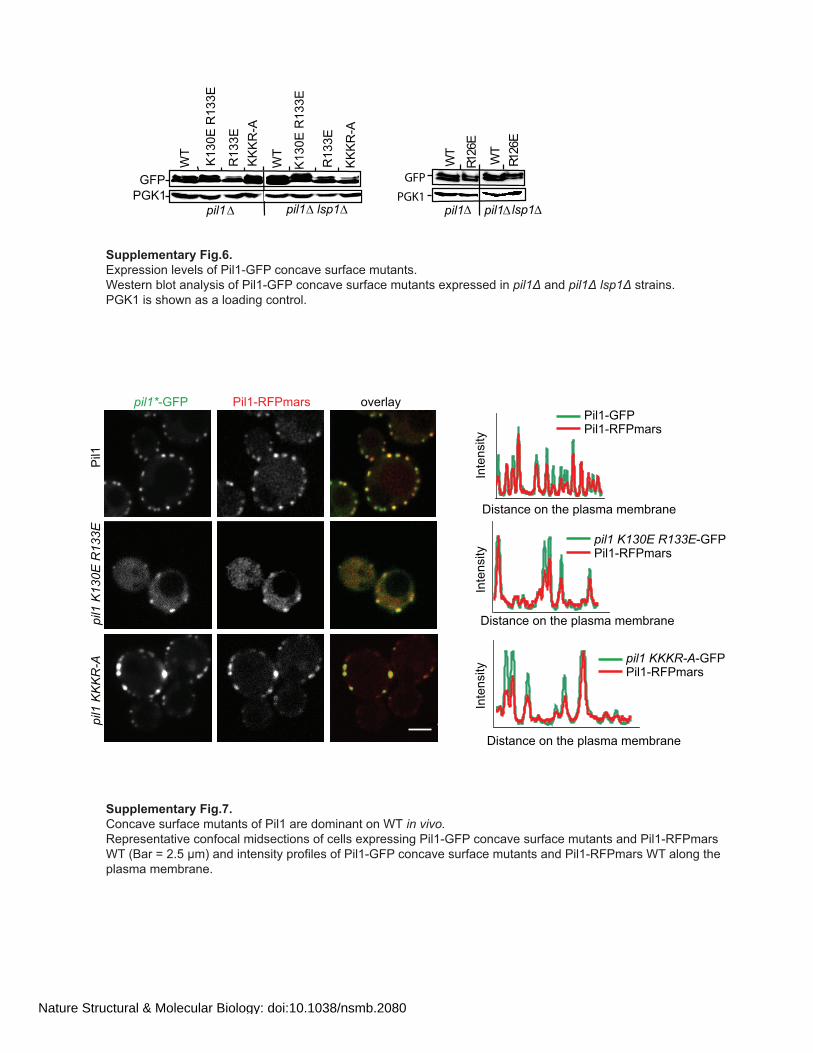
GFP
PGK1T
W
E3
31
R
E3
31
R E
03
1K
A-R
KK
K
TW
E3
31
R
E3
31
R E
03
1K
A-R
KK
K
pil1 lsp1 pil1
GFP
PGK1
TW
TW
E6
21
R
E6
21
R
pil1 pil1 lsp1
Supplementary Fig.6.
Expression levels of Pil1-GFP concave surface mutants.
Western blot analysis of Pil1-GFP concave surface mutants expressed in !"#$ and !"#$ "% #$ strains.
PGK1 is shown as a loading control.
Pil1-RFPmarspil1*-GFP overlay
Pil1
Distance on the plasma membrane
Distance on the plasma membrane
Distance on the plasma membrane
Inte
nsity
Inte
nsity
Inte
nsity
A-R
KK
K 1li
pE
33
1R
E0
31
K 1li
p
Pil1-GFPPil1-RFPmars
pil1 K130E R133E-GFPPil1-RFPmars
pil1 KKKR-A-GFPPil1-RFPmars
Supplementary Fig.7.
Concave surface mutants of Pil1 are dominant on WT in vivo.
Representative confocal midsections of cells expressing Pil1-GFP concave surface mutants and Pil1-RFPmars
WT (Bar = 2.5 µm) and intensity profiles of Pil1-GFP concave surface mutants and Pil1-RFPmars WT along the
plasma membrane.
Nature Structural & Molecular Biology: doi:10.1038/nsmb.2080
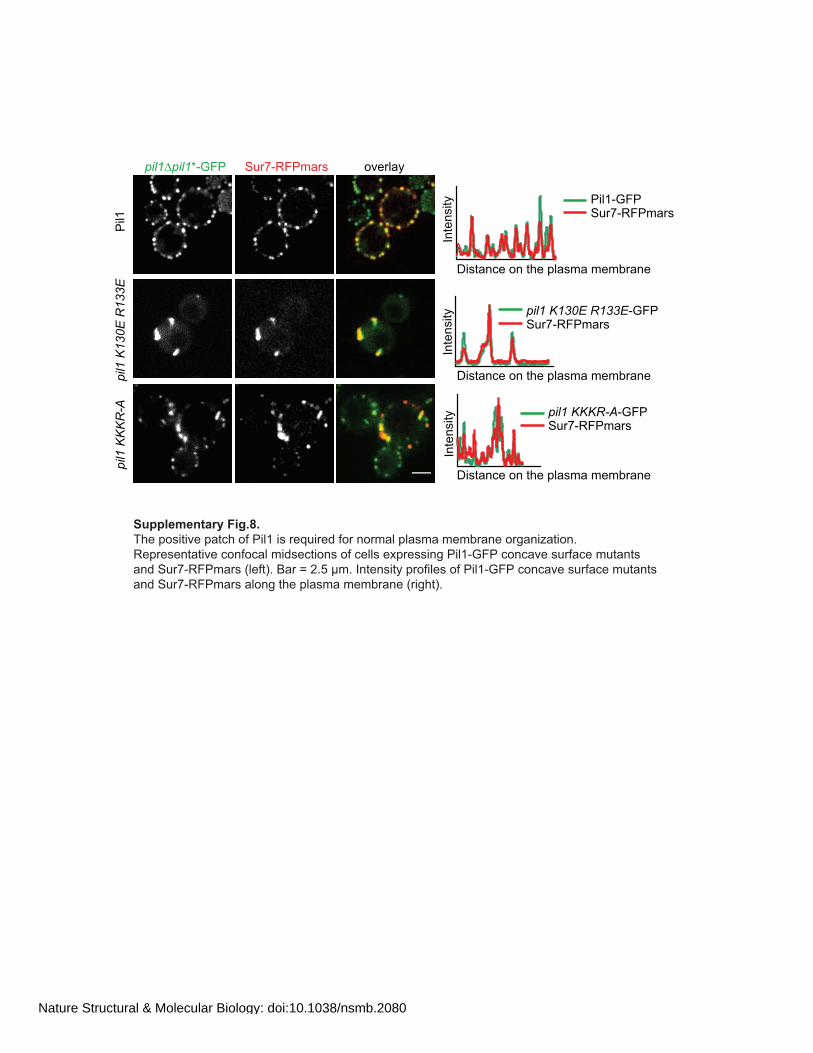
pil1 pil1*-GFP overlay
pil1
K1
30
E R
13
3E
pil1
KK
KR
-AP
il1
Sur7-RFPmars
Inte
nsity
Distance on the plasma membrane
Distance on the plasma membrane
Inte
nsity
Inte
nsity
Distance on the plasma membrane
Pil1-GFPSur7-RFPmars
pil1 K130E R133E-GFPSur7-RFPmars
pil1 KKKR-A-GFPSur7-RFPmars
Supplementary Fig.8.
The positive patch of Pil1 is required for normal plasma membrane organization.
Representative confocal midsections of cells expressing Pil1-GFP concave surface mutants
and Sur7-RFPmars (left). Bar = 2.5 µm. Intensity profiles of Pil1-GFP concave surface mutants
and Sur7-RFPmars along the plasma membrane (right).
Nature Structural & Molecular Biology: doi:10.1038/nsmb.2080
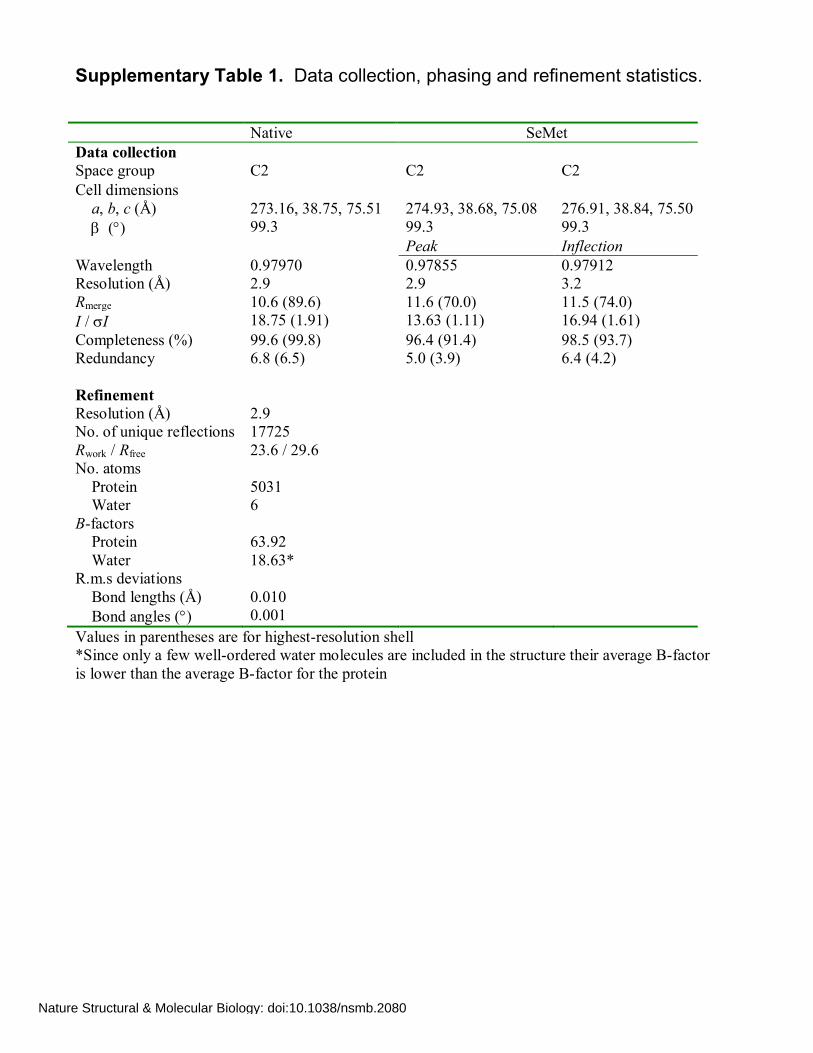
Supplementary Table 1. Data collection, phasing and refinement statistics.
Native SeMet Data collection Space group C2 C2 C2 Cell dimensions a, b, c (Å) 273.16, 38.75, 75.51 274.93, 38.68, 75.08 276.91, 38.84, 75.50 () 99.3 99.3 99.3 Peak Inflection Wavelength 0.97970 0.97855 0.97912 Resolution (Å) 2.9 2.9 3.2 Rmerge 10.6 (89.6) 11.6 (70.0) 11.5 (74.0) I / I 18.75 (1.91) 13.63 (1.11) 16.94 (1.61) Completeness (%) 99.6 (99.8) 96.4 (91.4) 98.5 (93.7) Redundancy 6.8 (6.5) 5.0 (3.9) 6.4 (4.2) Refinement Resolution (Å) 2.9 No. of unique reflections 17725 Rwork / Rfree 23.6 / 29.6 No. atoms Protein 5031 Water 6 B-factors Protein 63.92 Water 18.63* R.m.s deviations Bond lengths (Å) 0.010 Bond angles () 0.001 Values in parentheses are for highest-resolution shell *Since only a few well-ordered water molecules are included in the structure their average B-factor is lower than the average B-factor for the protein
Nature Structural & Molecular Biology: doi:10.1038/nsmb.2080
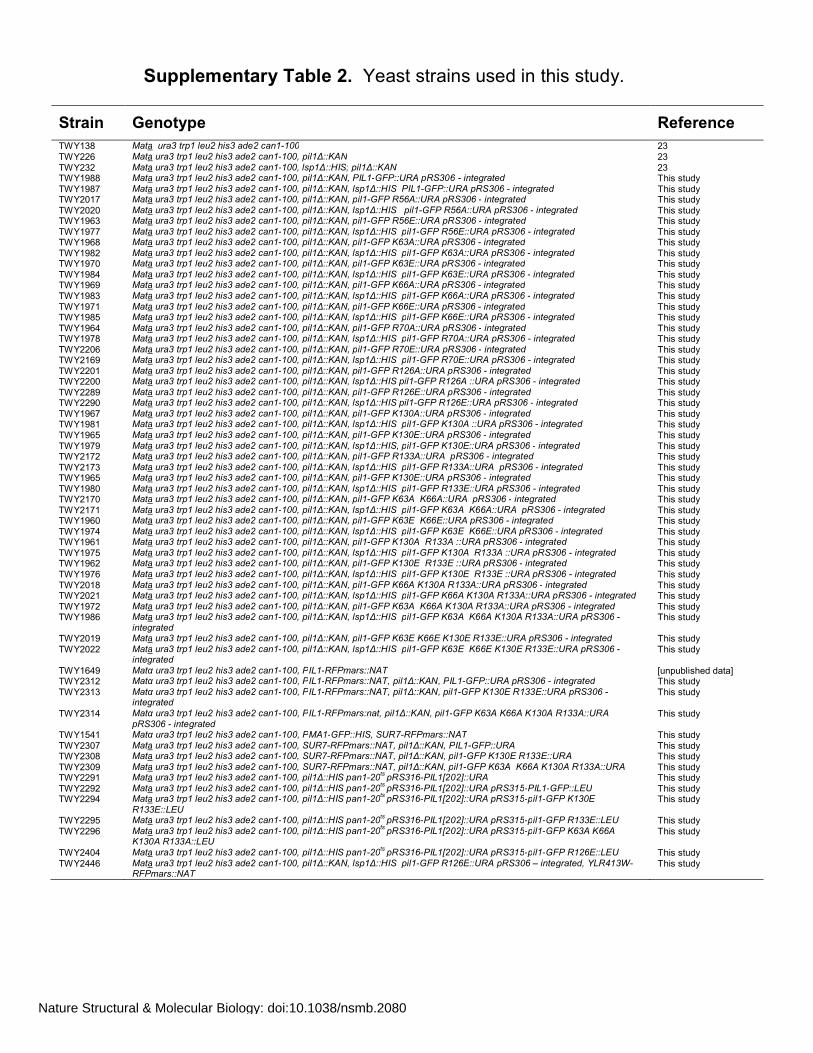
Supplementary Table 2. Yeast strains used in this study.
Strain Genotype Reference TWY138 Mata ura3 trp1 leu2 his3 ade2 can1-100 23 TWY226 Mata ura3 trp1 leu2 his3 ade2 can1-100, pil1Δ::KAN 23 TWY232 Mata ura3 trp1 leu2 his3 ade2 can1-100, lsp1Δ::HIS; pil1Δ::KAN 23 TWY1988 Mata ura3 trp1 leu2 his3 ade2 can1-100, pil1Δ::KAN, PIL1-GFP::URA pRS306 - integrated This study TWY1987 Mata ura3 trp1 leu2 his3 ade2 can1-100, pil1Δ::KAN, lsp1Δ::HIS PIL1-GFP::URA pRS306 - integrated This study TWY2017 Mata ura3 trp1 leu2 his3 ade2 can1-100, pil1Δ::KAN, pil1-GFP R56A::URA pRS306 - integrated This study TWY2020 Mata ura3 trp1 leu2 his3 ade2 can1-100, pil1Δ::KAN, lsp1Δ::HIS pil1-GFP R56A::URA pRS306 - integrated This study TWY1963 Mata ura3 trp1 leu2 his3 ade2 can1-100, pil1Δ::KAN, pil1-GFP R56E::URA pRS306 - integrated This study TWY1977 Mata ura3 trp1 leu2 his3 ade2 can1-100, pil1Δ::KAN, lsp1Δ::HIS pil1-GFP R56E::URA pRS306 - integrated This study TWY1968 Mata ura3 trp1 leu2 his3 ade2 can1-100, pil1Δ::KAN, pil1-GFP K63A::URA pRS306 - integrated This study TWY1982 Mata ura3 trp1 leu2 his3 ade2 can1-100, pil1Δ::KAN, lsp1Δ::HIS pil1-GFP K63A::URA pRS306 - integrated This study TWY1970 Mata ura3 trp1 leu2 his3 ade2 can1-100, pil1Δ::KAN, pil1-GFP K63E::URA pRS306 - integrated This study TWY1984 Mata ura3 trp1 leu2 his3 ade2 can1-100, pil1Δ::KAN, lsp1Δ::HIS pil1-GFP K63E::URA pRS306 - integrated This study TWY1969 Mata ura3 trp1 leu2 his3 ade2 can1-100, pil1Δ::KAN, pil1-GFP K66A::URA pRS306 - integrated This study TWY1983 Mata ura3 trp1 leu2 his3 ade2 can1-100, pil1Δ::KAN, lsp1Δ::HIS pil1-GFP K66A::URA pRS306 - integrated This study TWY1971 Mata ura3 trp1 leu2 his3 ade2 can1-100, pil1Δ::KAN, pil1-GFP K66E::URA pRS306 - integrated This study TWY1985 Mata ura3 trp1 leu2 his3 ade2 can1-100, pil1Δ::KAN, lsp1Δ::HIS pil1-GFP K66E::URA pRS306 - integrated This study TWY1964 Mata ura3 trp1 leu2 his3 ade2 can1-100, pil1Δ::KAN, pil1-GFP R70A::URA pRS306 - integrated This study TWY1978 Mata ura3 trp1 leu2 his3 ade2 can1-100, pil1Δ::KAN, lsp1Δ::HIS pil1-GFP R70A::URA pRS306 - integrated This study TWY2206 Mata ura3 trp1 leu2 his3 ade2 can1-100, pil1Δ::KAN, pil1-GFP R70E::URA pRS306 - integrated This study TWY2169 Mata ura3 trp1 leu2 his3 ade2 can1-100, pil1Δ::KAN, lsp1Δ::HIS pil1-GFP R70E::URA pRS306 - integrated This study TWY2201 Mata ura3 trp1 leu2 his3 ade2 can1-100, pil1Δ::KAN, pil1-GFP R126A::URA pRS306 - integrated This study TWY2200 Mata ura3 trp1 leu2 his3 ade2 can1-100, pil1Δ::KAN, lsp1Δ::HIS pil1-GFP R126A ::URA pRS306 - integrated This study TWY2289 Mata ura3 trp1 leu2 his3 ade2 can1-100, pil1Δ::KAN, pil1-GFP R126E::URA pRS306 - integrated This study TWY2290 Mata ura3 trp1 leu2 his3 ade2 can1-100, pil1Δ::KAN, lsp1Δ::HIS pil1-GFP R126E::URA pRS306 - integrated This study TWY1967 Mata ura3 trp1 leu2 his3 ade2 can1-100, pil1Δ::KAN, pil1-GFP K130A::URA pRS306 - integrated This study TWY1981 Mata ura3 trp1 leu2 his3 ade2 can1-100, pil1Δ::KAN, lsp1Δ::HIS pil1-GFP K130A ::URA pRS306 - integrated This study TWY1965 Mata ura3 trp1 leu2 his3 ade2 can1-100, pil1Δ::KAN, pil1-GFP K130E::URA pRS306 - integrated This study TWY1979 Mata ura3 trp1 leu2 his3 ade2 can1-100, pil1Δ::KAN, lsp1Δ::HIS, pil1-GFP K130E::URA pRS306 - integrated This study TWY2172 Mata ura3 trp1 leu2 his3 ade2 can1-100, pil1Δ::KAN, pil1-GFP R133A::URA pRS306 - integrated This study TWY2173 Mata ura3 trp1 leu2 his3 ade2 can1-100, pil1Δ::KAN, lsp1Δ::HIS pil1-GFP R133A::URA pRS306 - integrated This study TWY1965 Mata ura3 trp1 leu2 his3 ade2 can1-100, pil1Δ::KAN, pil1-GFP K130E::URA pRS306 - integrated This study TWY1980 Mata ura3 trp1 leu2 his3 ade2 can1-100, pil1Δ::KAN, lsp1Δ::HIS pil1-GFP R133E::URA pRS306 - integrated This study TWY2170 Mata ura3 trp1 leu2 his3 ade2 can1-100, pil1Δ::KAN, pil1-GFP K63A K66A::URA pRS306 - integrated This study TWY2171 Mata ura3 trp1 leu2 his3 ade2 can1-100, pil1Δ::KAN, lsp1Δ::HIS pil1-GFP K63A K66A::URA pRS306 - integrated This study TWY1960 Mata ura3 trp1 leu2 his3 ade2 can1-100, pil1Δ::KAN, pil1-GFP K63E K66E::URA pRS306 - integrated This study TWY1974 Mata ura3 trp1 leu2 his3 ade2 can1-100, pil1Δ::KAN, lsp1Δ::HIS pil1-GFP K63E K66E::URA pRS306 - integrated This study TWY1961 Mata ura3 trp1 leu2 his3 ade2 can1-100, pil1Δ::KAN, pil1-GFP K130A R133A ::URA pRS306 - integrated This study TWY1975 Mata ura3 trp1 leu2 his3 ade2 can1-100, pil1Δ::KAN, lsp1Δ::HIS pil1-GFP K130A R133A ::URA pRS306 - integrated This study TWY1962 Mata ura3 trp1 leu2 his3 ade2 can1-100, pil1Δ::KAN, pil1-GFP K130E R133E ::URA pRS306 - integrated This study TWY1976 Mata ura3 trp1 leu2 his3 ade2 can1-100, pil1Δ::KAN, lsp1Δ::HIS pil1-GFP K130E R133E ::URA pRS306 - integrated This study TWY2018 Mata ura3 trp1 leu2 his3 ade2 can1-100, pil1Δ::KAN, pil1-GFP K66A K130A R133A::URA pRS306 - integrated This study TWY2021 Mata ura3 trp1 leu2 his3 ade2 can1-100, pil1Δ::KAN, lsp1Δ::HIS pil1-GFP K66A K130A R133A::URA pRS306 - integrated This study TWY1972 Mata ura3 trp1 leu2 his3 ade2 can1-100, pil1Δ::KAN, pil1-GFP K63A K66A K130A R133A::URA pRS306 - integrated This study TWY1986 Mata ura3 trp1 leu2 his3 ade2 can1-100, pil1Δ::KAN, lsp1Δ::HIS pil1-GFP K63A K66A K130A R133A::URA pRS306 -
integrated This study
TWY2019 Mata ura3 trp1 leu2 his3 ade2 can1-100, pil1Δ::KAN, pil1-GFP K63E K66E K130E R133E::URA pRS306 - integrated This study TWY2022 Mata ura3 trp1 leu2 his3 ade2 can1-100, pil1Δ::KAN, lsp1Δ::HIS pil1-GFP K63E K66E K130E R133E::URA pRS306 -
integrated This study
TWY1649 Matα ura3 trp1 leu2 his3 ade2 can1-100, PIL1-RFPmars::NAT [unpublished data] TWY2312 Matα ura3 trp1 leu2 his3 ade2 can1-100, PIL1-RFPmars::NAT, pil1Δ::KAN, PIL1-GFP::URA pRS306 - integrated This study TWY2313 Matα ura3 trp1 leu2 his3 ade2 can1-100, PIL1-RFPmars::NAT, pil1Δ::KAN, pil1-GFP K130E R133E::URA pRS306 -
integrated This study
TWY2314 Matα ura3 trp1 leu2 his3 ade2 can1-100, PIL1-RFPmars:nat, pil1Δ::KAN, pil1-GFP K63A K66A K130A R133A::URA pRS306 - integrated
This study
TWY1541 Matα ura3 trp1 leu2 his3 ade2 can1-100, PMA1-GFP::HIS, SUR7-RFPmars::NAT This study TWY2307 Mata ura3 trp1 leu2 his3 ade2 can1-100, SUR7-RFPmars::NAT, pil1Δ::KAN, PIL1-GFP::URA This study TWY2308 Mata ura3 trp1 leu2 his3 ade2 can1-100, SUR7-RFPmars::NAT, pil1Δ::KAN, pil1-GFP K130E R133E::URA This study TWY2309 Mata ura3 trp1 leu2 his3 ade2 can1-100, SUR7-RFPmars::NAT, pil1Δ::KAN, pil1-GFP K63A K66A K130A R133A::URA This study TWY2291 Mata ura3 trp1 leu2 his3 ade2 can1-100, pil1Δ::HIS pan1-20ts pRS316-PIL1[202]::URA This study TWY2292 Mata ura3 trp1 leu2 his3 ade2 can1-100, pil1Δ::HIS pan1-20ts pRS316-PIL1[202]::URA pRS315-PIL1-GFP::LEU This study TWY2294 Mata ura3 trp1 leu2 his3 ade2 can1-100, pil1Δ::HIS pan1-20ts pRS316-PIL1[202]::URA pRS315-pil1-GFP K130E
R133E::LEU This study
TWY2295 Mata ura3 trp1 leu2 his3 ade2 can1-100, pil1Δ::HIS pan1-20ts pRS316-PIL1[202]::URA pRS315-pil1-GFP R133E::LEU This study TWY2296 Mata ura3 trp1 leu2 his3 ade2 can1-100, pil1Δ::HIS pan1-20ts pRS316-PIL1[202]::URA pRS315-pil1-GFP K63A K66A
K130A R133A::LEU This study
TWY2404 Mata ura3 trp1 leu2 his3 ade2 can1-100, pil1Δ::HIS pan1-20ts pRS316-PIL1[202]::URA pRS315-pil1-GFP R126E::LEU This study TWY2446
Mata ura3 trp1 leu2 his3 ade2 can1-100, pil1Δ::KAN, lsp1Δ::HIS pil1-GFP R126E::URA pRS306 – integrated, YLR413W-RFPmars::NAT
This study
Nature Structural & Molecular Biology: doi:10.1038/nsmb.2080
Supplementary Methods
Cloning, protein expression and purification
Lsp1 ASIA from S. cerevisiae was cloned using Seamless Ligation Independent Cloning1
to a modified pET vector that introduced a hexahistidine affinity tag and a PreScission
protease site to the N terminus of the translated protein. Lsp1 ASIA was expressed in
BL21 (DE3) Rosetta (Novagen). Expression was performed in a 1L bioreactor at 37°C, pH
7.0, 2L min-1, 800 rpm. SeMet derivative was expressed in minimal media with all amino
acids supplemented except for methionine, which was replaced by SeMet. SeMet
incorporation was confirmed by electrospray mass spectrometry. Proteins were purified
from bacterial lysate using Ni-NTA Agarose (Qiagen). His-tag was cleaved off overnight
with PreScission protease (provided by MPI-B Core Facility). Proteins were further purified
on HiTrap Q Fast Flow anion exchange column (GE Healthcare) and next on a Superdex
75 gel-filtration column (GE Healthcare). Protein samples were concentrated up to 15 mg
ml-1 prior to crystallization.
Protein crystallization, data collection, structure determination and refinement
Crystallization was carried out by the hanging drop, vapor diffusion method2 Lsp1 ASIA
native and SeMet derivative crystallized under identical conditions (0.2M NaCl, 20mM
phenol, 20% PEG 8000, 0.1M CAPS pH 11). 100 µl of parafinum oil was spread on the
surface of the reservoir solution to slow down vapor diffusion, reduce the number of
crystals grown and increase their size3. Diffraction quality crystals reaching the size 0.40 x
0.05 x 0.01 mm were obtained after 5 days at room temperature. Before flash freezing, the
crystals were transferred into a cryoprotectant solution containing 10% ethylene glycol. X-
ray data were collected at 100 K at the X10SA (PXII) beamline, the Swiss Light Source
(SLS), Villigen, Switzerland on a MAR 225 CCD detector. Native and SeMet reflection data
were indexed, integrated, and scaled with HKL-3000 (4). The structure was solved using
multiple-wavelength anomalous diffraction (MAD) with HKL-3000 (4), which is integrated
with MLPHARE5, DM6, SHELXD7, SHELXE8, CCP4 (9), SOLVE10, RESOLVE11 and
ARP/wARP12. The initial model of the native structure was obtained by molecular
replacement using MOLREP13. The model was subjected to iterative rounds of manual
rebuilding in COOT14 and refinement using REFMAC5 (15) utilizing data extending to 2.9
Nature Structural & Molecular Biology: doi:10.1038/nsmb.2080
Å resolution. Rfree was monitored by using 5% of the reflections as a test set. TLS
restraints16 were used in refinement. Ramachandran statistics calculated using
MOLPROBITY17 shows that the refined structure has 99.8% of all residues in allowed
regions and 95.8% of all residues in favored regions. The atomic coordinates and structure
factors are deposited in the Protein Data Bank with the accession code 3plt.
Supplementary Table 1 contains details regarding data collection and refinement statistics.
Three-dimensional protein structure homology modeling
The sequence alignment of Pil1 with Lsp1 was used for protein homology modeling.
Theoretical models of the structures of Pil1 homodimer and Lsp1-Pil1 heterodimer were
calculated using MODELLER18.
Lsp1 phylogenetic tree preparation
The tree was prepared using structure based sequence alignment of the S. cerevisiae
Lsp1 ASIA (pdb code: 3plt) with the D. melanogaster Amphiphysin (pdb code: 1uru), H.
sapiens Bin1/Amphiphysin 2 (pdb code: 2fic), H. sapiens Arfaptin 2 (pdb code: 1i49), H.
sapiens Endophilin 2/Endophilin A1 (pdb code: 1x03), H. sapiens Endophilin 3 (pdb code:
2z0v), H. sapiens SNX9 (pdb code: 2raj), H. sapiens APPL1 (pdb code: 2q13), Galdieria
sulfuraria BAR – red algae BAR protein (pdb code: 3caz), H. sapiens FCHo2 (pdb code:
2v0o), H. sapiens Pascin 1 (pdb code: 3hah), H. sapiens Pascin 2 (pdb code: 3haj), H.
sapiens FNBP1 (pdb code: 2efl), H. sapiens CIP4 (pdb code: 2efk), S. cerevisiae Syp1
(pdb code: 3g9g), H. sapiens IRSp53 (pdb code: 1y2o). The alignment generated by DALI
server19 was given to Geneious software (version 3.5.6) for the tree construction using
neighbor-joining method, without any out-group or bootstrapping.
Prediction of Lsp1/Pil1 like proteins containing BAR domains
Candidate BAR domains were identified using repeated iterations of PSI-BLAST
(www.ncbi.nlm.nih.gov/BLAST) against Lsp1 ASIA sequence with default parameters. Top
150 proteins were categorized according to phylum and checked for α-helical content
using secondary structure prediction tools available at http://us.expasy.org/ tools/.
Nature Structural & Molecular Biology: doi:10.1038/nsmb.2080
Projection of evolutionary conservation scores of amino acids on protein structure
ConSurf20 and Pymol21 were used to prepare the Lsp1 ASIA dimer surface representation
of amino acid evolutionary conservation (Fig. 2c).
Yeast strains, plasmids and mutants
All yeast stains were generated in the W303 background. PIL1-GFP gene was cloned into
pRS306 and mutated using site-directed mutagenesis. Wild type PIL1-GFP and pil1-GFP
concave surface mutants were transformed to TWY226 and TWY232 strains. Pil1 concave
surface GFP mutant strains with Sur7-RFPmars were generated by crossing with
TWY1541 strain. Pil1-GFP concave surface mutant strains with Pil1-RFPmars were
generated by transformation to TWY1649. TWY2446 with pil1R126E-GFP mutant and
Ylr413w-RFPmars was generated using the versatile toolbox for PCR-based tagging of
yeast genes22. Yeast strains expressing Pil1-GFP concave surface mutants tested for
growth on 5-FOA plate were generated in pRS306 than digested, ligated to pRS315,
transformed to TWY2291 strain and grown at 24ºC. Supplementary Table 2 contains the
list of the yeast strains used in this work.
Microscopy
For fluorescence microscopy, yeast cells were grown to an OD = 0.6 in YPD at 30ºC. Cells
were mounted in synthetic media onto cover slips previously coated with concanavalin A
and directly imaged with an ANDOR/TiLL iMIC CSU22 spinning disk confocal microscope,
using an ANDOR iXonEM 897 back-illuminated EM CCD camera and an Olympus 100x
1.4 NA oil immersion objective. From this setup the images were collected using Andor
Image iQ 1.9 in the linear range of the camera. For presentation, images were cropped
using ImageJ software (http://rsbweb.nih.gov/ij/) and for 3D reconstructions processed
using Huygenes software (http://www.svi.nl/).
Immunoblotting
GFP and PGK1 were probed with anti-GFP antibody and anti-PGK1 antibody (Molecular
Probes).
Nature Structural & Molecular Biology: doi:10.1038/nsmb.2080
Supplementary References
1. Li, M. Z. & Elledge S. J. Harnessing homologous recombination in vitro to generate recombinant DNA via SLIC. Nat. Methods. 4, 251-256 (2007).
2. Wlodawer, A. & Hodgson, K.O. Crystallization and crystal data of monellin. Proc. Natl. Acad. Sci. USA 72, 398–399 (1975).
3. Chayen, N.E. A novel technique to control the rate of vapor diffusion, giving larger protein crystals. J. Appl. Cryst. 30, 198-202 (1997).
4. Minor, W., Cymborowski, M., Otwinowski, Z. & Chruszcz, M. HKL-3000: The Integration of Data Reduction and Structure Solution-From Diffraction Images to an Initial Model in Minutes. Acta Crystallogr. Sect. D: Biol. Crystallogr. 62, 859-866 (2006).
5. Otwinowski, Z. CCP4, SERC Daresbury Laboratory, Warrington, UK (1991). 6. Cowtan, K. DM: an automated procedure for phase improvement by density modification,
Joint CCP4 and ESF-EACBM Newsletter on Protein Crystallography. 31, 34–38 (1994). 7. Schneider, T.R. & Sheldrick, G.M. Substructure solution with SHELXD. Acta Crystallogr.,
Sect. D: Biol. Crystallogr. 58, 1772–1779 (2002). 8. Sheldrick, G.M. Macromolecular phasing with SHELXE. Z. Kristallogr. 217, 644–650
(2002). 9. CCP4. The CCP4 suite: programs for protein crystallography, Acta Crystallogr., Sect. D:
Biol. Crystallogr. 50, 760–763 (1994). 10. Terwilliger, T.C. & Berendzen J. Automated MAD and MIR structure solution. Acta
Crystallogr., Sect. D: Biol. Crystallogr. 55, 849–861 (1999). 11. Terwilliger T.C. Automated structure solution, density modification and model building.
Acta Crystallogr., Sect. D: Biol. Crystallogr. 58, 1937–1940 (2002). 12. Perrakis, A., Morris R. & Lamzin V.S. Automated protein model building combined with
iterative structure refinement. Nat. Struct. Biol. 6, 458–463 (1999). 13. Vagin, A.A. & Teplyakov A., MOLREP: an Automated Program for Molecular
Replacement. J. Appl. Cryst. 30, 1022-1025 (1997). 14. Emsley, P. & Cowtan. K. Coot: model-building tools for molecular graphics. Acta
Crystallogr. Sect. D: Biol. Crystallogr. 60, 2126-2132 (2004). 15. Murshudov, G.N., Vagin, A.A. & Dodson, E.J. Refinement of macromolecular structures by
the maximum-likelihood method. Acta Crystallogr. Sect. D: Biol. Crystallogr. 53, 240–255 (1997).
16. Jones, T.A., Zou, J.Y. & Cowan S.W. and Kjeldgaard M. Improved methods for building protein models in electron density maps and the location of errors in these models. Acta Crystallogr., Sect. D: Biol. Crystallogr. 47, 110–119 (1991).
17. Davis, I.W., et al. Molprobity: all-atom contacts and structure validation for proteins and nucleic acids. Nucl. Acids Res. 35, 375-83 (2007).
18. Eswar, N., et al. Comparative protein structure modeling with MODELLER. Current Protocols in Bioinformatics, John Wiley & Sons, Inc., Supplement 15, 5.6.1-5.6.3 (2006).
19. Holm, L., Kaariainen, S., Rosenstrom, P. & Schenkel, A. Searching protein structure databases with DaliLite v.3. Bioinformatics 24, 2780-2781 (2008).
20. Ashkenazy, H., Erez, E., Martz, E., Pupko, T. & Ben-Tal, N. ConSurf 2010: calculating evolutionary conservation in sequence and structure of proteins and nucleic acids. Nucl. Acids Res. 38, W529-W533 (2010).
21. De Lano, W.L. The Pymol Molecular Graphics System. DeLano Scientific, San Carlos CA, USA, www.pymol.org (2002).
22. Janke, C. et al. A versatile toolbox for PCR-based tagging of yeast genes: new fluorescent proteins, more markers and promoter substitution cassettes. Yeast 21, 947–962 (2004).
23. Walther, T.C. et al. Eisosomes mark static sites of endocytosis. Nature 439, 998-1003 (2006).
Nature Structural & Molecular Biology: doi:10.1038/nsmb.2080
Supplementary Video Legend Pil1-GFP R126E in pil1Δ lsp1Δ strain forms long rods traversing the cytoplasm.
Ylr413w-RFPmars used as a membrane staining marker. Z-stack images collected at 0.2
µm distances.
Nature Structural & Molecular Biology: doi:10.1038/nsmb.2080

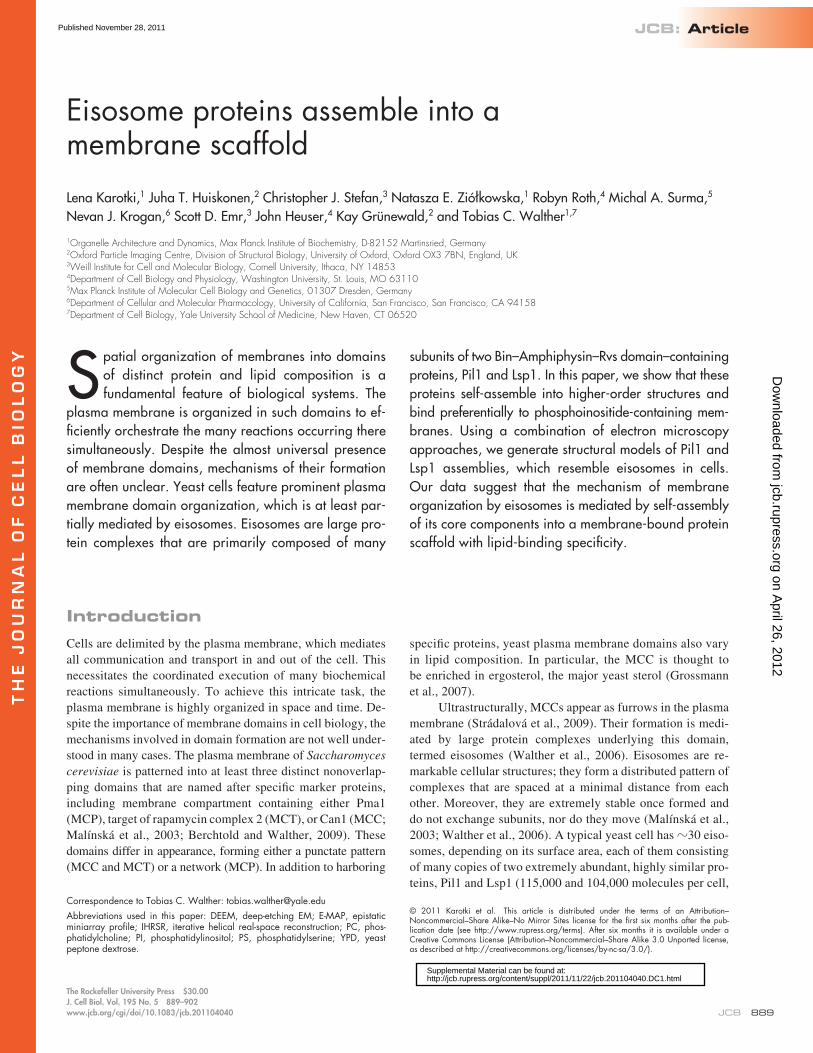
JCB: Article
The Rockefeller University Press $30.00J. Cell Biol. Vol. 195 No. 5 889–902www.jcb.org/cgi/doi/10.1083/jcb.201104040 JCB 889
Correspondence to Tobias C. Walther: [email protected] used in this paper: DEEM, deep-etching EM; E-MAP, epistatic miniarray profile; IHRSR, iterative helical real-space reconstruction; PC, phos-phatidylcholine; PI, phosphatidylinositol; PS, phosphatidylserine; YPD, yeast peptone dextrose.
IntroductionCells are delimited by the plasma membrane, which mediates all communication and transport in and out of the cell. This necessitates the coordinated execution of many biochemical reactions simultaneously. To achieve this intricate task, the plasma membrane is highly organized in space and time. De-spite the importance of membrane domains in cell biology, the mechanisms involved in domain formation are not well under-stood in many cases. The plasma membrane of Saccharomyces cerevisiae is patterned into at least three distinct nonoverlap-ping domains that are named after specific marker proteins, including membrane compartment containing either Pma1 (MCP), target of rapamycin complex 2 (MCT), or Can1 (MCC; Malínská et al., 2003; Berchtold and Walther, 2009). These domains differ in appearance, forming either a punctate pattern (MCC and MCT) or a network (MCP). In addition to harboring
specific proteins, yeast plasma membrane domains also vary in lipid composition. In particular, the MCC is thought to be enriched in ergosterol, the major yeast sterol (Grossmann et al., 2007).
Ultrastructurally, MCCs appear as furrows in the plasma membrane (Strádalová et al., 2009). Their formation is medi-ated by large protein complexes underlying this domain, termed eisosomes (Walther et al., 2006). Eisosomes are re-markable cellular structures; they form a distributed pattern of complexes that are spaced at a minimal distance from each other. Moreover, they are extremely stable once formed and do not exchange subunits, nor do they move (Malínská et al., 2003; Walther et al., 2006). A typical yeast cell has 30 eiso-somes, depending on its surface area, each of them consisting of many copies of two extremely abundant, highly similar pro-teins, Pil1 and Lsp1 (115,000 and 104,000 molecules per cell,
Spatial organization of membranes into domains of distinct protein and lipid composition is a fundamental feature of biological systems. The
plasma membrane is organized in such domains to ef-ficiently orchestrate the many reactions occurring there simultaneously. Despite the almost universal presence of membrane domains, mechanisms of their formation are often unclear. Yeast cells feature prominent plasma membrane domain organization, which is at least par-tially mediated by eisosomes. Eisosomes are large pro-tein complexes that are primarily composed of many
subunits of two Bin–Amphiphysin–Rvs domain–containing proteins, Pil1 and Lsp1. In this paper, we show that these proteins self-assemble into higher-order structures and bind preferentially to phosphoinositide-containing mem-branes. Using a combination of electron microscopy approaches, we generate structural models of Pil1 and Lsp1 assemblies, which resemble eisosomes in cells. Our data suggest that the mechanism of membrane organization by eisosomes is mediated by self-assembly of its core components into a membrane-bound protein scaffold with lipid-binding specificity.
Eisosome proteins assemble into a membrane scaffold
Lena Karotki,1 Juha T. Huiskonen,2 Christopher J. Stefan,3 Natasza E. Ziółkowska,1 Robyn Roth,4 Michal A. Surma,5 Nevan J. Krogan,6 Scott D. Emr,3 John Heuser,4 Kay Grünewald,2 and Tobias C. Walther1,7
1Organelle Architecture and Dynamics, Max Planck Institute of Biochemistry, D-82152 Martinsried, Germany2Oxford Particle Imaging Centre, Division of Structural Biology, University of Oxford, Oxford OX3 7BN, England, UK3Weill Institute for Cell and Molecular Biology, Cornell University, Ithaca, NY 148534Department of Cell Biology and Physiology, Washington University, St. Louis, MO 631105Max Planck Institute of Molecular Cell Biology and Genetics, 01307 Dresden, Germany6Department of Cellular and Molecular Pharmacology, University of California, San Francisco, San Francisco, CA 941587Department of Cell Biology, Yale University School of Medicine, New Haven, CT 06520
© 2011 Karotki et al. This article is distributed under the terms of an Attribution–Noncommercial–Share Alike–No Mirror Sites license for the first six months after the pub-lication date (see http://www.rupress.org/terms). After six months it is available under a Creative Commons License (Attribution–Noncommercial–Share Alike 3.0 Unported license, as described at http://creativecommons.org/licenses/by-nc-sa/3.0/).
TH
EJ
OU
RN
AL
OF
CE
LL
BIO
LO
GY
on April 26, 2012
jcb.rupress.orgD
ownloaded from
Published November 28, 2011
http://jcb.rupress.org/content/suppl/2011/11/22/jcb.201104040.DC1.html Supplemental Material can be found at:
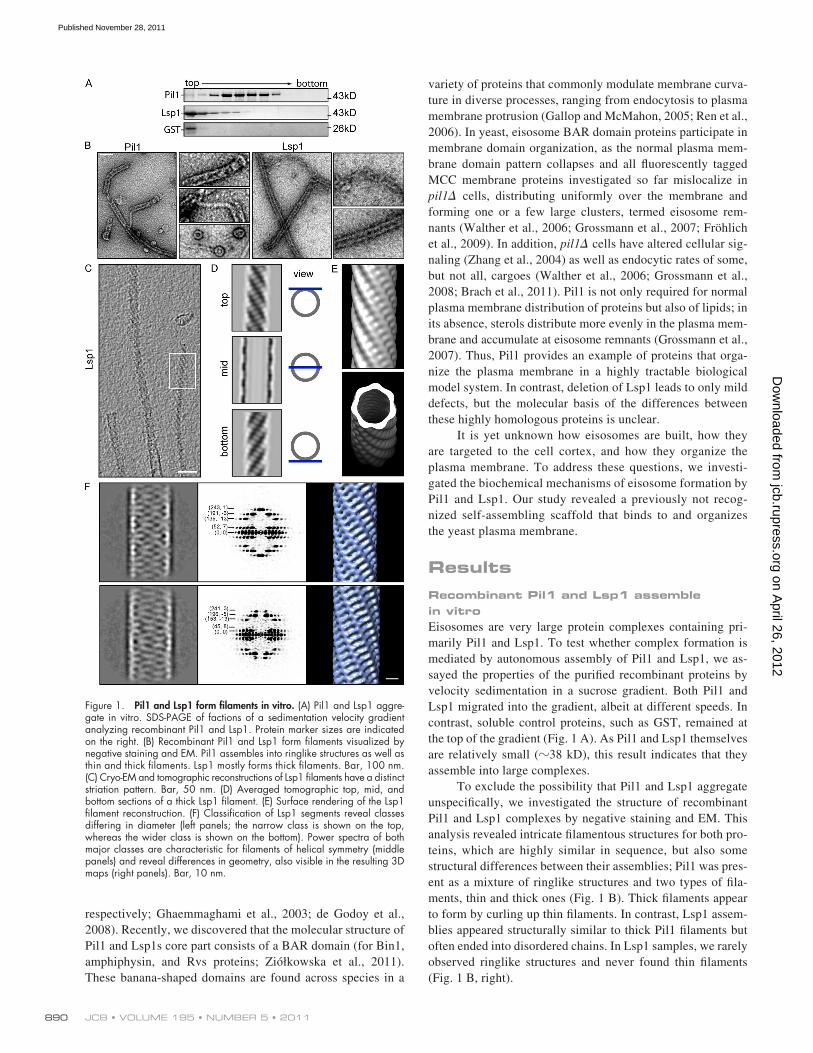
JCB • VOLUME 195 • NUMBER 5 • 2011 890
variety of proteins that commonly modulate membrane curva-ture in diverse processes, ranging from endocytosis to plasma membrane protrusion (Gallop and McMahon, 2005; Ren et al., 2006). In yeast, eisosome BAR domain proteins participate in membrane domain organization, as the normal plasma mem-brane domain pattern collapses and all fluorescently tagged MCC membrane proteins investigated so far mislocalize in pil1 cells, distributing uniformly over the membrane and forming one or a few large clusters, termed eisosome rem-nants (Walther et al., 2006; Grossmann et al., 2007; Fröhlich et al., 2009). In addition, pil1 cells have altered cellular sig-naling (Zhang et al., 2004) as well as endocytic rates of some, but not all, cargoes (Walther et al., 2006; Grossmann et al., 2008; Brach et al., 2011). Pil1 is not only required for normal plasma membrane distribution of proteins but also of lipids; in its absence, sterols distribute more evenly in the plasma mem-brane and accumulate at eisosome remnants (Grossmann et al., 2007). Thus, Pil1 provides an example of proteins that orga-nize the plasma membrane in a highly tractable biological model system. In contrast, deletion of Lsp1 leads to only mild defects, but the molecular basis of the differences between these highly homologous proteins is unclear.
It is yet unknown how eisosomes are built, how they are targeted to the cell cortex, and how they organize the plasma membrane. To address these questions, we investi-gated the biochemical mechanisms of eisosome formation by Pil1 and Lsp1. Our study revealed a previously not recog-nized self-assembling scaffold that binds to and organizes the yeast plasma membrane.
ResultsRecombinant Pil1 and Lsp1 assemble in vitroEisosomes are very large protein complexes containing pri-marily Pil1 and Lsp1. To test whether complex formation is mediated by autonomous assembly of Pil1 and Lsp1, we as-sayed the properties of the purified recombinant proteins by velocity sedimentation in a sucrose gradient. Both Pil1 and Lsp1 migrated into the gradient, albeit at different speeds. In contrast, soluble control proteins, such as GST, remained at the top of the gradient (Fig. 1 A). As Pil1 and Lsp1 themselves are relatively small (38 kD), this result indicates that they assemble into large complexes.
To exclude the possibility that Pil1 and Lsp1 aggregate unspecifically, we investigated the structure of recombinant Pil1 and Lsp1 complexes by negative staining and EM. This analysis revealed intricate filamentous structures for both pro-teins, which are highly similar in sequence, but also some structural differences between their assemblies; Pil1 was pres-ent as a mixture of ringlike structures and two types of fila-ments, thin and thick ones (Fig. 1 B). Thick filaments appear to form by curling up thin filaments. In contrast, Lsp1 assem-blies appeared structurally similar to thick Pil1 filaments but often ended into disordered chains. In Lsp1 samples, we rarely observed ringlike structures and never found thin filaments (Fig. 1 B, right).
respectively; Ghaemmaghami et al., 2003; de Godoy et al., 2008). Recently, we discovered that the molecular structure of Pil1 and Lsp1s core part consists of a BAR domain (for Bin1, amphiphysin, and Rvs proteins; Ziółkowska et al., 2011). These banana-shaped domains are found across species in a
Figure 1. Pil1 and Lsp1 form filaments in vitro. (A) Pil1 and Lsp1 aggre-gate in vitro. SDS-PAGE of factions of a sedimentation velocity gradient analyzing recombinant Pil1 and Lsp1. Protein marker sizes are indicated on the right. (B) Recombinant Pil1 and Lsp1 form filaments visualized by negative staining and EM. Pil1 assembles into ringlike structures as well as thin and thick filaments. Lsp1 mostly forms thick filaments. Bar, 100 nm. (C) Cryo-EM and tomographic reconstructions of Lsp1 filaments have a distinct striation pattern. Bar, 50 nm. (D) Averaged tomographic top, mid, and bottom sections of a thick Lsp1 filament. (E) Surface rendering of the Lsp1 filament reconstruction. (F) Classification of Lsp1 segments reveal classes differing in diameter (left panels; the narrow class is shown on the top, whereas the wider class is shown on the bottom). Power spectra of both major classes are characteristic for filaments of helical symmetry (middle panels) and reveal differences in geometry, also visible in the resulting 3D maps (right panels). Bar, 10 nm.
on April 26, 2012
jcb.rupress.orgD
ownloaded from
Published November 28, 2011
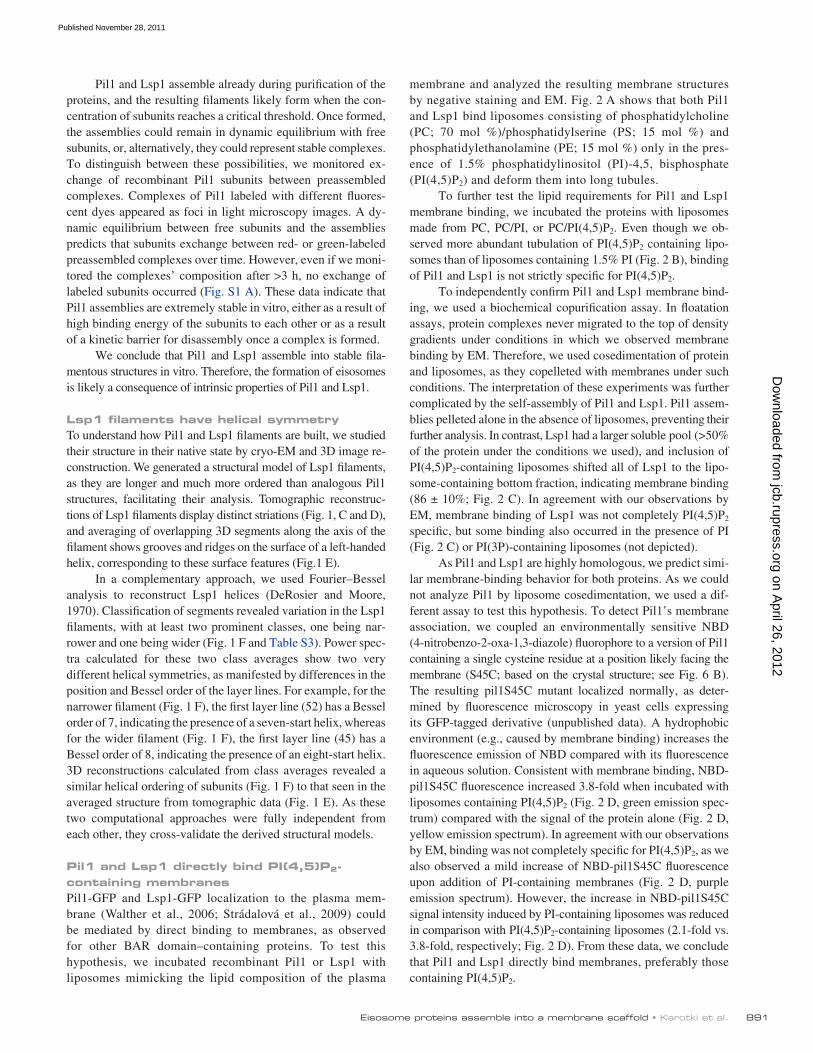
891Eisosome proteins assemble into a membrane scaffold • Karotki et al.
membrane and analyzed the resulting membrane structures by negative staining and EM. Fig. 2 A shows that both Pil1 and Lsp1 bind liposomes consisting of phosphatidylcholine (PC; 70 mol %)/phosphatidylserine (PS; 15 mol %) and phosphatidylethanolamine (PE; 15 mol %) only in the pres-ence of 1.5% phosphatidylinositol (PI)-4,5, bisphosphate (PI(4,5)P2) and deform them into long tubules.
To further test the lipid requirements for Pil1 and Lsp1 membrane binding, we incubated the proteins with liposomes made from PC, PC/PI, or PC/PI(4,5)P2. Even though we ob-served more abundant tubulation of PI(4,5)P2 containing lipo-somes than of liposomes containing 1.5% PI (Fig. 2 B), binding of Pil1 and Lsp1 is not strictly specific for PI(4,5)P2.
To independently confirm Pil1 and Lsp1 membrane bind-ing, we used a biochemical copurification assay. In floatation assays, protein complexes never migrated to the top of density gradients under conditions in which we observed membrane binding by EM. Therefore, we used cosedimentation of protein and liposomes, as they copelleted with membranes under such conditions. The interpretation of these experiments was further complicated by the self-assembly of Pil1 and Lsp1. Pil1 assem-blies pelleted alone in the absence of liposomes, preventing their further analysis. In contrast, Lsp1 had a larger soluble pool (>50% of the protein under the conditions we used), and inclusion of PI(4,5)P2-containing liposomes shifted all of Lsp1 to the lipo-some-containing bottom fraction, indicating membrane binding (86 ± 10%; Fig. 2 C). In agreement with our observations by EM, membrane binding of Lsp1 was not completely PI(4,5)P2 specific, but some binding also occurred in the presence of PI (Fig. 2 C) or PI(3P)-containing liposomes (not depicted).
As Pil1 and Lsp1 are highly homologous, we predict simi-lar membrane-binding behavior for both proteins. As we could not analyze Pil1 by liposome cosedimentation, we used a dif-ferent assay to test this hypothesis. To detect Pil1’s membrane association, we coupled an environmentally sensitive NBD (4-nitrobenzo-2-oxa-1,3-diazole) fluorophore to a version of Pil1 containing a single cysteine residue at a position likely facing the membrane (S45C; based on the crystal structure; see Fig. 6 B). The resulting pil1S45C mutant localized normally, as deter-mined by fluorescence microscopy in yeast cells expressing its GFP-tagged derivative (unpublished data). A hydrophobic environment (e.g., caused by membrane binding) increases the fluorescence emission of NBD compared with its fluorescence in aqueous solution. Consistent with membrane binding, NBD-pil1S45C fluorescence increased 3.8-fold when incubated with liposomes containing PI(4,5)P2 (Fig. 2 D, green emission spec-trum) compared with the signal of the protein alone (Fig. 2 D, yellow emission spectrum). In agreement with our observations by EM, binding was not completely specific for PI(4,5)P2, as we also observed a mild increase of NBD-pil1S45C fluorescence upon addition of PI-containing membranes (Fig. 2 D, purple emission spectrum). However, the increase in NBD-pil1S45C signal intensity induced by PI-containing liposomes was reduced in comparison with PI(4,5)P2-containing liposomes (2.1-fold vs. 3.8-fold, respectively; Fig. 2 D). From these data, we conclude that Pil1 and Lsp1 directly bind membranes, preferably those containing PI(4,5)P2.
Pil1 and Lsp1 assemble already during purification of the proteins, and the resulting filaments likely form when the con-centration of subunits reaches a critical threshold. Once formed, the assemblies could remain in dynamic equilibrium with free subunits, or, alternatively, they could represent stable complexes. To distinguish between these possibilities, we monitored ex-change of recombinant Pil1 subunits between preassembled complexes. Complexes of Pil1 labeled with different fluores-cent dyes appeared as foci in light microscopy images. A dy-namic equilibrium between free subunits and the assemblies predicts that subunits exchange between red- or green-labeled preassembled complexes over time. However, even if we moni-tored the complexes’ composition after >3 h, no exchange of labeled subunits occurred (Fig. S1 A). These data indicate that Pil1 assemblies are extremely stable in vitro, either as a result of high binding energy of the subunits to each other or as a result of a kinetic barrier for disassembly once a complex is formed.
We conclude that Pil1 and Lsp1 assemble into stable fila-mentous structures in vitro. Therefore, the formation of eisosomes is likely a consequence of intrinsic properties of Pil1 and Lsp1.
Lsp1 filaments have helical symmetryTo understand how Pil1 and Lsp1 filaments are built, we studied their structure in their native state by cryo-EM and 3D image re-construction. We generated a structural model of Lsp1 filaments, as they are longer and much more ordered than analogous Pil1 structures, facilitating their analysis. Tomographic reconstruc-tions of Lsp1 filaments display distinct striations (Fig. 1, C and D), and averaging of overlapping 3D segments along the axis of the filament shows grooves and ridges on the surface of a left-handed helix, corresponding to these surface features (Fig.1 E).
In a complementary approach, we used Fourier–Bessel analysis to reconstruct Lsp1 helices (DeRosier and Moore, 1970). Classification of segments revealed variation in the Lsp1 filaments, with at least two prominent classes, one being nar-rower and one being wider (Fig. 1 F and Table S3). Power spec-tra calculated for these two class averages show two very different helical symmetries, as manifested by differences in the position and Bessel order of the layer lines. For example, for the narrower filament (Fig. 1 F), the first layer line (52) has a Bessel order of 7, indicating the presence of a seven-start helix, whereas for the wider filament (Fig. 1 F), the first layer line (45) has a Bessel order of 8, indicating the presence of an eight-start helix. 3D reconstructions calculated from class averages revealed a similar helical ordering of subunits (Fig. 1 F) to that seen in the averaged structure from tomographic data (Fig. 1 E). As these two computational approaches were fully independent from each other, they cross-validate the derived structural models.
Pil1 and Lsp1 directly bind PI(4,5)P2-containing membranesPil1-GFP and Lsp1-GFP localization to the plasma mem-brane (Walther et al., 2006; Strádalová et al., 2009) could be mediated by direct binding to membranes, as observed for other BAR domain–containing proteins. To test this hypothesis, we incubated recombinant Pil1 or Lsp1 with liposomes mimicking the lipid composition of the plasma
on April 26, 2012
jcb.rupress.orgD
ownloaded from
Published November 28, 2011
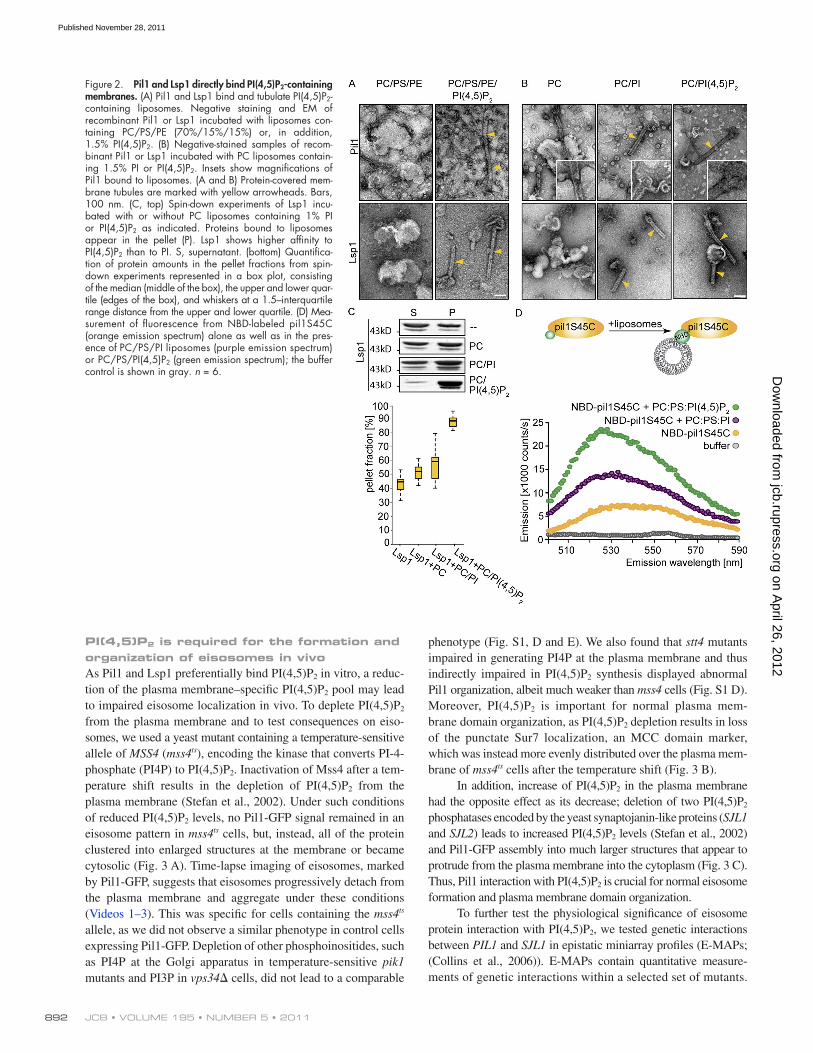
JCB • VOLUME 195 • NUMBER 5 • 2011 892
phenotype (Fig. S1, D and E). We also found that stt4 mutants impaired in generating PI4P at the plasma membrane and thus indirectly impaired in PI(4,5)P2 synthesis displayed abnormal Pil1 organization, albeit much weaker than mss4 cells (Fig. S1 D). Moreover, PI(4,5)P2 is important for normal plasma mem-brane domain organization, as PI(4,5)P2 depletion results in loss of the punctate Sur7 localization, an MCC domain marker, which was instead more evenly distributed over the plasma mem-brane of mss4ts cells after the temperature shift (Fig. 3 B).
In addition, increase of PI(4,5)P2 in the plasma membrane had the opposite effect as its decrease; deletion of two PI(4,5)P2 phosphatases encoded by the yeast synaptojanin-like proteins (SJL1 and SJL2) leads to increased PI(4,5)P2 levels (Stefan et al., 2002) and Pil1-GFP assembly into much larger structures that appear to protrude from the plasma membrane into the cytoplasm (Fig. 3 C). Thus, Pil1 interaction with PI(4,5)P2 is crucial for normal eisosome formation and plasma membrane domain organization.
To further test the physiological significance of eisosome protein interaction with PI(4,5)P2, we tested genetic interactions between PIL1 and SJL1 in epistatic miniarray profiles (E-MAPs; (Collins et al., 2006)). E-MAPs contain quantitative measure-ments of genetic interactions within a selected set of mutants.
PI(4,5)P2 is required for the formation and organization of eisosomes in vivoAs Pil1 and Lsp1 preferentially bind PI(4,5)P2 in vitro, a reduc-tion of the plasma membrane–specific PI(4,5)P2 pool may lead to impaired eisosome localization in vivo. To deplete PI(4,5)P2 from the plasma membrane and to test consequences on eiso-somes, we used a yeast mutant containing a temperature-sensitive allele of MSS4 (mss4ts), encoding the kinase that converts PI-4-phosphate (PI4P) to PI(4,5)P2. Inactivation of Mss4 after a tem-perature shift results in the depletion of PI(4,5)P2 from the plasma membrane (Stefan et al., 2002). Under such conditions of reduced PI(4,5)P2 levels, no Pil1-GFP signal remained in an eisosome pattern in mss4ts cells, but, instead, all of the protein clustered into enlarged structures at the membrane or became cytosolic (Fig. 3 A). Time-lapse imaging of eisosomes, marked by Pil1-GFP, suggests that eisosomes progressively detach from the plasma membrane and aggregate under these conditions (Videos 1–3). This was specific for cells containing the mss4ts allele, as we did not observe a similar phenotype in control cells expressing Pil1-GFP. Depletion of other phosphoinositides, such as PI4P at the Golgi apparatus in temperature-sensitive pik1 mutants and PI3P in vps34 cells, did not lead to a comparable
Figure 2. Pil1 and Lsp1 directly bind PI(4,5)P2-containing membranes. (A) Pil1 and Lsp1 bind and tubulate PI(4,5)P2-containing liposomes. Negative staining and EM of recombinant Pil1 or Lsp1 incubated with liposomes con-taining PC/PS/PE (70%/15%/15%) or, in addition, 1.5% PI(4,5)P2. (B) Negative-stained samples of recom-binant Pil1 or Lsp1 incubated with PC liposomes contain-ing 1.5% PI or PI(4,5)P2. Insets show magnifications of Pil1 bound to liposomes. (A and B) Protein-covered mem-brane tubules are marked with yellow arrowheads. Bars, 100 nm. (C, top) Spin-down experiments of Lsp1 incu-bated with or without PC liposomes containing 1% PI or PI(4,5)P2 as indicated. Proteins bound to liposomes appear in the pellet (P). Lsp1 shows higher affinity to PI(4,5)P2 than to PI. S, supernatant. (bottom) Quantifica-tion of protein amounts in the pellet fractions from spin-down experiments represented in a box plot, consisting of the median (middle of the box), the upper and lower quar-tile (edges of the box), and whiskers at a 1.5–interquartile range distance from the upper and lower quartile. (D) Mea-surement of fluorescence from NBD-labeled pil1S45C (orange emission spectrum) alone as well as in the pres-ence of PC/PS/PI liposomes (purple emission spectrum) or PC/PS/PI(4,5)P2 (green emission spectrum); the buffer control is shown in gray. n = 6.
on April 26, 2012
jcb.rupress.orgD
ownloaded from
Published November 28, 2011
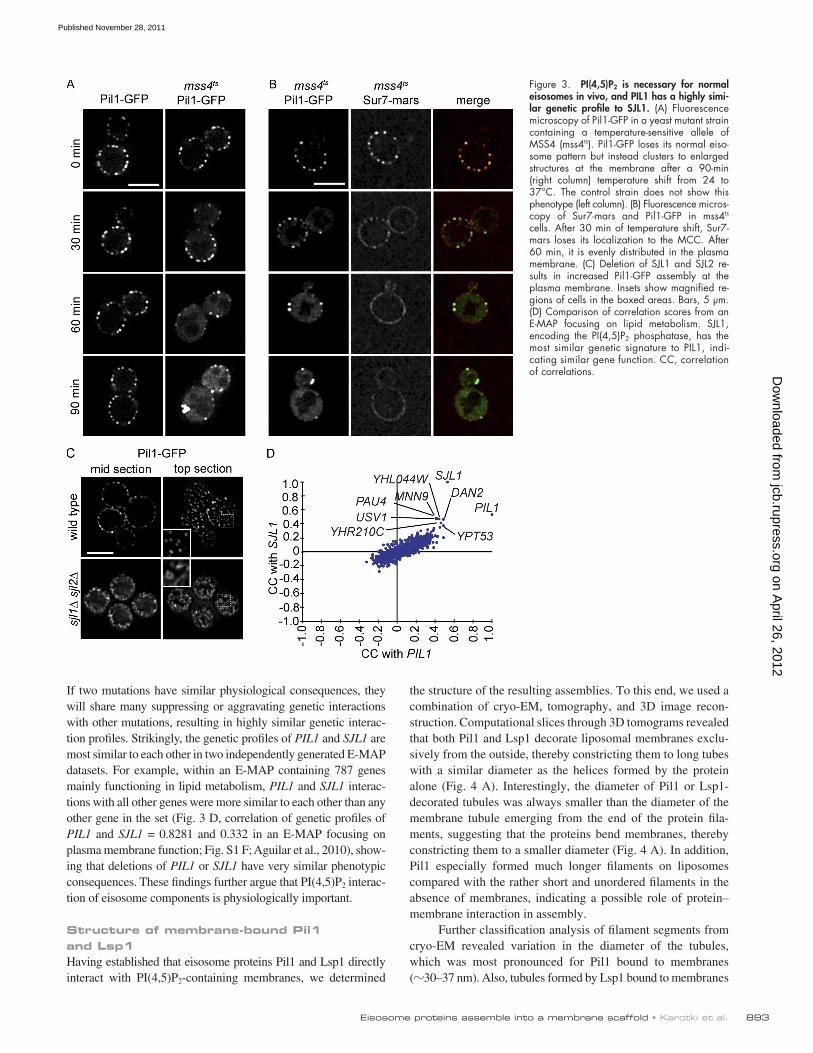
893Eisosome proteins assemble into a membrane scaffold • Karotki et al.
the structure of the resulting assemblies. To this end, we used a combination of cryo-EM, tomography, and 3D image recon-struction. Computational slices through 3D tomograms revealed that both Pil1 and Lsp1 decorate liposomal membranes exclu-sively from the outside, thereby constricting them to long tubes with a similar diameter as the helices formed by the protein alone (Fig. 4 A). Interestingly, the diameter of Pil1 or Lsp1-decorated tubules was always smaller than the diameter of the membrane tubule emerging from the end of the protein fila-ments, suggesting that the proteins bend membranes, thereby constricting them to a smaller diameter (Fig. 4 A). In addition, Pil1 especially formed much longer filaments on liposomes compared with the rather short and unordered filaments in the absence of membranes, indicating a possible role of protein–membrane interaction in assembly.
Further classification analysis of filament segments from cryo-EM revealed variation in the diameter of the tubules, which was most pronounced for Pil1 bound to membranes (30–37 nm). Also, tubules formed by Lsp1 bound to membranes
If two mutations have similar physiological consequences, they will share many suppressing or aggravating genetic interactions with other mutations, resulting in highly similar genetic interac-tion profiles. Strikingly, the genetic profiles of PIL1 and SJL1 are most similar to each other in two independently generated E-MAP datasets. For example, within an E-MAP containing 787 genes mainly functioning in lipid metabolism, PIL1 and SJL1 interac-tions with all other genes were more similar to each other than any other gene in the set (Fig. 3 D, correlation of genetic profiles of PIL1 and SJL1 = 0.8281 and 0.332 in an E-MAP focusing on plasma membrane function; Fig. S1 F; Aguilar et al., 2010), show-ing that deletions of PIL1 or SJL1 have very similar phenotypic consequences. These findings further argue that PI(4,5)P2 interac-tion of eisosome components is physiologically important.
Structure of membrane-bound Pil1 and Lsp1Having established that eisosome proteins Pil1 and Lsp1 directly interact with PI(4,5)P2-containing membranes, we determined
Figure 3. PI(4,5)P2 is necessary for normal eisosomes in vivo, and PIL1 has a highly simi-lar genetic profile to SJL1. (A) Fluorescence microscopy of Pil1-GFP in a yeast mutant strain containing a temperature-sensitive allele of MSS4 (mss4ts). Pil1-GFP loses its normal eiso-some pattern but instead clusters to enlarged structures at the membrane after a 90-min (right column) temperature shift from 24 to 37°C. The control strain does not show this phenotype (left column). (B) Fluorescence micros-copy of Sur7-mars and Pil1-GFP in mss4ts cells. After 30 min of temperature shift, Sur7-mars loses its localization to the MCC. After 60 min, it is evenly distributed in the plasma membrane. (C) Deletion of SJL1 and SJL2 re-sults in increased Pil1-GFP assembly at the plasma membrane. Insets show magnified re-gions of cells in the boxed areas. Bars, 5 µm. (D) Comparison of correlation scores from an E-MAP focusing on lipid metabolism. SJL1, encoding the PI(4,5)P2 phosphatase, has the most similar genetic signature to PIL1, indi-cating similar gene function. CC, correlation of correlations.
on April 26, 2012
jcb.rupress.orgD
ownloaded from
Published November 28, 2011
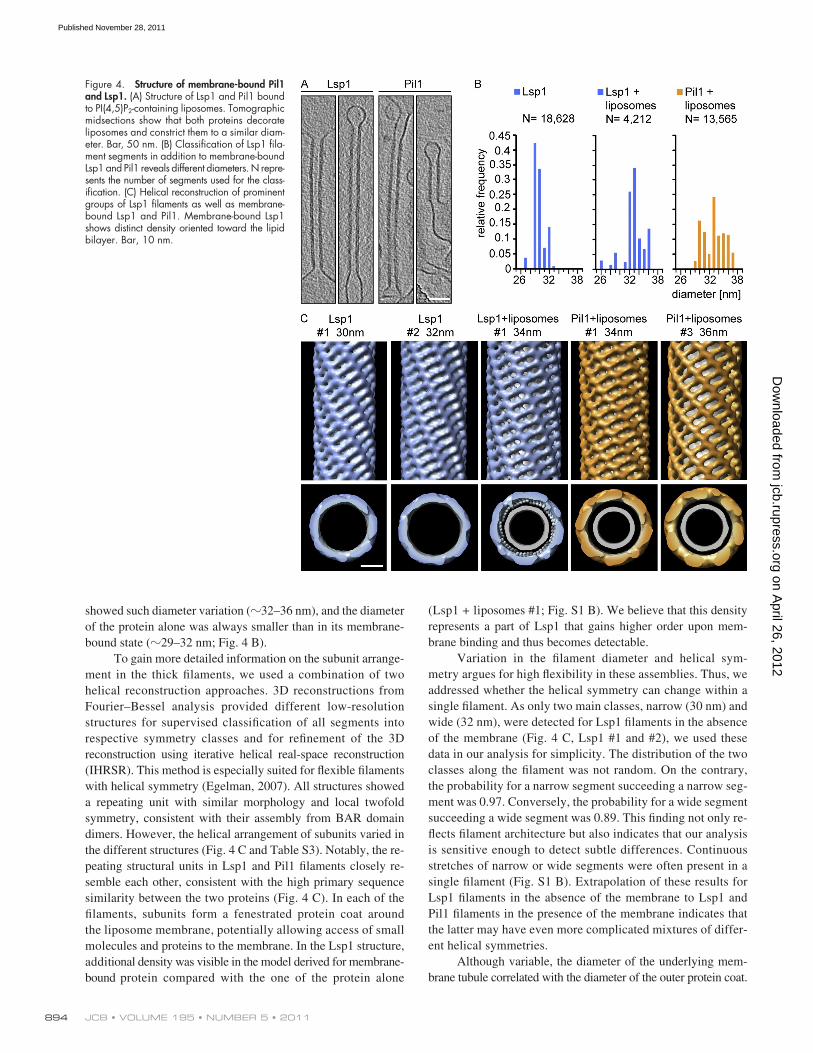
JCB • VOLUME 195 • NUMBER 5 • 2011 894
(Lsp1 + liposomes #1; Fig. S1 B). We believe that this density represents a part of Lsp1 that gains higher order upon mem-brane binding and thus becomes detectable.
Variation in the filament diameter and helical sym-metry argues for high flexibility in these assemblies. Thus, we addressed whether the helical symmetry can change within a single filament. As only two main classes, narrow (30 nm) and wide (32 nm), were detected for Lsp1 filaments in the absence of the membrane (Fig. 4 C, Lsp1 #1 and #2), we used these data in our analysis for simplicity. The distribution of the two classes along the filament was not random. On the contrary, the probability for a narrow segment succeeding a narrow seg-ment was 0.97. Conversely, the probability for a wide segment succeeding a wide segment was 0.89. This finding not only re-flects filament architecture but also indicates that our analysis is sensitive enough to detect subtle differences. Continuous stretches of narrow or wide segments were often present in a single filament (Fig. S1 B). Extrapolation of these results for Lsp1 filaments in the absence of the membrane to Lsp1 and Pil1 filaments in the presence of the membrane indicates that the latter may have even more complicated mixtures of differ-ent helical symmetries.
Although variable, the diameter of the underlying mem-brane tubule correlated with the diameter of the outer protein coat.
showed such diameter variation (32–36 nm), and the diameter of the protein alone was always smaller than in its membrane-bound state (29–32 nm; Fig. 4 B).
To gain more detailed information on the subunit arrange-ment in the thick filaments, we used a combination of two helical reconstruction approaches. 3D reconstructions from Fourier–Bessel analysis provided different low-resolution structures for supervised classification of all segments into respective symmetry classes and for refinement of the 3D reconstruction using iterative helical real-space reconstruction (IHRSR). This method is especially suited for flexible filaments with helical symmetry (Egelman, 2007). All structures showed a repeating unit with similar morphology and local twofold symmetry, consistent with their assembly from BAR domain dimers. However, the helical arrangement of subunits varied in the different structures (Fig. 4 C and Table S3). Notably, the re-peating structural units in Lsp1 and Pil1 filaments closely re-semble each other, consistent with the high primary sequence similarity between the two proteins (Fig. 4 C). In each of the filaments, subunits form a fenestrated protein coat around the liposome membrane, potentially allowing access of small molecules and proteins to the membrane. In the Lsp1 structure, additional density was visible in the model derived for membrane-bound protein compared with the one of the protein alone
Figure 4. Structure of membrane-bound Pil1 and Lsp1. (A) Structure of Lsp1 and Pil1 bound to PI(4,5)P2-containing liposomes. Tomographic midsections show that both proteins decorate liposomes and constrict them to a similar diam-eter. Bar, 50 nm. (B) Classification of Lsp1 fila-ment segments in addition to membrane-bound Lsp1 and Pil1 reveals different diameters. N repre-sents the number of segments used for the class-ification. (C) Helical reconstruction of prominent groups of Lsp1 filaments as well as membrane-bound Lsp1 and Pil1. Membrane-bound Lsp1 shows distinct density oriented toward the lipid bilayer. Bar, 10 nm.
on April 26, 2012
jcb.rupress.orgD
ownloaded from
Published November 28, 2011
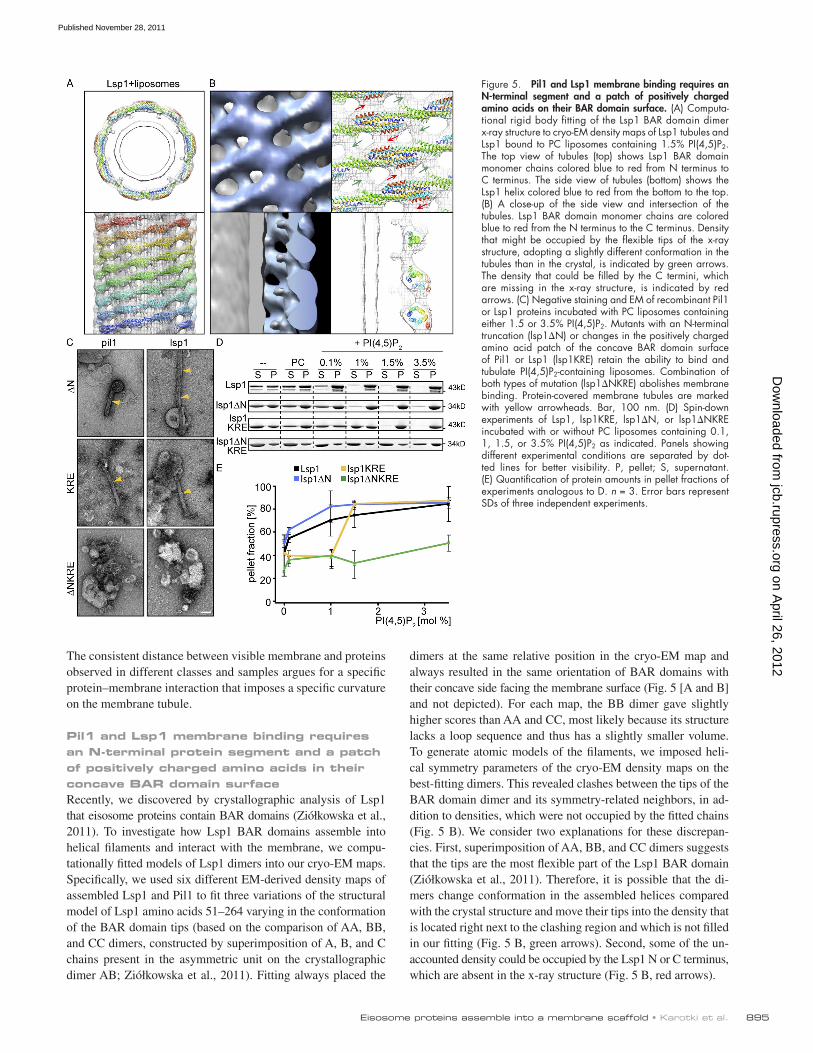
895Eisosome proteins assemble into a membrane scaffold • Karotki et al.
dimers at the same relative position in the cryo-EM map and always resulted in the same orientation of BAR domains with their concave side facing the membrane surface (Fig. 5 [A and B] and not depicted). For each map, the BB dimer gave slightly higher scores than AA and CC, most likely because its structure lacks a loop sequence and thus has a slightly smaller volume. To generate atomic models of the filaments, we imposed heli-cal symmetry parameters of the cryo-EM density maps on the best-fitting dimers. This revealed clashes between the tips of the BAR domain dimer and its symmetry-related neighbors, in ad-dition to densities, which were not occupied by the fitted chains (Fig. 5 B). We consider two explanations for these discrepan-cies. First, superimposition of AA, BB, and CC dimers suggests that the tips are the most flexible part of the Lsp1 BAR domain (Ziółkowska et al., 2011). Therefore, it is possible that the di-mers change conformation in the assembled helices compared with the crystal structure and move their tips into the density that is located right next to the clashing region and which is not filled in our fitting (Fig. 5 B, green arrows). Second, some of the un-accounted density could be occupied by the Lsp1 N or C terminus, which are absent in the x-ray structure (Fig. 5 B, red arrows).
The consistent distance between visible membrane and proteins observed in different classes and samples argues for a specific protein–membrane interaction that imposes a specific curvature on the membrane tubule.
Pil1 and Lsp1 membrane binding requires an N-terminal protein segment and a patch of positively charged amino acids in their concave BAR domain surfaceRecently, we discovered by crystallographic analysis of Lsp1 that eisosome proteins contain BAR domains (Ziółkowska et al., 2011). To investigate how Lsp1 BAR domains assemble into helical filaments and interact with the membrane, we compu-tationally fitted models of Lsp1 dimers into our cryo-EM maps. Specifically, we used six different EM-derived density maps of assembled Lsp1 and Pil1 to fit three variations of the structural model of Lsp1 amino acids 51–264 varying in the conformation of the BAR domain tips (based on the comparison of AA, BB, and CC dimers, constructed by superimposition of A, B, and C chains present in the asymmetric unit on the crystallographic dimer AB; Ziółkowska et al., 2011). Fitting always placed the
Figure 5. Pil1 and Lsp1 membrane binding requires an N-terminal segment and a patch of positively charged amino acids on their BAR domain surface. (A) Computa-tional rigid body fitting of the Lsp1 BAR domain dimer x-ray structure to cryo-EM density maps of Lsp1 tubules and Lsp1 bound to PC liposomes containing 1.5% PI(4,5)P2. The top view of tubules (top) shows Lsp1 BAR domain monomer chains colored blue to red from N terminus to C terminus. The side view of tubules (bottom) shows the Lsp1 helix colored blue to red from the bottom to the top. (B) A close-up of the side view and intersection of the tubules. Lsp1 BAR domain monomer chains are colored blue to red from the N terminus to the C terminus. Density that might be occupied by the flexible tips of the x-ray structure, adopting a slightly different conformation in the tubules than in the crystal, is indicated by green arrows. The density that could be filled by the C termini, which are missing in the x-ray structure, is indicated by red arrows. (C) Negative staining and EM of recombinant Pil1 or Lsp1 proteins incubated with PC liposomes containing either 1.5 or 3.5% PI(4,5)P2. Mutants with an N-terminal truncation (lsp1N) or changes in the positively charged amino acid patch of the concave BAR domain surface of Pil1 or Lsp1 (lsp1KRE) retain the ability to bind and tubulate PI(4,5)P2-containing liposomes. Combination of both types of mutation (lsp1NKRE) abolishes membrane binding. Protein-covered membrane tubules are marked with yellow arrowheads. Bar, 100 nm. (D) Spin-down experiments of Lsp1, lsp1KRE, lsp1N, or lsp1NKRE incubated with or without PC liposomes containing 0.1, 1, 1.5, or 3.5% PI(4,5)P2 as indicated. Panels showing different experimental conditions are separated by dot-ted lines for better visibility. P, pellet; S, supernatant. (E) Quantification of protein amounts in pellet fractions of experiments analogous to D. n = 3. Error bars represent SDs of three independent experiments.
on April 26, 2012
jcb.rupress.orgD
ownloaded from
Published November 28, 2011
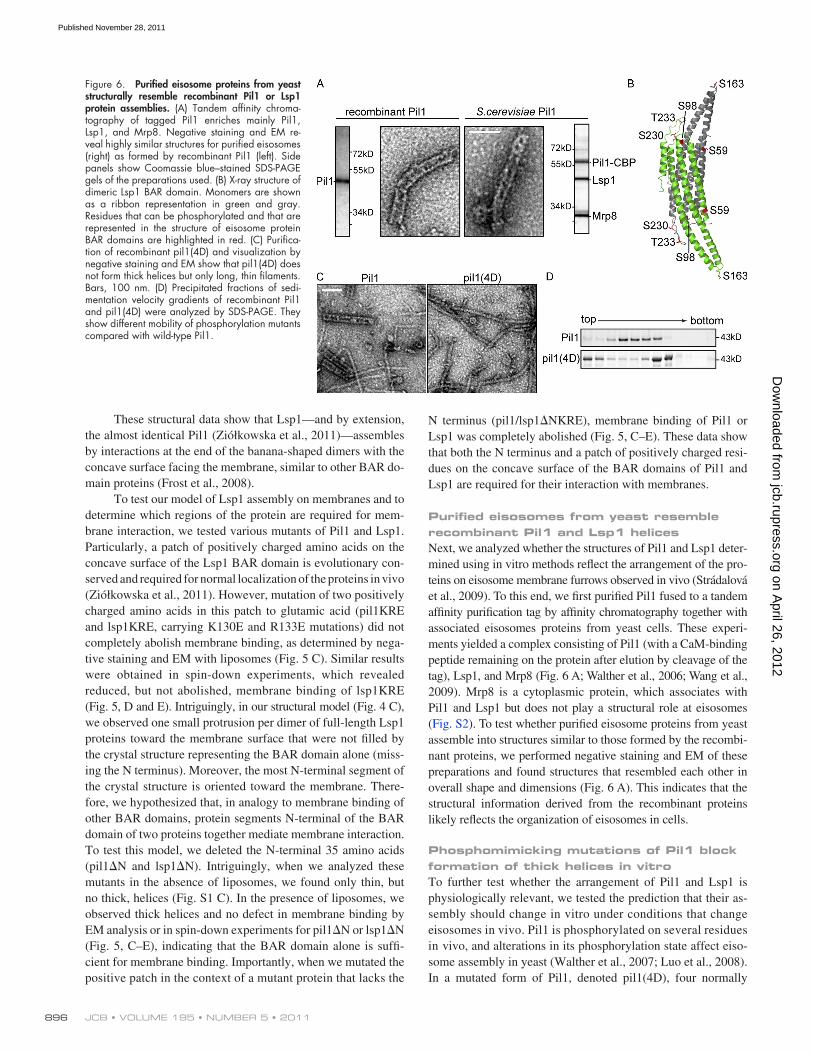
JCB • VOLUME 195 • NUMBER 5 • 2011 896
N terminus (pil1/lsp1NKRE), membrane binding of Pil1 or Lsp1 was completely abolished (Fig. 5, C–E). These data show that both the N terminus and a patch of positively charged resi-dues on the concave surface of the BAR domains of Pil1 and Lsp1 are required for their interaction with membranes.
Purified eisosomes from yeast resemble recombinant Pil1 and Lsp1 helicesNext, we analyzed whether the structures of Pil1 and Lsp1 deter-mined using in vitro methods reflect the arrangement of the pro-teins on eisosome membrane furrows observed in vivo (Strádalová et al., 2009). To this end, we first purified Pil1 fused to a tandem affinity purification tag by affinity chromatography together with associated eisosomes proteins from yeast cells. These experi-ments yielded a complex consisting of Pil1 (with a CaM-binding peptide remaining on the protein after elution by cleavage of the tag), Lsp1, and Mrp8 (Fig. 6 A; Walther et al., 2006; Wang et al., 2009). Mrp8 is a cytoplasmic protein, which associates with Pil1 and Lsp1 but does not play a structural role at eisosomes (Fig. S2). To test whether purified eisosome proteins from yeast assemble into structures similar to those formed by the recombi-nant proteins, we performed negative staining and EM of these preparations and found structures that resembled each other in overall shape and dimensions (Fig. 6 A). This indicates that the structural information derived from the recombinant proteins likely reflects the organization of eisosomes in cells.
Phosphomimicking mutations of Pil1 block formation of thick helices in vitroTo further test whether the arrangement of Pil1 and Lsp1 is physiologically relevant, we tested the prediction that their as-sembly should change in vitro under conditions that change eisosomes in vivo. Pil1 is phosphorylated on several residues in vivo, and alterations in its phosphorylation state affect eiso-some assembly in yeast (Walther et al., 2007; Luo et al., 2008). In a mutated form of Pil1, denoted pil1(4D), four normally
These structural data show that Lsp1—and by extension, the almost identical Pil1 (Ziółkowska et al., 2011)—assembles by interactions at the end of the banana-shaped dimers with the concave surface facing the membrane, similar to other BAR do-main proteins (Frost et al., 2008).
To test our model of Lsp1 assembly on membranes and to determine which regions of the protein are required for mem-brane interaction, we tested various mutants of Pil1 and Lsp1. Particularly, a patch of positively charged amino acids on the concave surface of the Lsp1 BAR domain is evolutionary con-served and required for normal localization of the proteins in vivo (Ziółkowska et al., 2011). However, mutation of two positively charged amino acids in this patch to glutamic acid (pil1KRE and lsp1KRE, carrying K130E and R133E mutations) did not completely abolish membrane binding, as determined by nega-tive staining and EM with liposomes (Fig. 5 C). Similar results were obtained in spin-down experiments, which revealed reduced, but not abolished, membrane binding of lsp1KRE (Fig. 5, D and E). Intriguingly, in our structural model (Fig. 4 C), we observed one small protrusion per dimer of full-length Lsp1 proteins toward the membrane surface that were not filled by the crystal structure representing the BAR domain alone (miss-ing the N terminus). Moreover, the most N-terminal segment of the crystal structure is oriented toward the membrane. There-fore, we hypothesized that, in analogy to membrane binding of other BAR domains, protein segments N-terminal of the BAR domain of two proteins together mediate membrane interaction. To test this model, we deleted the N-terminal 35 amino acids (pil1N and lsp1N). Intriguingly, when we analyzed these mutants in the absence of liposomes, we found only thin, but no thick, helices (Fig. S1 C). In the presence of liposomes, we observed thick helices and no defect in membrane binding by EM analysis or in spin-down experiments for pil1N or lsp1N (Fig. 5, C–E), indicating that the BAR domain alone is suffi-cient for membrane binding. Importantly, when we mutated the positive patch in the context of a mutant protein that lacks the
Figure 6. Purified eisosome proteins from yeast structurally resemble recombinant Pil1 or Lsp1 protein assemblies. (A) Tandem affinity chroma-tography of tagged Pil1 enriches mainly Pil1, Lsp1, and Mrp8. Negative staining and EM re-veal highly similar structures for purified eisosomes (right) as formed by recombinant Pil1 (left). Side panels show Coomassie blue–stained SDS-PAGE gels of the preparations used. (B) X-ray structure of dimeric Lsp1 BAR domain. Monomers are shown as a ribbon representation in green and gray. Residues that can be phosphorylated and that are represented in the structure of eisosome protein BAR domains are highlighted in red. (C) Purifica-tion of recombinant pil1(4D) and visualization by negative staining and EM show that pil1(4D) does not form thick helices but only long, thin filaments. Bars, 100 nm. (D) Precipitated fractions of sedi-mentation velocity gradients of recombinant Pil1 and pil1(4D) were analyzed by SDS-PAGE. They show different mobility of phosphorylation mutants compared with wild-type Pil1.
on April 26, 2012
jcb.rupress.orgD
ownloaded from
Published November 28, 2011
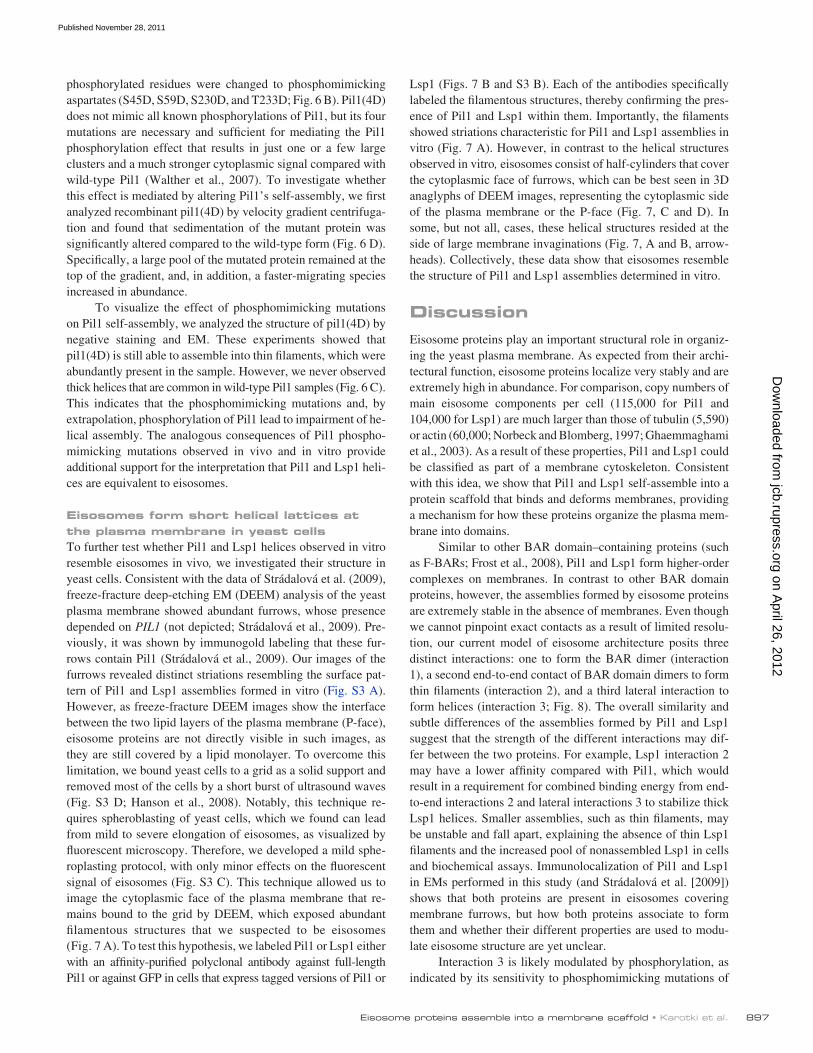
897Eisosome proteins assemble into a membrane scaffold • Karotki et al.
Lsp1 (Figs. 7 B and S3 B). Each of the antibodies specifically labeled the filamentous structures, thereby confirming the pres-ence of Pil1 and Lsp1 within them. Importantly, the filaments showed striations characteristic for Pil1 and Lsp1 assemblies in vitro (Fig. 7 A). However, in contrast to the helical structures observed in vitro, eisosomes consist of half-cylinders that cover the cytoplasmic face of furrows, which can be best seen in 3D anaglyphs of DEEM images, representing the cytoplasmic side of the plasma membrane or the P-face (Fig. 7, C and D). In some, but not all, cases, these helical structures resided at the side of large membrane invaginations (Fig. 7, A and B, arrow-heads). Collectively, these data show that eisosomes resemble the structure of Pil1 and Lsp1 assemblies determined in vitro.
DiscussionEisosome proteins play an important structural role in organiz-ing the yeast plasma membrane. As expected from their archi-tectural function, eisosome proteins localize very stably and are extremely high in abundance. For comparison, copy numbers of main eisosome components per cell (115,000 for Pil1 and 104,000 for Lsp1) are much larger than those of tubulin (5,590) or actin (60,000; Norbeck and Blomberg, 1997; Ghaemmaghami et al., 2003). As a result of these properties, Pil1 and Lsp1 could be classified as part of a membrane cytoskeleton. Consistent with this idea, we show that Pil1 and Lsp1 self-assemble into a protein scaffold that binds and deforms membranes, providing a mechanism for how these proteins organize the plasma mem-brane into domains.
Similar to other BAR domain–containing proteins (such as F-BARs; Frost et al., 2008), Pil1 and Lsp1 form higher-order complexes on membranes. In contrast to other BAR domain proteins, however, the assemblies formed by eisosome proteins are extremely stable in the absence of membranes. Even though we cannot pinpoint exact contacts as a result of limited resolu-tion, our current model of eisosome architecture posits three distinct interactions: one to form the BAR dimer (interaction 1), a second end-to-end contact of BAR domain dimers to form thin filaments (interaction 2), and a third lateral interaction to form helices (interaction 3; Fig. 8). The overall similarity and subtle differences of the assemblies formed by Pil1 and Lsp1 suggest that the strength of the different interactions may dif-fer between the two proteins. For example, Lsp1 interaction 2 may have a lower affinity compared with Pil1, which would result in a requirement for combined binding energy from end-to-end interactions 2 and lateral interactions 3 to stabilize thick Lsp1 helices. Smaller assemblies, such as thin filaments, may be unstable and fall apart, explaining the absence of thin Lsp1 filaments and the increased pool of nonassembled Lsp1 in cells and biochemical assays. Immunolocalization of Pil1 and Lsp1 in EMs performed in this study (and Strádalová et al. [2009]) shows that both proteins are present in eisosomes covering membrane furrows, but how both proteins associate to form them and whether their different properties are used to modu-late eisosome structure are yet unclear.
Interaction 3 is likely modulated by phosphorylation, as indicated by its sensitivity to phosphomimicking mutations of
phosphorylated residues were changed to phosphomimicking aspartates (S45D, S59D, S230D, and T233D; Fig. 6 B). Pil1(4D) does not mimic all known phosphorylations of Pil1, but its four mutations are necessary and sufficient for mediating the Pil1 phosphorylation effect that results in just one or a few large clusters and a much stronger cytoplasmic signal compared with wild-type Pil1 (Walther et al., 2007). To investigate whether this effect is mediated by altering Pil1’s self-assembly, we first analyzed recombinant pil1(4D) by velocity gradient centrifuga-tion and found that sedimentation of the mutant protein was significantly altered compared to the wild-type form (Fig. 6 D). Specifically, a large pool of the mutated protein remained at the top of the gradient, and, in addition, a faster-migrating species increased in abundance.
To visualize the effect of phosphomimicking mutations on Pil1 self-assembly, we analyzed the structure of pil1(4D) by negative staining and EM. These experiments showed that pil1(4D) is still able to assemble into thin filaments, which were abundantly present in the sample. However, we never observed thick helices that are common in wild-type Pil1 samples (Fig. 6 C). This indicates that the phosphomimicking mutations and, by extrapolation, phosphorylation of Pil1 lead to impairment of he-lical assembly. The analogous consequences of Pil1 phospho-mimicking mutations observed in vivo and in vitro provide additional support for the interpretation that Pil1 and Lsp1 heli-ces are equivalent to eisosomes.
Eisosomes form short helical lattices at the plasma membrane in yeast cellsTo further test whether Pil1 and Lsp1 helices observed in vitro resemble eisosomes in vivo, we investigated their structure in yeast cells. Consistent with the data of Strádalová et al. (2009), freeze-fracture deep-etching EM (DEEM) analysis of the yeast plasma membrane showed abundant furrows, whose presence depended on PIL1 (not depicted; Strádalová et al., 2009). Pre-viously, it was shown by immunogold labeling that these fur-rows contain Pil1 (Strádalová et al., 2009). Our images of the furrows revealed distinct striations resembling the surface pat-tern of Pil1 and Lsp1 assemblies formed in vitro (Fig. S3 A). However, as freeze-fracture DEEM images show the interface between the two lipid layers of the plasma membrane (P-face), eisosome proteins are not directly visible in such images, as they are still covered by a lipid monolayer. To overcome this limitation, we bound yeast cells to a grid as a solid support and removed most of the cells by a short burst of ultrasound waves (Fig. S3 D; Hanson et al., 2008). Notably, this technique re-quires spheroblasting of yeast cells, which we found can lead from mild to severe elongation of eisosomes, as visualized by fluorescent microscopy. Therefore, we developed a mild sphe-roplasting protocol, with only minor effects on the fluorescent signal of eisosomes (Fig. S3 C). This technique allowed us to image the cytoplasmic face of the plasma membrane that re-mains bound to the grid by DEEM, which exposed abundant filamentous structures that we suspected to be eisosomes (Fig. 7 A). To test this hypothesis, we labeled Pil1 or Lsp1 either with an affinity-purified polyclonal antibody against full-length Pil1 or against GFP in cells that express tagged versions of Pil1 or
on April 26, 2012
jcb.rupress.orgD
ownloaded from
Published November 28, 2011
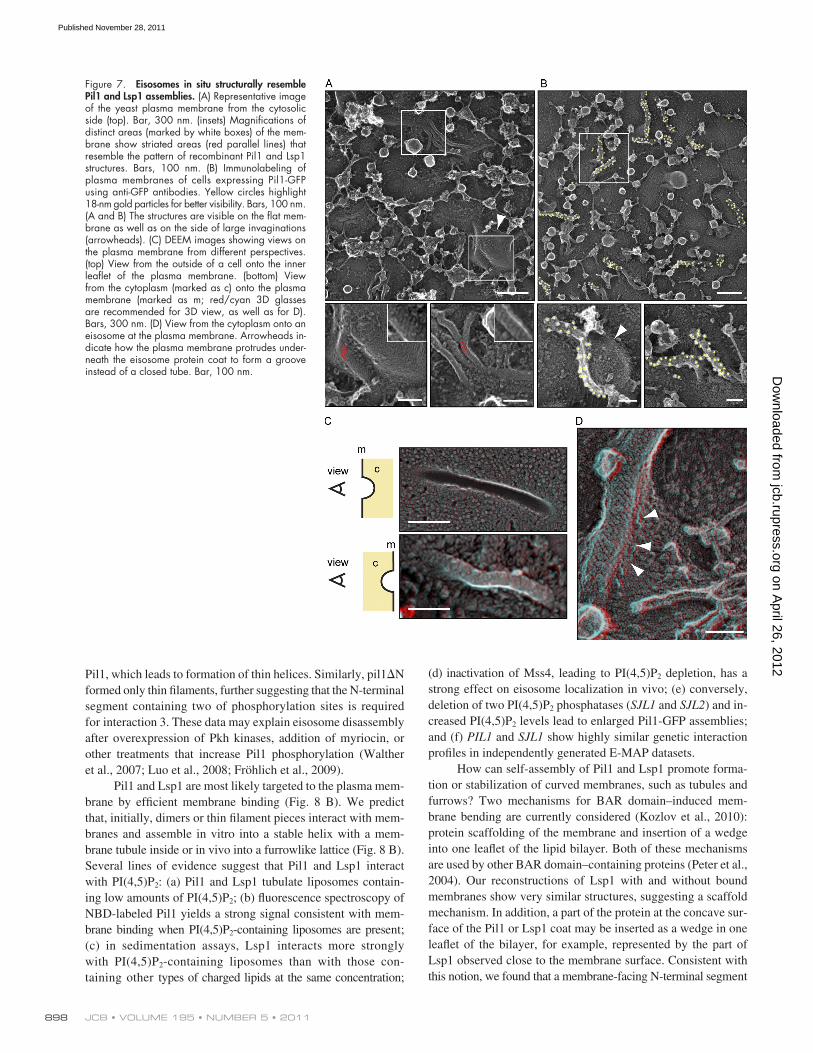
JCB • VOLUME 195 • NUMBER 5 • 2011 898
(d) inactivation of Mss4, leading to PI(4,5)P2 depletion, has a strong effect on eisosome localization in vivo; (e) conversely, deletion of two PI(4,5)P2 phosphatases (SJL1 and SJL2) and in-creased PI(4,5)P2 levels lead to enlarged Pil1-GFP assemblies; and (f) PIL1 and SJL1 show highly similar genetic interaction profiles in independently generated E-MAP datasets.
How can self-assembly of Pil1 and Lsp1 promote forma-tion or stabilization of curved membranes, such as tubules and furrows? Two mechanisms for BAR domain–induced mem-brane bending are currently considered (Kozlov et al., 2010): protein scaffolding of the membrane and insertion of a wedge into one leaflet of the lipid bilayer. Both of these mechanisms are used by other BAR domain–containing proteins (Peter et al., 2004). Our reconstructions of Lsp1 with and without bound membranes show very similar structures, suggesting a scaffold mechanism. In addition, a part of the protein at the concave sur-face of the Pil1 or Lsp1 coat may be inserted as a wedge in one leaflet of the bilayer, for example, represented by the part of Lsp1 observed close to the membrane surface. Consistent with this notion, we found that a membrane-facing N-terminal segment
Pil1, which leads to formation of thin helices. Similarly, pil1N formed only thin filaments, further suggesting that the N-terminal segment containing two of phosphorylation sites is required for interaction 3. These data may explain eisosome disassembly after overexpression of Pkh kinases, addition of myriocin, or other treatments that increase Pil1 phosphorylation (Walther et al., 2007; Luo et al., 2008; Fröhlich et al., 2009).
Pil1 and Lsp1 are most likely targeted to the plasma mem-brane by efficient membrane binding (Fig. 8 B). We predict that, initially, dimers or thin filament pieces interact with mem-branes and assemble in vitro into a stable helix with a mem-brane tubule inside or in vivo into a furrowlike lattice (Fig. 8 B). Several lines of evidence suggest that Pil1 and Lsp1 interact with PI(4,5)P2: (a) Pil1 and Lsp1 tubulate liposomes contain-ing low amounts of PI(4,5)P2; (b) fluorescence spectroscopy of NBD-labeled Pil1 yields a strong signal consistent with mem-brane binding when PI(4,5)P2-containing liposomes are present; (c) in sedimentation assays, Lsp1 interacts more strongly with PI(4,5)P2-containing liposomes than with those con-taining other types of charged lipids at the same concentration;
Figure 7. Eisosomes in situ structurally resemble Pil1 and Lsp1 assemblies. (A) Representative image of the yeast plasma membrane from the cytosolic side (top). Bar, 300 nm. (insets) Magnifications of distinct areas (marked by white boxes) of the mem-brane show striated areas (red parallel lines) that resemble the pattern of recombinant Pil1 and Lsp1 structures. Bars, 100 nm. (B) Immunolabeling of plasma membranes of cells expressing Pil1-GFP using anti-GFP antibodies. Yellow circles highlight 18-nm gold particles for better visibility. Bars, 100 nm. (A and B) The structures are visible on the flat mem-brane as well as on the side of large invaginations (arrowheads). (C) DEEM images showing views on the plasma membrane from different perspectives. (top) View from the outside of a cell onto the inner leaflet of the plasma membrane. (bottom) View from the cytoplasm (marked as c) onto the plasma membrane (marked as m; red/cyan 3D glasses are recommended for 3D view, as well as for D). Bars, 300 nm. (D) View from the cytoplasm onto an eisosome at the plasma membrane. Arrowheads in-dicate how the plasma membrane protrudes under-neath the eisosome protein coat to form a groove instead of a closed tube. Bar, 100 nm.
on April 26, 2012
jcb.rupress.orgD
ownloaded from
Published November 28, 2011
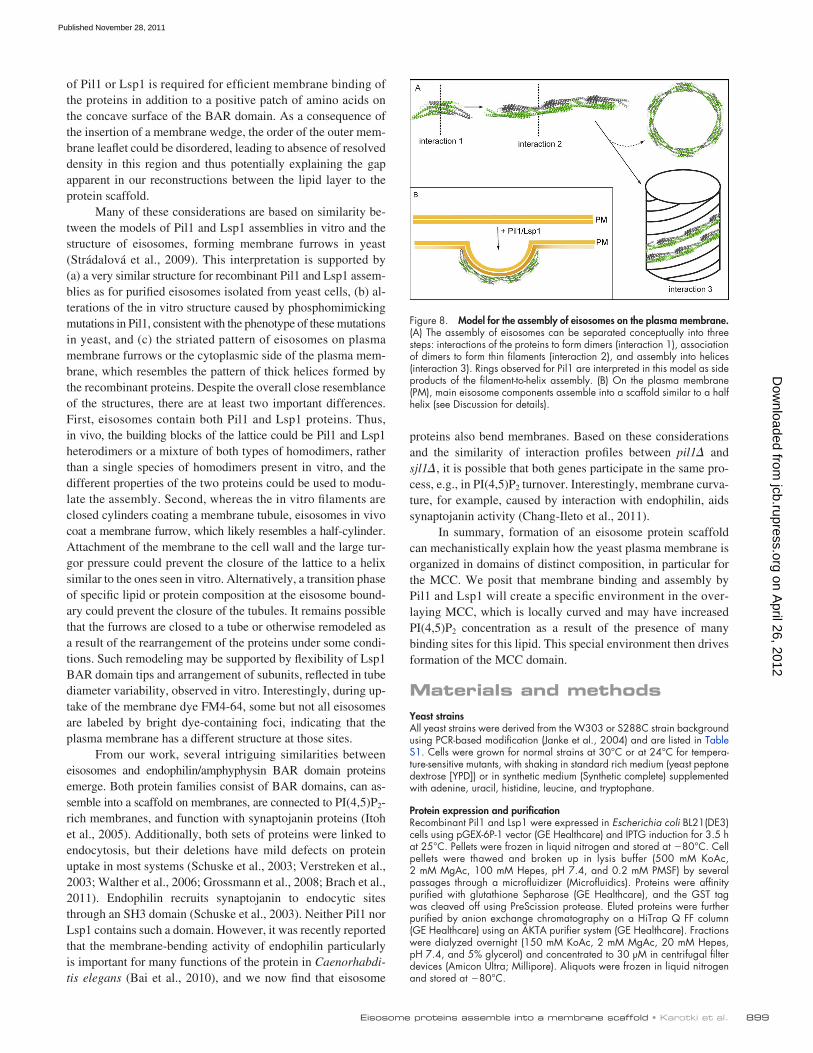
899Eisosome proteins assemble into a membrane scaffold • Karotki et al.
proteins also bend membranes. Based on these considerations and the similarity of interaction profiles between pil1 and sjl1, it is possible that both genes participate in the same pro-cess, e.g., in PI(4,5)P2 turnover. Interestingly, membrane curva-ture, for example, caused by interaction with endophilin, aids synaptojanin activity (Chang-Ileto et al., 2011).
In summary, formation of an eisosome protein scaffold can mechanistically explain how the yeast plasma membrane is organized in domains of distinct composition, in particular for the MCC. We posit that membrane binding and assembly by Pil1 and Lsp1 will create a specific environment in the over-laying MCC, which is locally curved and may have increased PI(4,5)P2 concentration as a result of the presence of many binding sites for this lipid. This special environment then drives formation of the MCC domain.
Materials and methodsYeast strainsAll yeast strains were derived from the W303 or S288C strain background using PCR-based modification (Janke et al., 2004) and are listed in Table S1. Cells were grown for normal strains at 30°C or at 24°C for tempera-ture-sensitive mutants, with shaking in standard rich medium (yeast peptone dextrose [YPD]) or in synthetic medium (Synthetic complete) supplemented with adenine, uracil, histidine, leucine, and tryptophane.
Protein expression and purificationRecombinant Pil1 and Lsp1 were expressed in Escherichia coli BL21(DE3) cells using pGEX-6P-1 vector (GE Healthcare) and IPTG induction for 3.5 h at 25°C. Pellets were frozen in liquid nitrogen and stored at 80°C. Cell pellets were thawed and broken up in lysis buffer (500 mM KoAc, 2 mM MgAc, 100 mM Hepes, pH 7.4, and 0.2 mM PMSF) by several passages through a microfluidizer (Microfluidics). Proteins were affinity purified with glutathione Sepharose (GE Healthcare), and the GST tag was cleaved off using PreScission protease. Eluted proteins were further purified by anion exchange chromatography on a HiTrap Q FF column (GE Healthcare) using an ÄKTA purifier system (GE Healthcare). Fractions were dialyzed overnight (150 mM KoAc, 2 mM MgAc, 20 mM Hepes, pH 7.4, and 5% glycerol) and concentrated to 30 µM in centrifugal filter devices (Amicon Ultra; Millipore). Aliquots were frozen in liquid nitrogen and stored at 80°C.
of Pil1 or Lsp1 is required for efficient membrane binding of the proteins in addition to a positive patch of amino acids on the concave surface of the BAR domain. As a consequence of the insertion of a membrane wedge, the order of the outer mem-brane leaflet could be disordered, leading to absence of resolved density in this region and thus potentially explaining the gap apparent in our reconstructions between the lipid layer to the protein scaffold.
Many of these considerations are based on similarity be-tween the models of Pil1 and Lsp1 assemblies in vitro and the structure of eisosomes, forming membrane furrows in yeast (Strádalová et al., 2009). This interpretation is supported by (a) a very similar structure for recombinant Pil1 and Lsp1 assem-blies as for purified eisosomes isolated from yeast cells, (b) al-terations of the in vitro structure caused by phosphomimicking mutations in Pil1, consistent with the phenotype of these mutations in yeast, and (c) the striated pattern of eisosomes on plasma membrane furrows or the cytoplasmic side of the plasma mem-brane, which resembles the pattern of thick helices formed by the recombinant proteins. Despite the overall close resemblance of the structures, there are at least two important differences. First, eisosomes contain both Pil1 and Lsp1 proteins. Thus, in vivo, the building blocks of the lattice could be Pil1 and Lsp1 heterodimers or a mixture of both types of homodimers, rather than a single species of homodimers present in vitro, and the different properties of the two proteins could be used to modu-late the assembly. Second, whereas the in vitro filaments are closed cylinders coating a membrane tubule, eisosomes in vivo coat a membrane furrow, which likely resembles a half-cylinder. Attachment of the membrane to the cell wall and the large tur-gor pressure could prevent the closure of the lattice to a helix similar to the ones seen in vitro. Alternatively, a transition phase of specific lipid or protein composition at the eisosome bound-ary could prevent the closure of the tubules. It remains possible that the furrows are closed to a tube or otherwise remodeled as a result of the rearrangement of the proteins under some condi-tions. Such remodeling may be supported by flexibility of Lsp1 BAR domain tips and arrangement of subunits, reflected in tube diameter variability, observed in vitro. Interestingly, during up-take of the membrane dye FM4-64, some but not all eisosomes are labeled by bright dye-containing foci, indicating that the plasma membrane has a different structure at those sites.
From our work, several intriguing similarities between eisosomes and endophilin/amphyphysin BAR domain proteins emerge. Both protein families consist of BAR domains, can as-semble into a scaffold on membranes, are connected to PI(4,5)P2-rich membranes, and function with synaptojanin proteins (Itoh et al., 2005). Additionally, both sets of proteins were linked to endocytosis, but their deletions have mild defects on protein uptake in most systems (Schuske et al., 2003; Verstreken et al., 2003; Walther et al., 2006; Grossmann et al., 2008; Brach et al., 2011). Endophilin recruits synaptojanin to endocytic sites through an SH3 domain (Schuske et al., 2003). Neither Pil1 nor Lsp1 contains such a domain. However, it was recently reported that the membrane-bending activity of endophilin particularly is important for many functions of the protein in Caenorhabdi-tis elegans (Bai et al., 2010), and we now find that eisosome
Figure 8. Model for the assembly of eisosomes on the plasma membrane. (A) The assembly of eisosomes can be separated conceptually into three steps: interactions of the proteins to form dimers (interaction 1), association of dimers to form thin filaments (interaction 2), and assembly into helices (interaction 3). Rings observed for Pil1 are interpreted in this model as side products of the filament-to-helix assembly. (B) On the plasma membrane (PM), main eisosome components assemble into a scaffold similar to a half helix (see Discussion for details).
on April 26, 2012
jcb.rupress.orgD
ownloaded from
Published November 28, 2011
JCB • VOLUME 195 • NUMBER 5 • 2011 900
along the tilt axis ensured that the missing wedge artifact present in all tomo-graphic data was nearly evenly averaged in the final structure, yielding an isotropic resolution in all directions.
Helical reconstruction218 cryo-EM images were computationally down-sampled by a factor of two, giving a final pixel size of 0.44 nm. Contrast transfer function pa-rameters were determined in the micrographs, and corresponding image distortions were corrected for in Bsoft. Filaments were traced in the images and cut into overlapping segments (90% overlap). Subimages (150 × 150 pixels), each containing a filament segment, were extracted (Table S2). Subimages were rotated so that the long axis of the segment was parallel to the image vertical axis. Rotated subimages were aligned horizontally to center the segments. The average of all segments was used as a template, and the process of averaging and alignment was iterated five times in SPIDER (Frank et al., 1996). Horizontally aligned images were subjected to multivariate data analysis and classification in SPIDER. The segments were first classified into 100 classes for each sample. The size of the Lsp1 data-set was reduced from 55,000 to 20,000 segments for classification. Class averages revealed variation in the datasets, most notably variation in the filament diameter. The initial horizontal alignment was improved by multi-reference alignment, using the first class means as references. These more accurately aligned segments were reclassified into 100 classes using the first 20 eigenimages. 3D reconstructions were generated by Fourier–Bessel analysis of the refined class averages using the Burnham-Brandeis Helical Package (designed by N. Volkmann, Sanford-Burnham Medical Research Institute, La Jolla, CA), an updated version of the original Brandeis Helical Package (Owen et al., 1996). In an attempt to detect all most prominent helical symmetries in the data, all Fourier transforms of class averages displaying strong layer lines consistent with either an even or an odd Bes-sel order were analyzed. Layer line indexes were assigned for 6 Fourier transforms of Lsp1 and Lsp-PI(4,5)P2 class averages and for 12 Fourier transforms of Pil1-PI(4,5)P2. In some cases, a few different assignments of Bessel orders were possible, and they were all considered in further analysis. 3D density maps were calculated from the Fourier transforms. The features of the repeating structural unit were similar between the den-sity maps and also to the tomographic reconstruction of an Lsp1 filament, confirming that the layer line indexes and Bessel orders were assigned correctly. In the few ambiguous cases, the assignment, which resulted in a density map with consistent features to the other maps, was chosen to be the correct assignment.
Fourier–Bessel analysis provided multiple low-resolution template structures for the 3D reconstruction using IHRSR (Egelman, 2007). Several template structures with unique helical parameters were used: two for Lsp1, three for Lsp1-PI(4,5)P2, and four for Pil1-PI(4,5)P2 (Table S3). The filament segments that had been prealigned horizontally were classified into groups with different helical parameters and symmetries using projections from the template structures as references. Segment positions were adjusted hori-zontally to account for inaccuracies in the initial alignment against a com-mon reference. IHRSR was run for five iterations for each group of segments. 80% of the best-correlating segments were chosen at each round to the re-construction to count in possible inaccuracies in classification. The filament segments were reclassified against the refined models and five iterations of IHRSR were run. Because the starting models already had the correct heli-cal symmetries present in the data, the helical symmetry parameters were kept constant during the iterations.
X-ray structure fitting to EM mapsTwofold symmetric Lsp1 dimers (AA, BB, and CC) were first generated from the three chains in the crystallographic asymmetric unit (A, B, and C) by superposition of the chains on the crystallographic dimer (AB) in the program LSQMAN (G.J. Kleywegt, Uppsala Software Factory, Sweden; Kleywegt, 1996). Only the core part of the dimer was used in the superposition. All three types of dimers—AA, BB and, CC—were fitted computationally on the six different cryo-EM density maps of Lsp1 and Pil1 filaments. Fitting was performed in CoLoRes (Situs package; Chacón and Wriggers, 2002) by calculating Laplacian-filtered correla-tion between the x-ray structure and the cryo-EM reconstruction to the resolution limit of each reconstruction. Helical symmetry of each of the reconstructions was applied on the best-fitting x-ray structure to gener-ate atomic models of the filaments. For visualization in the University of California San Francisco Chimera program, the isosurface levels of cryo-EM reconstructions were set to correspond to the total mass of fitted Lsp1 structures, taking into account the presence of a membrane in some of the structures.
Sedimentation velocity gradients100 µg of recombinant protein was loaded in 150 µl of buffer (150 mM KoAc, 2 mM MgAc, and 20 mM Hepes, pH7.4) on 12 ml of 10–40% su-crose gradient. Gradients were generated using a gradient master (Bio-Comp Systems, Inc.). The gradients were spun in an ultracentrifuge (WX Ultra Series; Thermo Fisher Scientific) equipped with a TH-641 rotor at 40,000 rpm at 4°C for 3.5 h. 1-ml fractions were manually pipetted, and proteins were precipitated using TCA and analyzed by SDS-PAGE and Coomassie blue staining.
Vesicle preparationLipids in desired ratios (mole/mole) were mixed and dried in glass vials under a nitrogen stream. Before use, mixtures were desiccated under a vacuum for 2 h and hydrated in buffer. To obtain unilamellar vesicles, lipids were subjected to 5 cycles of freeze-thaw and extruded through a 200-nm pore-size polycarbonate filter (GE Healthcare) using a mini-extruder (Avanti Polar Lipids, Inc.).
Fluorescence microscopyFor fluorescence microscopy, cells were grown in synthetic media to OD600 = 0.5, mounted on coverslips covered with concanavalin A, and imaged either with a laser-based spinning-disk microscope (Andor Technology, TILL Photonics, and Agilent Technologies) using a 100× total internal re-flection fluorescence microscopy objective (1.45 NA; Olympus) or using a DeltaVision system (Applied Precision) equipped with a microscope (IX-71; Olympus), a 1.35 NA 100× objective (Olympus), and a CoolSNAP HQ camera (Photometrics).
Spin-down assayLiposome samples (4 mM) were incubated in the presence or absence of 3.75 µM recombinant protein in 40 µl of buffer (150 mM KoAc, 2 mM MgAc, and 20 mM Hepes, pH 7.4) for 20 min at room temperature. Sam-ples were centrifuged in an ultracentrifuge (Discovery M120 SE; Thermo Fisher Scientific) using an S120-AT3 rotor at 85,000 rpm at 4°C for 30 min. Pellets and supernatants were separated and brought to 42 µl with SDS loading buffer, and both fractions were analyzed by SDS-PAGE and Coo-massie blue staining.
EMFor negative staining, 3.5 µl of purified Pil1 or Lsp1 protein or protein lipo-some suspension was added on glow-discharged continuous carbon-coated Cu grids. After blotting with filter paper, the grid surface was stained with 1% uranyl acetate solution. Images were taken at magnifica-tions of 23,000–31,000× using either a microscope (C120; Philips) equipped with a 1kx1k charge-coupled device camera (Gatan, Inc) and operated at 120 kiloelectron volts or on a microscope (Tecnai F20; FEI Company) equipped with a 4kx4k charge-coupled device camera (FEI Company) and operated at 200 kiloelectron volts. For cryo-EM, a 3-µl ali-quot of purified Lsp1 or Pil1 protein or protein-liposome suspension was pipetted on a glow-discharged holey carbon–coated EM grid (C-Flat; Protochips, Incorporated). For cryoelectron tomography, 1 µl of diluted BSA-coated colloidal gold particles (10 nm in diameter) was added. Ex-cess suspension was blotted with a filter paper, and the sample was vitri-fied by plunging it rapidly into liquid ethane. Cryo-EM was performed at liquid nitrogen temperature using a microscope (Tecnai F20) equipped with a 4kx4k charge-coupled device camera (FEI Company) operated at 200 kiloelectron volts. Single low-dose images (20e/A2) or tilt series of 61 images from 60 to +60 degrees (80130e/A2) were collected with SerialEM (Mastronarde, 2005) at 1–3 µm of underfocus and at a nominal magnification of 50,000, giving a calibrated pixel size of 0.22 nm.
Tomography and subtomogram averagingTomographic reconstructions were calculated from the tilt series in IMOD (Mastronarde, 2005) and down-sampled by a factor of three, giving a final pixel size of 0.66 nm. Three filaments, oriented in the direction of the tilt axis, were traced in a tomographic reconstruction of Lsp1. To calculate an averaged structure of Lsp1 filament, 128 overlapping 3D filament seg-ments (100 × 100 × 100 voxels, with a 90% overlap) were extracted. A cylindrical average of all segments was used as a reference in cross-correlation alignment, calculated using a custom Bsoft (Heymann and Belnap, 2007) program, Jsubtomo (available upon request; Huiskonen et al., 2010). The average of all aligned segments acted as a reference for a subsequent 20 rounds of alignment and averaging. The angle defining the orientation of the filament segment around the filament long axis was ini-tially randomized, and changes of only 16 degrees were allowed during the alignment. This angular constraint and the orientation of the filament
on April 26, 2012
jcb.rupress.orgD
ownloaded from
Published November 28, 2011
901Eisosome proteins assemble into a membrane scaffold • Karotki et al.
Collins, S.R., M. Schuldiner, N.J. Krogan, and J.S. Weissman. 2006. A strategy for extracting and analyzing large-scale quantitative epistatic interaction data. Genome Biol. 7:R63. http://dx.doi.org/10.1186/gb-2006-7-7-r63
de Godoy, L.M., J.V. Olsen, J. Cox, M.L. Nielsen, N.C. Hubner, F. Fröhlich, T.C. Walther, and M. Mann. 2008. Comprehensive mass-spectrometry-based proteome quantification of haploid versus diploid yeast. Nature. 455:1251–1254. http://dx.doi.org/10.1038/nature07341
DeRosier, D.J., and P.B. Moore. 1970. Reconstruction of three-dimensional images from electron micrographs of structures with helical symme-try. J. Mol. Biol. 52:355–369. http://dx.doi.org/10.1016/0022-2836 (70)90036-7
Egelman, E.H. 2007. The iterative helical real space reconstruction method: Surmounting the problems posed by real polymers. J. Struct. Biol. 157:83–94. http://dx.doi.org/10.1016/j.jsb.2006.05.015
Frank, J., M. Radermacher, P. Penczek, J. Zhu, Y. Li, M. Ladjadj, and A. Leith. 1996. SPIDER and WEB: Processing and visualization of images in 3D electron microscopy and related fields. J. Struct. Biol. 116:190–199. http://dx.doi.org/10.1006/jsbi.1996.0030
Fröhlich, F., K. Moreira, P.S. Aguilar, N.C. Hubner, M. Mann, P. Walter, and T.C. Walther. 2009. A genome-wide screen for genes affecting eiso-somes reveals Nce102 function in sphingolipid signaling. J. Cell Biol. 185:1227–1242. http://dx.doi.org/10.1083/jcb.200811081
Frost, A., R. Perera, A. Roux, K. Spasov, O. Destaing, E.H. Egelman, P. De Camilli, and V.M. Unger. 2008. Structural basis of membrane invagina-tion by F-BAR domains. Cell. 132:807–817. http://dx.doi.org/10.1016/ j.cell.2007.12.041
Gallop, J.L., and H.T. McMahon. 2005. BAR domains and membrane curvature: Bringing your curves to the BAR. Biochem. Soc. Symp. 72:223–231.
Ghaemmaghami, S., W.K. Huh, K. Bower, R.W. Howson, A. Belle, N. Dephoure, E.K. O’Shea, and J.S. Weissman. 2003. Global analysis of pro-tein expression in yeast. Nature. 425:737–741. http://dx.doi.org/10.1038/ nature02046
Grossmann, G., M. Opekarová, J. Malinsky, I. Weig-Meckl, and W. Tanner. 2007. Membrane potential governs lateral segregation of plasma membrane proteins and lipids in yeast. EMBO J. 26:1–8. http://dx.doi.org/10.1038/ sj.emboj.7601466
Grossmann, G., J. Malinsky, W. Stahlschmidt, M. Loibl, I. Weig-Meckl, W.B. Frommer, M. Opekarová, and W. Tanner. 2008. Plasma membrane micro-domains regulate turnover of transport proteins in yeast. J. Cell Biol. 183:1075–1088. http://dx.doi.org/10.1083/jcb.200806035
Hanson, P.I., R. Roth, Y. Lin, and J.E. Heuser. 2008. Plasma membrane defor-mation by circular arrays of ESCRT-III protein filaments. J. Cell Biol. 180:389–402. http://dx.doi.org/10.1083/jcb.200707031
Heuser, J.E. 1989. Development of the quick-freeze, deep-etch, rotary-replication technique of sample preparation for 3-D electron microscopy. Prog. Clin. Biol. Res. 295:71–83.
Heymann, J.B., and D.M. Belnap. 2007. Bsoft: Image processing and molecular modeling for electron microscopy. J. Struct. Biol. 157:3–18. http://dx.doi .org/10.1016/j.jsb.2006.06.006
Hua, W., D. Sheff, D. Toomre, and I. Mellman. 2006. Vectorial insertion of apical and basolateral membrane proteins in polarized epithelial cells re-vealed by quantitative 3D live cell imaging. J. Cell Biol. 172:1035–1044. http://dx.doi.org/10.1083/jcb.200512012
Huiskonen, J.T., J. Hepojoki, P. Laurinmäki, A. Vaheri, H. Lankinen, S.J. Butcher, and K. Grünewald. 2010. Electron cryotomography of Tula hantavirus suggests a unique assembly paradigm for enveloped viruses. J. Virol. 84:4889–4897. http://dx.doi.org/10.1128/JVI.00057-10
Itoh, T., K.S. Erdmann, A. Roux, B. Habermann, H. Werner, and P. De Camilli. 2005. Dynamin and the actin cytoskeleton cooperatively regulate plasma membrane invagination by BAR and F-BAR proteins. Dev. Cell. 9:791–804. http://dx.doi.org/10.1016/j.devcel.2005.11.005
Janke, C., M.M. Magiera, N. Rathfelder, C. Taxis, S. Reber, H. Maekawa, A. Moreno-Borchart, G. Doenges, E. Schwob, E. Schiebel, and M. Knop. 2004. A versatile toolbox for PCR-based tagging of yeast genes: New fluorescent proteins, more markers and promoter substitution cassettes. Yeast. 21:947–962. http://dx.doi.org/10.1002/yea.1142
Kleywegt, G.J. 1996. Use of non-crystallographic symmetry in protein structure refinement. Acta Crystallogr. D Biol. Crystallogr. 52:842–857. http://dx.doi.org/10.1107/S0907444995016477
Kozlov, M.M., H.T. McMahon, and L.V. Chernomordik. 2010. Protein-driven membrane stresses in fusion and fission. Trends Biochem. Sci. 35:699–706. http://dx.doi.org/10.1016/j.tibs.2010.06.003
Luo, G., A. Gruhler, Y. Liu, O.N. Jensen, and R.C. Dickson. 2008. The sphin-golipid long-chain base-Pkh1/2-Ypk1/2 signaling pathway regulates eisosome assembly and turnover. J. Biol. Chem. 283:10433–10444. http://dx.doi.org/10.1074/jbc.M709972200
Malínská, K., J. Malínský, M. Opekarová, and W. Tanner. 2003. Visualization of protein compartmentation within the plasma membrane of living yeast
E-MAPE-MAP datasets were either from Aguilar et al. (2010) or generated as pre-viously described in Collins et al. (2006).
Spheroplasting and sample preparation for DEEMFor generation of yeast spheroplasts, cells were grown by shaking at 30°C to OD600 = 0.5 in YPD and treated with zymolyase for 10 min (mod-ified from Ogg et al. [1992]). “Unroofing” of spheroplasts, as well as antibody decoration, freezing, replicating, and imaging of the samples, was performed as previously described (Ogg et al., 1992; Hanson et al., 2008). The primary antibodies used were rabbit anti-GFP (Invitrogen) or rabbit anti-Pil1 (Walther et al., 2007). For freeze-fracture DEEM, cells were grown to OD600 = 0.5 in YPD and quick-frozen by abrupt applica-tion of the sample on a coverslip onto a block of ultrapure copper cooled to liquid helium temperature (Heuser, 1989) before deep etching and platinum replication.
Data depositionThe cryo-EM reconstructions (Table S3) have been deposited in the Electron Microscopy Data Bank at the European Bioinformatics Institute under ac-cession codes EMD-1865 (Lsp1 #1), EMD-1866 (Lsp1 #2), EMD-1867 (Lsp1-liposome #1), and EMD-1868 (Pil1-liposome #1).
Online supplemental materialFig. S1 shows that Pil1 and Lsp1 form stable filaments of variable diameter in vitro and that their localization depends on plasma membrane PI(4,5)P2. Fig. S2 shows that Mrp8 does not localize in eisosomes and is not required for normal eisosomes at the plasma membrane. Fig. S3 shows that the yeast plasma membrane exhibits abundant furrows that depend on PIL1 and that immunogold-labeled Pil1 and Lsp1-GFP localize in elongated structures on plasma membranes from unroofed yeast cells. Videos 1, 2, and 3 show time lapse imaging of eisosomes marked by Pil1-GFP at different time points during Mss4 inactivation. Table S1 contains all yeast strains used in this study. Tables S2 and S3 present the data, collection, and reconstruction statistics for helical reconstruction. Online supplemental material is avail-able at http://www.jcb.org/cgi/content/full/jcb.201104040/DC1.
We thank Pietro DeCamilli, Robert Farese Jr., Shawn Ferguson, Boumediene Soufi, and Sebastian Schuck for critical reading of the manuscript and sugges-tions. We would like to especially thank Michael Shales for help in preparing the E-MAP figure and Judith Short and Edward Egelman for valuable sugges-tions concerning reconstruction of filament structures.
This work was supported by the Boehringer Ingelheim Fonds (L. Karotki), the Academy of Finland (grant 218080 to J.T. Huiskonen), the Max Planck Society (T.C. Walther), the German Research Foundation (T.C. Walther and K. Grünewald), and the Minna-James-Heineman Foundation (T.C. Walther).
Submitted: 8 April 2011Accepted: 31 October 2011
ReferencesAguilar, P.S., F. Fröhlich, M. Rehman, M. Shales, I. Ulitsky, A. Olivera-Couto,
H. Braberg, R. Shamir, P. Walter, M. Mann, et al. 2010. A plasma-membrane E-MAP reveals links of the eisosome with sphingolipid me-tabolism and endosomal trafficking. Nat. Struct. Mol. Biol. 17:901–908. http://dx.doi.org/10.1038/nsmb.1829
Bai, J., Z. Hu, J.S. Dittman, E.C. Pym, and J.M. Kaplan. 2010. Endophilin functions as a membrane-bending molecule and is delivered to endo-cytic zones by exocytosis. Cell. 143:430–441. http://dx.doi.org/10.1016/ j.cell.2010.09.024
Berchtold, D., and T.C. Walther. 2009. TORC2 plasma membrane local-ization is essential for cell viability and restricted to a distinct do-main. Mol. Biol. Cell. 20:1565–1575. http://dx.doi.org/10.1091/mbc .E08-10-1001
Brach, T., T. Specht, and M. Kaksonen. 2011. Reassessment of the role of plasma membrane domains in the regulation of vesicular traffic in yeast. J. Cell Sci. 124:328–337. http://dx.doi.org/10.1242/jcs.078519
Chacón, P., and W. Wriggers. 2002. Multi-resolution contour-based fitting of macromolecular structures. J. Mol. Biol. 317:375–384. http://dx.doi .org/10.1006/jmbi.2002.5438
Chang-Ileto, B., S.G. Frere, R.B. Chan, S.V. Voronov, A. Roux, and G. Di Paolo. 2011. Synaptojanin 1-mediated PI(4,5)P2 hydrolysis is modu-lated by membrane curvature and facilitates membrane fission. Dev. Cell. 20:206–218. http://dx.doi.org/10.1016/j.devcel.2010.12.008
on April 26, 2012
jcb.rupress.orgD
ownloaded from
Published November 28, 2011
JCB • VOLUME 195 • NUMBER 5 • 2011 902
cells. Mol. Biol. Cell. 14:4427–4436. http://dx.doi.org/10.1091/mbc .E03-04-0221
Mastronarde, D.N. 2005. Automated electron microscope tomography using robust prediction of specimen movements. J. Struct. Biol. 152:36–51. http://dx.doi.org/10.1016/j.jsb.2005.07.007
Norbeck, J., and A. Blomberg. 1997. Metabolic and regulatory changes as-sociated with growth of Saccharomyces cerevisiae in 1.4 M NaCl. Evidence for osmotic induction of glycerol dissimilation via the dihy-droxyacetone pathway. J. Biol. Chem. 272:5544–5554. http://dx.doi .org/10.1074/jbc.272.9.5544
Ogg, S.C., M.A. Poritz, and P. Walter. 1992. Signal recognition particle recep-tor is important for cell growth and protein secretion in Saccharomyces cerevisiae. Mol. Biol. Cell. 3:895–911.
Olivera-Couto, A., M. Graña, L. Harispe, and P.S. Aguilar. 2011. The eisosome core is composed of BAR domain proteins. Mol. Biol. Cell. 22:2360–2372. http://dx.doi.org/10.1091/mbc.E10-12-1021
Owen, C.H., D.G. Morgan, and D.J. DeRosier. 1996. Image analysis of heli-cal objects: The Brandeis Helical Package. J. Struct. Biol. 116:167–175. http://dx.doi.org/10.1006/jsbi.1996.0027
Peter, B.J., H.M. Kent, I.G. Mills, Y. Vallis, P.J. Butler, P.R. Evans, and H.T. McMahon. 2004. BAR domains as sensors of membrane curvature: The amphiphysin BAR structure. Science. 303:495–499. http://dx.doi.org/ 10.1126/science.1092586
Ren, G., P. Vajjhala, J.S. Lee, B. Winsor, and A.L. Munn. 2006. The BAR domain proteins: Molding membranes in fission, fusion, and phagy. Microbiol. Mol. Biol. Rev. 70:37–120. http://dx.doi.org/10.1128/ MMBR.70.1.37-120.2006
Schuske, K.R., J.E. Richmond, D.S. Matthies, W.S. Davis, S. Runz, D.A. Rube, A.M. van der Bliek, and E.M. Jorgensen. 2003. Endophilin is required for synaptic vesicle endocytosis by localizing synaptojanin. Neuron. 40:749–762. http://dx.doi.org/10.1016/S0896-6273(03)00667-6
Stefan, C.J., A. Audhya, and S.D. Emr. 2002. The yeast synaptojanin-like proteins control the cellular distribution of phosphatidylinositol (4,5)-bisphosphate. Mol. Biol. Cell. 13:542–557. http://dx.doi.org/10.1091/mbc.01-10-0476
Strádalová, V., W. Stahlschmidt, G. Grossmann, M. Blazíková, R. Rachel, W. Tanner, and J. Malinsky. 2009. Furrow-like invaginations of the yeast plasma membrane correspond to membrane compartment of Can1. J. Cell Sci. 122:2887–2894. http://dx.doi.org/10.1242/jcs.051227
Verstreken, P., T.W. Koh, K.L. Schulze, R.G. Zhai, P.R. Hiesinger, Y. Zhou, S.Q. Mehta, Y. Cao, J. Roos, and H.J. Bellen. 2003. Synaptojanin is re-cruited by endophilin to promote synaptic vesicle uncoating. Neuron. 40:733–748. http://dx.doi.org/10.1016/S0896-6273(03)00644-5
Walther, T.C., J.H. Brickner, P.S. Aguilar, S. Bernales, C. Pantoja, and P. Walter. 2006. Eisosomes mark static sites of endocytosis. Nature. 439:998–1003. http://dx.doi.org/10.1038/nature04472
Walther, T.C., P.S. Aguilar, F. Fröhlich, F. Chu, K. Moreira, A.L. Burlingame, and P. Walter. 2007. Pkh-kinases control eisosome assembly and organization. EMBO J. 26:4946–4955. http://dx.doi.org/10.1038/sj.emboj.7601933
Wang, H., B. Kakaradov, S.R. Collins, L. Karotki, D. Fiedler, M. Shales, K.M. Shokat, T.C. Walther, N.J. Krogan, and D. Koller. 2009. A complex-based reconstruction of the Saccharomyces cerevisiae interactome. Mol. Cell. Proteomics. 8:1361–1381. http://dx.doi.org/10.1074/mcp.M800490- MCP200
Zhang, X., R.L. Lester, and R.C. Dickson. 2004. Pil1p and Lsp1p negatively reg-ulate the 3-phosphoinositide-dependent protein kinase-like kinase Pkh1p and downstream signaling pathways Pkc1p and Ypk1p. J. Biol. Chem. 279:22030–22038. http://dx.doi.org/10.1074/jbc.M400299200
Ziółkowska, N.E., L. Karotki, M. Rehman, J.T. Huiskonen, and T.C. Walther. 2011. Eisosome-driven plasma membrane organization is mediated by BAR domains. Nat. Struct. Mol. Biol. 18:854–856. http://dx.doi.org/10.1038/ nsmb.2080
on April 26, 2012
jcb.rupress.orgD
ownloaded from
Published November 28, 2011
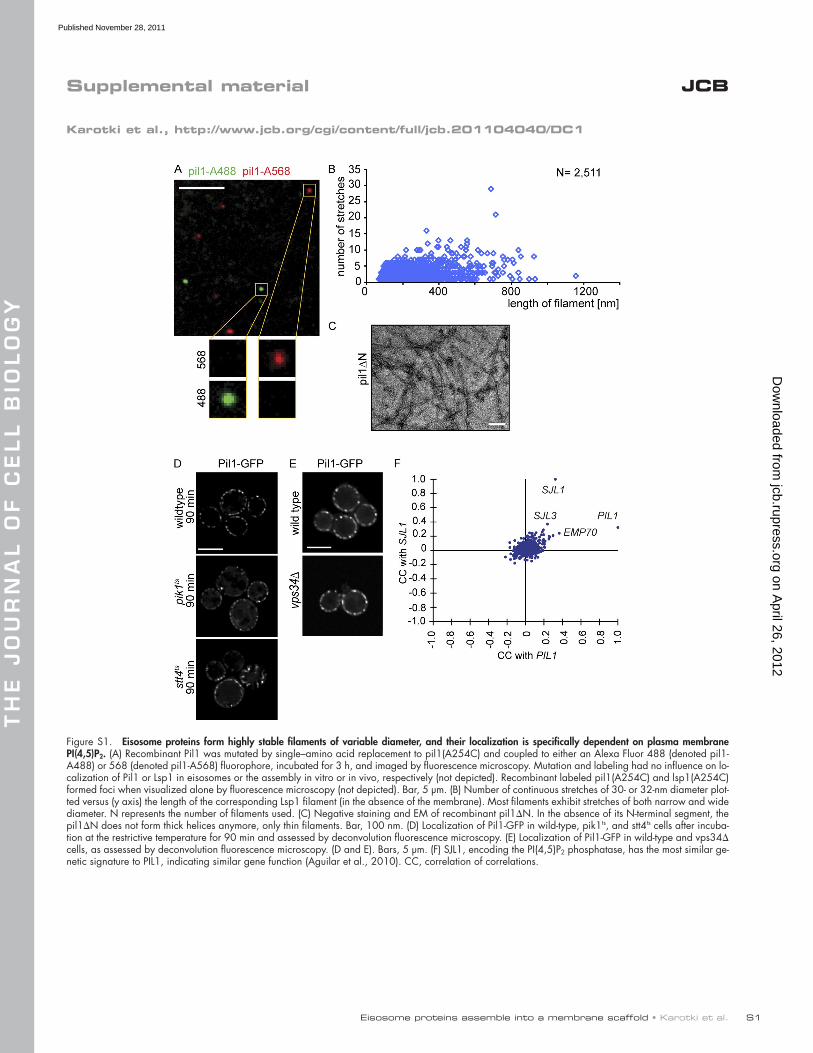
Eisosome proteins assemble into a membrane scaffold • Karotki et al.
TH
E J
OU
RN
AL
OF
CE
LL
BIO
LO
GY
S1
JCBSupplemental material
Karotki et al., http://www.jcb.org/cgi/content/full/jcb.201104040/DC1
Figure S1. Eisosome proteins form highly stable filaments of variable diameter, and their localization is specifically dependent on plasma membrane PI(4,5)P2. (A) Recombinant Pil1 was mutated by single–amino acid replacement to pil1(A254C) and coupled to either an Alexa Fluor 488 (denoted pil1-A488) or 568 (denoted pil1-A568) fluorophore, incubated for 3 h, and imaged by fluorescence microscopy. Mutation and labeling had no influence on lo-calization of Pil1 or Lsp1 in eisosomes or the assembly in vitro or in vivo, respectively (not depicted). Recombinant labeled pil1(A254C) and lsp1(A254C) formed foci when visualized alone by fluorescence microscopy (not depicted). Bar, 5 µm. (B) Number of continuous stretches of 30- or 32-nm diameter plot-ted versus (y axis) the length of the corresponding Lsp1 filament (in the absence of the membrane). Most filaments exhibit stretches of both narrow and wide diameter. N represents the number of filaments used. (C) Negative staining and EM of recombinant pil1N. In the absence of its N-terminal segment, the pil1N does not form thick helices anymore, only thin filaments. Bar, 100 nm. (D) Localization of Pil1-GFP in wild-type, pik1ts, and stt4ts cells after incuba-tion at the restrictive temperature for 90 min and assessed by deconvolution fluorescence microscopy. (E) Localization of Pil1-GFP in wild-type and vps34 cells, as assessed by deconvolution fluorescence microscopy. (D and E). Bars, 5 µm. (F) SJL1, encoding the PI(4,5)P2 phosphatase, has the most similar ge-netic signature to PIL1, indicating similar gene function (Aguilar et al., 2010). CC, correlation of correlations.
on April 26, 2012
jcb.rupress.orgD
ownloaded from
Published November 28, 2011
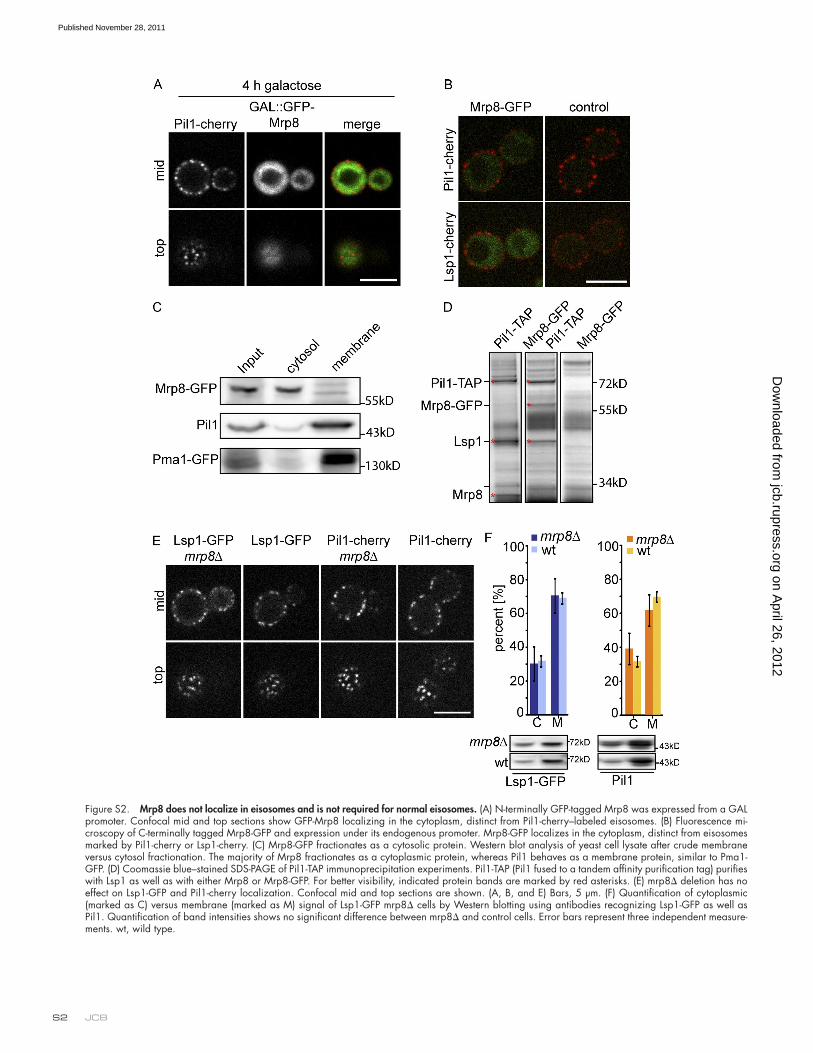
JCB S2
Figure S2. Mrp8 does not localize in eisosomes and is not required for normal eisosomes. (A) N-terminally GFP-tagged Mrp8 was expressed from a GAL promoter. Confocal mid and top sections show GFP-Mrp8 localizing in the cytoplasm, distinct from Pil1-cherry–labeled eisosomes. (B) Fluorescence mi-croscopy of C-terminally tagged Mrp8-GFP and expression under its endogenous promoter. Mrp8-GFP localizes in the cytoplasm, distinct from eisosomes marked by Pil1-cherry or Lsp1-cherry. (C) Mrp8-GFP fractionates as a cytosolic protein. Western blot analysis of yeast cell lysate after crude membrane versus cytosol fractionation. The majority of Mrp8 fractionates as a cytoplasmic protein, whereas Pil1 behaves as a membrane protein, similar to Pma1-GFP. (D) Coomassie blue–stained SDS-PAGE of Pil1-TAP immunoprecipitation experiments. Pil1-TAP (Pil1 fused to a tandem affinity purification tag) purifies with Lsp1 as well as with either Mrp8 or Mrp8-GFP. For better visibility, indicated protein bands are marked by red asterisks. (E) mrp8 deletion has no effect on Lsp1-GFP and Pil1-cherry localization. Confocal mid and top sections are shown. (A, B, and E) Bars, 5 µm. (F) Quantification of cytoplasmic (marked as C) versus membrane (marked as M) signal of Lsp1-GFP mrp8 cells by Western blotting using antibodies recognizing Lsp1-GFP as well as Pil1. Quantification of band intensities shows no significant difference between mrp8 and control cells. Error bars represent three independent measure-ments. wt, wild type.
on April 26, 2012
jcb.rupress.orgD
ownloaded from
Published November 28, 2011
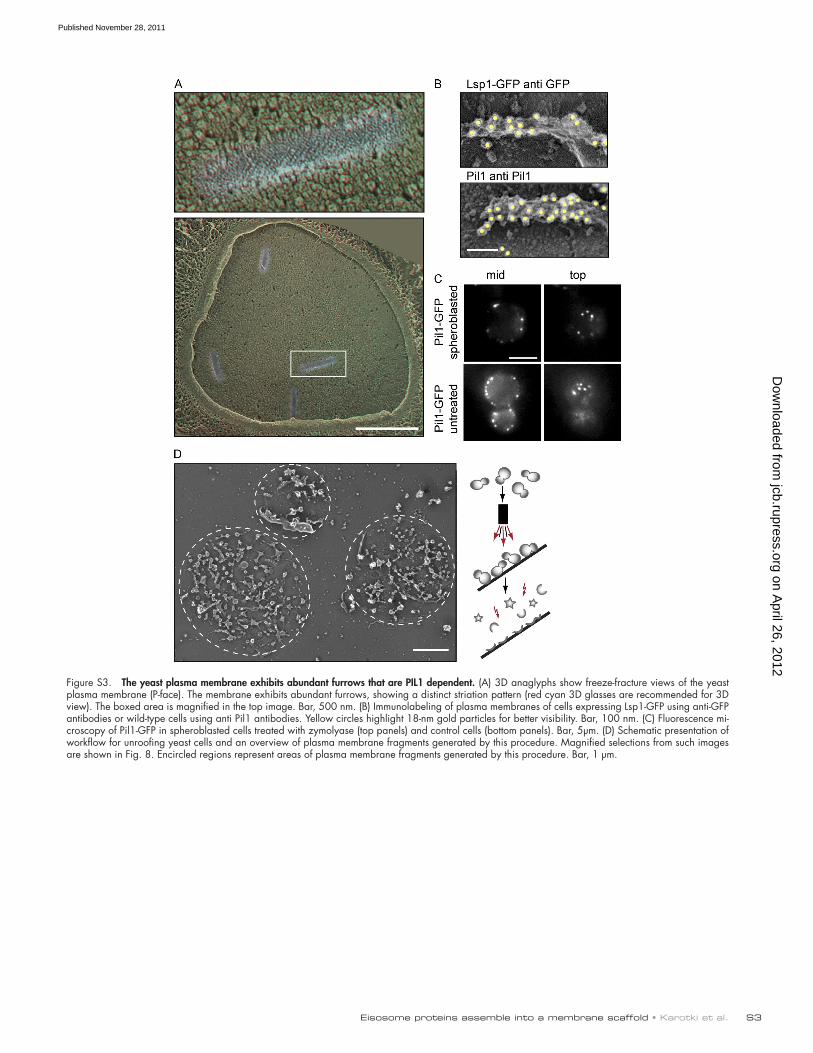
Eisosome proteins assemble into a membrane scaffold • Karotki et al. S3
Figure S3. The yeast plasma membrane exhibits abundant furrows that are PIL1 dependent. (A) 3D anaglyphs show freeze-fracture views of the yeast plasma membrane (P-face). The membrane exhibits abundant furrows, showing a distinct striation pattern (red cyan 3D glasses are recommended for 3D view). The boxed area is magnified in the top image. Bar, 500 nm. (B) Immunolabeling of plasma membranes of cells expressing Lsp1-GFP using anti-GFP antibodies or wild-type cells using anti Pil1 antibodies. Yellow circles highlight 18-nm gold particles for better visibility. Bar, 100 nm. (C) Fluorescence mi-croscopy of Pil1-GFP in spheroblasted cells treated with zymolyase (top panels) and control cells (bottom panels). Bar, 5µm. (D) Schematic presentation of workflow for unroofing yeast cells and an overview of plasma membrane fragments generated by this procedure. Magnified selections from such images are shown in Fig. 8. Encircled regions represent areas of plasma membrane fragments generated by this procedure. Bar, 1 µm.
on April 26, 2012
jcb.rupress.orgD
ownloaded from
Published November 28, 2011
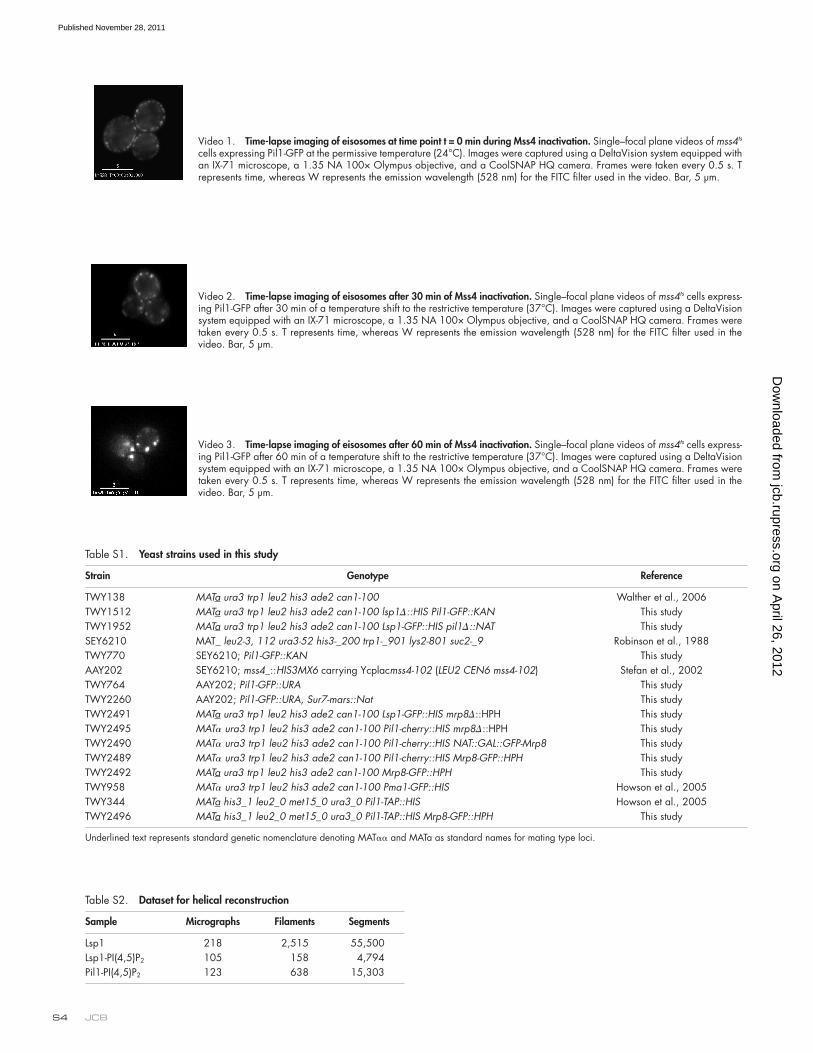
JCB S4
Video 2. Time-lapse imaging of eisosomes after 30 min of Mss4 inactivation. Single–focal plane videos of mss4ts cells express-ing Pil1-GFP after 30 min of a temperature shift to the restrictive temperature (37°C). Images were captured using a DeltaVision system equipped with an IX-71 microscope, a 1.35 NA 100× Olympus objective, and a CoolSNAP HQ camera. Frames were taken every 0.5 s. T represents time, whereas W represents the emission wavelength (528 nm) for the FITC filter used in the video. Bar, 5 µm.
Video 3. Time-lapse imaging of eisosomes after 60 min of Mss4 inactivation. Single–focal plane videos of mss4ts cells express-ing Pil1-GFP after 60 min of a temperature shift to the restrictive temperature (37°C). Images were captured using a DeltaVision system equipped with an IX-71 microscope, a 1.35 NA 100× Olympus objective, and a CoolSNAP HQ camera. Frames were taken every 0.5 s. T represents time, whereas W represents the emission wavelength (528 nm) for the FITC filter used in the video. Bar, 5 µm.
Table S1. Yeast strains used in this study
Strain Genotype Reference
TWY138 MATa ura3 trp1 leu2 his3 ade2 can1-100 Walther et al., 2006TWY1512 MATa ura3 trp1 leu2 his3 ade2 can1-100 lsp1::HIS Pil1-GFP::KAN This studyTWY1952 MATa ura3 trp1 leu2 his3 ade2 can1-100 Lsp1-GFP::HIS pil1::NAT This studySEY6210 MAT_ leu2-3, 112 ura3-52 his3-_200 trp1-_901 lys2-801 suc2-_9 Robinson et al., 1988TWY770 SEY6210; Pil1-GFP::KAN This studyAAY202 SEY6210; mss4_::HIS3MX6 carrying Ycplacmss4-102 (LEU2 CEN6 mss4-102) Stefan et al., 2002TWY764 AAY202; Pil1-GFP::URA This studyTWY2260 AAY202; Pil1-GFP::URA, Sur7-mars::Nat This studyTWY2491 MATa ura3 trp1 leu2 his3 ade2 can1-100 Lsp1-GFP::HIS mrp8::HPH This studyTWY2495 MAT ura3 trp1 leu2 his3 ade2 can1-100 Pil1-cherry::HIS mrp8::HPH This studyTWY2490 MAT ura3 trp1 leu2 his3 ade2 can1-100 Pil1-cherry::HIS NAT::GAL::GFP-Mrp8 This studyTWY2489 MAT ura3 trp1 leu2 his3 ade2 can1-100 Pil1-cherry::HIS Mrp8-GFP::HPH This studyTWY2492 MATa ura3 trp1 leu2 his3 ade2 can1-100 Mrp8-GFP::HPH This studyTWY958 MAT ura3 trp1 leu2 his3 ade2 can1-100 Pma1-GFP::HIS Howson et al., 2005TWY344 MATa his3_1 leu2_0 met15_0 ura3_0 Pil1-TAP::HIS Howson et al., 2005TWY2496 MATa his3_1 leu2_0 met15_0 ura3_0 Pil1-TAP::HIS Mrp8-GFP::HPH This study
Underlined text represents standard genetic nomenclature denoting MAT and MATa as standard names for mating type loci.
Table S2. Dataset for helical reconstruction
Sample Micrographs Filaments Segments
Lsp1 218 2,515 55,500Lsp1-PI(4,5)P2 105 158 4,794Pil1-PI(4,5)P2 123 638 15,303
Video 1. Time-lapse imaging of eisosomes at time point t = 0 min during Mss4 inactivation. Single–focal plane videos of mss4ts cells expressing Pil1-GFP at the permissive temperature (24°C). Images were captured using a DeltaVision system equipped with an IX-71 microscope, a 1.35 NA 100× Olympus objective, and a CoolSNAP HQ camera. Frames were taken every 0.5 s. T represents time, whereas W represents the emission wavelength (528 nm) for the FITC filter used in the video. Bar, 5 µm.
on April 26, 2012
jcb.rupress.orgD
ownloaded from
Published November 28, 2011
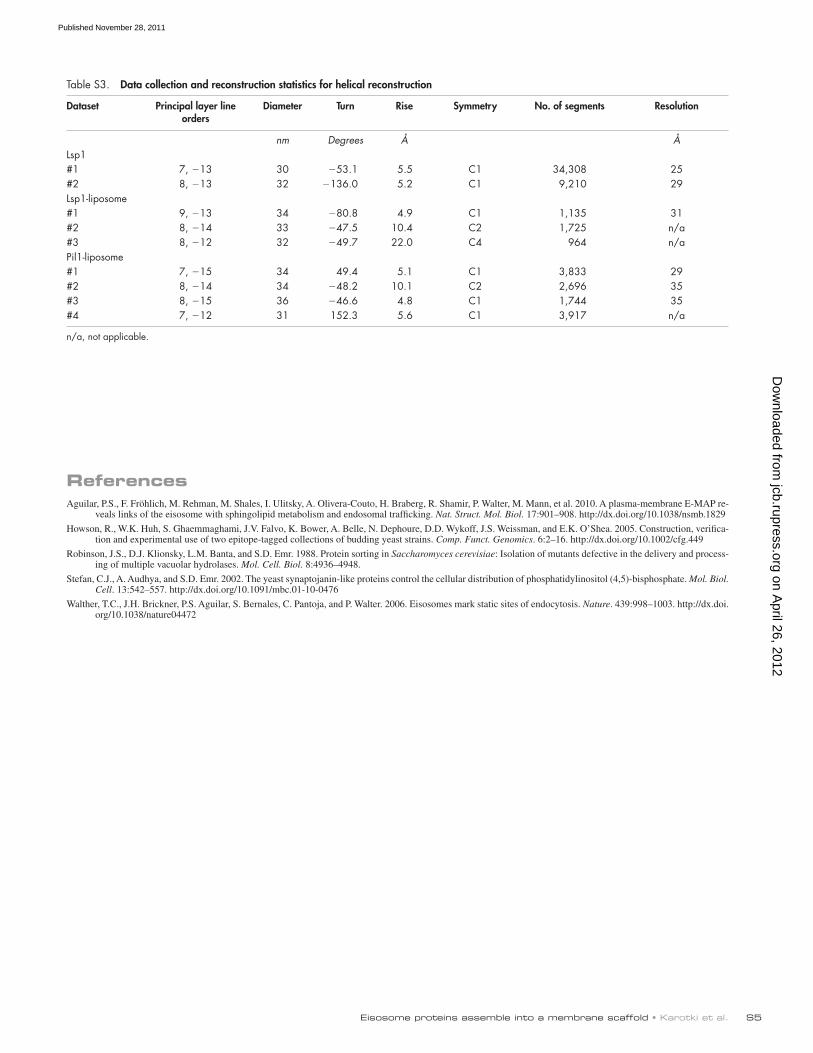
Eisosome proteins assemble into a membrane scaffold • Karotki et al. S�
Table S3. Data collection and reconstruction statistics for helical reconstruction
Dataset Principal layer line orders
Diameter Turn Rise Symmetry No. of segments Resolution
nm Degrees Å ÅLsp1#1 7, 13 30 53.1 5.5 C1 34,308 25#2 8, 13 32 136.0 5.2 C1 9,210 29Lsp1-liposome#1 9, 13 34 80.8 4.9 C1 1,135 31#2 8, 14 33 47.5 10.4 C2 1,725 n/a#3 8, 12 32 49.7 22.0 C4 964 n/aPil1-liposome#1 7, 15 34 49.4 5.1 C1 3,833 29#2 8, 14 34 48.2 10.1 C2 2,696 35#3 8, 15 36 46.6 4.8 C1 1,744 35#4 7, 12 31 152.3 5.6 C1 3,917 n/a
n/a, not applicable.
ReferencesAguilar, P.S., F. Fröhlich, M. Rehman, M. Shales, I. Ulitsky, A. Olivera-Couto, H. Braberg, R. Shamir, P. Walter, M. Mann, et al. 2010. A plasma-membrane E-MAP re-
veals links of the eisosome with sphingolipid metabolism and endosomal trafficking. Nat. Struct. Mol. Biol. 17:901–908. http://dx.doi.org/10.1038/nsmb.1829
Howson, R., W.K. Huh, S. Ghaemmaghami, J.V. Falvo, K. Bower, A. Belle, N. Dephoure, D.D. Wykoff, J.S. Weissman, and E.K. O’Shea. 2005. Construction, verifica-tion and experimental use of two epitope-tagged collections of budding yeast strains. Comp. Funct. Genomics. 6:2–16. http://dx.doi.org/10.1002/cfg.449
Robinson, J.S., D.J. Klionsky, L.M. Banta, and S.D. Emr. 1988. Protein sorting in Saccharomyces cerevisiae: Isolation of mutants defective in the delivery and process-ing of multiple vacuolar hydrolases. Mol. Cell. Biol. 8:4936–4948.
Stefan, C.J., A. Audhya, and S.D. Emr. 2002. The yeast synaptojanin-like proteins control the cellular distribution of phosphatidylinositol (4,5)-bisphosphate. Mol. Biol. Cell. 13:542–557. http://dx.doi.org/10.1091/mbc.01-10-0476
Walther, T.C., J.H. Brickner, P.S. Aguilar, S. Bernales, C. Pantoja, and P. Walter. 2006. Eisosomes mark static sites of endocytosis. Nature. 439:998–1003. http://dx.doi.org/10.1038/nature04472
on April 26, 2012
jcb.rupress.orgD
ownloaded from
Published November 28, 2011