Study on a Coal-Fired Power Plant with CO2 Flue Gas Scrubbing
7
Available online at www.sciencedirect.com Energy Procedia GHGT-9 Study on a Coal-Fired Power Plant with CO 2 Flue Gas Scrubbing Elizabeth Heischkamp a, *, Gerd Oeljeklaus a a University of Duisburg-Essen, Lehrstuhl für Umweltverfahrenstechnik und Anlagentechnik LUAT (Environmental Process Engineering and Plant Design), Leimkugelstr. 10, 45141 Essen, Germany Abstract An analysis of the integration of a capture process with a coal-fired power plant was conducted, including part of the CO 2 conditioning for its transport. For this purpose the simulation of the capture plant was undertaken with the help of Aspen Plus and the power plant with EbsilonProfessional. Keywords: CO2 capture; MEA; absorption; integration; power plant. 1. Introduction With the increasing necessity to reduce anthropogenic CO 2 emissions, it has become clear that existing and new technologies for the purpose of electric power generation with coal have to be further developed, due to the fact that this sector accounts for a large source of CO 2 emissions [1]. As presented in several documents [2, 3, 4], there are three main categories for capturing CO 2 from power plants’ flue gases: Pre-combustion, Oxyfuel and Post-combustion. It is well known that Post-combustion capture results on high net efficiency penalties, which is the reason why the German research program (like COORETEC) initially omitted this option as an alternative to mitigate the emissions of CO 2 . However, Post-combustion offers the prospect of retrofitting an existing power plant, and considering that in Germany approximately 51 % of the generated electricity comes from coal-fired power plants [5] makes this, an attractive CO 2 reduction strategy. In addition, the life cycle of several power plants is coming to an end, not only in Germany, but in Europe (EU-25) in general. According to [5] up to 200 GW power plants’ capacity will have to be replaced by 2020 and 100 GW more will have to be added, to be able to meet the increasing energy demand. If CO 2 emission’s reductions are to be met, as established in the Kyoto protocol, then all possible efforts will be needed in order to fulfil this task, and Post-combustion capture will most definitely not be the exception. Although there are already several commercial technologies for the separation of CO 2 , flue gas scrubbing with amines projects itself as the most promising one when it comes to a large scale application, like a 500 MW power plant or bigger. A reason for this is the large experience behind this process thanks to its former –and current– use in the oil industry for EOR. Nevertheless, it has long been since substantial progress was made with respect to the development of new solvents. The main problem is the amount of energy they require for their regeneration, which is the major power plant’s efficiency drawback. Another hitch for this technology is the fact that the biggest existing commercial plants are designed to capture a maximum amount of 1000 t/d in the case of EOR, 800 t/d for chemical industry and 300 t/d in the food industry [6]. This number is too * Corresponding author. Tel.: +49-201-183-7543; fax: +49-201-183-7513. E-mail address: [email protected]. c 2009 Elsevier Ltd. Energy Procedia 1 (2009) 1019–1025 www.elsevier.com/locate/procedia doi:10.1016/j.egypro.2009.01.135 Open access under CC BY-NC-ND license. brought to you by CORE View metadata, citation and similar papers at core.ac.uk provided by Elsevier - Publisher Connector
Transcript of Study on a Coal-Fired Power Plant with CO2 Flue Gas Scrubbing
Available online at www.sciencedirect.com
Energy Procedia 00 (2008) 000–000
EnergyProcedia
www.elsevier.com/locate/XXX
GHGT-9
Study on a Coal-Fired Power Plant with CO2 Flue Gas Scrubbing
Elizabeth Heischkampa,*, Gerd Oeljeklausa
aUniversity of Duisburg-Essen, Lehrstuhl für Umweltverfahrenstechnik und Anlagentechnik LUAT (Environmental Process Engineering and Plant Design), Leimkugelstr. 10, 45141 Essen, Germany
Elsevier use only: Received date here; revised date here; accepted date here
Abstract
An analysis of the integration of a capture process with a coal-fired power plant was conducted, including part of the CO2 conditioning for its transport. For this purpose the simulation of the capture plant was undertaken with the help of Aspen Plus and the power plant withEbsilonProfessional.© 2008 Elsevier Ltd. All rights reserved
Keywords: CO2 capture; MEA; absorption; integration; power plant.
1. Introduction
With the increasing necessity to reduce anthropogenic CO2 emissions, it has become clear that existing and new technologies for the purpose of electric power generation with coal have to be further developed, due to the fact that this sector accounts for a large source of CO2 emissions [1]. As presented in several documents [2, 3, 4], there are three main categories for capturing CO2from power plants’ flue gases: Pre-combustion, Oxyfuel and Post-combustion.
It is well known that Post-combustion capture results on high net efficiency penalties, which is the reason why the German research program (like COORETEC) initially omitted this option as an alternative to mitigate the emissions of CO2. However, Post-combustion offers the prospect of retrofitting an existing power plant, and considering that in Germany approximately 51 %of the generated electricity comes from coal-fired power plants [5] makes this, an attractive CO2 reduction strategy. In addition, the life cycle of several power plants is coming to an end, not only in Germany, but in Europe (EU-25) in general. According to[5] up to 200 GW power plants’ capacity will have to be replaced by 2020 and 100 GW more will have to be added, to be able to meet the increasing energy demand. If CO2 emission’s reductions are to be met, as established in the Kyoto protocol, then all possible efforts will be needed in order to fulfil this task, and Post-combustion capture will most definitely not be the exception.
Although there are already several commercial technologies for the separation of CO2, flue gas scrubbing with amines projects itself as the most promising one when it comes to a large scale application, like a 500 MW power plant or bigger. A reason for this is the large experience behind this process thanks to its former –and current– use in the oil industry for EOR.Nevertheless, it has long been since substantial progress was made with respect to the development of new solvents. The main problem is the amount of energy they require for their regeneration, which is the major power plant’s efficiency drawback. Another hitch for this technology is the fact that the biggest existing commercial plants are designed to capture a maximum amount of 1000 t/d in the case of EOR, 800 t/d for chemical industry and 300 t/d in the food industry [6]. This number is too
* Corresponding author. Tel.: +49-201-183-7543; fax: +49-201-183-7513. E-mail address: [email protected].
c© 2009 Elsevier Ltd.
Energy Procedia 1 (2009) 1019–1025
www.elsevier.com/locate/procedia
doi:10.1016/j.egypro.2009.01.135
Open access under CC BY-NC-ND license.
brought to you by COREView metadata, citation and similar papers at core.ac.uk
provided by Elsevier - Publisher Connector
small for a power plant like the Reference Power Plant NRW (RPP NRW), in which case approximately 8000 t/d of CO2 would have to be processed for a capture rate of 90 %.
While a lot of the research concerning the CO2 capture has already been done, there are still some obstacles to overcome, before “near zero emissions’ power plants” can actually be built. These include particularly integration of the capture with thepower plant. Furthermore, once the CO2 has been successfully separated from flue gases, it still has to be conditioned for its transport to the location of the sequestration field. This process also takes place at the power plant itself, resulting in another efficiency penalty.
2. MEA absorption
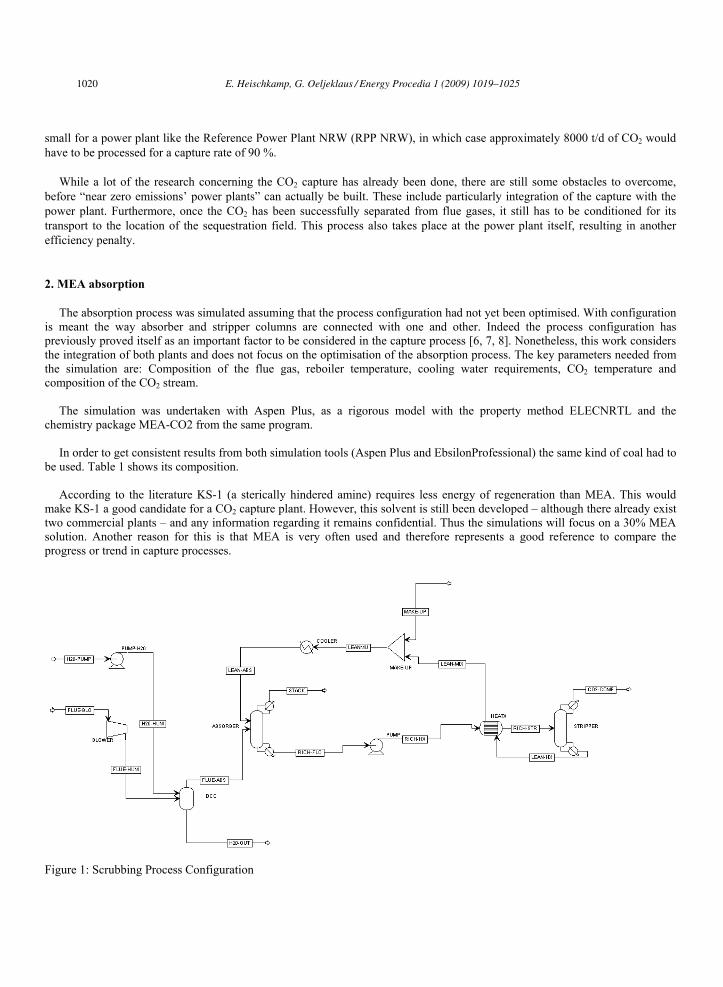
The absorption process was simulated assuming that the process configuration had not yet been optimised. With configuration is meant the way absorber and stripper columns are connected with one and other. Indeed the process configuration has previously proved itself as an important factor to be considered in the capture process [6, 7, 8]. Nonetheless, this work considers the integration of both plants and does not focus on the optimisation of the absorption process. The key parameters needed fromthe simulation are: Composition of the flue gas, reboiler temperature, cooling water requirements, CO2 temperature and composition of the CO2 stream.
The simulation was undertaken with Aspen Plus, as a rigorous model with the property method ELECNRTL and the chemistry package MEA-CO2 from the same program.
In order to get consistent results from both simulation tools (Aspen Plus and EbsilonProfessional) the same kind of coal had tobe used. Table 1 shows its composition.
According to the literature KS-1 (a sterically hindered amine) requires less energy of regeneration than MEA. This would make KS-1 a good candidate for a CO2 capture plant. However, this solvent is still been developed – although there already exist two commercial plants – and any information regarding it remains confidential. Thus the simulations will focus on a 30% MEA solution. Another reason for this is that MEA is very often used and therefore represents a good reference to compare the progress or trend in capture processes.
Figure 1: Scrubbing Process Configuration
1020 E. Heischkamp, G. Oeljeklaus / Energy Procedia 1 (2009) 1019–1025
3. Reference Power Plant NRW
Within the next years several coal-fired power plants will be built in Table 2: Design data of RPP NRW [9]Germany. The technology of such plants is that of the Reference Power Plant NRW (RPP NRW) with an efficiency (LHV) of 45,9 %. It is possible to reach higher efficiencies (approximately 48 %) depending on the location of the power plant. This is usually associated with cooling water from a see or a river. However, given that the majority of the power plants would work with a cooling tower, it makes sense to simulate the integration of such plants under these conditions. The most important parameters of RPP NRW are summarised in Table 2.
Gross Output 600 MWelNet Output 555,6 MWelNet Efficiency 45,9 % Main Steam 285 bar
600°C Condenser Pressure 45 mbar Pre-heating Stages 8
4. Process integration
In order to get the CO2 capture plant to work, the links between the scrubbing process and the power plant itself have to be identified first. In this case, the most important one corresponds to the steam supply for regeneration of the solvent.
For RPP NRW the steam will be extracted before it is directed to the LP Turbines (T=217°C, p=3,6 bar) and reinjected between the second and third Feedwater preheaters (T=100°C, p=3,6 bar). A pump was built in the simulation (not shown in Figure 2) to compensate the pressure losses that would result from this connection. This measure helps to prevent an imbalance within the power cycle. The temperature and pressure of the extracted steam guarantee its use for both reclaimer and reboiler ofthe scrubbing process.
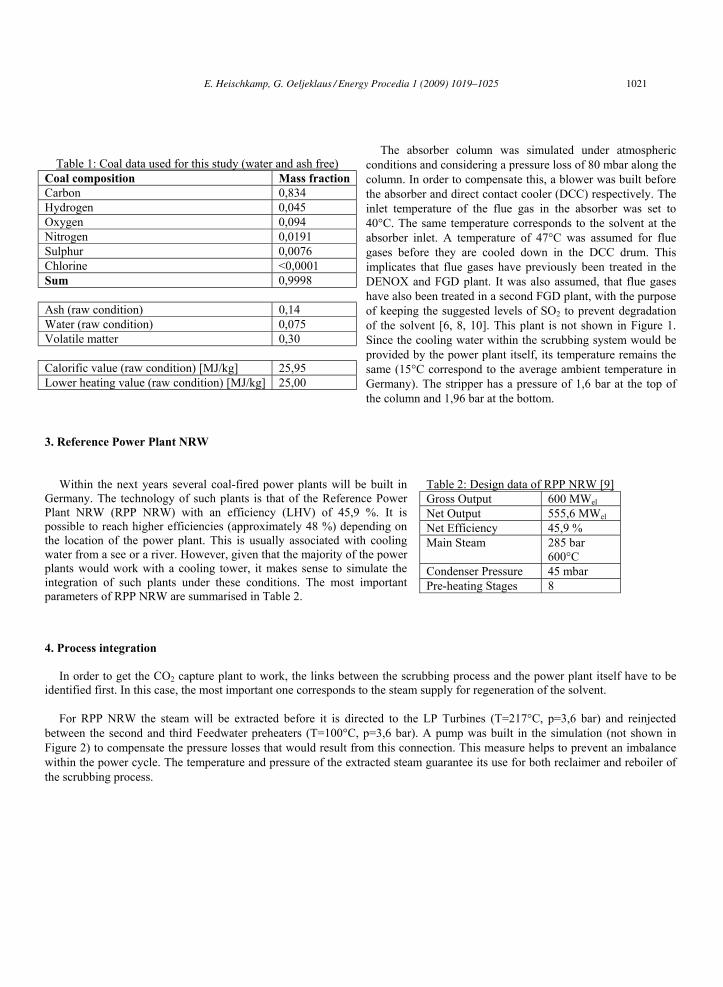
The absorber column was simulated under atmospheric Table 1: Coal data used for this study (water and ash free) conditions and considering a pressure loss of 80 mbar along the
column. In order to compensate this, a blower was built before the absorber and direct contact cooler (DCC) respectively. The inlet temperature of the flue gas in the absorber was set to 40°C. The same temperature corresponds to the solvent at the absorber inlet. A temperature of 47°C was assumed for flue gases before they are cooled down in the DCC drum. This implicates that flue gases have previously been treated in the DENOX and FGD plant. It was also assumed, that flue gases have also been treated in a second FGD plant, with the purpose of keeping the suggested levels of SO2 to prevent degradation of the solvent [6, 8, 10]. This plant is not shown in Figure 1. Since the cooling water within the scrubbing system would be provided by the power plant itself, its temperature remains the same (15°C correspond to the average ambient temperature in Germany). The stripper has a pressure of 1,6 bar at the top of the column and 1,96 bar at the bottom.
Coal composition Mass fraction Carbon 0,834 Hydrogen 0,045 Oxygen 0,094 Nitrogen 0,0191 Sulphur 0,0076 Chlorine <0,0001 Sum 0,9998
Ash (raw condition) 0,14 Water (raw condition) 0,075Volatile matter 0,30
Calorific value (raw condition) [MJ/kg] 25,95 Lower heating value (raw condition) [MJ/kg] 25,00
E. Heischkamp, G. Oeljeklaus / Energy Procedia 1 (2009) 1019–1025 1021
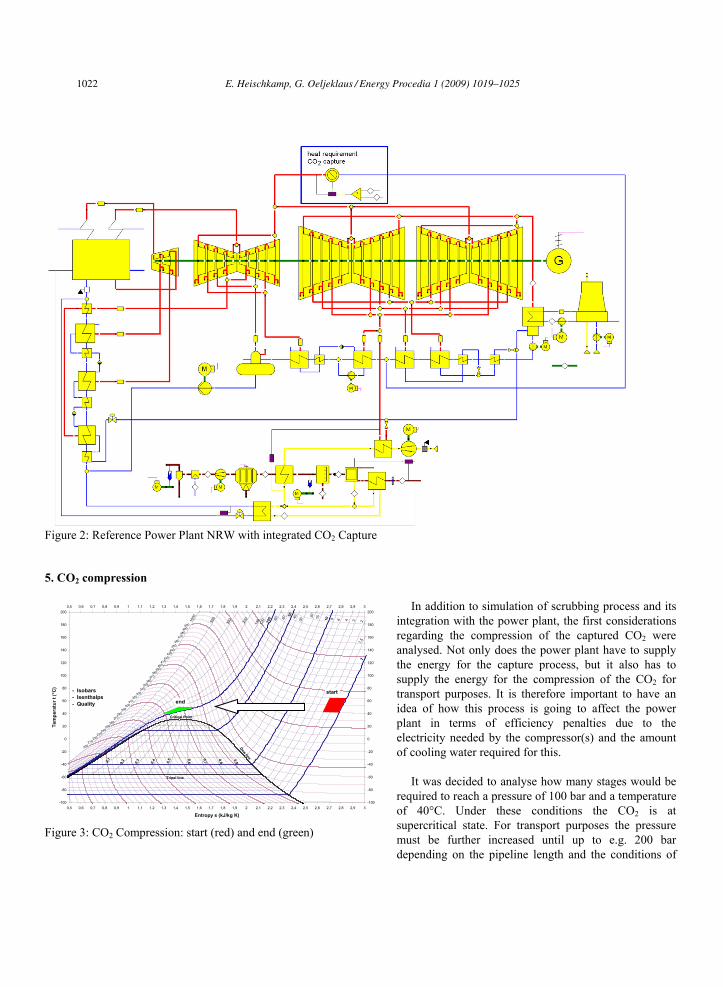
Figure 2: Reference Power Plant NRW with integrated CO2 Capture
5. CO2 compression
In addition to simulation of scrubbing process and its integration with the power plant, the first considerations regarding the compression of the captured CO2 were analysed. Not only does the power plant have to supply the energy for the capture process, but it also has to supply the energy for the compression of the CO2 for transport purposes. It is therefore important to have an idea of how this process is going to affect the power plant in terms of efficiency penalties due to the electricity needed by the compressor(s) and the amount of cooling water required for this.
It was decided to analyse how many stages would be required to reach a pressure of 100 bar and a temperature of 40°C. Under these conditions the CO2 is at supercritical state. For transport purposes the pressure must be further increased until up to e.g. 200 bar depending on the pipeline length and the conditions of
300
200
140
120 100 80 60
50 4030
20 15 10 8 6 3 21,
5
1
1000
500
310
300
290
280270
260250
240230
220210
200
470
460
450
440430
420410
400390
380
370
360350
340
330320
500490
480
4
Dew line0,9
0,8
0,7
0,60,5
0,4
0,30,20,1
Critical Point
Tripel line
-100
-80
-60
-40
-20
0
20
40
60
80
100
120
140
160
180
200
0,5 0,6 0,7 0,8 0,9 1 1,1 1,2 1,3 1,4 1,5 1,6 1,7 1,8 1,9 2 2,1 2,2 2,3 2,4 2,5 2,6 2,7 2,8 2,9 3
Entropy s (kJ/kg K)
Tem
pera
tur t
(°C
)
-100
-80
-60
-40
-20
0
20
40
60
80
100
120
140
160
180
2000,5 0,6 0,7 0,8 0,9 1 1,1 1,2 1,3 1,4 1,5 1,6 1,7 1,8 1,9 2 2,1 2,2 2,3 2,4 2,5 2,6 2,7 2,8 2,9 3
- Isobars- Isenthalps- Quality
start
end
Figure 3: CO2 Compression: start (red) and end (green)
1022 E. Heischkamp, G. Oeljeklaus / Energy Procedia 1 (2009) 1019–1025
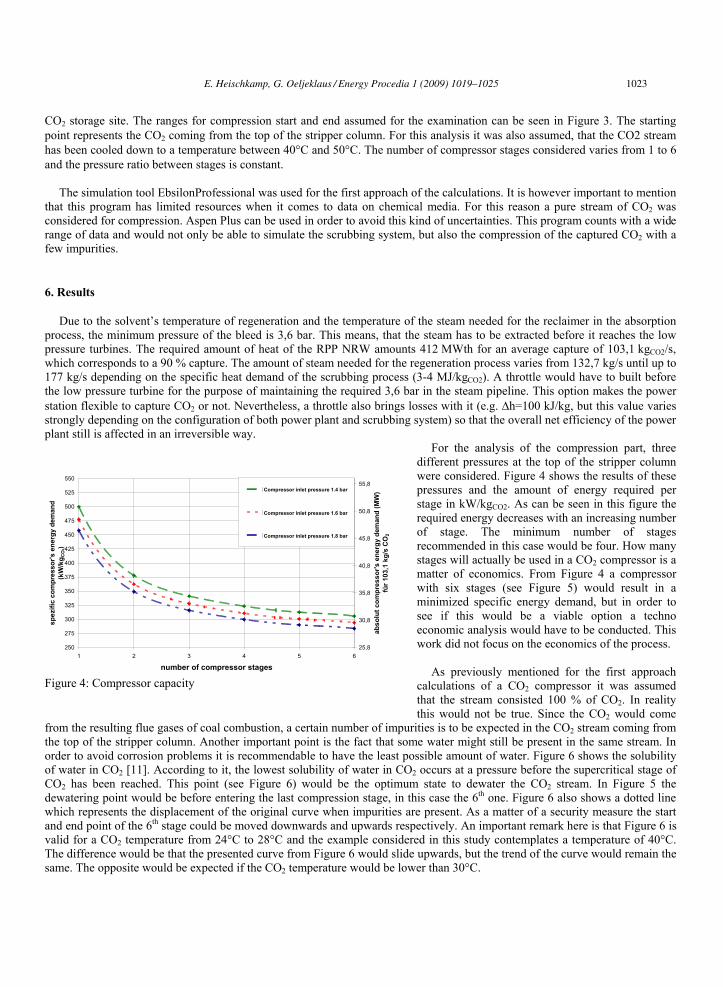
CO2 storage site. The ranges for compression start and end assumed for the examination can be seen in Figure 3. The starting point represents the CO2 coming from the top of the stripper column. For this analysis it was also assumed, that the CO2 stream has been cooled down to a temperature between 40°C and 50°C. The number of compressor stages considered varies from 1 to 6 and the pressure ratio between stages is constant.
The simulation tool EbsilonProfessional was used for the first approach of the calculations. It is however important to mentionthat this program has limited resources when it comes to data on chemical media. For this reason a pure stream of CO2 wasconsidered for compression. Aspen Plus can be used in order to avoid this kind of uncertainties. This program counts with a widerange of data and would not only be able to simulate the scrubbing system, but also the compression of the captured CO2 with a few impurities.
6. Results
Due to the solvent’s temperature of regeneration and the temperature of the steam needed for the reclaimer in the absorption process, the minimum pressure of the bleed is 3,6 bar. This means, that the steam has to be extracted before it reaches the lowpressure turbines. The required amount of heat of the RPP NRW amounts 412 MWth for an average capture of 103,1 kgCO2/s, which corresponds to a 90 % capture. The amount of steam needed for the regeneration process varies from 132,7 kg/s until up to177 kg/s depending on the specific heat demand of the scrubbing process (3-4 MJ/kgCO2). A throttle would have to built before the low pressure turbine for the purpose of maintaining the required 3,6 bar in the steam pipeline. This option makes the powerstation flexible to capture CO2 or not. Nevertheless, a throttle also brings losses with it (e.g. h=100 kJ/kg, but this value varies strongly depending on the configuration of both power plant and scrubbing system) so that the overall net efficiency of the power plant still is affected in an irreversible way.
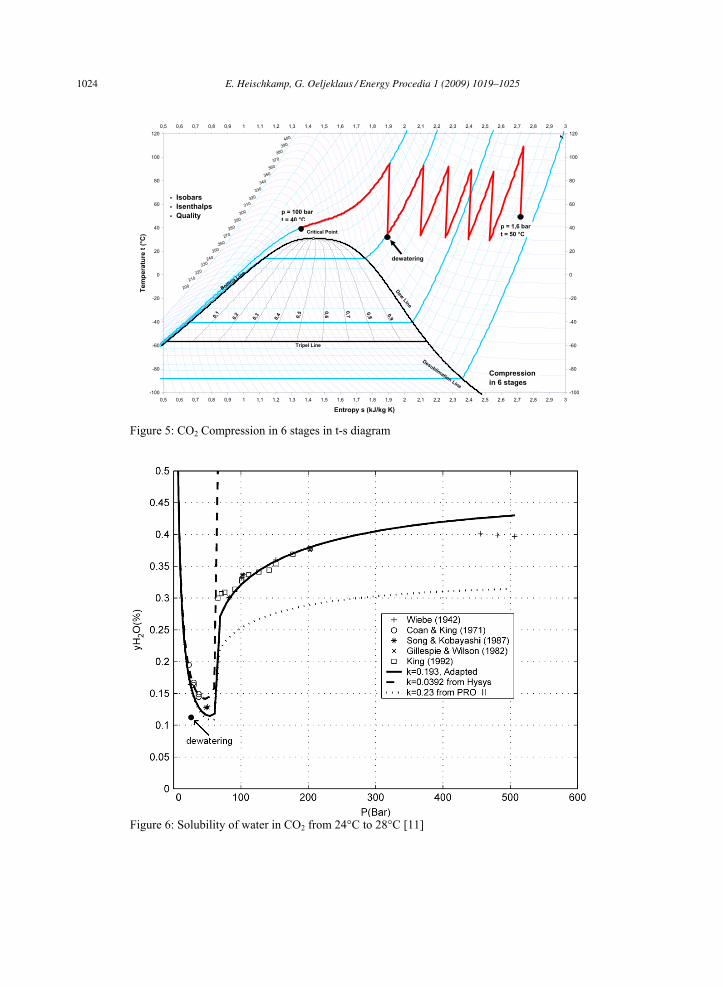
For the analysis of the compression part, threedifferent pressures at the top of the stripper columnwere considered. Figure 4 shows the results of these pressures and the amount of energy required perstage in kW/kgCO2. As can be seen in this figure the required energy decreases with an increasing number of stage. The minimum number of stagesrecommended in this case would be four. How many stages will actually be used in a CO2 compressor is a matter of economics. From Figure 4 a compressorwith six stages (see Figure 5) would result in aminimized specific energy demand, but in order tosee if this would be a viable option a technoeconomic analysis would have to be conducted. This work did not focus on the economics of the process.
As previously mentioned for the first approachcalculations of a CO2 compressor it was assumedthat the stream consisted 100 % of CO2. In realitythis would not be true. Since the CO2 would come
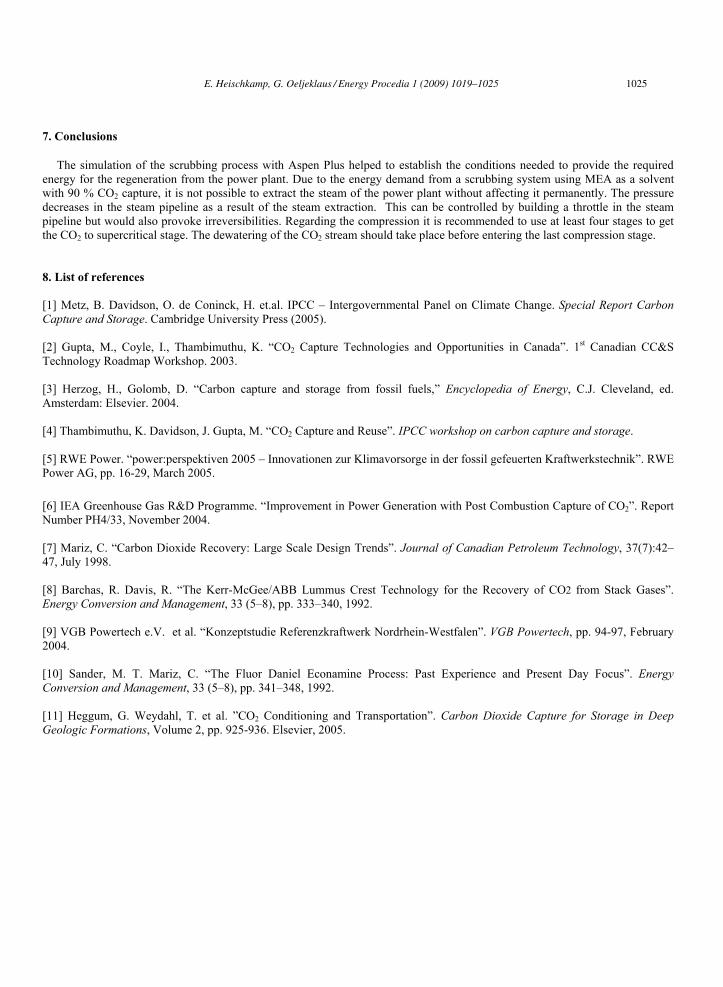
from the resulting flue gases of coal combustion, a certain number of impurities is to be expected in the CO2 stream coming from the top of the stripper column. Another important point is the fact that some water might still be present in the same stream. In order to avoid corrosion problems it is recommendable to have the least possible amount of water. Figure 6 shows the solubilityof water in CO2 [11]. According to it, the lowest solubility of water in CO2 occurs at a pressure before the supercritical stage of CO2 has been reached. This point (see Figure 6) would be the optimum state to dewater the CO2 stream. In Figure 5 thedewatering point would be before entering the last compression stage, in this case the 6th one. Figure 6 also shows a dotted line which represents the displacement of the original curve when impurities are present. As a matter of a security measure the startand end point of the 6th stage could be moved downwards and upwards respectively. An important remark here is that Figure 6 is valid for a CO2 temperature from 24°C to 28°C and the example considered in this study contemplates a temperature of 40°C. The difference would be that the presented curve from Figure 6 would slide upwards, but the trend of the curve would remain thesame. The opposite would be expected if the CO2 temperature would be lower than 30°C.
55055,8
525
man
d 500 (MW
)
50,8
nd
gy d
e 475 a
450 45,8
gy d
em2
ern CO
s e ) r2 425
CO
'es
sor g
W/k 400 40,8 s
ene
' 1 kg
/s
r (k 375
p ssor
103
,
com fü
r
350 pre
35,8
ic
if 325 com
z ut
spe
300 30,8
275 abso
l
250 25,81 2 3 4 5 6
number of compressor stages
Druck Verdichter Ein 1,4 bar
Druck Verdichter Ein 1,6 bar
Druck Verdichter Ein 1,8 bar
Compressor inlet pressure 1.4 bar
Compressor inlet pressure 1.6 bar
Compressor inlet pressure 1.8 bar
Figure 4: Compressor capacity
E. Heischkamp, G. Oeljeklaus / Energy Procedia 1 (2009) 1019–1025 1023
1
310
300
290
280
270
260
250
240
230
220
210
200
400
390
380
370
360
350
340
330
320
Boiling Line
DewLine
0,9
0,8
0,7
0,60,5
0,4
0,30,20,1
Critical Point
Tripel Line
Desublimation Line-100
-80
-60
-40
-20
0
20
40
60
80
100
120
0,5 0,6 0,7 0,8 0,9 1 1,1 1,2 1,3 1,4 1,5 1,6 1,7 1,8 1,9 2 2,1 2,2 2,3 2,4 2,5 2,6 2,7 2,8 2,9 3
Entropy s (kJ/kg K)
Tem
pera
ture
t (°
C)
-100
-80
-60
-40
-20
0
20
40
60
80
100
1200,5 0,6 0,7 0,8 0,9 1 1,1 1,2 1,3 1,4 1,5 1,6 1,7 1,8 1,9 2 2,1 2,2 2,3 2,4 2,5 2,6 2,7 2,8 2,9 3
- Isobars- Isenthalps- Quality
p = 1,6 bart = 50 °C
p = 100 bart = 40 °C
Compression in 6 stages
dewatering
Figure 5: CO2 Compression in 6 stages in t-s diagram
Figure 6: Solubility of water in CO2 from 24°C to 28°C [11]
1024 E. Heischkamp, G. Oeljeklaus / Energy Procedia 1 (2009) 1019–1025
7. Conclusions
The simulation of the scrubbing process with Aspen Plus helped to establish the conditions needed to provide the required energy for the regeneration from the power plant. Due to the energy demand from a scrubbing system using MEA as a solvent with 90 % CO2 capture, it is not possible to extract the steam of the power plant without affecting it permanently. The pressure decreases in the steam pipeline as a result of the steam extraction. This can be controlled by building a throttle in the steampipeline but would also provoke irreversibilities. Regarding the compression it is recommended to use at least four stages to getthe CO2 to supercritical stage. The dewatering of the CO2 stream should take place before entering the last compression stage.
8. List of references
[1] Metz, B. Davidson, O. de Coninck, H. et.al. IPCC – Intergovernmental Panel on Climate Change. Special Report Carbon Capture and Storage. Cambridge University Press (2005).
[2] Gupta, M., Coyle, I., Thambimuthu, K. “CO2 Capture Technologies and Opportunities in Canada”. 1st Canadian CC&S Technology Roadmap Workshop. 2003.
[3] Herzog, H., Golomb, D. “Carbon capture and storage from fossil fuels,” Encyclopedia of Energy, C.J. Cleveland, ed. Amsterdam: Elsevier. 2004.
[4] Thambimuthu, K. Davidson, J. Gupta, M. “CO2 Capture and Reuse”. IPCC workshop on carbon capture and storage.
[5] RWE Power. “power:perspektiven 2005 – Innovationen zur Klimavorsorge in der fossil gefeuerten Kraftwerkstechnik”. RWE Power AG, pp. 16-29, March 2005.
[6] IEA Greenhouse Gas R&D Programme. “Improvement in Power Generation with Post Combustion Capture of CO2”. Report Number PH4/33, November 2004.
[7] Mariz, C. “Carbon Dioxide Recovery: Large Scale Design Trends”. Journal of Canadian Petroleum Technology, 37(7):42–47, July 1998.
[8] Barchas, R. Davis, R. “The Kerr-McGee/ABB Lummus Crest Technology for the Recovery of CO2 from Stack Gases”. Energy Conversion and Management, 33 (5–8), pp. 333–340, 1992.
[9] VGB Powertech e.V. et al. “Konzeptstudie Referenzkraftwerk Nordrhein-Westfalen”. VGB Powertech, pp. 94-97, February 2004.
[10] Sander, M. T. Mariz, C. “The Fluor Daniel Econamine Process: Past Experience and Present Day Focus”. Energy Conversion and Management, 33 (5–8), pp. 341–348, 1992.
[11] Heggum, G. Weydahl, T. et al. ”CO2 Conditioning and Transportation”. Carbon Dioxide Capture for Storage in Deep Geologic Formations, Volume 2, pp. 925-936. Elsevier, 2005.
E. Heischkamp, G. Oeljeklaus / Energy Procedia 1 (2009) 1019–1025 1025