ThyssenKrupp Industrial Solutions · PDF fileTraining & Services (S) ... IFA June 2014, Global...
25
Wir entwickeln die Zukunft für Sie. ThyssenKrupp Industrial Solutions Hans Christoph Atzpodien September 2014
Transcript of ThyssenKrupp Industrial Solutions · PDF fileTraining & Services (S) ... IFA June 2014, Global...
Wir entwickeln die Zukunft für Sie.
ThyssenKrupp Industrial Solutions Hans Christoph Atzpodien September 2014
Developing the future.
Industrial Solutions September 2014
2
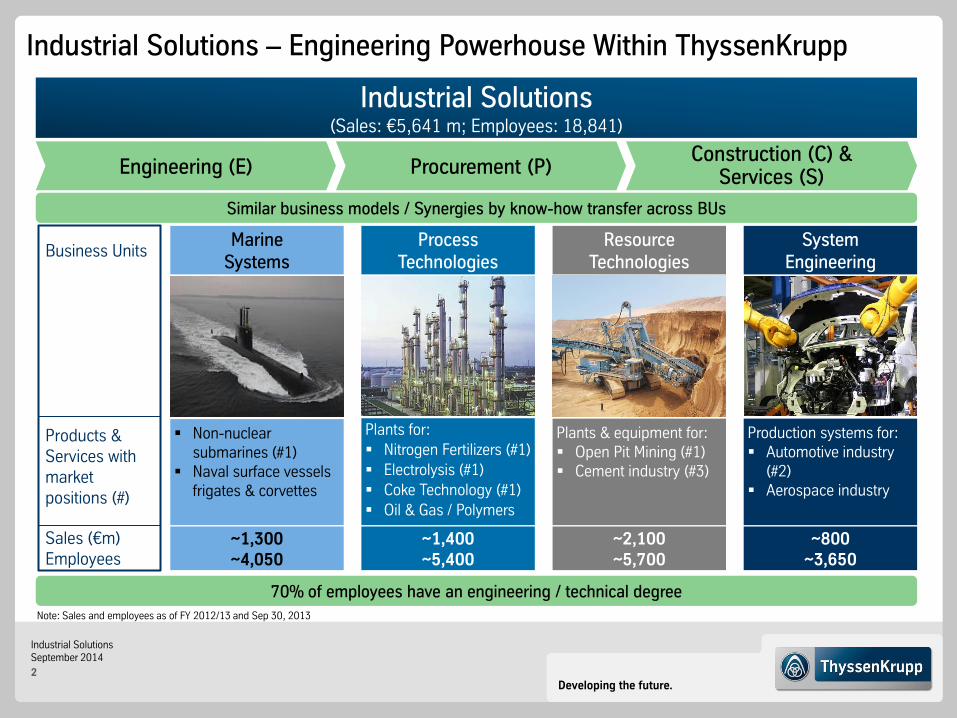
Industrial Solutions – Engineering Powerhouse Within ThyssenKrupp
Industrial Solutions (Sales: €5,641 m; Employees: 18,841)
Construction (C) & Services (S) Procurement (P) Engineering (E)
70% of employees have an engineering / technical degree
Similar business models / Synergies by know-how transfer across BUs
Note: Sales and employees as of FY 2012/13 and Sep 30, 2013
Sales (€m) Employees
Business Units
Products & Services with market positions (#)
Marine Systems
~1,300 ~4,050
Non-nuclear submarines (#1)
Naval surface vessels frigates & corvettes
Process Technologies
~1,400 ~5,400
Plants for:
Nitrogen Fertilizers (#1)
Electrolysis (#1)
Coke Technology (#1)
Oil & Gas / Polymers
Resource Technologies
~2,100 ~5,700
Plants & equipment for: Open Pit Mining (#1) Cement industry (#3)
System Engineering
~800 ~3,650
Production systems for: Automotive industry
(#2) Aerospace industry
Developing the future.
Industrial Solutions September 2014
3
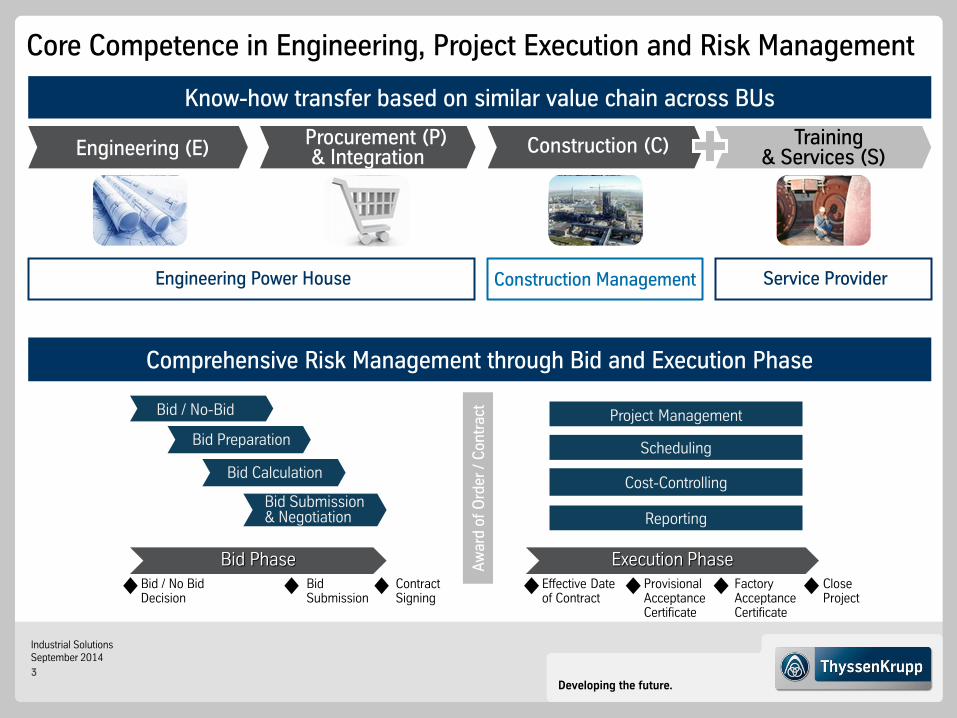
Core Competence in Engineering, Project Execution and Risk Management
Engineering (E)
Construction Management Engineering Power House Service Provider
Know-how transfer based on similar value chain across BUs
Procurement (P) & Integration
Construction (C) Training & Services (S)
Comprehensive Risk Management through Bid and Execution Phase
Close Project
Bid Phase Execution Phase Effective Date of Contract
Provisional Acceptance Certificate
Factory Acceptance Certificate
Contract Signing
Bid / No Bid Decision
Bid Submission
Bid / No-Bid
Reporting
Project Management
Cost-Controlling
Scheduling Bid Preparation
Bid Submission & Negotiation
Aw
ard
of
Ord
er /
Co
ntr
act
Bid Calculation
Developing the future.
Industrial Solutions September 2014
4
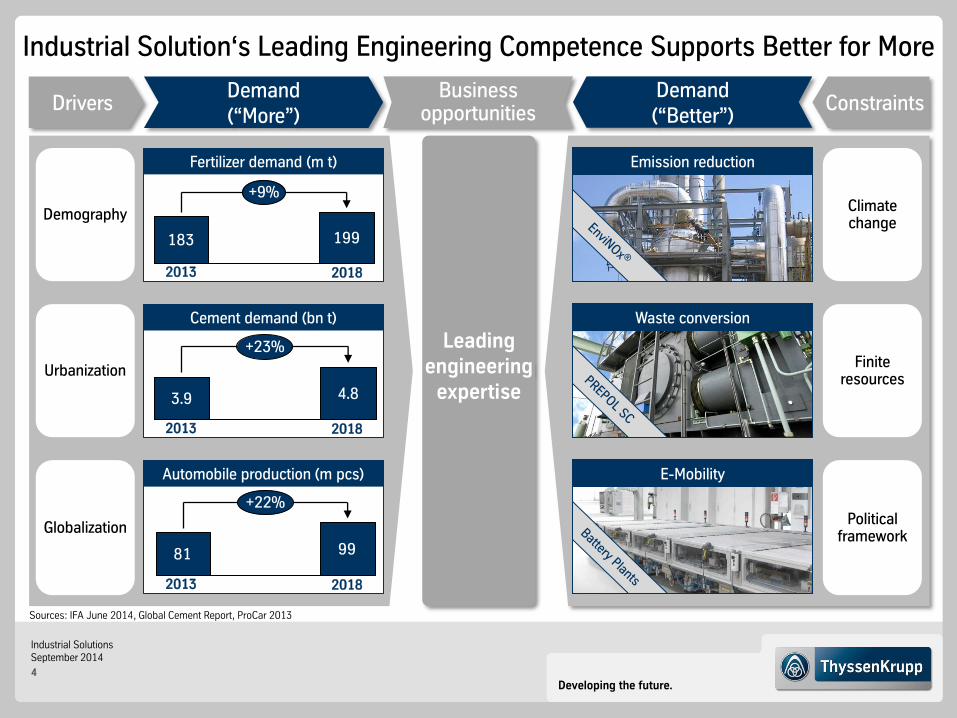
Demography
2013 2018
Urbanization
Cement demand (bn t)
2013 2018
Globalization
2013 2018
Fertilizer demand (m t)
Automobile production (m pcs)
183 199
+9%
4.8 3.9
+23%
81 99
+22%
Industrial Solution‘s Leading Engineering Competence Supports Better for More
Sources: IFA June 2014, Global Cement Report, ProCar 2013
Leading engineering
expertise
Demand (“More”)
Drivers Business
opportunities Constraints Demand (“Better”)
Climate change
Finite resources
Political framework
Emission reduction
Waste conversion
E-Mobility
Developing the future.
Industrial Solutions September 2014
5
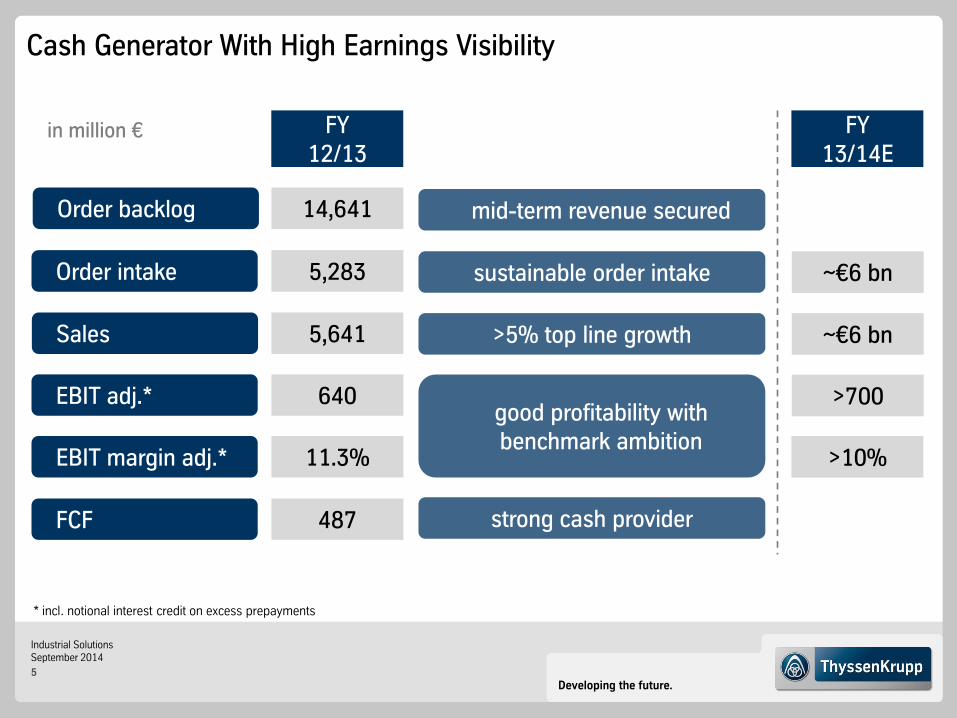
Cash Generator With High Earnings Visibility
FY 12/13
in million €
FCF 487 strong cash provider
FY 13/14E
EBIT margin adj.* 11.3% >10%
Sales 5,641 >5% top line growth ~€6 bn
Order backlog 14,641 mid-term revenue secured
Order intake 5,283 sustainable order intake ~€6 bn
EBIT adj.* 640 good profitability with
benchmark ambition
>700
* incl. notional interest credit on excess prepayments
Developing the future.
Industrial Solutions September 2014
6
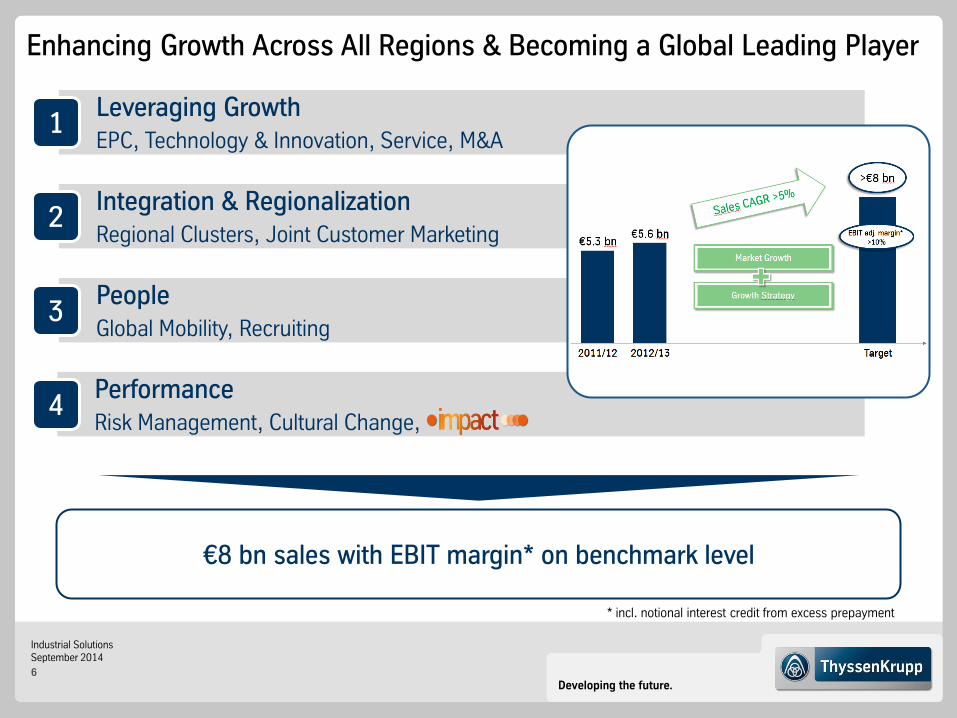
Leveraging Growth EPC, Technology & Innovation, Service, M&A
1
Integration & Regionalization Regional Clusters, Joint Customer Marketing
2
People Global Mobility, Recruiting
3
Performance Risk Management, Cultural Change,
4
Enhancing Growth Across All Regions & Becoming a Global Leading Player
€8 bn sales with EBIT margin* on benchmark level
* incl. notional interest credit from excess prepayment
Developing the future.
Industrial Solutions September 2014
7
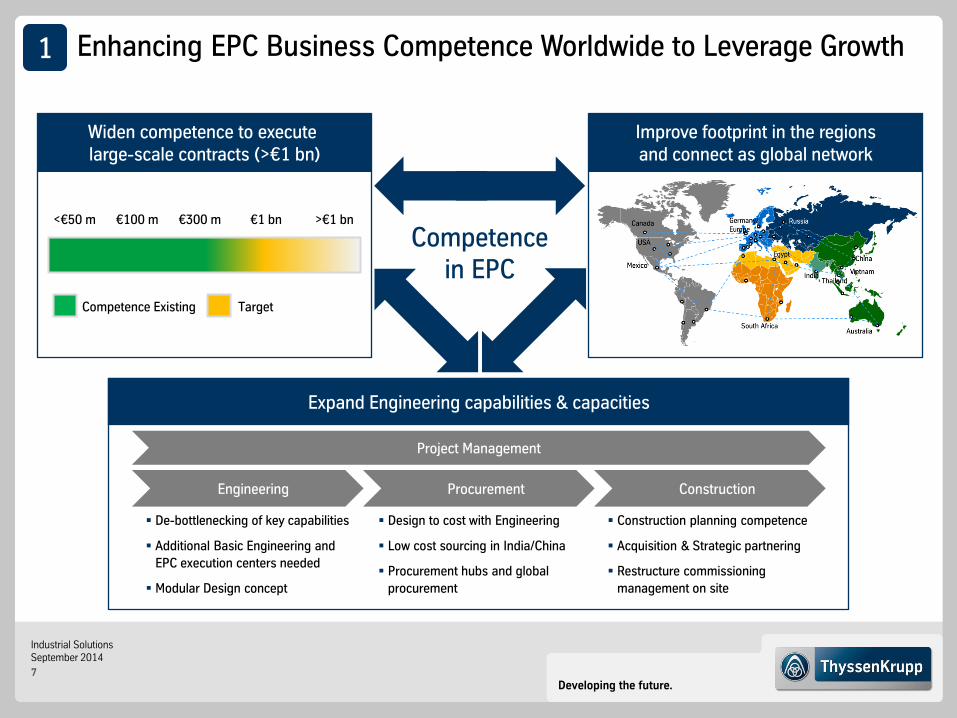
Enhancing EPC Business Competence Worldwide to Leverage Growth
Competence in EPC
Improve footprint in the regions and connect as global network
De-bottlenecking of key capabilities
Additional Basic Engineering and
EPC execution centers needed
Modular Design concept
Design to cost with Engineering
Low cost sourcing in India/China
Procurement hubs and global
procurement
Construction planning competence
Acquisition & Strategic partnering
Restructure commissioning
management on site
Procurement Construction Engineering
Project Management
Expand Engineering capabilities & capacities
Widen competence to execute large-scale contracts (>€1 bn)
Competence Existing Target
<€50 m €300 m >€1 bn €1 bn €100 m
1
Developing the future.
Industrial Solutions September 2014
8
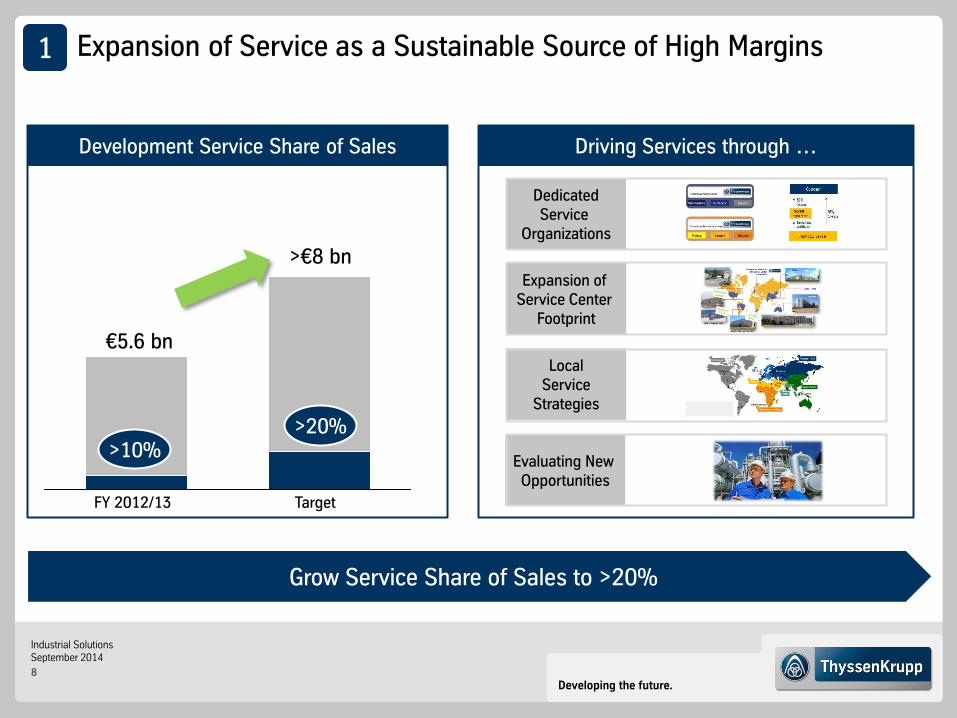
Expansion of Service as a Sustainable Source of High Margins
Development Service Share of Sales Driving Services through …
Expansion of Service Center
Footprint
Local Service
Strategies
Evaluating New Opportunities
Dedicated Service
Organizations
FY 2012/13 Target
Grow Service Share of Sales to >20%
1
€5.6 bn
>10%
>€8 bn
>20%
Developing the future.
Industrial Solutions September 2014
9
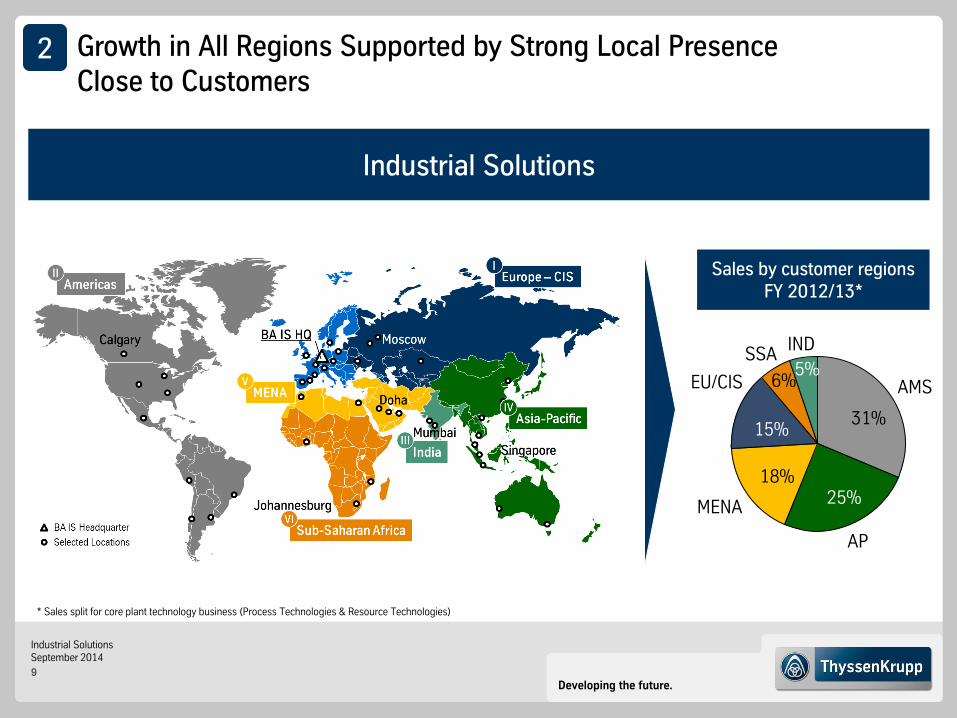
Industrial Solutions
Sales by customer regions FY 2012/13*
AMS
AP
MENA
EU/CIS
SSA IND
* Sales split for core plant technology business (Process Technologies & Resource Technologies)
31%
25% 18%
15%
6% 5%
2 Growth in All Regions Supported by Strong Local Presence Close to Customers
Developing the future.
Industrial Solutions September 2014
10
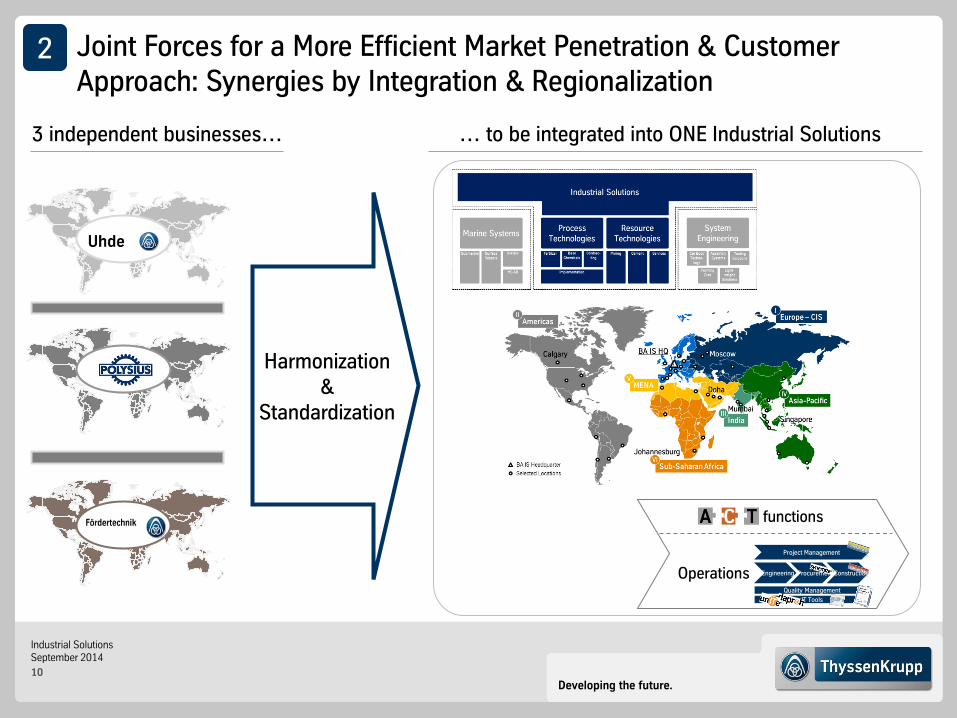
… to be integrated into ONE Industrial Solutions 3 independent businesses…
Harmonization &
Standardization
functions
Operations Procurement Construction Engineering
Project Management
Quality Management
IT Tools
Joint Forces for a More Efficient Market Penetration & Customer Approach: Synergies by Integration & Regionalization
2
Developing the future.
Industrial Solutions September 2014
11
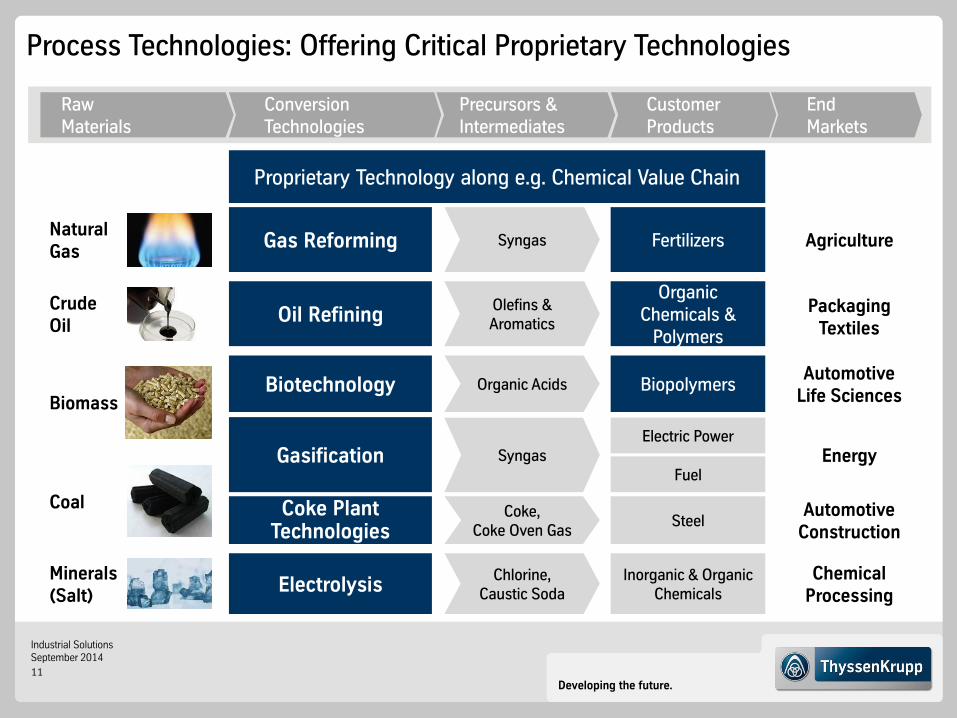
Process Technologies: Offering Critical Proprietary Technologies
Natural Gas
Crude Oil
Gas Reforming
Biomass Biotechnology
Agriculture Syngas Fertilizers
Energy
Automotive Construction
Coal Coke Plant Technologies
Gasification Electric Power
Fuel
Minerals (Salt)
Electrolysis Chemical
Processing
Steel
Inorganic & Organic Chemicals
Raw Materials
Conversion Technologies
Precursors & Intermediates
Customer Products
End Markets
Oil Refining Organic
Chemicals & Polymers
Biopolymers
Proprietary Technology along e.g. Chemical Value Chain
Olefins & Aromatics
Organic Acids
Syngas
Coke, Coke Oven Gas
Chlorine, Caustic Soda
Packaging Textiles
Automotive Life Sciences

Developing the future.
Industrial Solutions September 2014
12
World‘s Largest Fertilizer Complex in Saudi-Arabien
Annual production
4.3 m ha
3,300 t/day ammonia
Production capacity Cultivated area
Developing the future.
Industrial Solutions September 2014
13
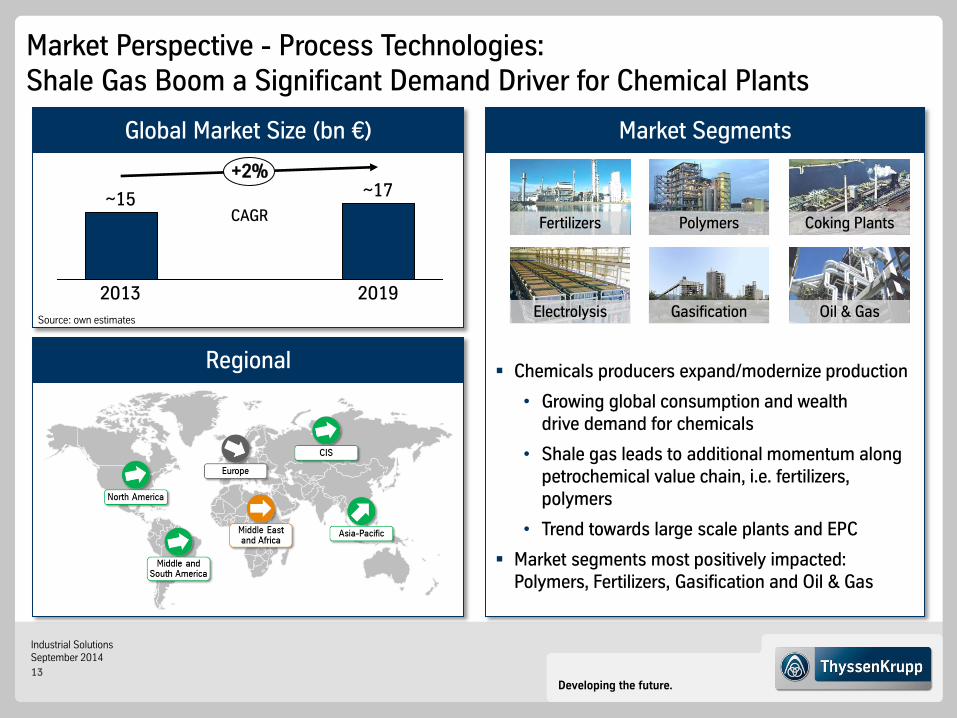
Regional
Global Market Size (bn €) Market Segments
Market Perspective - Process Technologies: Shale Gas Boom a Significant Demand Driver for Chemical Plants
2013 2019
CAGR
Electrolysis Gasification Oil & Gas
Coking Plants Polymers Fertilizers
+2% ~17 ~15
Source: own estimates
Chemicals producers expand/modernize production
• Growing global consumption and wealth drive demand for chemicals
• Shale gas leads to additional momentum along petrochemical value chain, i.e. fertilizers, polymers
• Trend towards large scale plants and EPC
Market segments most positively impacted: Polymers, Fertilizers, Gasification and Oil & Gas

Developing the future.
Industrial Solutions September 2014
14
Resource Technologies: Broad Exposure in Cement and Mining Sectors
Covering entire Cement production chain
Raw material preparation
Clinker production
Cement manufacturing
Comprehensive Mining chain coverage
Developing the future.
Industrial Solutions September 2014
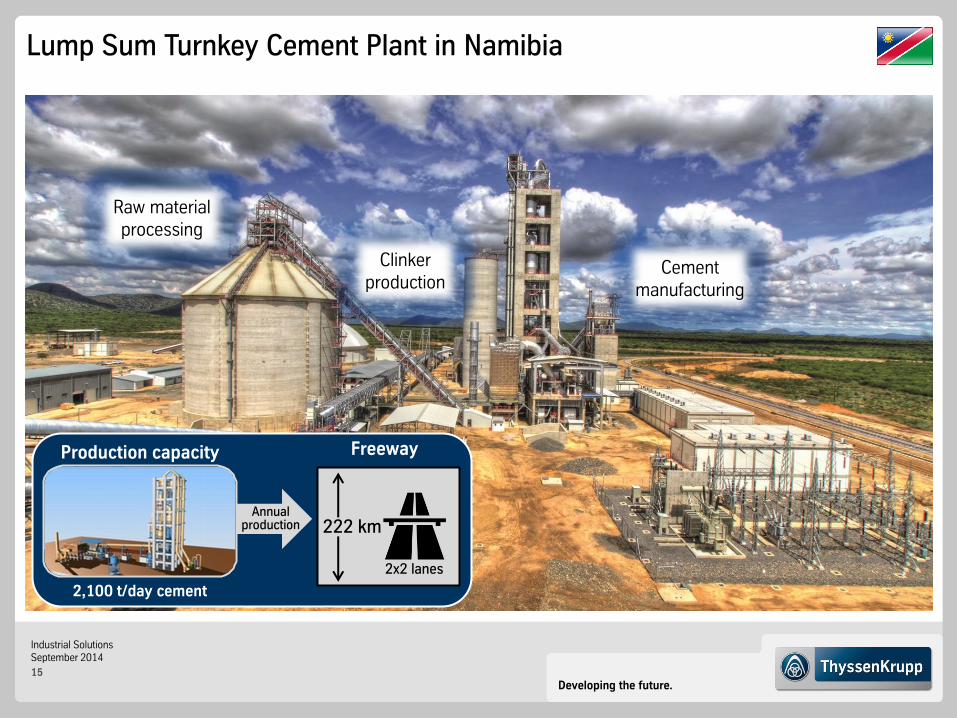
15
Lump Sum Turnkey Cement Plant in Namibia
2,100 t/day cement
Production capacity Freeway
222 km
2x2 lanes
Annual production
Clinker production
Raw material processing
Cement manufacturing
Developing the future.
Industrial Solutions September 2014
16
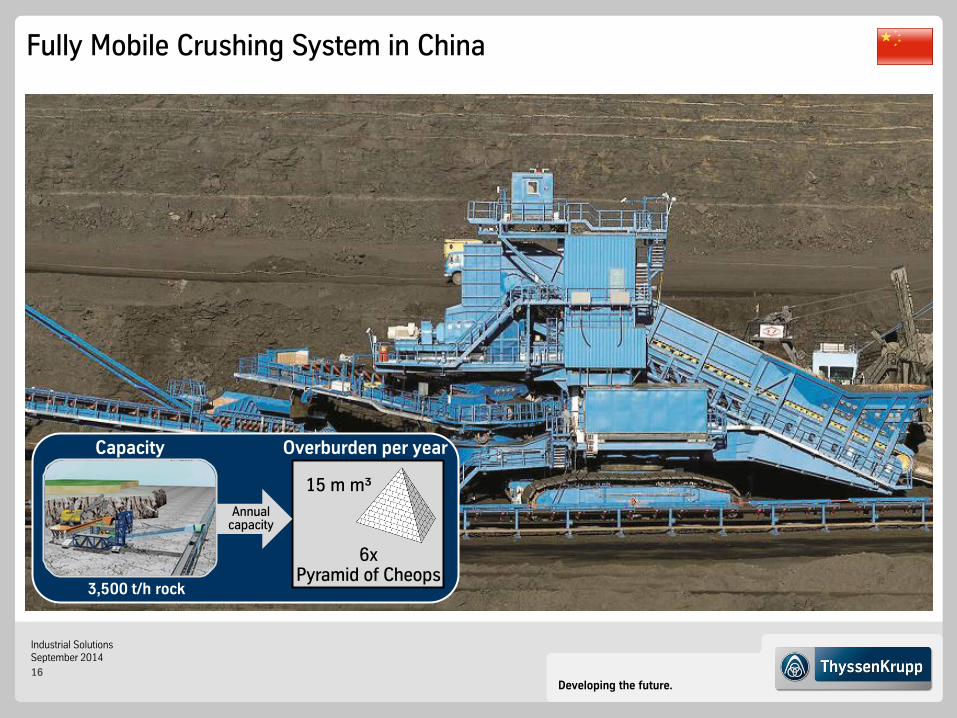
Fully Mobile Crushing System in China
Overburden per year
3,500 t/h rock
Capacity
15 m m³
6x Pyramid of Cheops
Annual capacity
Developing the future.
Industrial Solutions September 2014
17
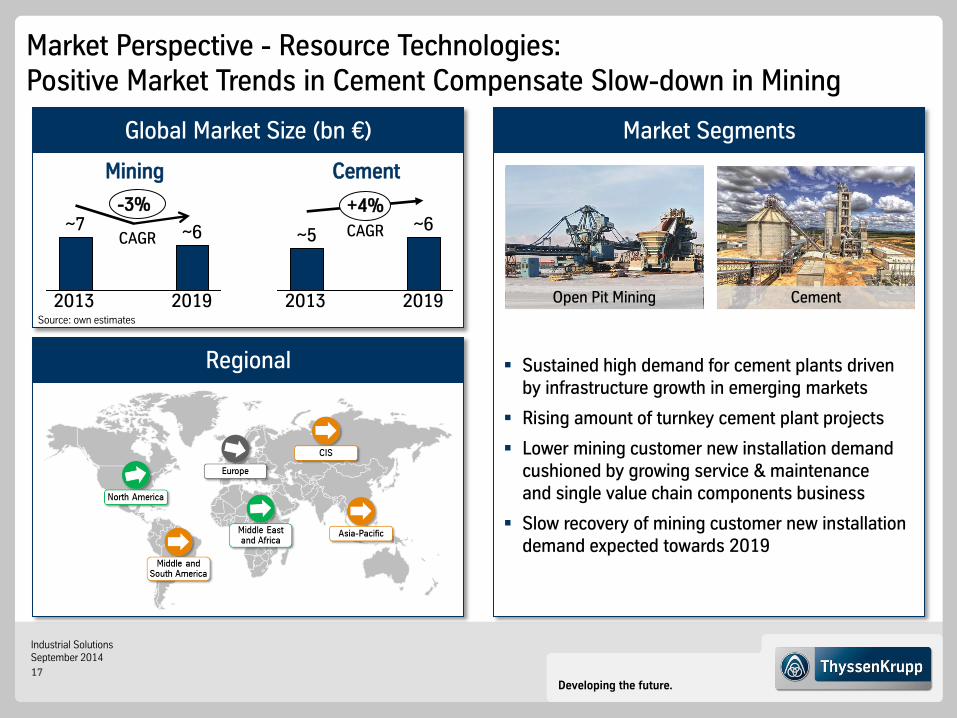
Regional
Global Market Size (bn €) Market Segments
2013 2019
CAGR
2013 2019
Mining Cement
CAGR
Open Pit Mining Cement
Market Perspective - Resource Technologies: Positive Market Trends in Cement Compensate Slow-down in Mining
~6
-3% ~7
~5
+4% ~6
Source: own estimates
Sustained high demand for cement plants driven by infrastructure growth in emerging markets
Rising amount of turnkey cement plant projects
Lower mining customer new installation demand cushioned by growing service & maintenance and single value chain components business
Slow recovery of mining customer new installation demand expected towards 2019
Developing the future.
Industrial Solutions September 2014
18
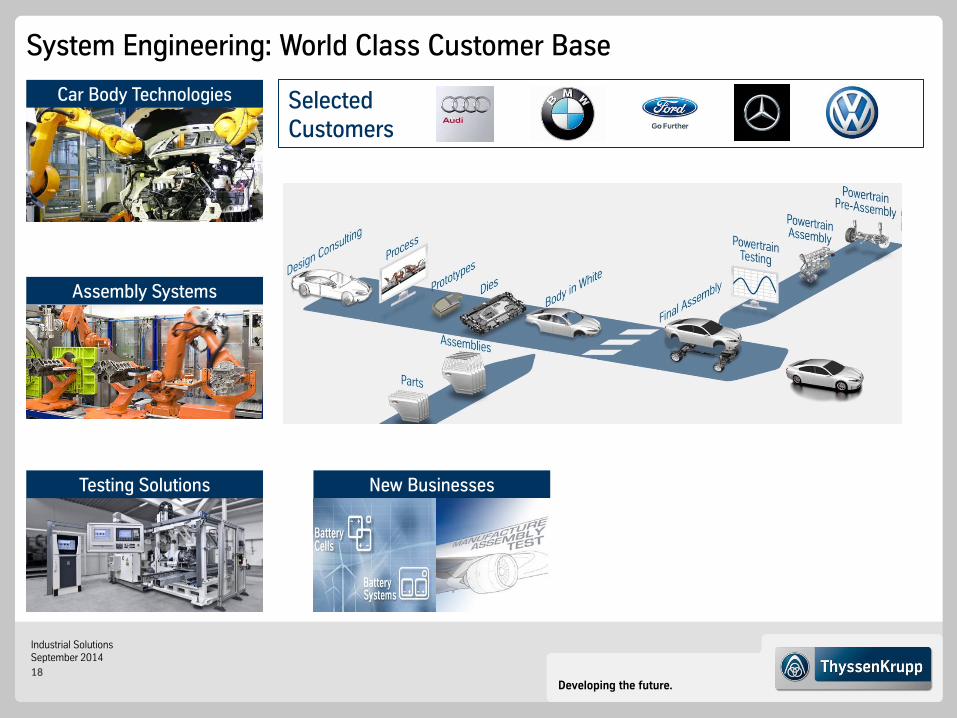
Selected Customers
Car Body Technologies
Testing Solutions
Assembly Systems
New Businesses
System Engineering: World Class Customer Base
Developing the future.
Industrial Solutions September 2014
19
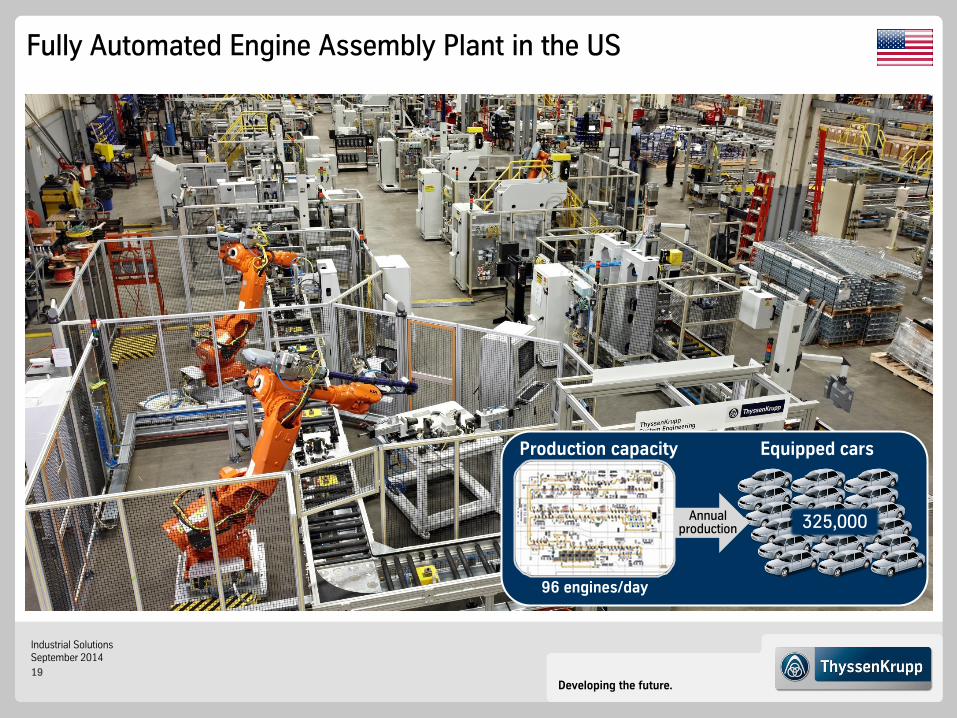
Fully Automated Engine Assembly Plant in the US
Production capacity
96 engines/day
Equipped cars
325,000 Annual production

Developing the future.
Industrial Solutions September 2014
20
Regional
Global Market Size (bn €)
2013 2019
Market Segments
CAGR
Automotive Aerospace
Source: own estimates
Stable project volume on high level
OEM investments driven by car model cycles
E-mobility trend as additional project opportunity
Main growth markets Asia Pacific & China
New opportunities in aerospace industry
+4% ~7
~6
Market Perspective - System Engineering: Long-term Positive Market Outlook with Main Growth Drivers in Asia
Developing the future.
Industrial Solutions September 2014
21
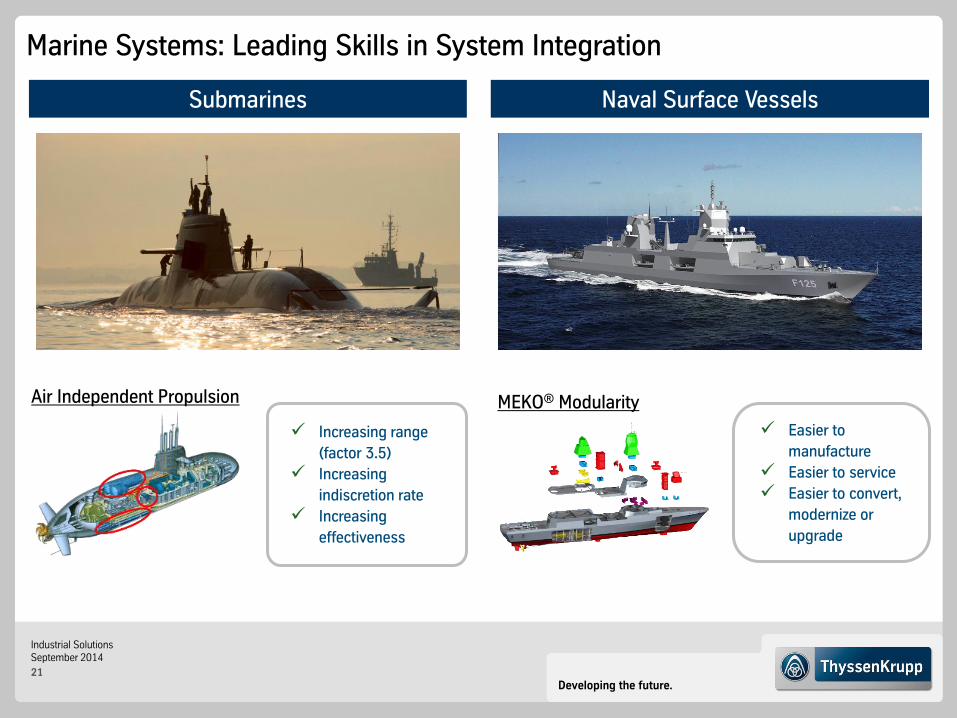
Submarines Naval Surface Vessels
Air Independent Propulsion MEKO® Modularity
Increasing range
(factor 3.5)
Increasing
indiscretion rate
Increasing
effectiveness
Easier to
manufacture
Easier to service
Easier to convert,
modernize or
upgrade
Marine Systems: Leading Skills in System Integration
Developing the future.
Industrial Solutions September 2014
22
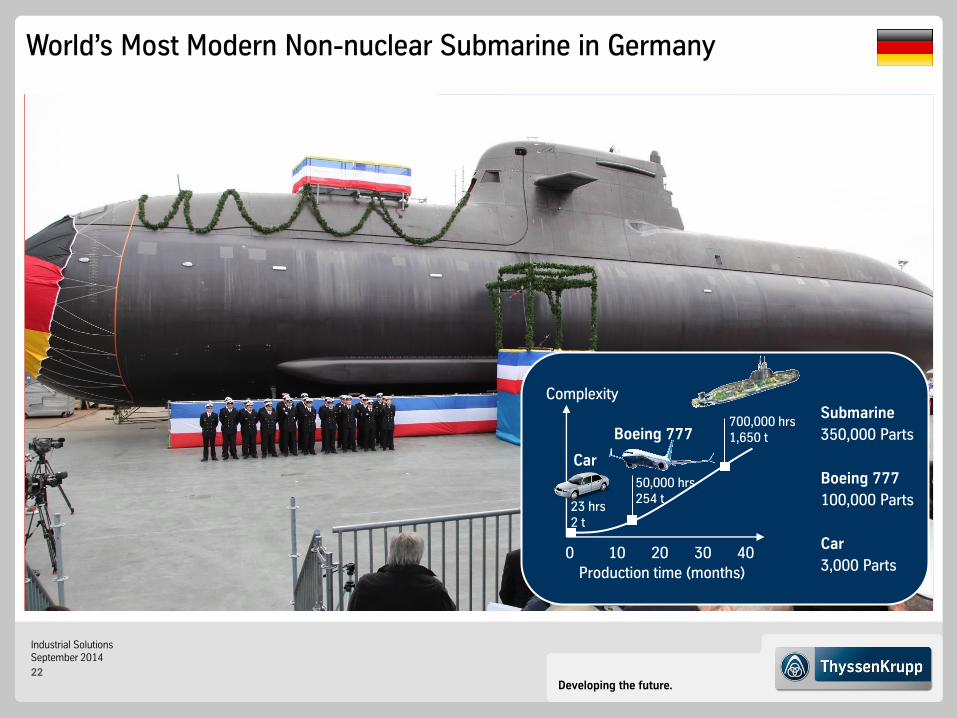
World’s Most Modern Non-nuclear Submarine in Germany
Submarine
350,000 Parts
Boeing 777
100,000 Parts
Car
3,000 Parts
Boeing 777
Car
Production time (months)
50,000 hrs 254 t
23 hrs 2 t
700,000 hrs 1,650 t
0 40 10 20 30
Complexity

Developing the future.
Industrial Solutions September 2014
23
Regional
Global Market Size (bn €)
2013 2019
Market Segments
CAGR
Submarines Naval Surface Vessels
Source: own estimates
Solid global project pipeline
Governmental defense programs driving investments across regions
Growing service market with demand for modernization & maintenance
+6% ~6
~4
Market Perspective - Marine Systems: Global Defense Budgets Drive Naval Demand
Developing the future.
Industrial Solutions September 2014
24
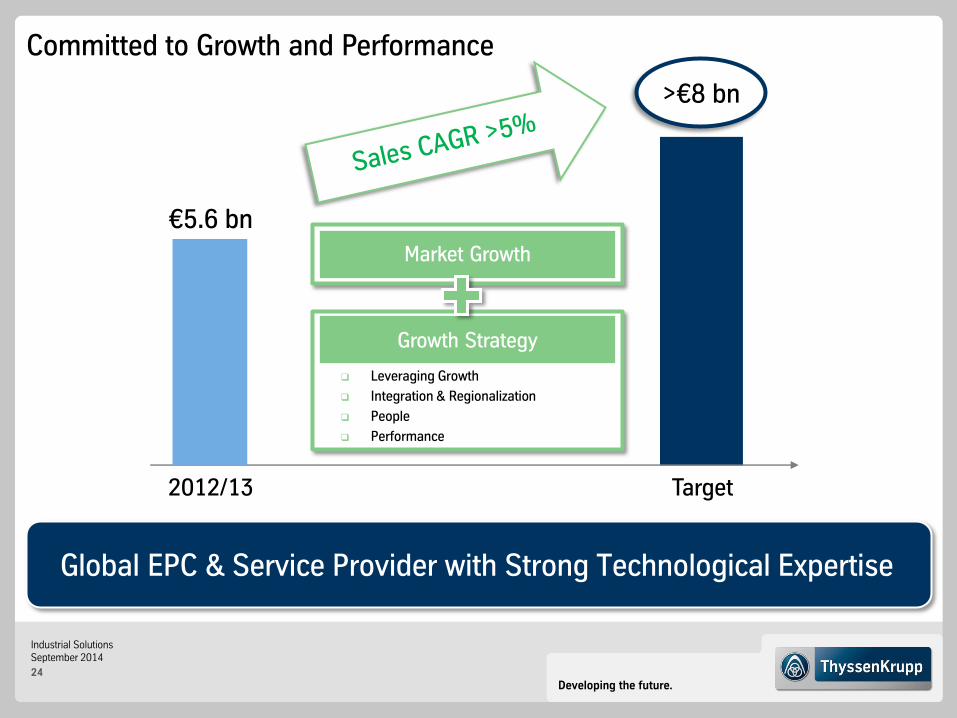
Market Growth
Committed to Growth and Performance
Target 2012/13
€5.6 bn
>€8 bn
Global EPC & Service Provider with Strong Technological Expertise
Growth Strategy
Leveraging Growth
Integration & Regionalization
People
Performance
Developing the future.
Industrial Solutions September 2014
25
Disclaimer ThyssenKrupp AG
“The information set forth and included in this presentation is not provided in connection with an offer or solicitation for the purchase
or sale of a security and is intended for informational purposes only.
This presentation contains forward-looking statements that are subject to risks and uncertainties. Statements contained herein that
are not statements of historical fact may be deemed to be forward-looking information. When we use words such as “plan,” “believe,”
“expect,” “anticipate,” “intend,” “estimate,” “may” or similar expressions, we are making forward-looking statements. You should not
rely on forward-looking statements because they are subject to a number of assumptions concerning future events, and are subject to
a number of uncertainties and other factors, many of which are outside of our control, that could cause actual results to differ
materially from those indicated. These factors include, but are not limited to, the following:
(i) market risks: principally economic price and volume developments,
(ii) dependence on performance of major customers and industries,
(iii) our level of debt, management of interest rate risk and hedging against commodity price risks;
(iv) costs associated with, and regulation relating to, our pension liabilities and healthcare measures,
(v) environmental protection and remediation of real estate and associated with rising standards for real estate environmental
protection,
(vi) volatility of steel prices and dependence on the automotive industry,
(vii) availability of raw materials;
(viii) inflation, interest rate levels and fluctuations in exchange rates;
(ix) general economic, political and business conditions and existing and future governmental regulation; and
(x) the effects of competition.
Please note that we disclaim any intention or obligation to update or revise any forward-looking statements whether as a result of new
information, future events or otherwise.”