UV-vis und EPR-Spektroskopie: Grundlagen und Anwendungen ... · Leibniz-Institut für Katalyse e....
37
Leibniz-Institut für Katalyse e. V. an der Universität Rostock, Außenstelle Berlin Angelika Brückner UV-vis und EPR-Spektroskopie: Grundlagen und Anwendungen in der Heterogenen Katalyse
Transcript of UV-vis und EPR-Spektroskopie: Grundlagen und Anwendungen ... · Leibniz-Institut für Katalyse e....

Leibniz-Institut für Katalyse e. V.an der Universität Rostock, Außenstelle Berlin
Angelika Brückner
UV-vis und EPR-Spektroskopie:
Grundlagen und Anwendungen
in der Heterogenen Katalyse
Inhalt
• Gesetzmäßigkeiten optischer und magnetischer Dipol-Übergänge– Ermittlung spektroskopischer Terme
– Auswahlregeln
– Lage und Intensität optischer Übergänge
– Einfluss eines äußeren Magnetfeldes
• Apparatives– UV/VIS-Messungen in diffuser Reflexion
– Prinzip und Einflussfaktoren von EPR-Messungen
• Anwendungsbeispiele aus der Katalyse

Regions of the electromagnetic spectrum
103 101 10-1 10-3 10-5 10-7 10-9 10-11λ/m
105 107 109 1011 1013 1015 1017 1019ν/Hz
E/eV 10-7 10-5 10-3 10-1 101 10310-910-11
radio wavesmicrowaves IR UV X-rays γ-rays
NMR EPR
rotations andvibrations
electronictransitions
nucleartransitions
nuclear and electron spin transitions
VIS
FTIR UV-Vis-NIRRaman
UPS
MössbauerXRDXPSXAS

Ermittlung spektroskopischer Terme
Quantenzahlen für Einzelelektronen
n 1 2 3 4 .....K L M N .....
l 0 1 2 3 n – 1s p d f
ml -l -l + 1.....l - 1 l
ms ± 1/2

Ermittlung spektroskopischer Terme
Atome mit mehreren Elektronen
Bahn- und Spindrehimpuls vektoriell gekoppelt
Russel-Saunders-Kopplung (L-S)
(sm · lm) < (sm · sn), (lm · ln) bei d - Elementen
j - j - Kopplung
(sm · lm) > (sm · sn), (lm · ln) bei schweren Elementen (f)
∑=
=n
iisS
1∑
=
=n
iilL
1∑
=
=n
iijJ
1iii lsj +=

Ermittlung spektroskopischer Terme
00
L = l1+ l2
L+S........L+S-1........L-SJJ = L + S
1 0 -1MS
1SS = s1 + s2
01 0 -12.......-23........-34........-4ML
SPDFG01234
l1- l2l1+ l2-3l1+ l2-2l1+ l2-1l1+ l2L
vollständiges Termsymbol
(2S + 1)LJ
V3+ (d2) l1 = l2 = 2 s1 = s2 = ½

Ermittlung der Terme für d2
+ +2 2
+ -2 2
- -2 2
+ +2 1
+ -2 1
- +2 1
+ +1 1
+ -1 1
+ +2 0
+ -2 0
- +2 0
+ +1 0
+ -1 0
- +1 0
- +2 -1
+ +2 -1
+ -2 -1
+ +0 0
+ -0 0
+ +1 -1
+ -1 -1
- +1 -1
+ +2 -2
+ -2 -2
- +2 -2
M M M
- -2 1- -1 1- -2 0
- -1 0- -2 -1
- -0 0- -1 -1- -2 -2
Ms = 0
-1-2-3-4
0
1
2
3
4
Ms = -1Ms =1ML 3G 1G
3F 1F
3D 1D
3P 1P
3S 1S

Termschema für V3+ (oktaedrisch)
x2-y2
z2
xyyzxz
Elektronenkonfiguration
3F
3P
1G
1D
1S
freiesIon
UV/VIS-Banden von [V(H2O)6]3+
25700 cm-1 3T1g3T1g
17800 cm-1 3T1g3T2g3T1g
3T2g
3A2g
1T2g
1Eg
3T1g
1A1g
1T2g
1T1g
1Eg
1A1g
Liganden-feld
3A2g3T1g
3T2g3T1g

Auswahlregeln
Absorption von Licht führt nicht zur Spinpaarung oder – entkopplung
∆s = 0
Bahndrehimpuls eines Elektrons muss sich ändern
∆l ≠ 0
Übergänge zwischen Zuständen gleicher Parität sind verboten
u ug g
u g
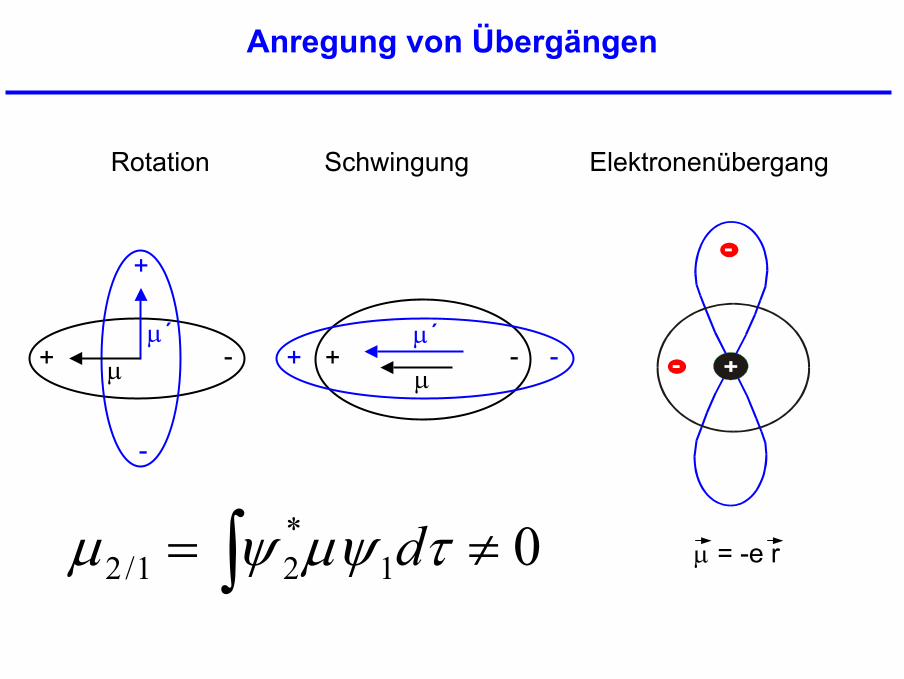
Anregung von Übergängen
+
+
µ´
-
µ - +µ
-+µ´
-
Rotation Schwingung Elektronenübergang
+-
-
µ = -e r01*21/2 ≠= ∫ τµψψµ d

Symmetrieverhalten der d-Orbitale in oktaedrischen Komplexen
d-Orbitale haben gerade Paritätd-d-Übergänge in okt. Komplexen sind symmetrie- verboten
VO
O OO
O
OHerabsetzung der Symmetrie
vibronischer Übergang
Ausnahmen:

Influence on ∆ (νd-d)
• Coordination geometry ∆t = 4/9 ∆oct
• Valence state ∆oct (M2+) < ∆oct (M3+)
• Atomic number
• Bond length between ∆ ∝ 1/r5
metal ion and ligand
• Temperature
• Typ of ligand
3/5
=
∆∆
T
RT
RT
T
VV

Einfluss der Ordnungszahl
Beispiel 8. Nebengruppe
3d [Co(NH3)6]3+ 23000 cm-1
4d [Rh(NH3)6]3+ 34000 cm-1
5d [Ir(NH3)6]3+ 41000 cm-1

Influence on ∆ (νd-d)
• Coordination geometry ∆t = 4/9 ∆oct
• Valence state ∆oct (M2+) < ∆oct (M3+)
• Atomic number
• Bond length between ∆ ∝ 1/r5
metal ion and ligand
• Temperature
• Typ of ligand
3/5
=
∆∆
T
RT
RT
T
VV

Franck-Condon-Prinzip
( ) ( ) ( ) ( )∫ ∫ ′′−= KernElektronee dRRdrrre τϕϕτϕϕµ νν**

Influence on ∆ (νd-d)
• Coordination geometry ∆t = 4/9 ∆oct
• Valence state ∆oct (M2+) < ∆oct (M3+)
• Atomic number
• Bond length between ∆ ∝ 1/r5
metal ion and ligand
• Temperature
• Typ of ligand
3/5
=
∆∆
T
RT
RT
T
VV
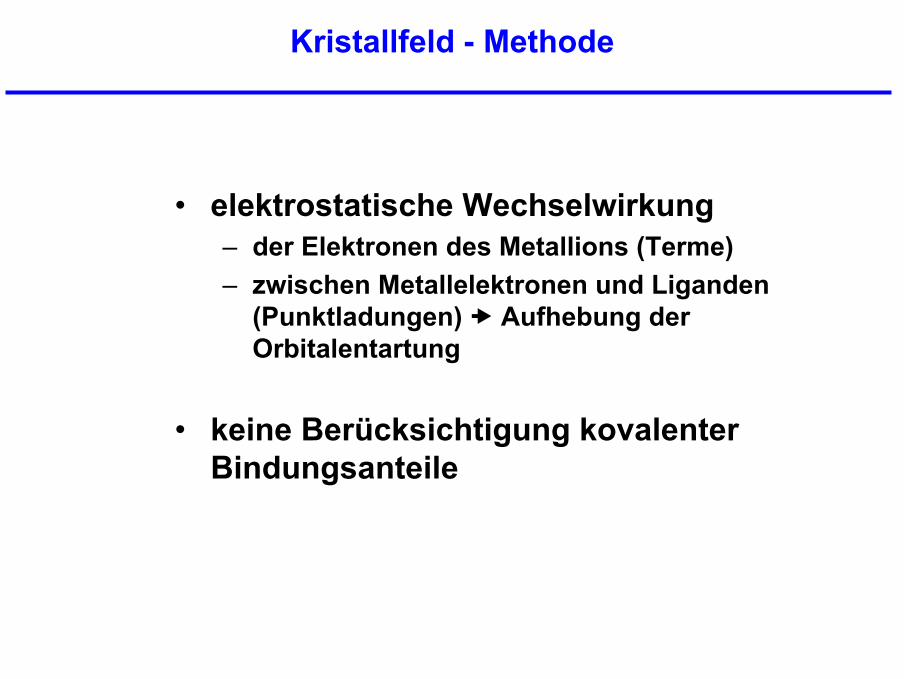
Kristallfeld - Methode
• elektrostatische Wechselwirkung– der Elektronen des Metallions (Terme)– zwischen Metallelektronen und Liganden
(Punktladungen) Aufhebung der Orbitalentartung
• keine Berücksichtigung kovalenterBindungsanteile

Influence of covalent bonding
∆ ≈ ∆el crystal field theory
+ ∆σ σ bonds, single e- pairs
+ ∆π(M L) charge-transfer
– ∆π(L M) charge-transfer
∆ estimated from experimental UV-vis bands by Tanabe-Sugano diagrams
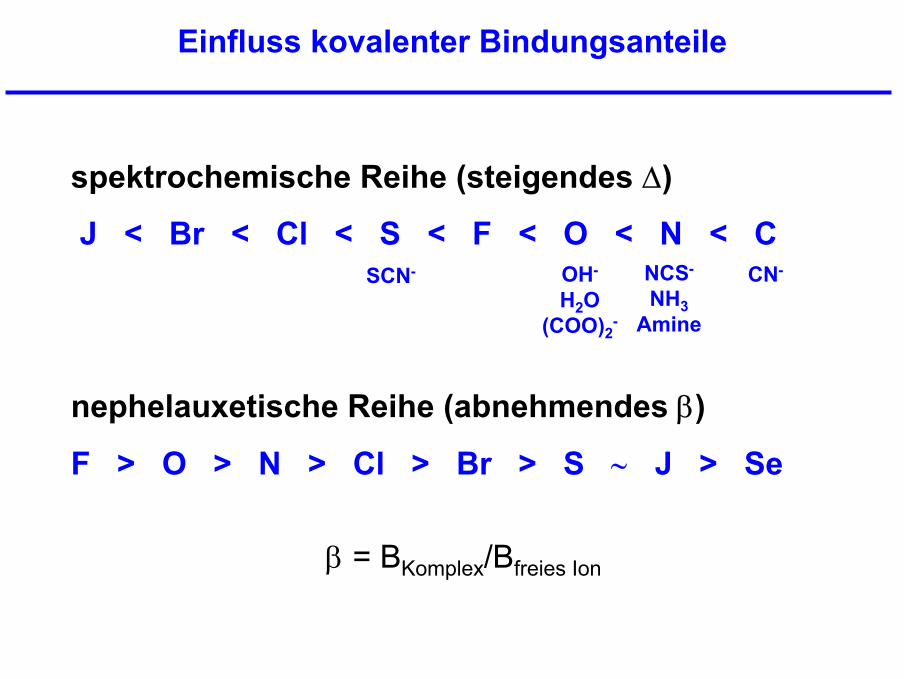
Einfluss kovalenter Bindungsanteile
spektrochemische Reihe (steigendes ∆)
J < Br < Cl < S < F < O < N < C
nephelauxetische Reihe (abnehmendes β)
F > O > N > Cl > Br > S ∼ J > Se
SCN- NCS-
NH3Amine
OH-
H2O(COO)2
-
CN-
β = BKomplex/Bfreies Ion

MO-Methode
Charge-Transfer-Übergänge (CT)
Ligand-to-Metal (LMCT)Mn+in hohen Oxidationszuständen
Metal-to-Ligand (MLCT)Liganden mit freien π*-Orbitalen (z. B. CO)
t2g
eg
t1u
a1g
eg*
a1g*
t1u*
d
s
p
Eg A1g T1u
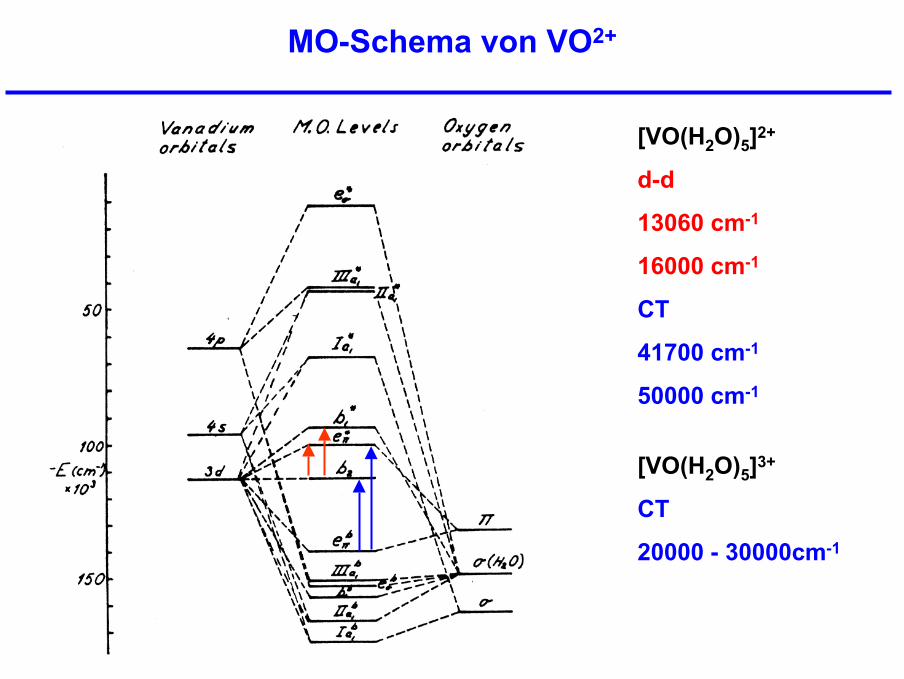
MO-Schema von VO2+
[VO(H2O)5]2+
d-d
13060 cm-1
16000 cm-1
CT
41700 cm-1
50000 cm-1
[VO(H2O)5]3+
CT
20000 - 30000cm-1

Abhängigkeit des tiefsten CT-Übergangs von der Struktur der V5+-Spezies
X. Gao and I. E. Wachs, J. Phys. Chem. B 104 (2000) 103.
2.2 2.4 2.6 2.8 3.0 3.2 3.4 3.6
0
1
2
3
4
5
No.
of V
-O V
bond
s
Eg / eV
V2O5
MgV2O6
NH4VO3
Mg2V2O7
Mg3V2O8
polyVO5VO6
polyVO4
dimerVO4
monoVO4
Mg2V2O7
Mg3(VO4)2
V2O5
Nanometers300 400 500 700600 800

Informationen aus elektrischen (optischen) Dipol-Übergängen
• vollständig oxidierte Metallionen (z. B. V5+)– CT-Übergänge geben Auskunft über Koordination und
Dispersion
• reduzierte Metallionen (z. B. V4+)– CT-Übergänge bei höheren Energien
(z. T. Überlagerung mit V5+)– d-d Übergänge symmetrieverboten → schwach oder nicht
detektierbar
Selektiver Nachweis für reduzierte V-Spezies notwendig

Wechselwirkung von Licht mit Festkörpern
Transmission (ohne Wechselwirkung)AbsorptionEinfachstreuungMehrfachstreuungDiffuse ReflexionSpiegelreflexion
Streuung
elastisch(λein = λaus)
inelastisch(λein ≠ λaus)
DETEKTOR

Messtechniken: Diffuse Reflexion
I-dI
IX J+dJ
dX
Strahlungstransport – Gleichung:
-dI = - KIdx - SIdx + SJdx
dJ = - KJdx - SJdx + SIdx
SK
RRRF =
∞∞−
=∞21 2)()(
Standard
Probe
RR
R =∞
Kubelka-Munk-Funktion
Randbedingung: unendlich dicke Schicht
x = ∞ (J/I)x=∞ = R∞

Voraussetzungen für die Gültigkeit derKubelka-Munk-Theorie
• diffuse monochromatische Einstrahlung (bei starken Streuern istauch parallele Einstrahlung möglich, da die reguläre Reflexionvernachlässigbar ist)
• unendliche Schichtdicke (bei 0 < d < ∞ trägt Untergrund zurReflexion der Probe bei)
• Probe muss homogen sein
• Probe darf nicht fluoreszieren
• Probe darf nur schwach absorbieren, sonst ist der Anteil derSpiegelreflexion nicht mehr vernachlässigbar

Einfluss der Spiegelreflexion auf F(R)
0
0I
IIgesamtR α+=
00 III
diffusR α−=
αα +−= diffgesamt RR )(1
)( diffdiffgesregulär RRRR −=−= 1α2
11
+−
=nnRregulär
Beispiel: Glas
nGlas = 1,5
Rreg = 0,04
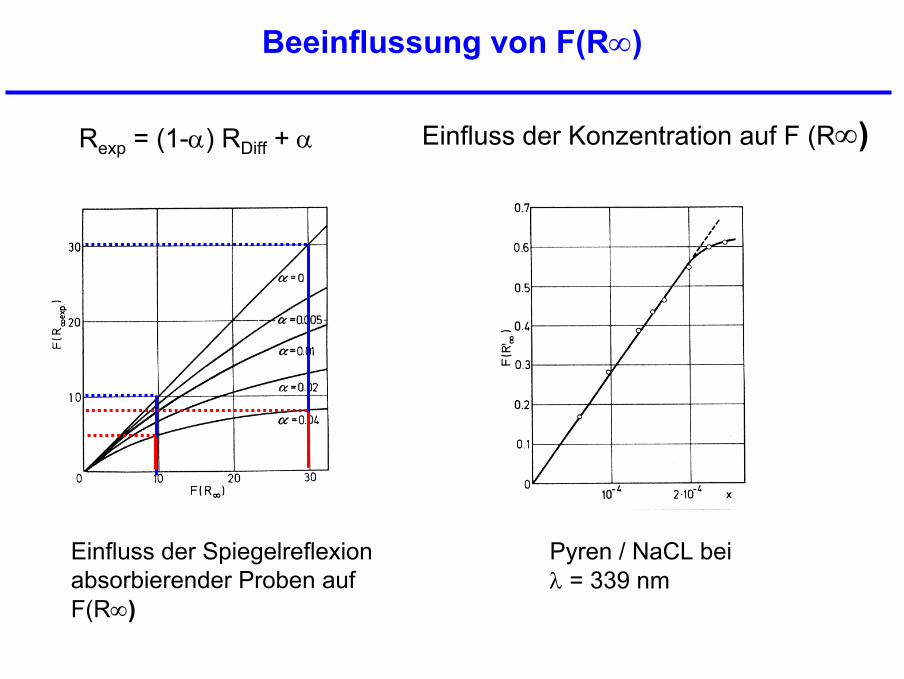
Beeinflussung von F(R∞)
Rexp = (1-α) RDiff + α Einfluss der Konzentration auf F (R∞)
Einfluss der Spiegelreflexionabsorbierender Proben auf F(R∞)
Pyren / NaCL beiλ = 339 nm

Abhängigkeit des Streukoeffizienten S von der Partikelgröße (Glaspulver)
Sc
SK
RRRF ][
2)1()(
2 ⋅≅=
∞∞−
=∞ε
dS 1~ )(νfS =

Apparative Anordnungen für diffuse Reflexionsspektroskopie
http://www.harricksci.com
praying mantis

Apparative Anordnungen für diffuse Reflexionsspektroskopie
Integrationskugel (Ulbricht-Kugel)

Apparative Anordnungen für diffuse Reflexionsspektroskopie
Fibre optic probes
catalyst
connected to light source connected to detector

Struktur von VOx auf mesoporösen Träger-OxidenUV/VIS-DRS
300 400 500 600 700 800λ / nm
2.8 % V / SBA-15
300 400 500 600 700 800λ / nm
F(R
)
2.8 % V / MCM-48
20°C
F(R
)500°C
OSi Si
Si
VO
H O2
OOH2
O
V
O
O
O OSi Si
Si
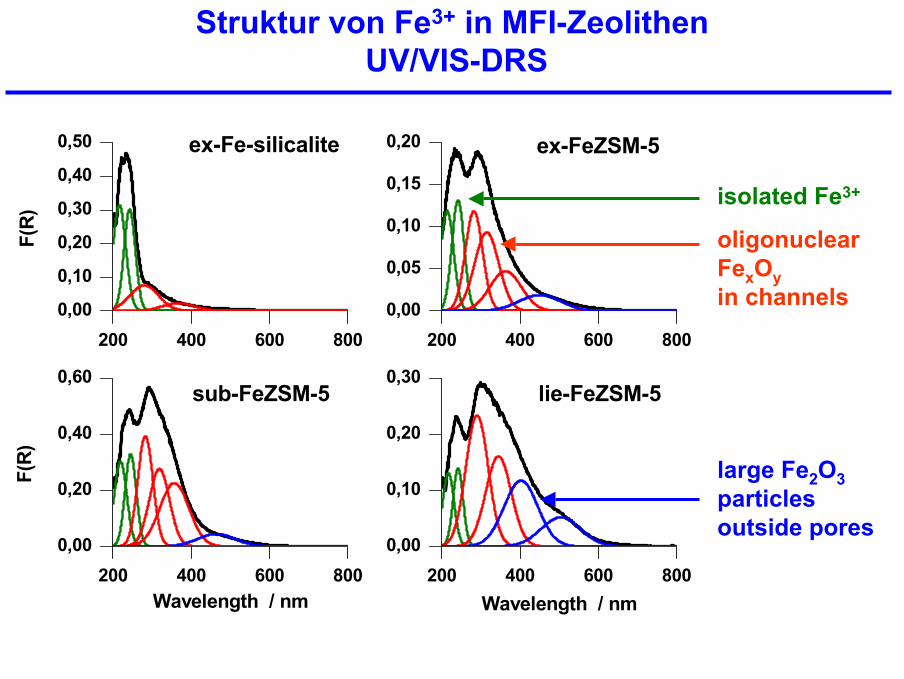
Struktur von Fe3+ in MFI-ZeolithenUV/VIS-DRS
200 400 600 8000,00
0,05
0,10
0,15
0,20
200 400 600 8000,00
0,10
0,20
0,30
0,40
0,50
200 400 600 8000,00
0,10
0,20
0,30
200 400 600 8000,00
0,20
0,40
0,60
ex-FeZSM-5ex-Fe-silicalite
F(R)
lie-FeZSM-5
Wavelength / nm
sub-FeZSM-5
F(R)
Wavelength / nm
isolated Fe3+
oligonuclearFexOyin channels
large Fe2O3particles outside pores

Redox behaviour of a supported VOx catalyst
20°C200°C300°C400°C500°C
300 500 700 9000
1
2
3
4
5
abso
rban
ce
λ / nm
Reduction in H2 flow(similar in propane/O2 flow)
300 500 700 9000
1
2
3
4
5
abso
rban
ce
λ / nm
Re-oxidation in O2 flow

Quantification by simultaneous UV-vis/TPR
UV-vis during TPR UV-vis during ODP
1,6 1,8 2,0 2,2 2,4 2,60,0
0,1
0,2
0,3
0,4
O/V
∆(ab
sorb
ance
at 8
00 n
m)
0 100 200 300 400 500
0,04
0,06
0,08
0,10
∆(ab
sorb
ance
at 8
00 n
m)
reaction temperature / °C
O/V = 2.43
Mean V valence > 4.86
0.093
0.093
Only few V sites (exposed on surface) reduced
EstimationEstimation of of thethe meanmean steadysteady statestate V V valence during valence during propane oxidative dehydrogenationpropane oxidative dehydrogenation

References
B. M. Weckhuysen, R. A. Schoonheydt, „Electronic Spectroscopies“ in: M. M. Weckhuysen, P. Van Der Voort, G. Catana (Eds.) „Spectroscopy of Transition Metal Ions on Surfaces“, Leuven University Press, 2000, p. 221-266.
A. Brückner, M. Che, K. Dyrek, D. Goldfarb, P. J. Grobet, B. M. Weckhuysen, R. A. Schoonheydt, „Magnetic Resonance Techniques“, ibid. p. 23-153.
R. A. Schoonheydt, „Diffuse Reflectance Spectroscopy“ in: F. Delanny (Ed.) „Characterization of Heterogeneous Catalysts“, Marcel Dekker Inc., 1984, p. 125-157.
J. C. Vedrine, „Electron Spin Resonance“, ibid., p. 161-220.
G. Kortüm, „Reflexionsspektroskopie“, Springer, 1969.
B. M. Weckhuysen, „UV-vis Spectroscopy“ in: B. M. Weckhuysen (Ed.) In situ Spectroscopy of Catalysts“, American Scientific Publishers, 2004, p. 255-270.
A. Brückner, „Electron Paramagnetic Resonance“, ibid. p. 219-251.
J. A. Weil, J. R. Bolton, J. E. Wertz, „Electron Paramagnetic Resonance – Elementary Theory and Practical Applications“, J Wiley & Sons, Inc., New York 1994.