Elektrophile, nucleophile und radikalische Substitutionen an Aromaten
Synthesis and Characterization of Poly(vinylphosphonic acid) for Proton Exchange
Membranes in Fuel Cells
Dissertation zur Erlangung des Grades
Doktor der Naturwissenschaften
am Fachbereich Chemie, Pharmazie und Geowissenschaften
der Johannes Gutenberg-Universität Mainz
vorgelegt von
Bahar Bingöl geboren in Istanbul (Türkei)
Mainz, 2007
Zusammenfassung
Vinylphosphonsäure (VPA) wurde bei 80 °C durch freie radikalische Polymerisation
polymerisiert. Es wurden Polymere (PVPA) mit verschiedenen Kettenlängen erhalten. Das
höchste Molekulargewicht, Mw, das erreicht wurde, war 6.2x10⁴ g/mol, das mittels statischer
Lichtstreuung bestimmt wurde. Hochauflösende NMR-Spektroskopie wurde verwendet, um
Informationen über die Mikrostruktur der Polymerketten zu erhalten. Die Analyse der
verschiedenen Tetraden ergab, daß die hochmolekularen Polymere eine ataktische Struktur
aufweisen. 13C-NMR Untersuchungen zeigten die Gegenwart von Kopf-Kopf und Schwanz-
Schwanz Verknüpfungen. Der Anteil dieser Verknüpfungen wurde mit 23.5 % durch eine
detallierte Analyse der 1H-NMR Spektren bestimmt.
Die Analyse der Polymeren ergab ferner, daß es sich um eine Zyklopolymerisation des
Vinylphosphonsäureanhydrids als Zwischenprodukt handelt. Mittels Titrimetrie wurde
bestimmt, daß sich hochmolekulare PVPA wie eine monoprotische Säure verhält.
Protonenleiter mit Phosphonsäuregruppen sind vielversprechend, weil sie eine hohe
Konzentration an Ladungsträgern besitzen, thermische Stabilität aufweisen und
oxidationsstabil sind. Mischungen und Copolymeren von PVPA sind in der Literatur bekannt,
jedoch wurde PVPA bisher nicht ausreichend charakterisiert. Deswegen haben wir das
protonenleitende Verhalten einer gut charakterisierten PVPA-Probe erforscht. Grundsätzlich
ist PVPA leitend, wobei allerdings der Wassergehalt der Probe eine wesentliche Rolle spielt.
Die Phosphonsäuregruppe neigt bei höheren Temperatur zur Kondensation. Es enstehen
Phosphonsäureanhydride. Die Bildung dieser Gruppen wurde mittels Festkörper-NMR
detektiert. Die Bildung der Anhydride beeinflußt die Protonenleitfähigkeit der PVPA
erheblich, da nicht nur Ladungsträger verloren gehen, sondern wahrscheinlich auch deren
Mobilität reduziert wird.
ii
Abstract
Vinylphosphonic acid (VPA) was polymerized at 80 ºC by free radical polymerization
to give polymers (PVPA) of different molecular weight depending on the initiator
concentration. The highest molecular weight, Mw, achieved was 6.2 x 10⁴ g/mol as determined
by static light scattering. High resolution nuclear magnetic resonance (NMR) spectroscopy
was used to gain microstructure information about the polymer chain. Information based on
tetrad probabilities was utilized to deduce an almost atactic configuration. In addition, 13C-
NMR gave evidence for the presence of head-head and tail-tail links. Refined analysis of the
1H NMR spectra allowed for the quantitative determination of the fraction of these links (23.5
percent of all links). Experimental evidence suggested that the polymerization proceeded via
cyclopolymerization of the vinylphosphonic acid anhydride as an intermediate. Titration
curves indicated that high molecular weight poly(vinylphosphonic acid) PVPA behaved as a
monoprotic acid.
Proton conductors with phosphonic acid moieties as protogenic groups are promising
due to their high charge carrier concentration, thermal stability, and oxidation resistivity.
Blends and copolymers of PVPA have already been reported, but PVPA has not been
characterized sufficiently with respect to its polymer properties. Therefore, we also studied
the proton conductivity behaviour of a well-characterized PVPA. PVPA is a conductor;
however, the conductivity depends strongly on the water content of the material. The
phosphonic acid functionality in the resulting polymer, PVPA, undergoes condensation
leading to the formation of phosphonic anhydride groups at elevated temperature. Anhydride
formation was found to be temperature dependent by solid state NMR. Anhydride formation
affects the proton conductivity to a large extent because not only the number of charge
carriers but also the mobility of the charge carriers seems to change.
iii
Table of contents
1. INTRODUCTION 1
1.1 Introduction 1
1.2 How do fuel cells function? 1
1.3 Development of Polymer Electrolyte Fuel Cell Membranes 4
2. EXPERIMENTAL 17
2.1 Materials 17
2.2 Characterization 17
2.2.1 Nuclear Magnetic Resonance 17
2.2.1.1 Nuclear Magnetic Resonance in Solution 17
2.2.1.2 Magic Angle Solid State Nuclear Magnetic Resonance (MAS-NMR) 18
2.2.2 Molecular Weight Determination 19
2.2.2.1 Molecular Weight Determination by Light Scattering 19
2.2.2.2 Molecular Weight Determination by Size Exclusion Chromatography 20
2.2.3 Infrared Spectroscopy 20
2.2.4 Potentiometric Titration 20
2.2.5 Dielectric Spectroscopy 20
2.2.6 Elemental Analysis 22
2.3 Free Radical Polymerization of Vinylphosphonic Acid 23
2.4 Synthesis of Poly(vinylphosphonic acid) from Dimethyl
Vinylphosphonates
24
2.4.1 Free Radical Polymerization of Dimethyl Vinylphosphonate 24
2.4.2 Hydrolysis of Poly(dimethyl vinylphosphonate) 25
2.5 Free Radical Polymerization of Diethyl and Diisopropyl
Vinylphosphonate
25
2.6 Reversible Addition Fragmentation Chain Transfer Polymerization of
Vinylphosphonic Acid
26
3. SYNTHESIS OF POLY(VINYLPHOSPHONIC ACID) 27
3.1 Introduction 27
3.2 Polymerization of Vinylphosphonic Acid 30

iv
3.3 Polymerization of Dimethyl Vinylphosphonate and Its Hydrolysis to
Poly(vinylphosphonic acid)
35
3.4 Free Radical Polymerization of Vinylphosphonates 36
3.5 Polymerization Mechanism of Vinylphosphonic Acid 38
3.5.1 Suggestion of a Polymerization Mechanism based on the Differences
in Microstructures of PVPA obtained by different pathways
38
3.5.2 Reversible Addition-Fragmentation Chain Transfer Polymerization 41
3.5.2.1 Reversible Addition-Fragmentation Chain Transfer Polymerization of
Vinylphosphonic Acid and Its Dimethyl Ester
46
3.5.3 Summary of Free Radical Polymerization and Its Mechanism of VPA 48
3.6 Polymerization of Acrylic Acid 49
3.7 Polymerization of VSA 50
3.8 Comparison of Possible Polymerization Techniques for Vinyl-
phosphonic acid, Vinylsulfonic acid and Acrylic acid
53
4. ACIDITY 61
4.1 Introduction 61
4.2 Titration of Poly(vinylphosphonic acid) 65
4.3 Titration of Poly (acrylic acid) 69
4.4 Titration of Poly (vinylsulfonic acid) 71
4.5 Comparison of titration behavior of poly (vinylphosphonic acid),
poly(acrylic acid), and poly(vinylsulfonic acid)
74
5. MICROSTRUCTURE 77
5.1 Introduction 77
5.2 Microstructure of Poly(vinylphosphonic acid) 83
5.2.1 NMR Spectra of Poly(vinylphosphonic acid) and Solvents 83
5.2.2 Microstructure of Poly(vinylphosphonic acid) from the Direct Route 85
5.2.3 Microstructure of PVPA (4) Synthesized by the Hydrolysis of
Poly(dimethyl vinylphosphonate)
99
5.2.4 Assignment of the 1H-NMR Spectrum of PVPA (1) and Existence of
the Defect Species
106
5.2.5 NMR Spectra of Different Molecular Weight Poly(vinylphosphonic
acid)
110
v
5.3 Summary 112
6. CONDUCTIVITY 115
6.1 Introduction 115
6.2 Conductivity of Polymer Electrolyte Systems 116
6.3 Conductivity Measurements 117
6.3.1 Alternating Current Measurements 117
6.3.2 Direct Current Measurements 124
6.4 Transport Processess 126
6.5 A Mechanism for Iontransport by Funke 128
6.6 Solid State Nuclear Magnetic Resonance 131
6.7 Conductivity of Poly(vinylphosphonic acid) 132
6.7.1 Temperature Dependence of Conductivity of Poly(vinylphosphonic
acid)
133
6.7.2 The Correlation between Conductivity and Formation of Anhydride
Species
140
6.7.3 Conductivity of PVPA (1) at Constant Temperature 143
6.7.4 Effect of Molecular Weight on Conductivity 145
6.8 Solid State NMR Studies of Poly(vinylphosphonic acid) 156
6.8.1 Formation and Quantification of Phopshonic Acid Anhydride Species 156
6.8.2 Identification of Mobile Protons 160
6.8.3 Rigidity of the Polyvinyl Backbone (Detection of Immobile Protons) 163
6.8.4 Effect of Drying on the Formation of Phosphonic Acid Anhydride
Species
164
6.8.5 Double Quantum Spectrum of Poly(vinylphosphonic acid) 167
6.9 Summary 169
7. CONCLUSION AND OUTLOOK 171
References 175
CHAPTER 1
INTRODUCTION
1.1 Introduction
Fuel cells have attracted the interest of many researchers coming from different fields
ranging from engineering to chemistry for several reasons. A major reason is that fuel
cells are promising in the sense that they may be an alternative for producing clean
energy from renewable sources for both stationary and mobile applications.1
Fuel cells are beneficial because they can convert fuel into the electricity efficiently.
They are about twice as efficient as internal combustion engines. Fuel cells are simple;
they do not have any moving parts (except fuel pumps etc) and lead in theory to highly
reliable, and long-lasting systems. They are silent which may be important for portable
power applications and local power generation in combined heat and power schemes.
The most significant barrier, which prevented the commercialization of fuel cells, is
their high cost. In order to be accepted in the future, especially for automative
applications, they have to compete with internal combustion engines in price, which will
require major breakthroughs in new technologies.
1.2 How do fuel cells function?
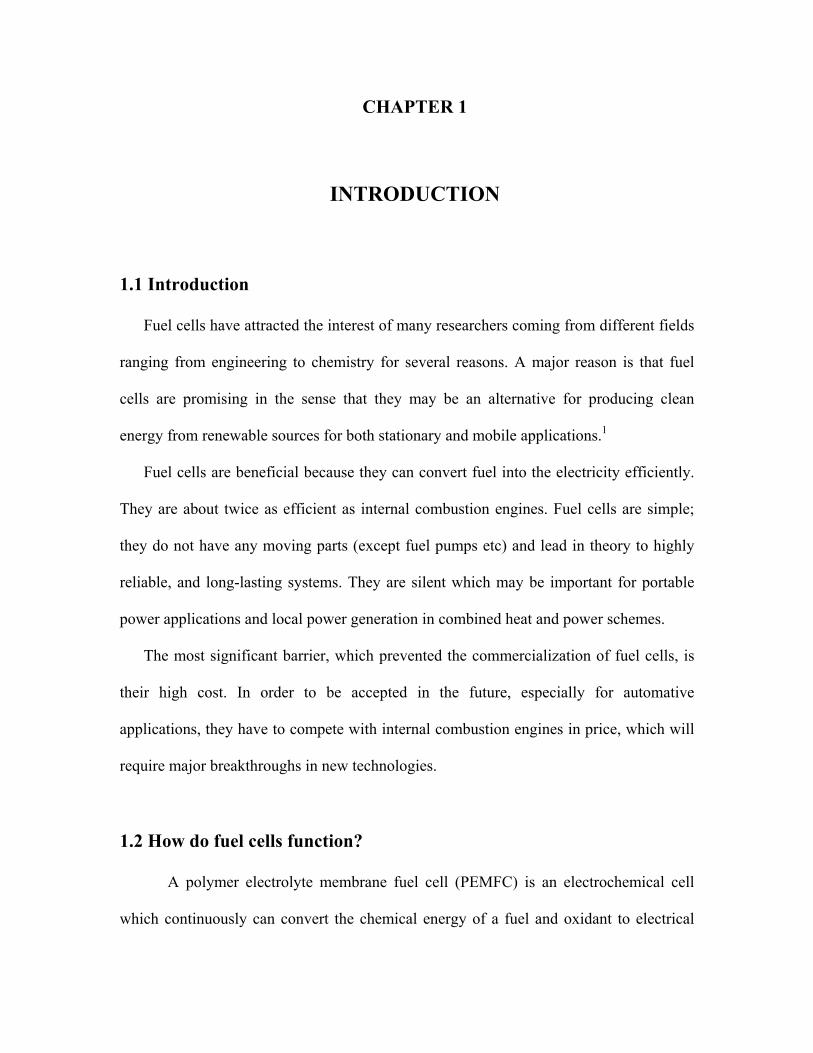
A polymer electrolyte membrane fuel cell (PEMFC) is an electrochemical cell
which continuously can convert the chemical energy of a fuel and oxidant to electrical
Introduction
2
energy.2 The cross-section of a single polymer electrolyte fuel cell is shown
schematically in Figure 1.1.
Figure 1.1: Cross section of a PEMFC.
The electrochemical heart of the PEMFC is the membrane electrode assembly
(MEA). The MEA consists of a proton exchange membrane, electrodes, catalyst layers,
and gas diffusion layers. Hydrogen gas is the preferred fuel in PEMFCs on account of its
high reactivity for the electrochemical anode reaction and because its oxidation produces
water, which is environmentally friendly. Hydrogen ionizes into protons and electrons at
the anode. The protons are conducted through the proton exchange membrane to the
cathode. On the other hand, electrons travel along an external electrical circuit to the
cathode, where they react with oxygen to form water. Although a good electrical contact
must be made between two electrodes, the gases have to remain separated. The proton
exchange membrane provides ionic communication between anode and cathode.
Moreover, it serves as a separator between the two reactant gases. The site at which the
H 2
+
Anode Cathode
Proton Exchange Membrane
Catalyst
H2O
O2H+
Cross section of PEMFC
H 2
+
Anode Cathode
Proton Exchange Membrane
Catalyst
H2O
O2H+
Cross section of PEMFC
H 2
+
Anode Cathode
Proton Exchange Membrane
Catalyst
H2O
O2H+
Cross section of PEMFC
H 2
+
Anode Cathode
Proton Exchange Membrane
Catalyst
H2O
O2H+
Cross section of PEMFC
+++
Anode Cathode
Proton Exchange Membrane
Catalyst
H2O
O2H+
Cross section of PEMFC
Anode Cathode
Proton Exchange Membrane
Catalyst
H2O
O2H+H+
Cross section of PEMFC
Introduction
3
fuel interacts with the electrolyte and the electrode is sometimes called the three phase
contact. Maximum possible contact between electrolyte, electrode, and gases is
necessary. This influences the rate of the electrochemical reaction. The PEM electrodes
are of gas diffusion type and generally designed such that they provide maximum surface
area per unit material volume available for the reactions. In order that the electrochemical
reactions can take place at useful efficiency, they must be catalyzed.2 The catalyst layer is
located adjacent to the electrolyte within both anode and cathode of a PEMFC. The best
catalyst for both anode and cathode is platinum.
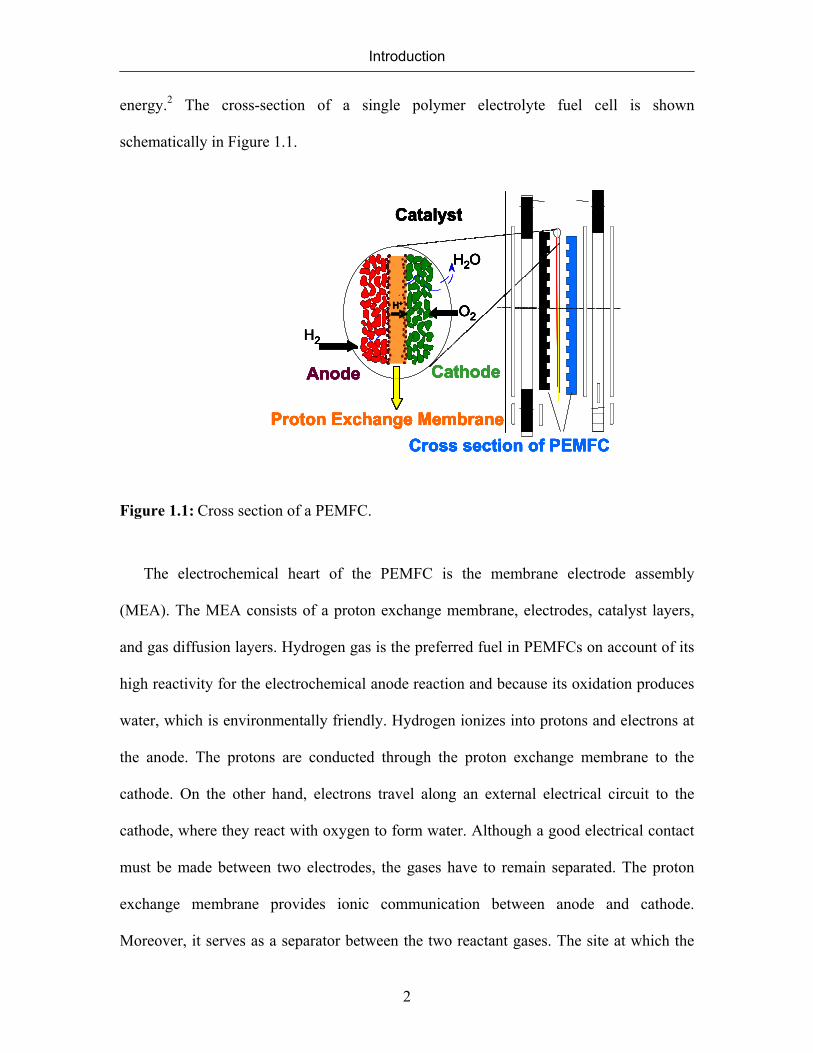
The resulting voltage from one single fuel cell depends largely on the type of the fuel,
and is quite small. (For example, the voltage resulting is 0.7 V if hydrogen and oxygen
are used as fuel and oxidant Scheme 1.1
H2 + 1/2 O2 H2O
Scheme 1.1: Overall fuel cell reaction with hydrogen as fuel and oxygen as reactant).
The voltage gained from a single fuel cell can be increased by connecting the fuel cells in
series. Such a collection of fuel cells in series is called a stack. There are different ways
of producing a stack. The simplest way is by connecting the edge of each anode to the
cathode of the next cell (Figure 1.2a). A better method of cell interconnection is to use a
bipolar plate. This makes connections all over the surface of one anode and the cathode
of the next cell (Figure 1.2b). Bipolar plates also serve as a means of feeding oxygen to
the cathode and fuel gas to the anode.3

Introduction
4
Figure 1.2: A three-cell stack a) by simple edge connection b) by bipolar plates
connection.
Proton-conducting membranes form the core of the PEMFCs. There are some
requirements that these materials must fulfill in order to be used in fuel cell applications.
The most important ones are high proton conductivity (> 0.001 S/cm at 100 °C),
electrochemical, chemical, thermal stability, low levels of swelling, and low gas
permeability.4
1.3 Development of Polymer Electrolyte Fuel Cell Membranes
The first practical proton exchange membrane fuel cell was developed by General
Electric in the United States in the 1960s to be used in manned space vehicles. The
membrane was a polystyrene sulfonate ion exchange membrane, which however suffered
Cathode
Electrolyte
Anode
O2
H2
L O A D H2 fed over the anodes Negative
connection
Air and O2 fed over thecathodes a b
Positive connection
Introduction
5
from insufficient electrochemical stability under fuel cell operation conditions. It had a
lifetime of only about 500 h.5
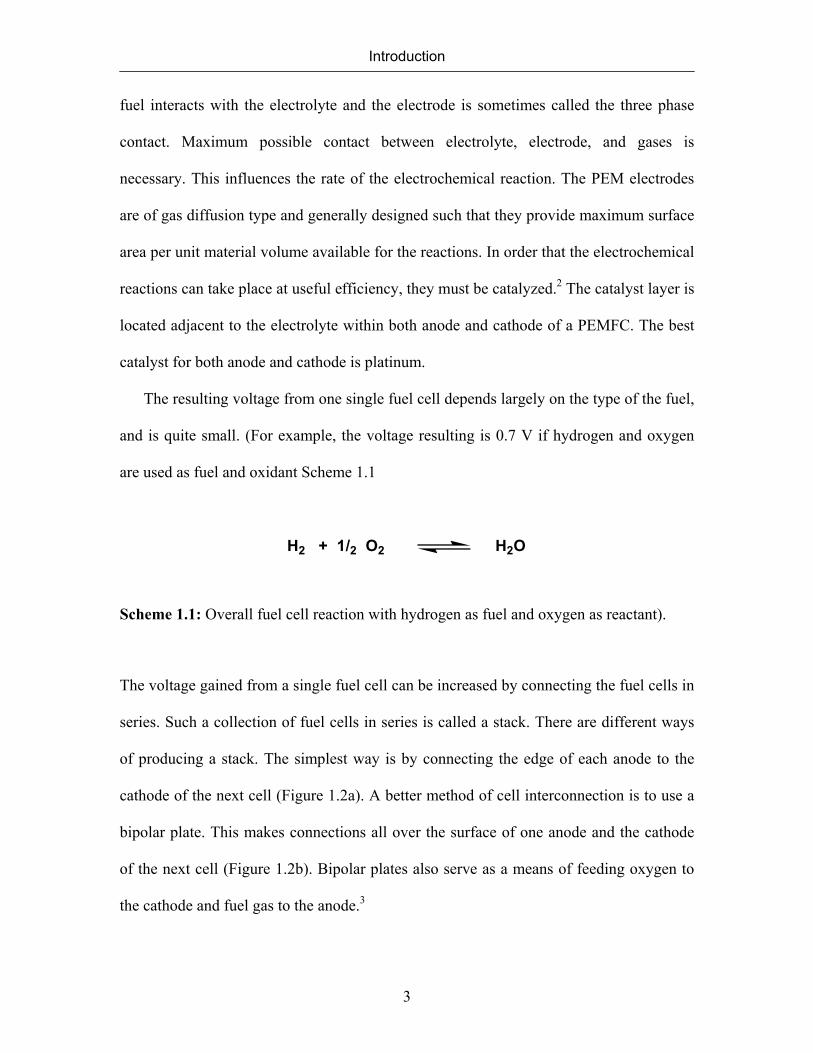
Perfluorinated membranes such as Nafion® and Dow® (Scheme 1.2) were
discovered by the companies DuPont and Dow Chemical, respectively.These materials
were generated by copolymerization of a perfluorinated vinyl ether comonomer with
tetraflouroethylene. Both Nafion® and Dow® are perflourosulfonated ionomer
membranes that consists of a tetraflouroethylene backbone with hydrophilic sulfonic acid
side chains. The relative amount of acidic groups in these ionomers are typically
expressed in equivalent weights (EW), which is the average polymer mass (in g) per mole
of –SO3H groups. The membranes from Du Pont and Dow Chemical differ not only in
their EW, but also in the side chain structure. Dow® membranes are a short side chain
perflourinated ionomer whereas Nafion® membranes are long side chain perflourinated
ionomer. The x,y, and z values of the Nafion membrane can be varied to produce
materials at different equivalent weights and pendant chain lengths.
F2C CF2 CF
OCF2CF
CF2
CF3
O(CF2)2SO3H
x y
z
x = 6-10y =z = 1
F2C CF2 CF CF2
O(CF2)2SO3H
x y
x = 3-10y = 1
a b
Scheme 1.2: Chemical structure of a) Nafion® b) Dow.
Introduction
6
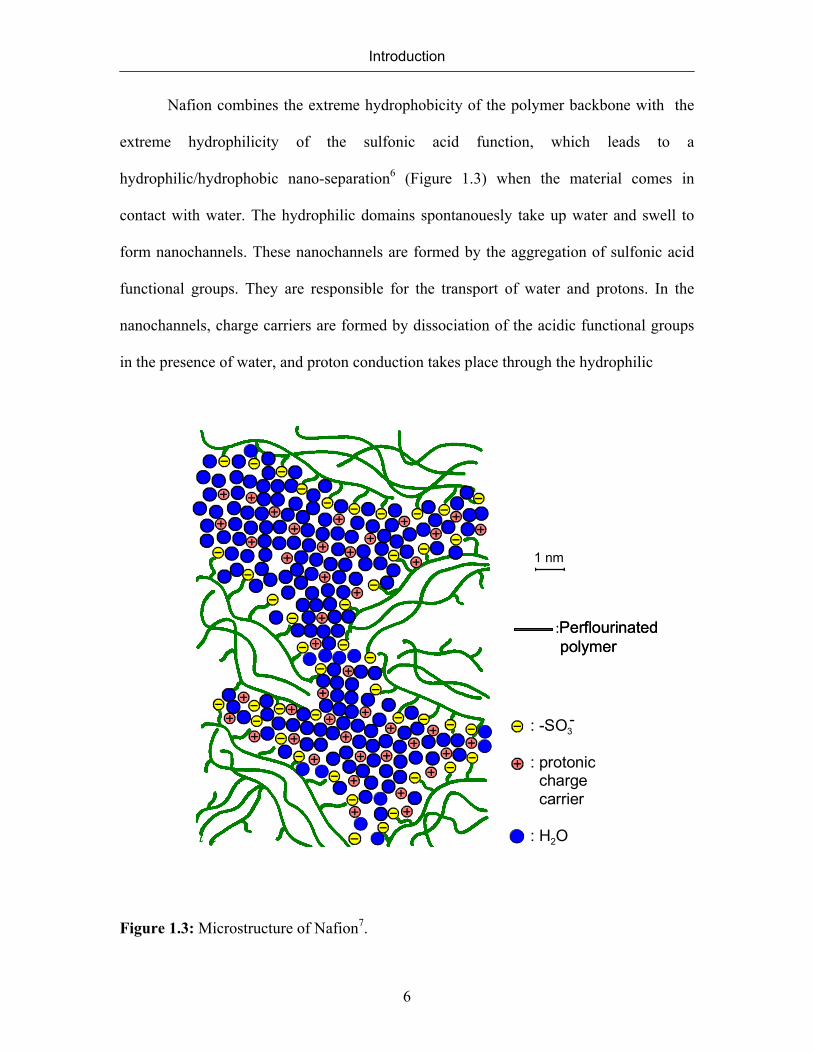
Nafion combines the extreme hydrophobicity of the polymer backbone with the
extreme hydrophilicity of the sulfonic acid function, which leads to a
hydrophilic/hydrophobic nano-separation6 (Figure 1.3) when the material comes in
contact with water. The hydrophilic domains spontanouesly take up water and swell to
form nanochannels. These nanochannels are formed by the aggregation of sulfonic acid
functional groups. They are responsible for the transport of water and protons. In the
nanochannels, charge carriers are formed by dissociation of the acidic functional groups
in the presence of water, and proton conduction takes place through the hydrophilic
:Perflourinatedpolymer
:Perflourinatedpolymer
1 nm
: -SO3
: protonic charge carrier
: H2O
-
Figure 1.3: Microstructure of Nafion7.
Introduction
7
channels. On the other hand, hydrophobic domains provide the polymer with
morphological stability and prevents its dissolution in water.7
The major disadvantage of the Nafion membrane is its extremely high cost, which
makes its applictaions in cost critical situations such as fuel cells for electrical vehicles
unlikely. Additionally, the operation temperature cannot be increased above the boiling
point of water ( 100 °C at p=105 ), since the high proton conductivity of hydrated
polymers relies on the presence of water in the hydrophilic domains.8
Limited operation temperature leads to a the low CO tolerance of the electrocatalyst.9 As
already mentioned, PEMFC use hydrogen as the fuel and air as the oxidant. Operating the
fuel cell with pure hydrogen gives the best performance but pure hydrogen can be
expensive and difficult to store. Alternatives to pure hydrogen include natural gas,
propane, or alcohols. When hydrogen is produced by reforming of hydrocarbons such as
natural gas, propane, or alcohols, some contaminants such as carbon monoxide species
can persists in the fuel feed since carbon monoxide is formed during the production of
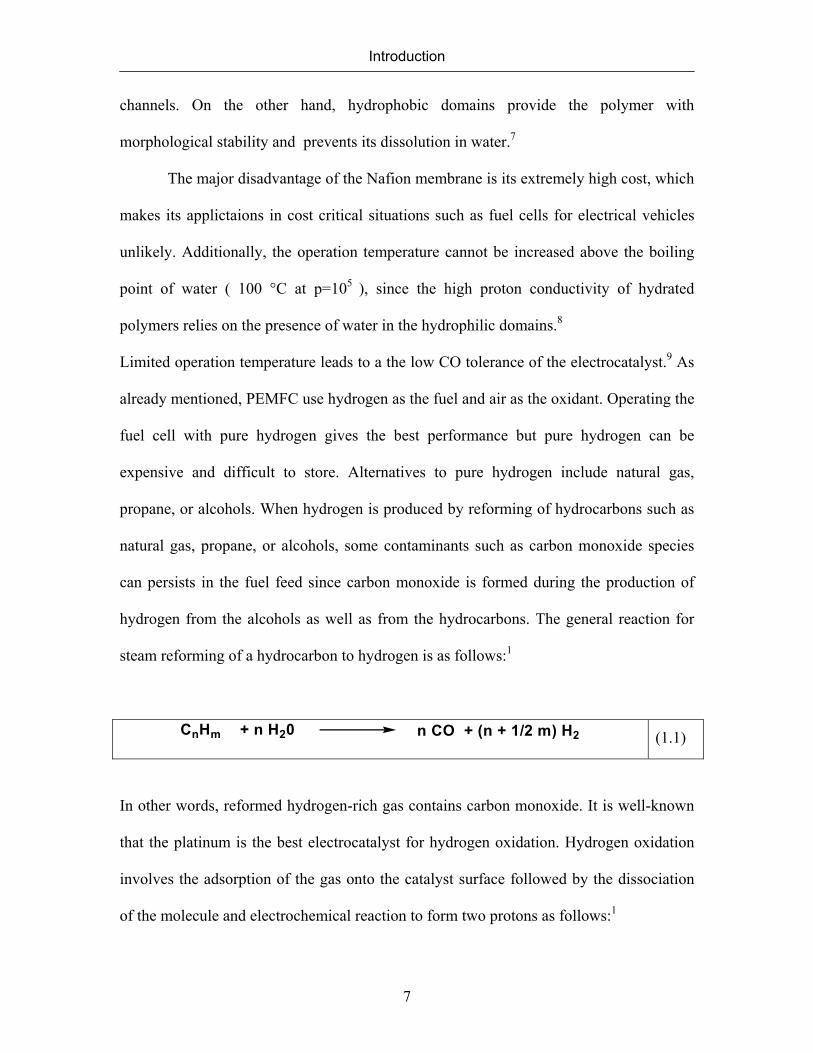
hydrogen from the alcohols as well as from the hydrocarbons. The general reaction for
steam reforming of a hydrocarbon to hydrogen is as follows:1
CnHm + n H20 n CO + (n + 1/2 m) H2 (1.1)
In other words, reformed hydrogen-rich gas contains carbon monoxide. It is well-known
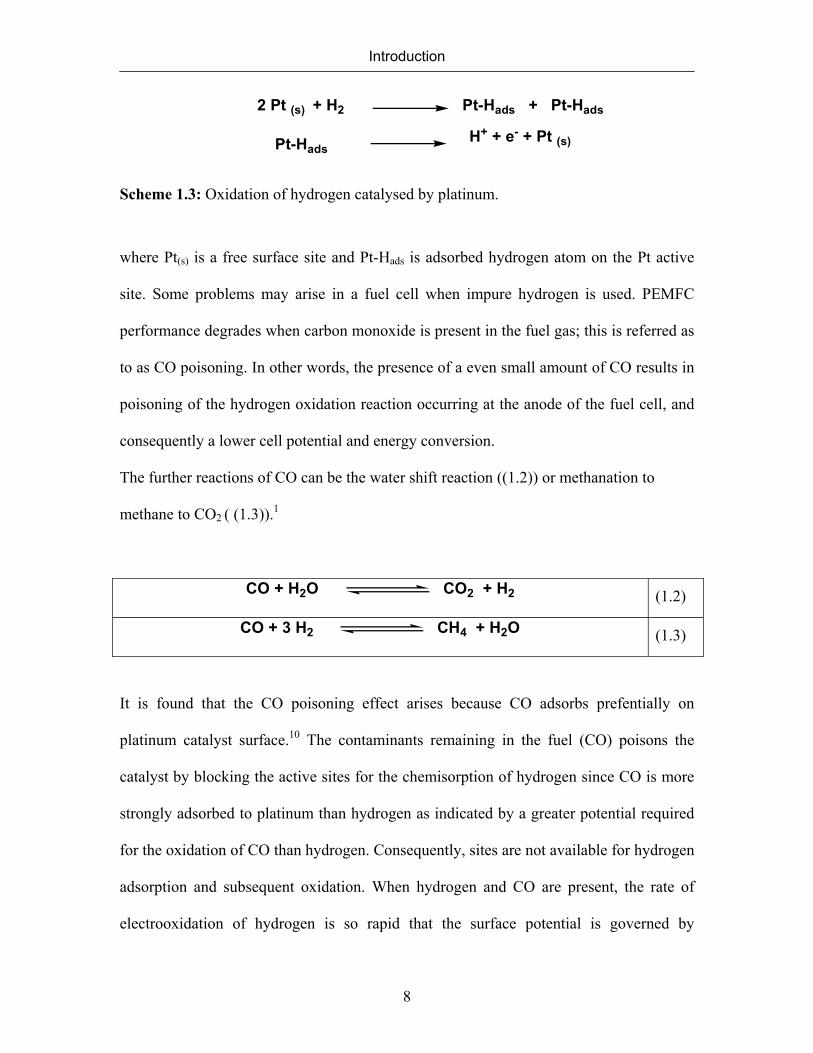
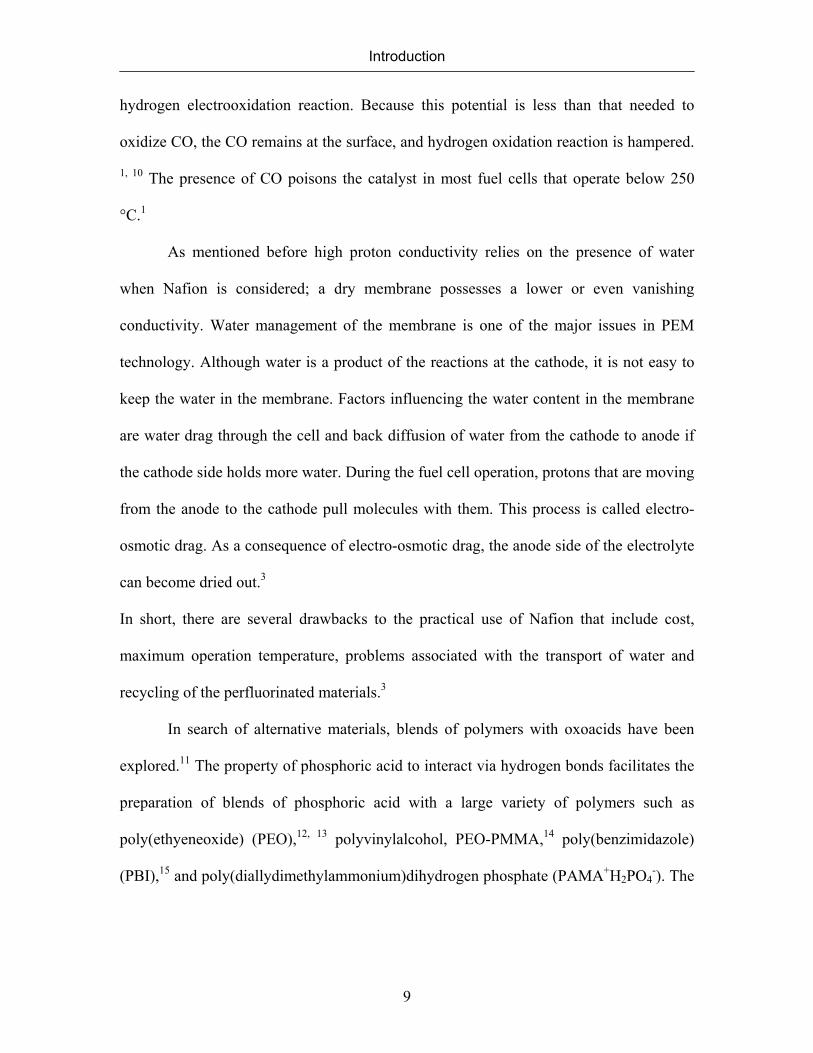
that the platinum is the best electrocatalyst for hydrogen oxidation. Hydrogen oxidation
involves the adsorption of the gas onto the catalyst surface followed by the dissociation
of the molecule and electrochemical reaction to form two protons as follows:1
Introduction
8
2 Pt (s) + H2 Pt-Hads + Pt-Hads
Pt-HadsH+ + e- + Pt (s)
Scheme 1.3: Oxidation of hydrogen catalysed by platinum.
where Pt(s) is a free surface site and Pt-Hads is adsorbed hydrogen atom on the Pt active
site. Some problems may arise in a fuel cell when impure hydrogen is used. PEMFC
performance degrades when carbon monoxide is present in the fuel gas; this is referred as
to as CO poisoning. In other words, the presence of a even small amount of CO results in
poisoning of the hydrogen oxidation reaction occurring at the anode of the fuel cell, and
consequently a lower cell potential and energy conversion.
The further reactions of CO can be the water shift reaction ((1.2)) or methanation to
methane to CO2 ( (1.3)).1
CO + H2O CO2 + H2 (1.2)
CO + 3 H2 CH4 + H2O (1.3)
It is found that the CO poisoning effect arises because CO adsorbs prefentially on
platinum catalyst surface.10 The contaminants remaining in the fuel (CO) poisons the
catalyst by blocking the active sites for the chemisorption of hydrogen since CO is more
strongly adsorbed to platinum than hydrogen as indicated by a greater potential required
for the oxidation of CO than hydrogen. Consequently, sites are not available for hydrogen
adsorption and subsequent oxidation. When hydrogen and CO are present, the rate of
electrooxidation of hydrogen is so rapid that the surface potential is governed by
Introduction
9
hydrogen electrooxidation reaction. Because this potential is less than that needed to
oxidize CO, the CO remains at the surface, and hydrogen oxidation reaction is hampered.
1, 10 The presence of CO poisons the catalyst in most fuel cells that operate below 250
°C.1
As mentioned before high proton conductivity relies on the presence of water
when Nafion is considered; a dry membrane possesses a lower or even vanishing
conductivity. Water management of the membrane is one of the major issues in PEM
technology. Although water is a product of the reactions at the cathode, it is not easy to
keep the water in the membrane. Factors influencing the water content in the membrane
are water drag through the cell and back diffusion of water from the cathode to anode if
the cathode side holds more water. During the fuel cell operation, protons that are moving
from the anode to the cathode pull molecules with them. This process is called electro-
osmotic drag. As a consequence of electro-osmotic drag, the anode side of the electrolyte
can become dried out.3
In short, there are several drawbacks to the practical use of Nafion that include cost,
maximum operation temperature, problems associated with the transport of water and
recycling of the perfluorinated materials.3
In search of alternative materials, blends of polymers with oxoacids have been
explored.11 The property of phosphoric acid to interact via hydrogen bonds facilitates the
preparation of blends of phosphoric acid with a large variety of polymers such as
poly(ethyeneoxide) (PEO),12, 13 polyvinylalcohol, PEO-PMMA,14 poly(benzimidazole)
(PBI),15 and poly(diallydimethylammonium)dihydrogen phosphate (PAMA+H2PO4-). The
Introduction
10
blends of phosphoric acid with poly(benzimidazole) has been successfully tested in fuel
cells which were operated up to 200 °C.16
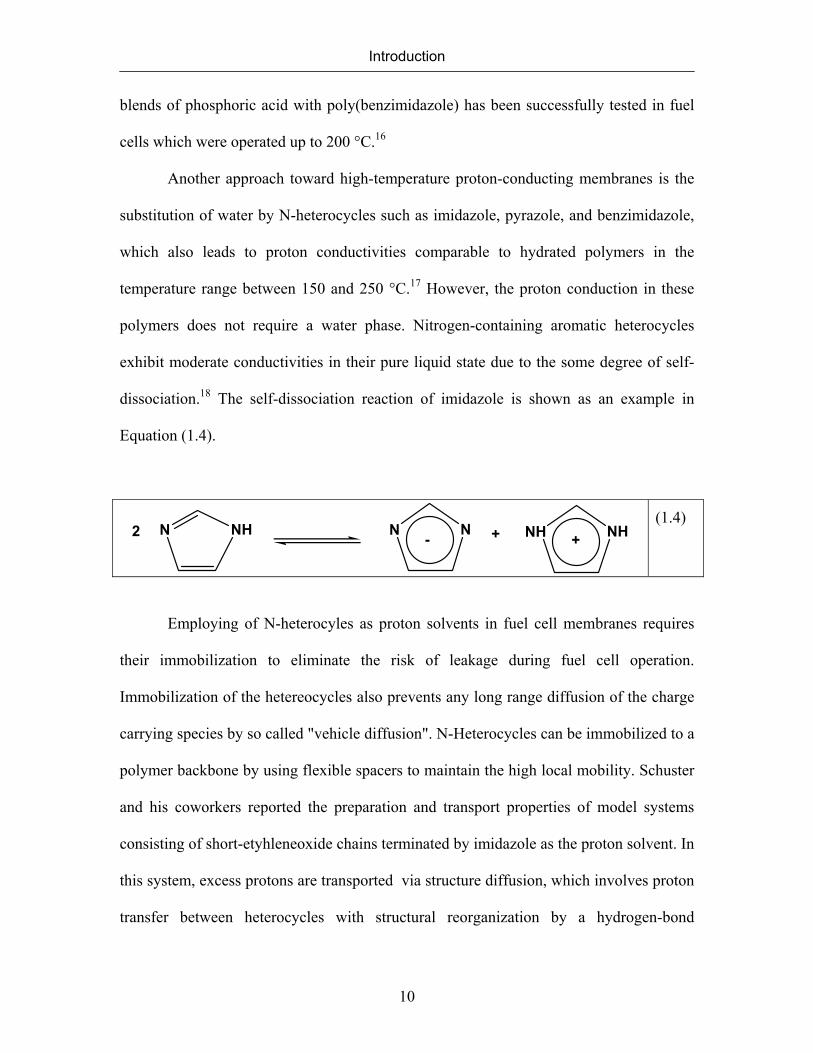
Another approach toward high-temperature proton-conducting membranes is the
substitution of water by N-heterocycles such as imidazole, pyrazole, and benzimidazole,
which also leads to proton conductivities comparable to hydrated polymers in the
temperature range between 150 and 250 °C.17 However, the proton conduction in these
polymers does not require a water phase. Nitrogen-containing aromatic heterocycles
exhibit moderate conductivities in their pure liquid state due to the some degree of self-
dissociation.18 The self-dissociation reaction of imidazole is shown as an example in
Equation (1.4).
NN NHNHNHN - +2 +
(1.4)
Employing of N-heterocyles as proton solvents in fuel cell membranes requires
their immobilization to eliminate the risk of leakage during fuel cell operation.
Immobilization of the hetereocycles also prevents any long range diffusion of the charge
carrying species by so called "vehicle diffusion". N-Heterocycles can be immobilized to a
polymer backbone by using flexible spacers to maintain the high local mobility. Schuster
and his coworkers reported the preparation and transport properties of model systems
consisting of short-etyhleneoxide chains terminated by imidazole as the proton solvent. In
this system, excess protons are transported via structure diffusion, which involves proton
transfer between heterocycles with structural reorganization by a hydrogen-bond

Introduction
11
breaking and forming process.19 The proton conductivity of this system is an intrinsic
property of the polymer, which depends on the glass transition temperatures, the free
volume, and volume fraction of imidazole. The proton conductivity of such a system can
further be increased by doping with a small amount of acids, which are extrinsic charge
carriers. Other than this system, water-free proton conducting solid electrolytes based on
organic/inorganic hybrid namely siloxane oligomer functionalized with imidazole-
terminated side chains20 were reported. Oligomers and polymers with comb like
architecture with a siloxane backbone were prepared to have systems with segmental
flexibility (to allow high local mobility) and sufficiently high imidazole concentration (to
provide a high amount of charge carries).21
The choice of the proper protogenic group plays an important role in the proton
conductivity of polymer electrolyte separator materials. The protogenic group in
perfluorosulfonic acid membranes is the sulfonic acid group. Heterocyles have also been
used as protogenic groups as mentioned above. The ideal protogenic group should
exihibit proton donor and acceptor properties. In other words, it should be amphoteric,
and show a high degree of self-dissociation. It also should have a high dielectric constant
to enhance the charge separation. It should tend to form intermolecular hydrogen bonds
like the N-heterocycles. It should be stable under fuel cell operation conditions. Sulfonic
acid, phosphonic acid, and imidazole functionalized model compounds with an identical
alkyl chain were compared in terms of their proton conductivity, proton diffusion
coefficient, thermo-oxidative stability, electrochemical stability, and their hydration
behavior to identify the most suitable proton solvent for PEM fuel cell membranes for
intermediate temperature at low humidity operation.22 The sulfonic acid functionalized
Introduction
12
model compound showed low conductivity in its dry state, which was expected from a
highly proton donating (acidic), but poor proton accepting (basic) property of the –SO3H
function. The degree of self dissociation in pure H2SO4 is only about 0.1 %, which leads
to low concentrations of -SO3H2+ and –SO3
- in a water-free hydrogen bonded network.
Imidazole based system showed the largest electrochemical stability window, but its
conductivity and thermo-oxidative stability were low. Moreover, it has very high
oxidation overpotential for oxygen reduction on platinum. The reaction rates for
hydrogen oxidation and oxygen reduction on Pt surfaces are significantly higher for
phosphonic acid based systems than for imidazole based systems. Phosphonic acid based
systems offer the possibility to obtain high proton conductivities over a wide temperature
range between room temperature to 200 °C which may facilitate the start-up properties of
fuel cells. Proton conductivity may depend on water up-take at low temperatures. After
the drying of the material at higher temperatures, the proton conduction mechanism may
be dominated by structure diffusion within a hydrogen bonded network formed by
phosphonic acid functionality alone. Phosphonic acid based systems proved to have a
high number of charge carrier as expected from its pronounced amphoteric character.
Dissociation constants of proton solvents may be used to compare the number of charge
carriers.The pKa value of pure phosphonic acid is much higher than that of pure
imidazole (Table 1.1). In short, phosphonic acid based compound showed the most
advantageous behavior under low humidity conditions, and at intermediate temperatures.
Introduction
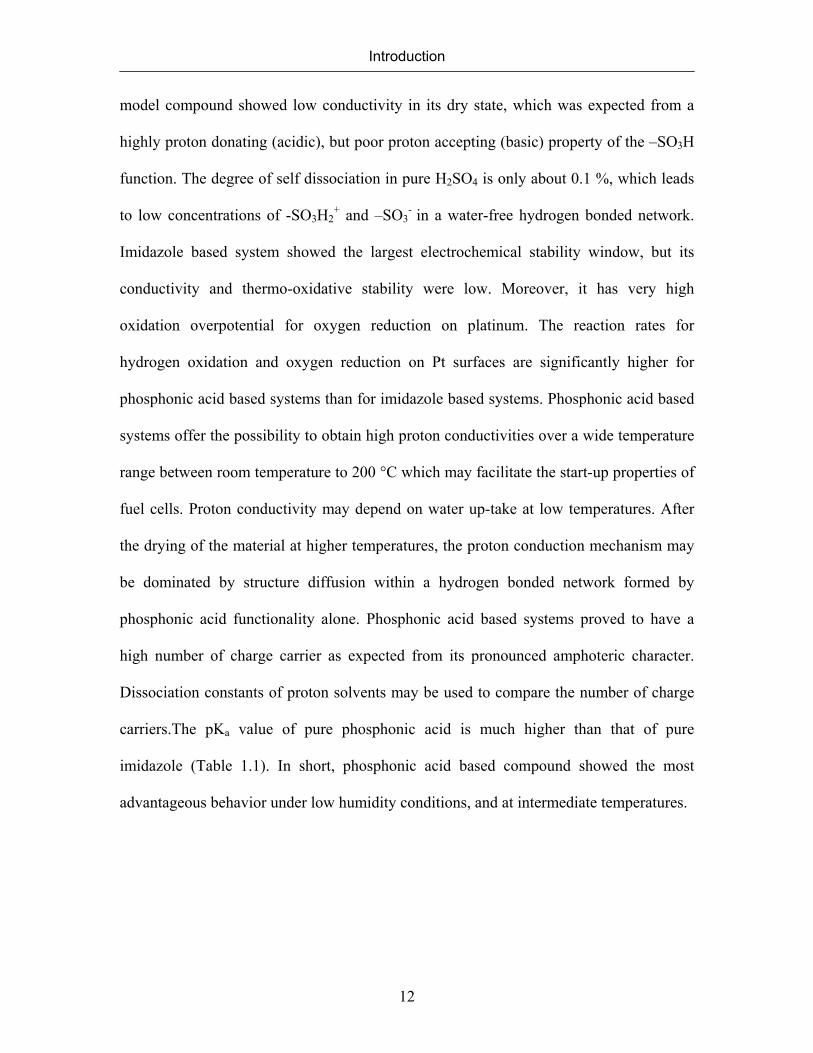
13
Table 1.1: pKa values of proton solvents.
Proton solvent pKa
Imidazole 6.9923
Phosphonic acid 1.3 Step(1), 6.7 Step (2)23
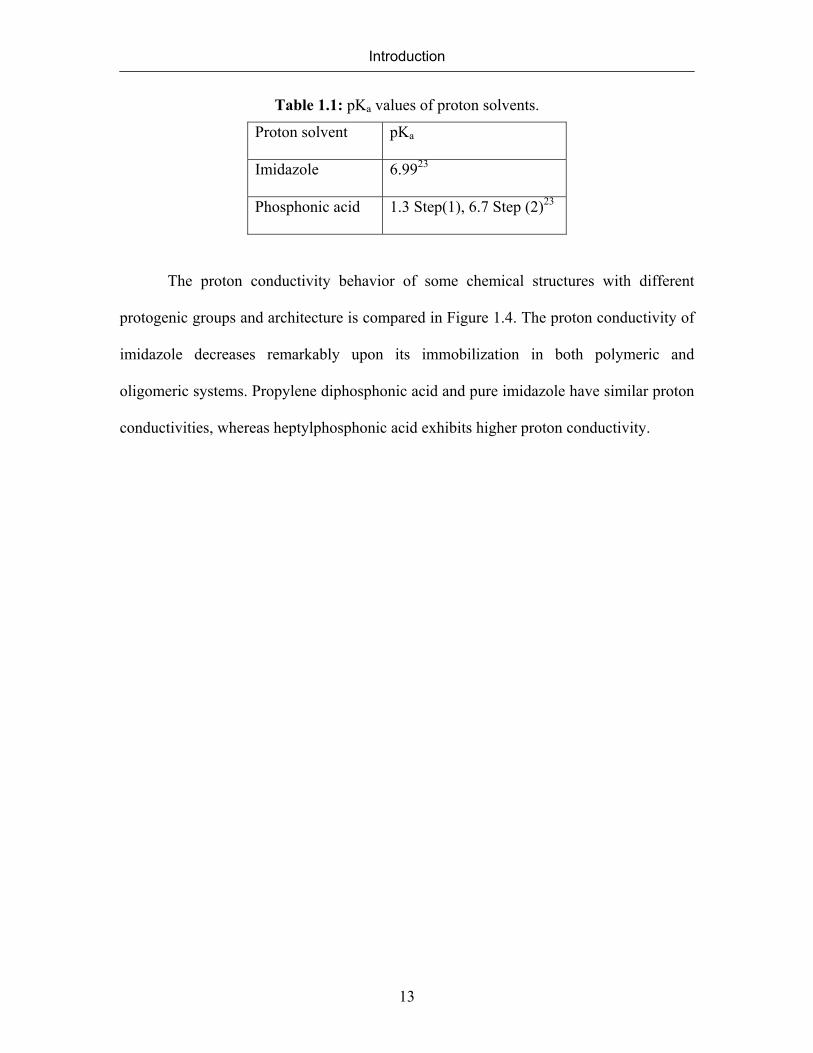
The proton conductivity behavior of some chemical structures with different
protogenic groups and architecture is compared in Figure 1.4. The proton conductivity of
imidazole decreases remarkably upon its immobilization in both polymeric and
oligomeric systems. Propylene diphosphonic acid and pure imidazole have similar proton
conductivities, whereas heptylphosphonic acid exhibits higher proton conductivity.
Introduction
14
Si O
O
N
HN
n
PImSS pure
H
N
N
CH2
H
O CH2CH2O CH2
N
N
3
Imi-3 pure
P(O)(OH)2
Heptyl Phosphonic Acid Polystyrene derivative 10a pure
O
HN
N
m
CImSS-B pure
Si
N
NBn
O
O
n
Propylene Diphosphonic Acid
(HO)2(O)P P(O)(OH)2
2.4 2.6 2.8 3.0 3.2 3.4 3.6 3.8-10
-9
-8
-7
-6
-5
-4
-3
-2
-1
0
-10
-9
-8
-7
-6
-5
-4
-3
-2
-1
0
T / °C
(1000/T) / K -1
200 150 100 50 0
Heptyl Phosphonic AcidPropylene Diphosphonic Acid
% (Imidazole pure)% (Imi-3 pure)% (CImSS-B pure)% (PImSS pure)% (polystyrene derivative 10a pure)
log
[σ/ S
cm-1
]
Figure 1.4: Comparison of proton conductivity of different chemical structures.
There are many reports about phosphonic acid containing chemical structures
such as poly(arylene ether)s,24 copolymers of α, β, β- trifluorostyrene with p-
dimethylphosphonate-α,β, β-trifluorostyrene,25 poly(arylphoshazenes),26 vinylphosphonic
acid incorporated into Nafion,27 and phosphonated perfluorocarbon polymers.28 These
structures with phosphonic acid function were already studied as an alternative to the
sulfonic acid group in PEM fuel cell membranes operating in high humidity

Introduction
15
environments because of their higher thermal stability and oxidation resistance. However,
in these systems, proton transport is based on the presence of water.
For the first time, the phosphonic acid function was immobilized via flexible
spacers bound to cyclic siloxanes by Steininger and her coworkers,29 where phosphonic
acid groups are present at high concentration and act as intrinsically proton
conductivities. Moreover, poly(vinylphosphonic acid)-heterocycle composite materials
were investigated in terms of their proton conduction properties under the operating
conditions of fuel cells and it was suggested that the proton conduction mechanism does
not rely on vehicle molecules such as water.30
The aim of this work is to investigate the details of homopolymerization of
vinylphosphonic acid (VPA) and the properties of poly(vinylphosphonic acid) (PVPA) as
a potential candidate to be a component of PEMs in a low humidity environment at
operating temperatures higher than 100 °C. The details of the microstructure are
important for its thermal stability, and for the condensation of phosphonic acid groups,
which are important parameters in determining the proton conductivity of PVPA. PVPA
samples with different microstructure may have different types of rings resulting from the
condenstation of phosphonic acid functionality. This may have an influence on both
thermal stability and proton conductivity of PVPA.

CHAPTER 2
EXPERIMENTAL
2.1 Materials
All chemicals were used as received unless noted otherwise. VPA (Aldrich, 97 %
purity, stabilized with 30-50 ppm hydroquinone) was washed with diethyl ether before
polymerization to remove the stabilizer. Dimethyl vinylphosphonate (DMVP) (Aldrich,
85%), and diethyl vinylphosphonate (DEVP) (Aldrich, 97%) were distilled under reduced
pressure. 2,2’-Azobis(isobutyroic acid amidine)dihydrochloride (AIBA) (Aldrich, 97 %),
and 2,2′-Azobis(2-methylpropionitrile) (Fluka, 98 %) were used as initiators.
Ethylxanthogenacetic acid (Aldrich) was the chain transfer agent in reversible addition
fragmentation polymerization.
2.2 Characterization
2.2.1 Nuclear Magnetic Resonance
2.2.1.1 Nuclear Magnetic Resonance in Solution
1H-, 31P-, and 13C-NMR spectra were recorded in solution with Bruker
spectrometers operating at 500 MHz, 202.46 MHz, and 176.03 MHz, respectively. They
were collected using D2O as solvent if not otherwise stated. The concentration of the
samples will be indicated where necessary. 85 % phosphoric acid, and 3-
(Trimethylsilyl)propionic-2,2,3,3-d4 acid sodium salt were used to calibrate the 31P- and

Experimental
18
13C-NMR spectra, respectively. The chemical shift of the methine protons of PVPA and
PDMVP are given by the center of the resonance whereas the chemical shift region is
indicated for the different tetrad sequences of methylene protons of PVPA in their 1H-
NMR spectra. The assignments of the resonances of tetrad sequences are discussed in
Chapter 5.
1H- and 31P-NMR spectra of PDEVP and PDISP were collected in chloroform.
Triphenylphosphine were used as reference in CDCl3 for the 31P-NMR spectra.
2.2.1.2 Magic Angle Solid State Nuclear Magnetic Resonance (MAS-NMR)
The solid state nuclear magnetic resonance experiments were performed in
cooperation with Dr. Young Joo Lee from the Max Planck Institute for Polymer
Research, Mainz. All solid state NMR spectra were collected by Dr. Y. J. Lee.
1H-MAS NMR experiments were performed either on a Brucker Avance 700 or
on an ASX500 spectrometer, equipped with a 2.5 mm fast MAS probe. All 1H-MAS
NMR spectra were acquired at spinning frequencies of 30 kHz.
31P-MAS NMR experiments were carried out at an operating frequency of 202.45
MHz on a Brucker ASX500 spectrometer, equipped with a 2.5 mm fast MAS probe. The
spinning frequencies were either 10 kHz or 30 kHz. Two dimensional double quantum
(2D DQ) 31P-MAS spectra were recorded with rotor-synchronized back-to-back (BABA)
pulse sequence at spinning frequency of 30 kHz.
13C-CP MAS NMR spectra were acquired at an operating frequency of 176.06
MHz on a Brucker Avance 700 spectrometer. Unless stated otherwise, all spectra were
collected at room temperature, which leads to a sample temperature up to 50-60 ˚C due to
the frictional heat at high spinning frequency.
Experimental
19
2.2.2 Molecular Weight Determination
2.2.2.1 Molecular Weight Determination by Light Scattering
Light scattering was performed with a commercial set-up ALV-5000 equipped
with a helium-neon laser operating at 633 nm and 20 mW. Polymer solutions of different
concentration were first dialyzed against the standard 5 g/L NaH2PO4 aqueous solution
which was used as the solvent in all cases. The equilibrated solutions were filtered using
mixed cellulose membrane filters (Millipore HA) of 0.45 μm pore size. The
concentrations of the equilibrated solutions were determined by 1H-NMR after
construction a calibration curve, for which 1H-NMR spectra of a series polymer solutions
of known concentration were recorded in the presence of 3-(Trimethylsilyl)propionic-
2,2,3,3-d4 acid sodium salt. The calibration curve was realized by comparing the
intensities of the resonances due to the polymer backbone with that of the reference salt.
Construction of calibration curves were repeated for each PVPA sample of different
molecular weight. All measurements were performed at 25 ˚C using cylindrical sample
cells. The refractive index increment (dn/dc) was determined in 5 g/L NaH2PO4 by a
scanning Michelson interferometer operating at the same wavelength as the laser.
Dynamic light scattering experiments were carried out with PVPA solutions (1g/L in 0.1
M NaNO3) of different molecular weight to measure the hydrodynamic radius of different
molecular weight polymers. The dynamic light scattering experiments of
poly(vinylphosphonates) (PDEVP, PDISP) were performed in ethanol and the
concentration of the polymer solutions was 10 g /L.
Experimental
20
2.2.2.2 Molecular Weight Determination by Size Exclusion Chromatography
The gel permeation chromatography instrument was equipped with three PVXL-
TSK columns of 6000, 5000, 3000 Å pore size. A sodium nitrate solution in water (0.1
M) was used as eluent. The measurements were performed at 40 ˚C on aqueous
polymeric solutions (1g/L in 0.1 M NaNO3). All samples were solved by 0.1M NaNO3
and were filtered through mixed cellulose membrane filters (Millipore HA) of 0.45 μm
pore size.
2.2.3 Infrared Spectroscopy
FT-IR spectra were obtained on a Nicolet 730 FTIR Spectrometer. All samples
were measured in the pellet form with KBr.
2.2.4 Potentiometric Titration
Titrations of both VPA and PVPA were conducted with a Metrohm Titranda 836
at 25 °C. Solutions of VPA and PVPA (1mg/1mL) were prepared in water and titrated
with a 0.1 N standard solution of NaOH. Titration of PVPA was repeated in the presence
of a low molecular weight salt. 50 mg PVPA was dissolved in 50 mL of 0.85 M NaCl
solution.
2.2.5 Dielectric Spectroscopy
The conductivity of PVPA was measured with an SI 1260 impedance/gain-phase
analyzer (Schlumberger) dielectric spectroscopy in the frequency range from 10-1 to 10-6
Hz in an open system under dry conditions. Pellets were prepared and placed on a gold
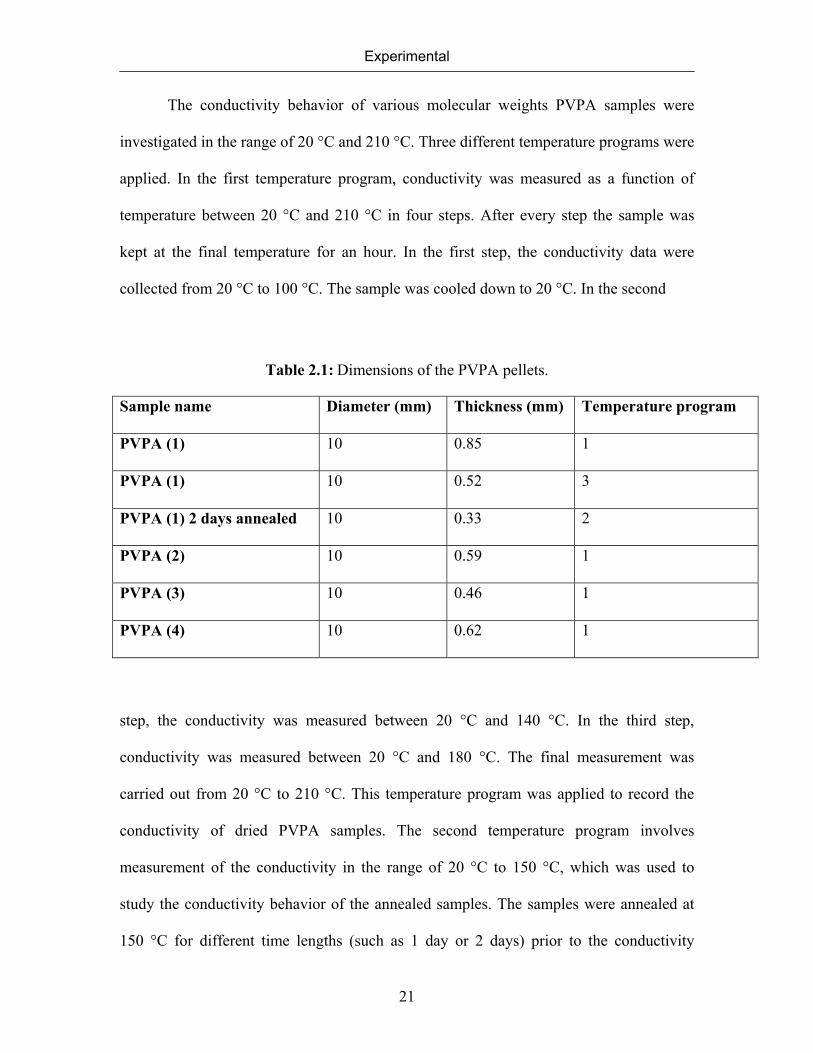
electrode. The thickness and the diameter of the pellets are shown in Table 2.1.
Experimental
21
The conductivity behavior of various molecular weights PVPA samples were
investigated in the range of 20 °C and 210 °C. Three different temperature programs were
applied. In the first temperature program, conductivity was measured as a function of
temperature between 20 °C and 210 °C in four steps. After every step the sample was
kept at the final temperature for an hour. In the first step, the conductivity data were
collected from 20 °C to 100 °C. The sample was cooled down to 20 °C. In the second
Table 2.1: Dimensions of the PVPA pellets.
Sample name Diameter (mm) Thickness (mm) Temperature program
PVPA (1) 10 0.85 1
PVPA (1) 10 0.52 3
PVPA (1) 2 days annealed 10 0.33 2
PVPA (2) 10 0.59 1
PVPA (3) 10 0.46 1
PVPA (4) 10 0.62 1
step, the conductivity was measured between 20 °C and 140 °C. In the third step,
conductivity was measured between 20 °C and 180 °C. The final measurement was
carried out from 20 °C to 210 °C. This temperature program was applied to record the
conductivity of dried PVPA samples. The second temperature program involves
measurement of the conductivity in the range of 20 °C to 150 °C, which was used to
study the conductivity behavior of the annealed samples. The samples were annealed at
150 °C for different time lengths (such as 1 day or 2 days) prior to the conductivity
Experimental
22
measurements. In the third temperature program, the conductivity of PVPA samples were
first recorded at 20 °C, after which the temperature was increased to 100 °C, where the
samples were kept for several hours, and the conductivity data were acquired. This
temperature program was used to investigate the conductivity of dried PVPA samples as
a function of time at a constant temperature (100 °C). All samples were heated from one
temperature to the next one (where the data were collected) in a very short time, after
which 10 minutes were allowed to the sample to achieve a constant temperature prior to
the data collection. The data collection was started when the fluctuation of the sample
temperature was not higher than 0.25 ˚C per minute.
Though the investigation of the conductivity by means of dielectric spectroscopy
gives no proof of about the nature of the conductivity, from the comparison with PFG-
NMR-data, it can be concluded that all conductivity is based on the proton conductivity.
2.2.6 Elemental Analysis
Elemental analysis was done by a commercial Polymer Standard Service.
2.3 Free Radical Polymerization of Vinylphosphonic Acid
VPA (1.0 g, 9.3 mmoles), AIBA (2.5 mg, 9.2x10⁻³ mmoles) and distilled water
(0.5 mL) were put in a Schlenk flask, which was evacuated and backfilled with argon
prior to the polymerization. The reaction mixture was heated to 80 °C for three hours.
The product was dissolved in water and dialyzed with a Spectra/Por® regenerated
cellulose dialysis membrane of 1000 g/mol of cut off. The resulting polymer was freeze
dried and was dried to constant weight at 50 °C, 10-3 mbar. The mol percent of initiator to
the monomer is 0.1 in the polymerization described above. Polymerization was also

Experimental
23
carried out with 1.0 and 10 mol percent of initiator following the same procedure. The
water content of the reaction with the highest concentration of initiator was increased to
solubilize the initiator in the medium. The product of this reaction (PVPA (3)) was
dialyzed with lower pore size membrane (500 g/mol of cut-off) since a lower molecular
weight polymer was expected. The reaction conditions are given in Table 2.2.
Table 2.2: Polymerization conditions for VPA.
Sample mol % (initiator/monomer) Water content (%) PVPA (1) 0.1 33.3 PVPA (2) 1.0 32.8 PVPA (3) 10 44.4
The yield of the polymerization reactions was determined by gravimetry after purification
by dialysis followed by drying to constant weight at 50 °C. The fraction of monomer
converted to the polymer was found by 1H-NMR comparing the intensities of the
resonances of the polymer backbone with that of monomer left over in the medium before
purification. All spectra regarding the calculation of conversions are given in Appendix I.
PVPA (1)
1H-NMR (D2O): δ=2.50 (CH-P), 2-1.2 (CH2)
31P-NMR (D2O): δ= 29.80 (P-OH), 21.50 (P-O-P)
Yield: 70 %
(C2H5PO3)n : Calcd. C 22.24, P 28.67, H 4.66; Found C 20.94, P 26.03, H 5.16.
Mw= 62 000 g/mol by static light scattering in 5 g/L aqueous NaH2PO4
IR (KBr): 1173 (P=O), 1453 (CH2), 1033, 933 (P-O)
PVPA (2)

Experimental
24
1H-NMR (D2O): δ=2.45 (CH-P), 2.30-1.10 (CH2)
31P-NMR (D2O): δ= 31.2 (P-OH), 22.5 (P-O-P)
Conversion: 96 % Yield: 63 %
Mw= 44 700 g/mol by static light scattering in 5 g/L aqueous NaH2PO4
PVPA (3)
1H-NMR (D2O): δ= 2.40 (CH-P), 2.35-1.20 (CH2)
31P-NMR (D2O): δ= 30.38 (P-OH), 22.25 (P-O-P)
Conversion: 98 % Yield: 23 %
IR (KBr):1141 (P=O), 1452 (CH2), 1003, 991 (P-O)
2.4 Synthesis of Poly(vinylphosphonic acid) from Dimethyl
Vinylphosphonates
2.4.1 Free Radical Polymerization of Dimethyl Vinylphosphonate
DMVP (3 mL, 25.3 mmoles), AIBA (6.8 mg, 2.5x10⁻³ mmoles) and distilled
water (1.5 mL) were reacted to poly(dimethyl vinylphosphonate) (PDMVP) in a Schlenk
flask, which was evacuated and backfilled with argon prior to the polymerization. The
synthesis and purification procedures were the same as described for VPA.
PDMVP
1H-NMR (D2O): δ= 3.8 (P-O-CH3), 3-1.1 (CH2-CH-P)
31P-NMR (D2O): δ= 36.52 (P-O-CH3)
Conversion: 42% Yield: 23%
IR (KBr): 1035 (P=O), 1190 (P-O-CH3), 2965, 2853 (CH2), 1365, 1459 (CH in methyl)
Experimental
25
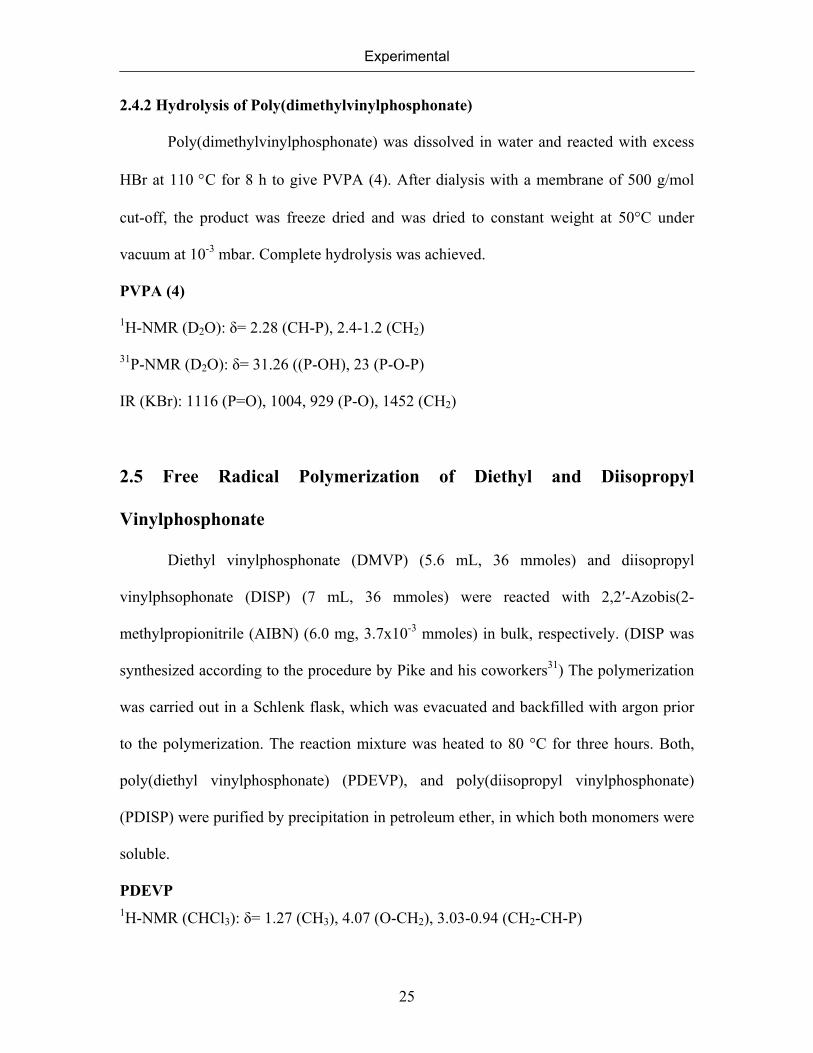
2.4.2 Hydrolysis of Poly(dimethylvinylphosphonate)
Poly(dimethylvinylphosphonate) was dissolved in water and reacted with excess
HBr at 110 °C for 8 h to give PVPA (4). After dialysis with a membrane of 500 g/mol
cut-off, the product was freeze dried and was dried to constant weight at 50°C under
vacuum at 10-3 mbar. Complete hydrolysis was achieved.
PVPA (4)
1H-NMR (D2O): δ= 2.28 (CH-P), 2.4-1.2 (CH2)
31P-NMR (D2O): δ= 31.26 ((P-OH), 23 (P-O-P)
IR (KBr): 1116 (P=O), 1004, 929 (P-O), 1452 (CH2)
2.5 Free Radical Polymerization of Diethyl and Diisopropyl
Vinylphosphonate
Diethyl vinylphosphonate (DMVP) (5.6 mL, 36 mmoles) and diisopropyl
vinylphsophonate (DISP) (7 mL, 36 mmoles) were reacted with 2,2′-Azobis(2-
methylpropionitrile (AIBN) (6.0 mg, 3.7x10⁻³ mmoles) in bulk, respectively. (DISP was
synthesized according to the procedure by Pike and his coworkers31) The polymerization
was carried out in a Schlenk flask, which was evacuated and backfilled with argon prior
to the polymerization. The reaction mixture was heated to 80 °C for three hours. Both,
poly(diethyl vinylphosphonate) (PDEVP), and poly(diisopropyl vinylphosphonate)
(PDISP) were purified by precipitation in petroleum ether, in which both monomers were
soluble.
PDEVP 1H-NMR (CHCl3): δ= 1.27 (CH3), 4.07 (O-CH2), 3.03-0.94 (CH2-CH-P)
Experimental
26
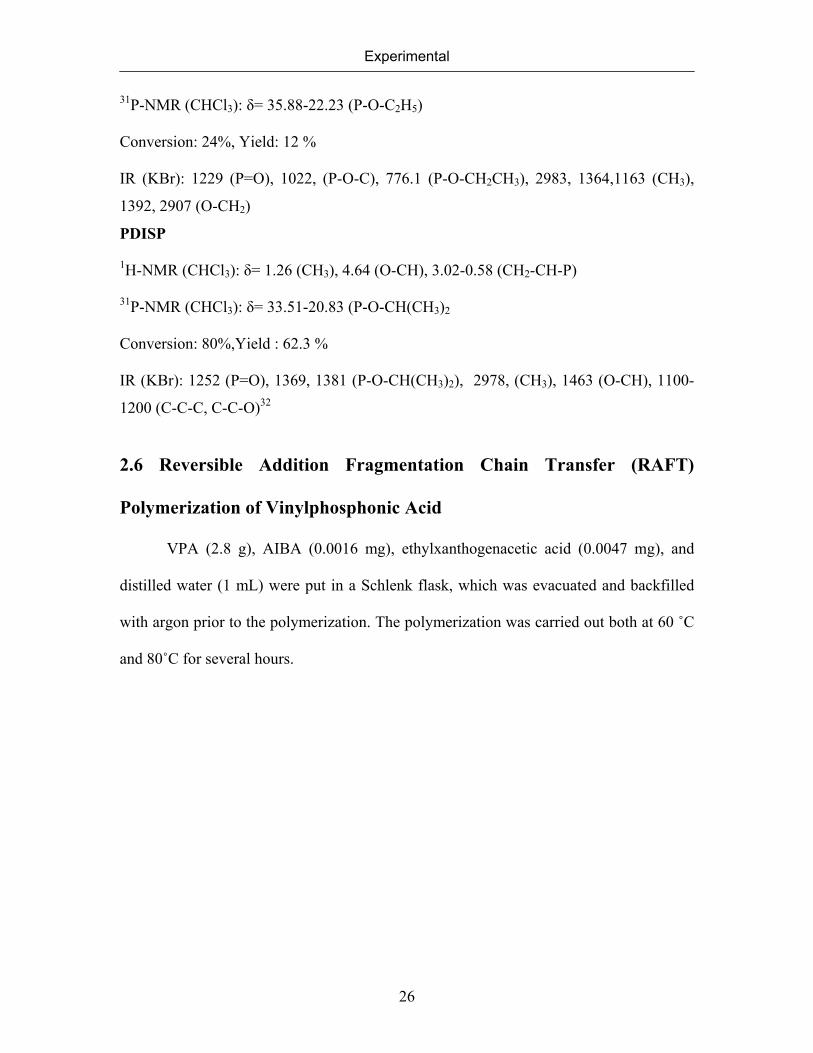
31P-NMR (CHCl3): δ= 35.88-22.23 (P-O-C2H5)
Conversion: 24%, Yield: 12 %
IR (KBr): 1229 (P=O), 1022, (P-O-C), 776.1 (P-O-CH2CH3), 2983, 1364,1163 (CH3),
1392, 2907 (O-CH2)
PDISP
1H-NMR (CHCl3): δ= 1.26 (CH3), 4.64 (O-CH), 3.02-0.58 (CH2-CH-P)
31P-NMR (CHCl3): δ= 33.51-20.83 (P-O-CH(CH3)2
Conversion: 80%,Yield : 62.3 %
IR (KBr): 1252 (P=O), 1369, 1381 (P-O-CH(CH3)2), 2978, (CH3), 1463 (O-CH), 1100-
1200 (C-C-C, C-C-O)32
2.6 Reversible Addition Fragmentation Chain Transfer (RAFT)
Polymerization of Vinylphosphonic Acid
VPA (2.8 g), AIBA (0.0016 mg), ethylxanthogenacetic acid (0.0047 mg), and
distilled water (1 mL) were put in a Schlenk flask, which was evacuated and backfilled
with argon prior to the polymerization. The polymerization was carried out both at 60 ˚C
and 80˚C for several hours.
CHAPTER 3
SYNTHESIS OF POLY(VINYLPHOSPHONIC ACID)
3.1 Introduction
Although poly(vinylphosphonic acid) may be considered as the simplest case of a
polymeric diprotic acid and may be compared in its usefulness and scope of potential
applications with poly(acrylic acid) (PAA) and poly(vinylsulfonic acid) (PVSA), little is
known about the details of its synthesis. Recent interest in PVPA relates to its possible
application in fuel cells as the key constituent of the polymer electrolyte membrane
(PEM).22 Other applications concern with the protection of metal surfaces in a form of
primer33 or as a reactive component in dental cements.34-36
Copolymers of vinylphosphonic acid with acrylonitrile,37 N-
isopropylacrylamide,38 styrene,39 vinylpyrrolidone,40 acrylic- and methacrylic acid41 have
been reported, and their application for pervaporation membranes,37 hydrogels for drug
delivery38 as component in biomimetric mineralization,42 and of PEM fuel cells30, 40 has
been suggested.
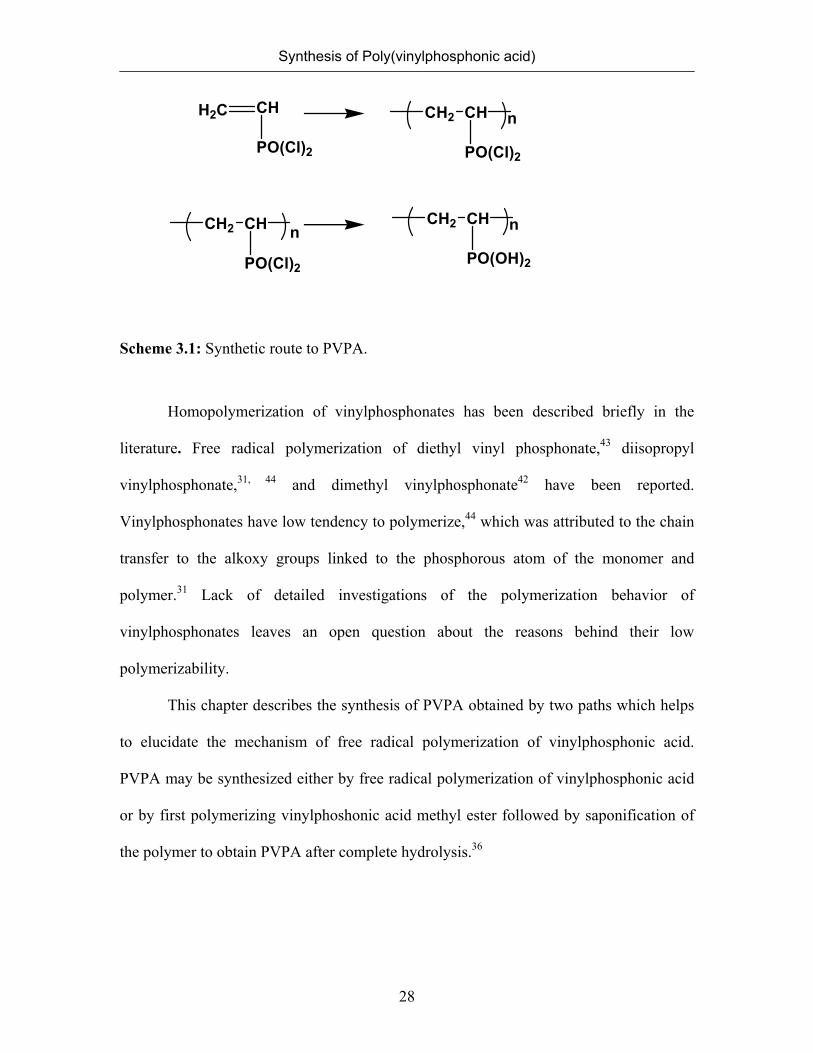
Levine reported the free radical polymerization of VPA.41 However, no
information about details of the synthesis, purification, and characterization were given.
PVPA has already been prepared to be utilized in dental cements starting with vinyl
phosphonyl dichloride. Vinyl phosphonyl chloride was polymerized in an inert solvent
(1,1,1-trichloroethane) with AIBN. Poly(vinyl phosphonyl chloride) was hydrolyzed by
pouring it slowly into water to give PVPA (Scheme 3.1).
Synthesis of Poly(vinylphosphonic acid)
28
H2C CH
PO(Cl)2
CH2 CH
PO(Cl)2
CH2 CH
PO(Cl)2
n
nCH2 CH
PO(OH)2
n
Scheme 3.1: Synthetic route to PVPA.
Homopolymerization of vinylphosphonates has been described briefly in the
literature. Free radical polymerization of diethyl vinyl phosphonate,43 diisopropyl
vinylphosphonate,31, 44 and dimethyl vinylphosphonate42 have been reported.
Vinylphosphonates have low tendency to polymerize,44 which was attributed to the chain
transfer to the alkoxy groups linked to the phosphorous atom of the monomer and
polymer.31 Lack of detailed investigations of the polymerization behavior of
vinylphosphonates leaves an open question about the reasons behind their low
polymerizability.
This chapter describes the synthesis of PVPA obtained by two paths which helps
to elucidate the mechanism of free radical polymerization of vinylphosphonic acid.
PVPA may be synthesized either by free radical polymerization of vinylphosphonic acid
or by first polymerizing vinylphoshonic acid methyl ester followed by saponification of
the polymer to obtain PVPA after complete hydrolysis.36

Synthesis of Poly(vinylphosphonic acid)
29
H2C CH
PO3H2
n
H2C CH
P(OCH3)2
nO
H2C CH
P(OCH3)2On
H2C CH
PO3H2
n
Scheme 3.2: Two synthetic pathways to PVPA.
Additionally, the polymerization of vinylphosphonic acid was studied in the presence of
reversible addition fragmentation (RAFT) chain transfer agents to achieve chain length
control in collaboration with Hugh Chaffey-Millar and Dr. Christopfer Barner-Kowollik
from Centre for Advanced Macromolecular Design (CAMD), School of Chemical
Sciences and Engineering, University of NSW, Australia. The results of the RAFT
process will be discussed, because they are of importance to support the suggested
polymerization mechanism of vinylphosphonic acid. Additionally, a comparison of the
possible polymerization techniques to prepare PAA), PVSA, and PVSA is given at the
end of this chapter.
Synthesis of Poly(vinylphosphonic acid)
30
3.2 Polymerization of VPA
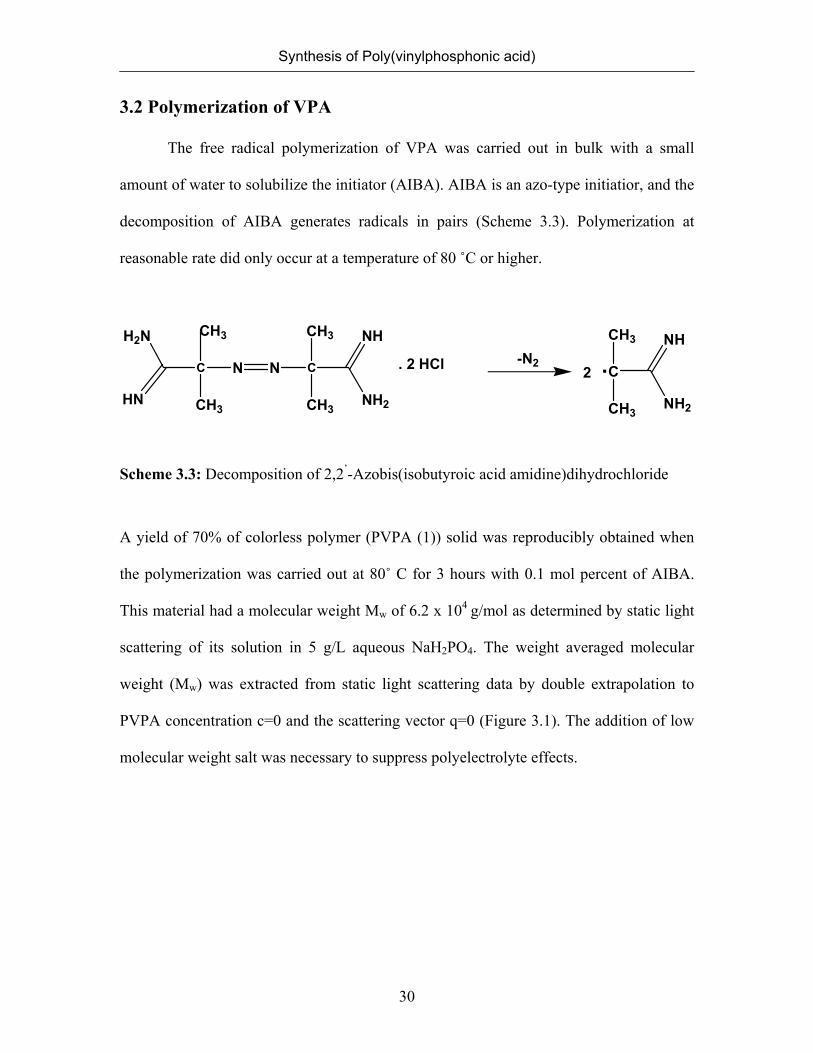
The free radical polymerization of VPA was carried out in bulk with a small
amount of water to solubilize the initiator (AIBA). AIBA is an azo-type initiatior, and the
decomposition of AIBA generates radicals in pairs (Scheme 3.3). Polymerization at
reasonable rate did only occur at a temperature of 80 ˚C or higher.
N N CC
CH3
CH3CH3HN
NH
NH2
H2N
. 2 HCl -N2 C
CH3
CH3
NH
NH2
CH3
.2
Scheme 3.3: Decomposition of 2,2’-Azobis(isobutyroic acid amidine)dihydrochloride
A yield of 70% of colorless polymer (PVPA (1)) solid was reproducibly obtained when
the polymerization was carried out at 80˚ C for 3 hours with 0.1 mol percent of AIBA.
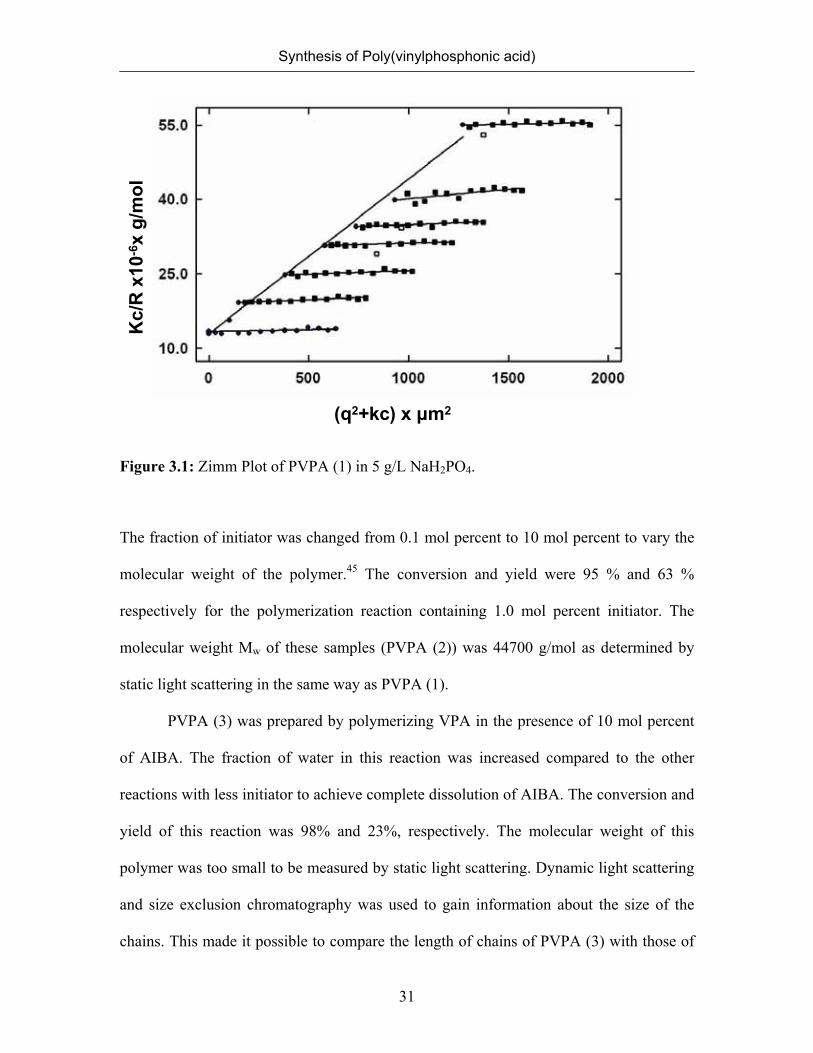
This material had a molecular weight Mw of 6.2 x 10⁴ g/mol as determined by static light
scattering of its solution in 5 g/L aqueous NaH2PO4. The weight averaged molecular
weight (Mw) was extracted from static light scattering data by double extrapolation to
PVPA concentration c=0 and the scattering vector q=0 (Figure 3.1). The addition of low
molecular weight salt was necessary to suppress polyelectrolyte effects.
Synthesis of Poly(vinylphosphonic acid)
31
(q2+kc) x μm2
Kc/
R x
10-6
x g/
mol
Figure 3.1: Zimm Plot of PVPA (1) in 5 g/L NaH2PO4.
The fraction of initiator was changed from 0.1 mol percent to 10 mol percent to vary the
molecular weight of the polymer.45 The conversion and yield were 95 % and 63 %
respectively for the polymerization reaction containing 1.0 mol percent initiator. The
molecular weight Mw of these samples (PVPA (2)) was 44700 g/mol as determined by
static light scattering in the same way as PVPA (1).
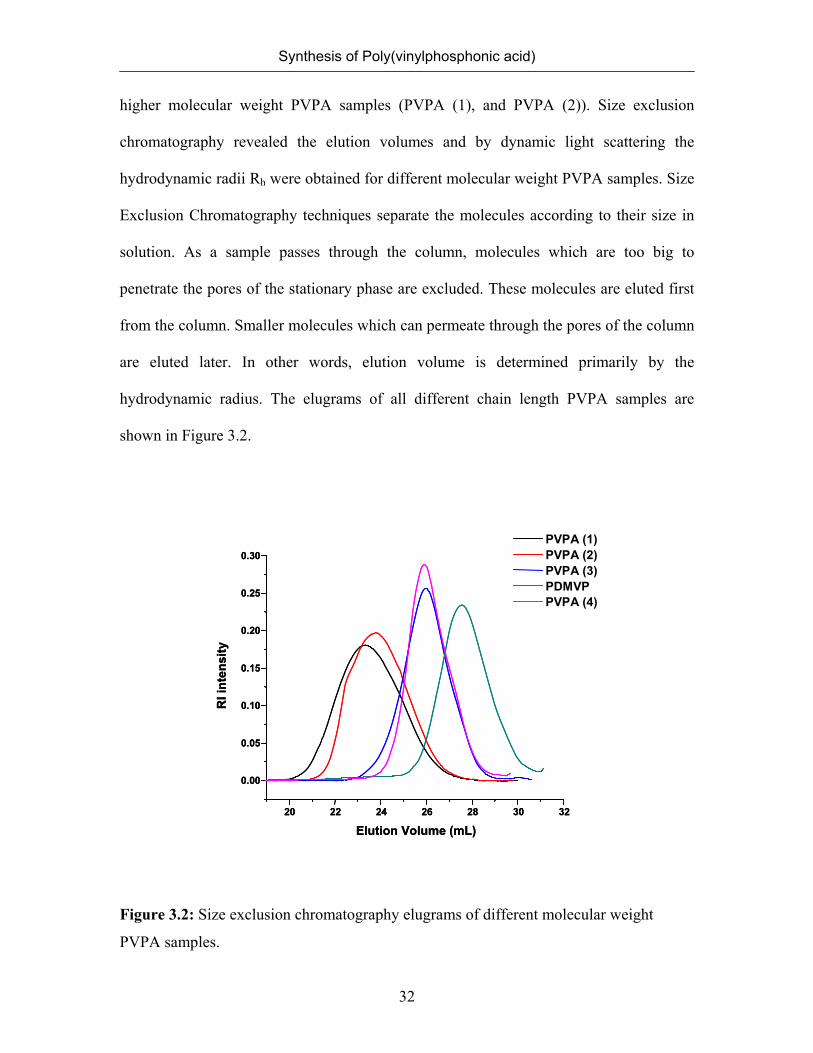
PVPA (3) was prepared by polymerizing VPA in the presence of 10 mol percent
of AIBA. The fraction of water in this reaction was increased compared to the other
reactions with less initiator to achieve complete dissolution of AIBA. The conversion and
yield of this reaction was 98% and 23%, respectively. The molecular weight of this
polymer was too small to be measured by static light scattering. Dynamic light scattering
and size exclusion chromatography was used to gain information about the size of the
chains. This made it possible to compare the length of chains of PVPA (3) with those of
Synthesis of Poly(vinylphosphonic acid)
32
higher molecular weight PVPA samples (PVPA (1), and PVPA (2)). Size exclusion
chromatography revealed the elution volumes and by dynamic light scattering the
hydrodynamic radii Rh were obtained for different molecular weight PVPA samples. Size
Exclusion Chromatography techniques separate the molecules according to their size in
solution. As a sample passes through the column, molecules which are too big to
penetrate the pores of the stationary phase are excluded. These molecules are eluted first
from the column. Smaller molecules which can permeate through the pores of the column
are eluted later. In other words, elution volume is determined primarily by the
hydrodynamic radius. The elugrams of all different chain length PVPA samples are
shown in Figure 3.2.
20 22 24 26 28 30 32
0.00
0.05
0.10
0.15
0.20
0.25
0.30
RI i
nten
sity
Elution Volume (mL)
PVPA (1)PVPA (2)PVPA (3)PDMVPPVPA (4)
20 22 24 26 28 30 32
0.00
0.05
0.10
0.15
0.20
0.25
0.30
RI i
nten
sity
Elution Volume (mL)
PVPA (1)PVPA (2)PVPA (3)PDMVPPVPA (4)
Figure 3.2: Size exclusion chromatography elugrams of different molecular weight
PVPA samples.
Synthesis of Poly(vinylphosphonic acid)
33
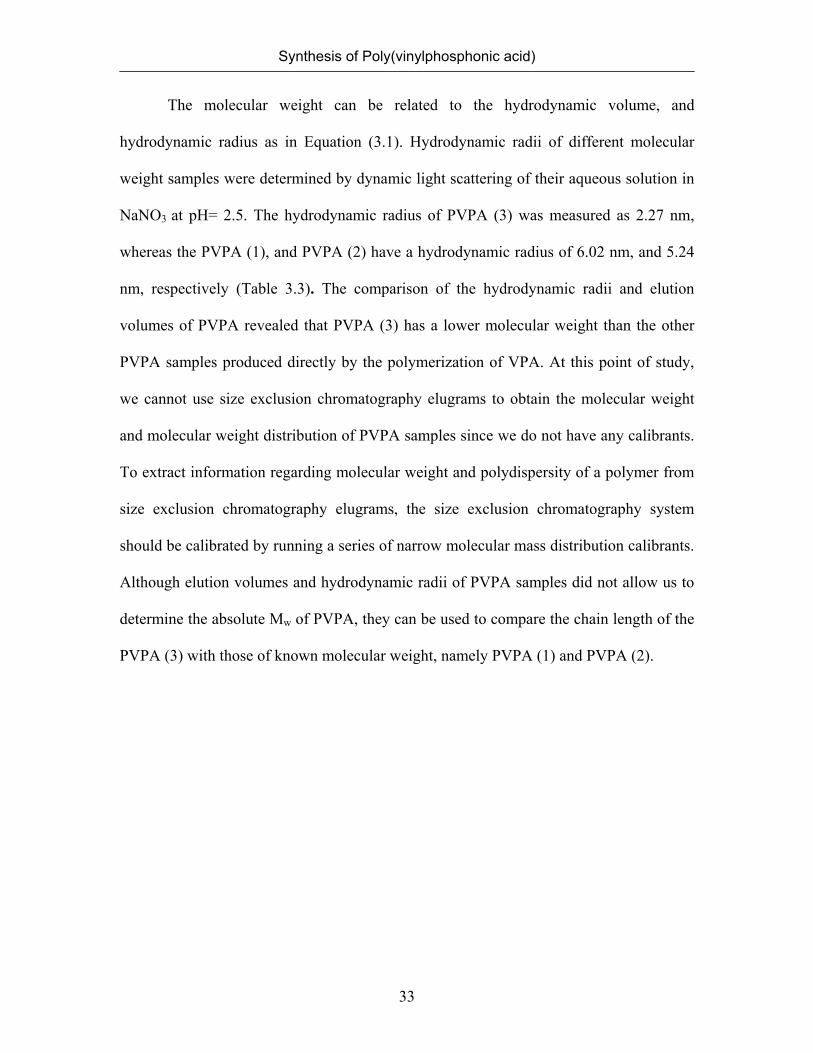
The molecular weight can be related to the hydrodynamic volume, and
hydrodynamic radius as in Equation (3.1). Hydrodynamic radii of different molecular
weight samples were determined by dynamic light scattering of their aqueous solution in
NaNO3 at pH= 2.5. The hydrodynamic radius of PVPA (3) was measured as 2.27 nm,
whereas the PVPA (1), and PVPA (2) have a hydrodynamic radius of 6.02 nm, and 5.24
nm, respectively (Table 3.3). The comparison of the hydrodynamic radii and elution
volumes of PVPA revealed that PVPA (3) has a lower molecular weight than the other
PVPA samples produced directly by the polymerization of VPA. At this point of study,
we cannot use size exclusion chromatography elugrams to obtain the molecular weight
and molecular weight distribution of PVPA samples since we do not have any calibrants.
To extract information regarding molecular weight and polydispersity of a polymer from
size exclusion chromatography elugrams, the size exclusion chromatography system
should be calibrated by running a series of narrow molecular mass distribution calibrants.
Although elution volumes and hydrodynamic radii of PVPA samples did not allow us to
determine the absolute Mw of PVPA, they can be used to compare the chain length of the
PVPA (3) with those of known molecular weight, namely PVPA (1) and PVPA (2).
Synthesis of Poly(vinylphosphonic acid)
34
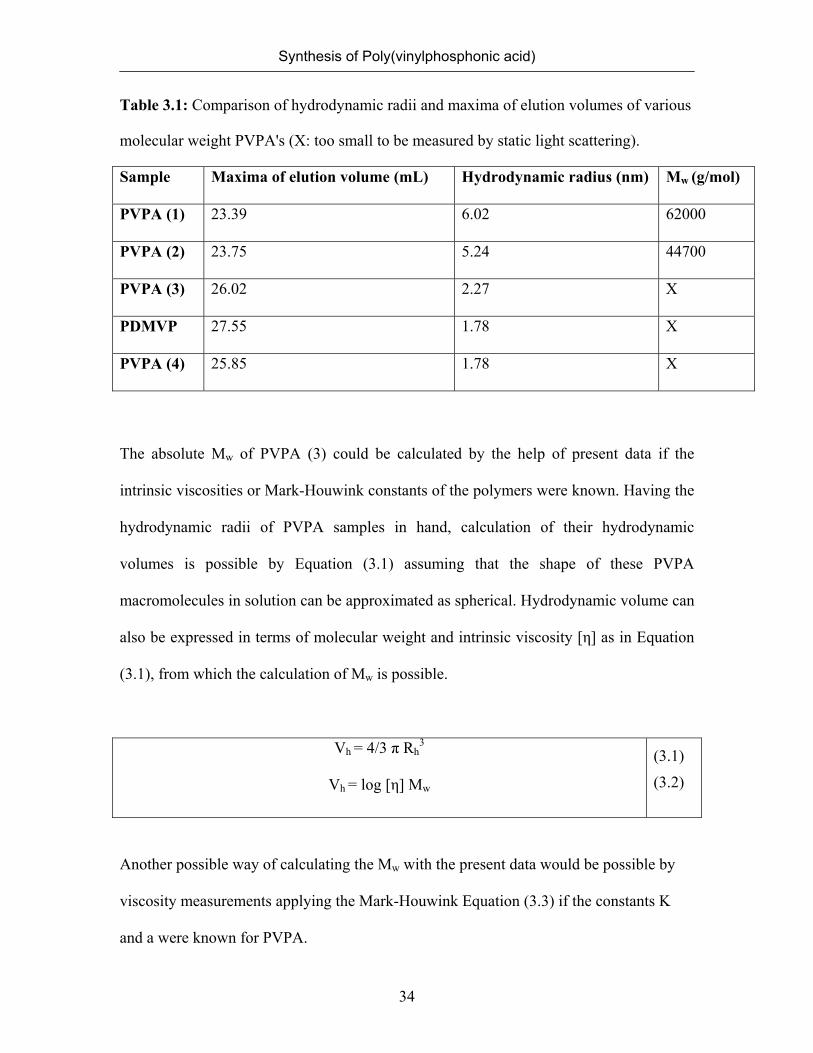
Table 3.1: Comparison of hydrodynamic radii and maxima of elution volumes of various
molecular weight PVPA's (X: too small to be measured by static light scattering).
Sample Maxima of elution volume (mL) Hydrodynamic radius (nm) Mw (g/mol)
PVPA (1) 23.39 6.02 62000
PVPA (2) 23.75 5.24 44700
PVPA (3) 26.02 2.27 X
PDMVP 27.55 1.78 X
PVPA (4) 25.85 1.78 X
The absolute Mw of PVPA (3) could be calculated by the help of present data if the
intrinsic viscosities or Mark-Houwink constants of the polymers were known. Having the
hydrodynamic radii of PVPA samples in hand, calculation of their hydrodynamic
volumes is possible by Equation (3.1) assuming that the shape of these PVPA
macromolecules in solution can be approximated as spherical. Hydrodynamic volume can
also be expressed in terms of molecular weight and intrinsic viscosity [η] as in Equation
(3.1), from which the calculation of Mw is possible.
Vh = 4/3 π Rh3
Vh = log [η] Mw
(3.1)
(3.2)
Another possible way of calculating the Mw with the present data would be possible by
viscosity measurements applying the Mark-Houwink Equation (3.3) if the constants K
and a were known for PVPA.

Synthesis of Poly(vinylphosphonic acid)
35
[η] = K Ma (3.3)
The yields for the reactions giving rise to high- (PVPA (1)) and intermediate
(PVPA (2)) molecular weight polymers are similar. Lowest yield was observed for the
polymerization with the highest amount of initiator. Nearly same amount of monomer
was converted to polymers during the polymerization reactions with 1.0 mol percent and
10 mol percent. In other words, although the conversion for these two polymerization
reactions was similar, they differed in their yield. This indicates that the extent of the
shorter chains formed during the polymerization in the presence of 10 mol percent
initiator was higher, some of which later diffused out of the dialysis membrane during the
purification step.
3.3 Polymerization of Dimethyl Vinylphosphonate and Its Hydrolysis to
Poly(vinylphosphonic acid)
Another route for the preparation of PVPA utilized the polymerization dimethyl
ester of vinylphosphonic acid followed by hydrolysis of the resulting polymer. The
polymerization of DMVP was carried out under the same conditions as described for the
free acid (VPA). The conversion was determined by 1H-NMR as 31.3% (Appendix I) by
comparing the intensities of the methyl group signal with that of the double bonds. The
yield was 23% after freeze drying. This material was saponified with an excess of HBr at
110 °C to give a sample of PVPA (4) (Scheme 3.2).
The molecular weight of PVPA (4) prepared by the hydrolysis of PDMVP was
much lower as compared to the samples prepared directly from VPA under the same

Synthesis of Poly(vinylphosphonic acid)
36
conditions. This was concluded from the elution volume obtained by Size Exclusion
Chromatography and the hydrodynamic radius measured by dynamic light scattering. The
hydrodynamic radius of PVPA (4) was found as 1.78 nm. The molecular weight of this
sample was too low to be measured by static light scattering.
3.4 Free Radical Polymerization of Vinylphosphonates
The polymerization of diethyl and diisopropyl vinyl phosphonate cannot be carried out in
aqueous medium because of their insolubility in water. Therefore, they were polymerized
in bulk using AIBN as initiator at 80 ˚C. The mol percent of the initiator was 0.1 in both
cases. The half-life time of AIBN ranges from 50 min to 76 min depending on the solvent
used at 80 °C.46 (Although the polymerization of DEVP and DISP were not performed in
any solvents listed in Table 3.2, the values may be informative about the approximate
length of time needed for initiator decomposition in our system)
Table 3.2: Half life of AIBN in different solvents at 80 °C.
Solvent Half-life (min) acetic acid 76 dioxane/water 71 nitrobenzene 50 toluene 74.5
The conversion was determined by 1H NMR comparing the intensity ratios of methylene
(-OCH2) and methine(OCH) protons of PDEVP and PDISP with that of double bonds left
in the reaction medium after polymerization. Conversion was found as 23% and 80% for
PDEVP, and PDISP, respectively (Appendix I). The reaction mixtures after the
Synthesis of Poly(vinylphosphonic acid)
37
polymerization were poured to cold petroleum ether to precipitate the polymer, and to
remove the rest of initiator, monomer, and oligomers. The yield after the purification step
was 12% and 63% for PDEVP, and PDISP, respectively. There is a remarkable difference
in the conversion of DEVP and DISP. It is not very clear whether this difference is
accidental. The conversions of the homopolymerizations of these two monomers were not
reported as different in the literature. However, there are limited number of work
regarding these monomers. Further work is necessary to find out the reasons behind the
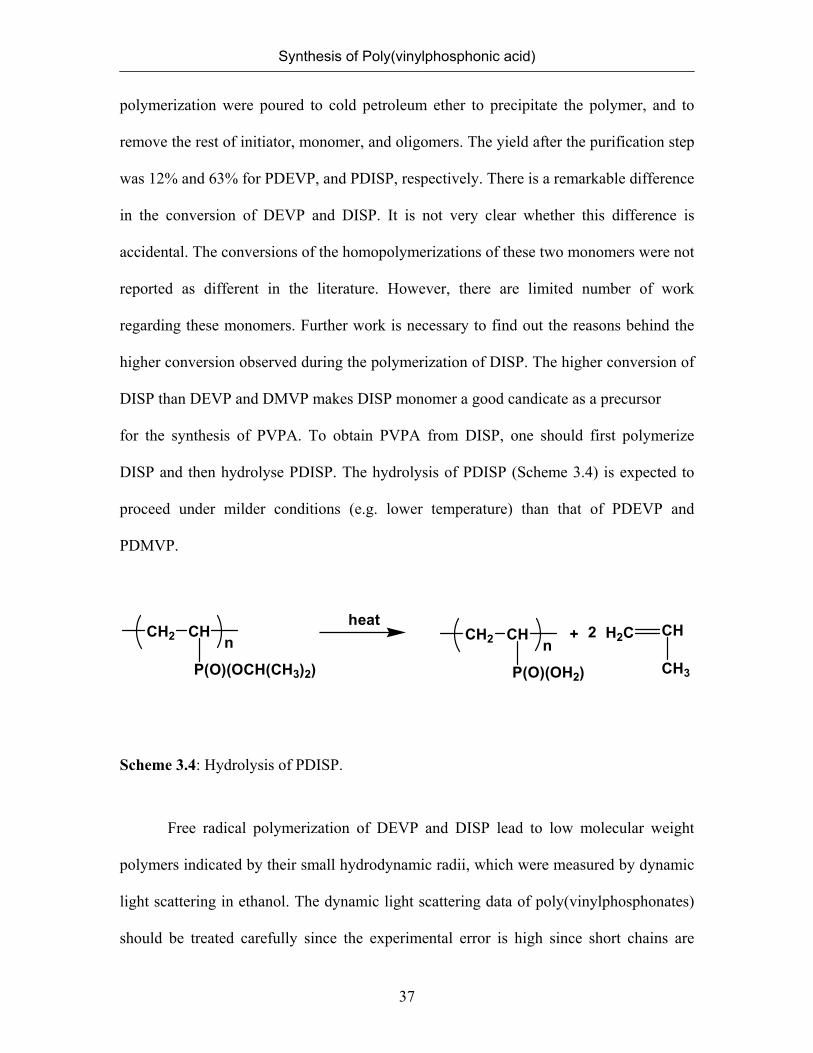
higher conversion observed during the polymerization of DISP. The higher conversion of
DISP than DEVP and DMVP makes DISP monomer a good candicate as a precursor
for the synthesis of PVPA. To obtain PVPA from DISP, one should first polymerize
DISP and then hydrolyse PDISP. The hydrolysis of PDISP (Scheme 3.4) is expected to
proceed under milder conditions (e.g. lower temperature) than that of PDEVP and
PDMVP.
CH2 CH
P(O)(OCH(CH3)2)
n CH2 CH
P(O)(OH2)
n+ H2C CH
CH3
2heat
Scheme 3.4: Hydrolysis of PDISP.
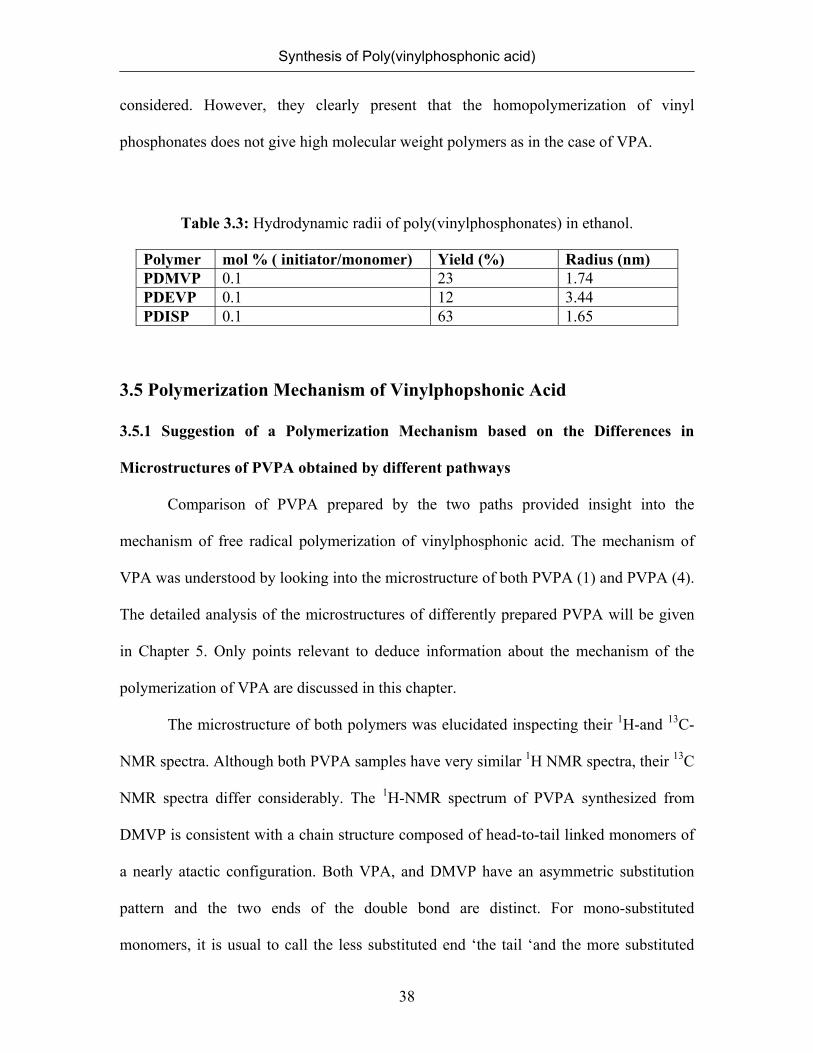
Free radical polymerization of DEVP and DISP lead to low molecular weight
polymers indicated by their small hydrodynamic radii, which were measured by dynamic
light scattering in ethanol. The dynamic light scattering data of poly(vinylphosphonates)
should be treated carefully since the experimental error is high since short chains are
Synthesis of Poly(vinylphosphonic acid)
38
considered. However, they clearly present that the homopolymerization of vinyl
phosphonates does not give high molecular weight polymers as in the case of VPA.
Table 3.3: Hydrodynamic radii of poly(vinylphosphonates) in ethanol.
Polymer mol % ( initiator/monomer) Yield (%) Radius (nm) PDMVP 0.1 23 1.74 PDEVP 0.1 12 3.44 PDISP 0.1 63 1.65
3.5 Polymerization Mechanism of Vinylphopshonic Acid
3.5.1 Suggestion of a Polymerization Mechanism based on the Differences in
Microstructures of PVPA obtained by different pathways
Comparison of PVPA prepared by the two paths provided insight into the
mechanism of free radical polymerization of vinylphosphonic acid. The mechanism of
VPA was understood by looking into the microstructure of both PVPA (1) and PVPA (4).
The detailed analysis of the microstructures of differently prepared PVPA will be given
in Chapter 5. Only points relevant to deduce information about the mechanism of the
polymerization of VPA are discussed in this chapter.
The microstructure of both polymers was elucidated inspecting their 1H-and 13C-
NMR spectra. Although both PVPA samples have very similar 1H NMR spectra, their 13C
NMR spectra differ considerably. The 1H-NMR spectrum of PVPA synthesized from
DMVP is consistent with a chain structure composed of head-to-tail linked monomers of
a nearly atactic configuration. Both VPA, and DMVP have an asymmetric substitution
pattern and the two ends of the double bond are distinct. For mono-substituted
monomers, it is usual to call the less substituted end ‘the tail ‘and the more substituted
Synthesis of Poly(vinylphosphonic acid)
39
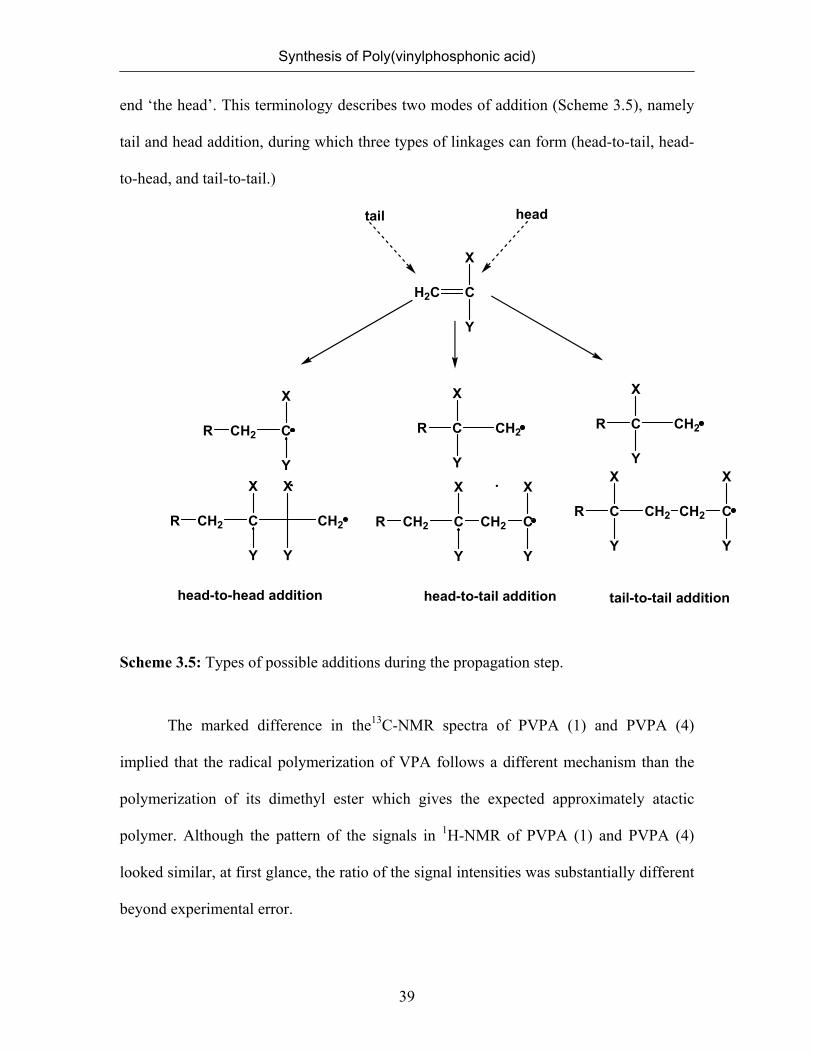
end ‘the head’. This terminology describes two modes of addition (Scheme 3.5), namely
tail and head addition, during which three types of linkages can form (head-to-tail, head-
to-head, and tail-to-tail.)
H2C C
X
Y
headtail
tail-to-tail additionhead-to-head addition
CH2 C
X
Y
R
CH2 C
X
Y
R
X
Y
CH2
R C CH2
X
Y
R C CH2
X
Y
CH2 C
X
Y
CH2 C
X
Y
R CH2 C
X
Y
R C CH2
X
Y
head-to-tail addition
Scheme 3.5: Types of possible additions during the propagation step.
The marked difference in the13C-NMR spectra of PVPA (1) and PVPA (4)
implied that the radical polymerization of VPA follows a different mechanism than the
polymerization of its dimethyl ester which gives the expected approximately atactic
polymer. Although the pattern of the signals in 1H-NMR of PVPA (1) and PVPA (4)
looked similar, at first glance, the ratio of the signal intensities was substantially different
beyond experimental error.
Synthesis of Poly(vinylphosphonic acid)
40
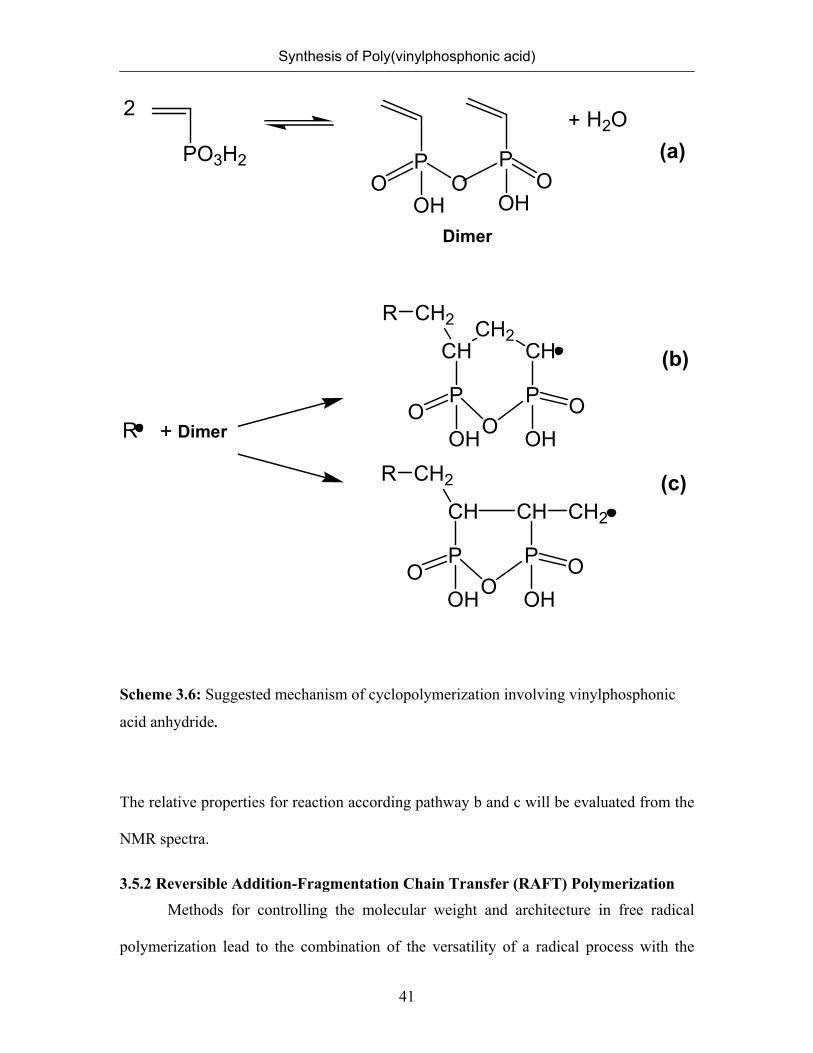
The observed structure can be rationalized assuming that VPA was not the true
monomer, but rather its anhydride undergoes polymerization (Scheme 3.6). Formation of
anhydrides of phosphonic acids is well known. They readily form in water at
polymerization temperatures.43 Once the anhydride is formed in equilibrium with the free
acid, it may undergo free radical polymerization following the two pathways b and c
shown in Scheme 3.6. Intramolecular propagation to form a six-membered ring
reproduces the pattern of a head-to-tail addition with concomitant formation of a methine
(secondary) radical, while the propagation to form a five-membered ring produces the
pattern of a head-to-head linkage with concomitant formation of a methylenic (primary)
radical. Attack of this radical to a further vinyl group in the β position would produce the
observed tail-to-tail links. Once the polymer is formed and investigated in dilute aqueous
solution at or near room temperature the anhydride structures will disappear47 or become
scrambled so that only the main chain sequence pattern gives evidence of the reaction
paths. These results suggested that the polymerization proceeded via
cyclopolymerization∗ of the vinylphosphonic acid anhydride as an intermediate.
Cyclopolymerization mechanism leads to the formation of five- and six-membered rings
during the polymerization. The fraction of five- and six-membered rings cannot be
quantified separately yet in our case.
∗ Cyclopolymerization was studied by G. Butler and his coworkers in details. They established that
diallyl quaternary ammonium salts undergo radical polymerization to give linear saturated polymers, whereas monoally ammonium compounds failed to polymerize. Diallyldimethylammonium salts is as an example for a monomer, the polymerization of which procedes via cyclopoymerization.
Synthesis of Poly(vinylphosphonic acid)
41
PO3H2 PO
OHO
PO
OH
2 + H2O
R CH2
CH
P
CH2CH
PO
OOH
OOHR +
R CH2
CH
P
CH
PO
OOH
OOH
CH2
(a)
(b)
(c)
Dimer
Dimer
Scheme 3.6: Suggested mechanism of cyclopolymerization involving vinylphosphonic
acid anhydride.
The relative properties for reaction according pathway b and c will be evaluated from the
NMR spectra.
3.5.2 Reversible Addition-Fragmentation Chain Transfer (RAFT) Polymerization Methods for controlling the molecular weight and architecture in free radical
polymerization lead to the combination of the versatility of a radical process with the
Synthesis of Poly(vinylphosphonic acid)
42
ability to generate complex macromolecular architectures such as comb, star, and block
copolymers for use in different fields such as bioengineering and nanotechnology.48, 49
There exists a variety of living radical polymerization processes including atom transfer
radical polymerization (ATRP), nitroxide-mediated polymerization (NMP), and
reversible addition-fragmentation chain transfer (RAFT) polymerization.
Although the chemistry of these different methods varies considerably, a common
feature of them is their need to protect the majority of the growing polymer chains from
bimolecular termination reactions that normally occur in conventional free-radical
polymerization. Controlled radical polymerization processes rely upon protecting the
propagating species from bimolecular termination through its reversible trapping as
dormant species. The success of controlled radical polymerizations depends greatly upon
choosing control agents and reaction conditions such that there exists an optimal balance
between the rates of several competing reactions.50
Living radical polymerization mechanism is distinguished from the conventional
radical polymerization (Scheme 3.9a) by the existence of a reversible activation process.
The dormant chain P-X is supposed to be activated to the polymer radical P. by thermal
or photochemical stimuli. In the presence of monomer M, P. will undergo propagation
until it is deactivated back to P-X. If a living chain experiences the activation-
deactivation cycles frequently enough over a period of polymerization time, all living
chains will have a nearly equal chance to grow, yielding a low- polydispersity product.51
RAFT polymerization has received increasing attention since it is able to control
the polymerization of a variety of monomers without using a metal catalyst.52 The RAFT
process consists of the simple introduction of a small amount of chain transfer agent
Synthesis of Poly(vinylphosphonic acid)
43
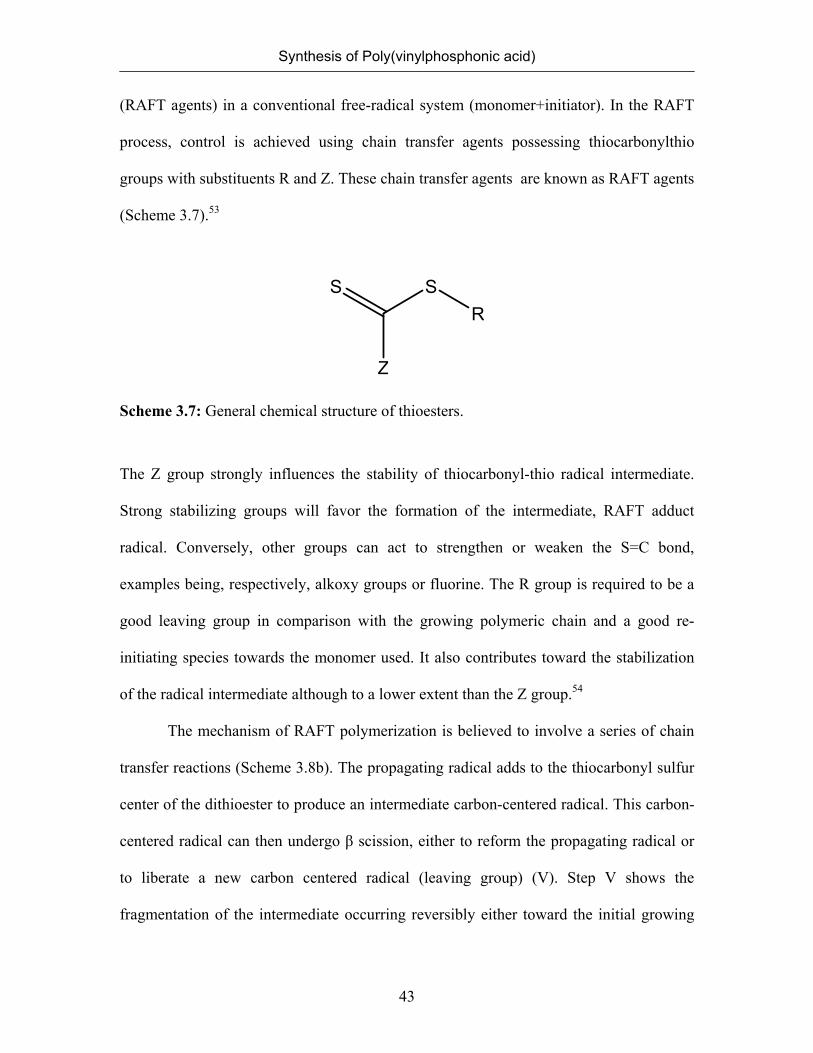
(RAFT agents) in a conventional free-radical system (monomer+initiator). In the RAFT
process, control is achieved using chain transfer agents possessing thiocarbonylthio
groups with substituents R and Z. These chain transfer agents are known as RAFT agents
(Scheme 3.7).53
SS
Z
R
Scheme 3.7: General chemical structure of thioesters.
The Z group strongly influences the stability of thiocarbonyl-thio radical intermediate.
Strong stabilizing groups will favor the formation of the intermediate, RAFT adduct
radical. Conversely, other groups can act to strengthen or weaken the S=C bond,
examples being, respectively, alkoxy groups or fluorine. The R group is required to be a
good leaving group in comparison with the growing polymeric chain and a good re-
initiating species towards the monomer used. It also contributes toward the stabilization
of the radical intermediate although to a lower extent than the Z group.54
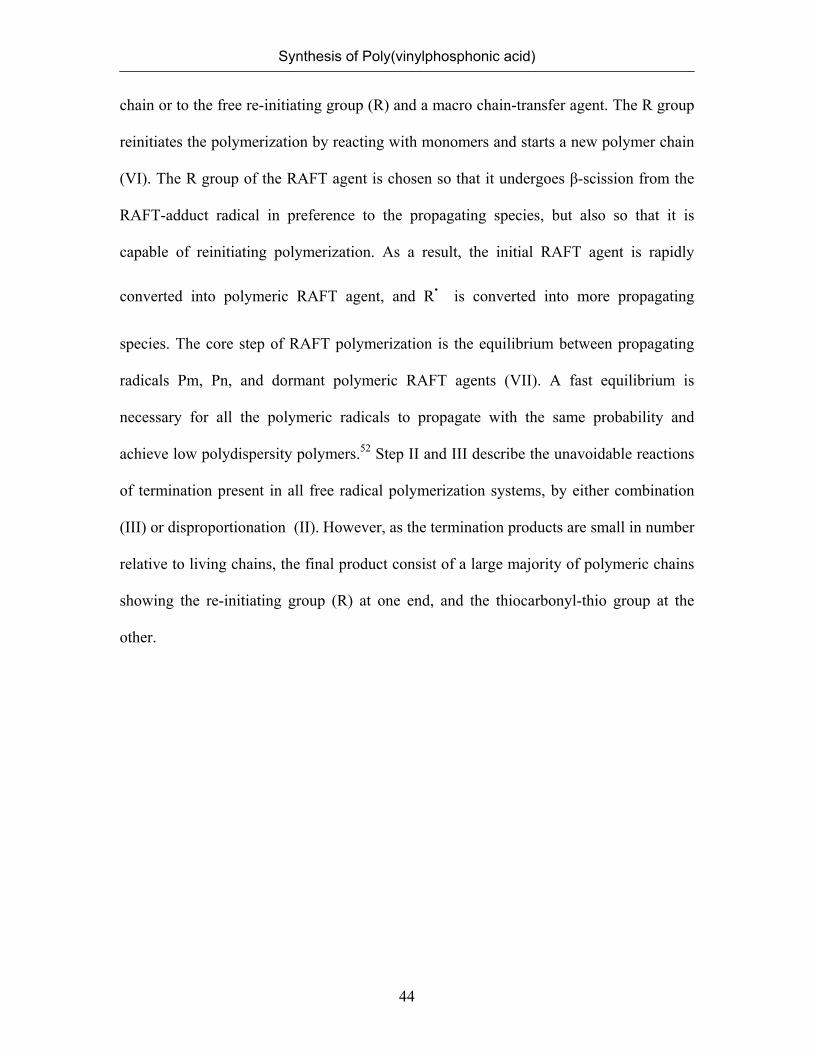
The mechanism of RAFT polymerization is believed to involve a series of chain
transfer reactions (Scheme 3.8b). The propagating radical adds to the thiocarbonyl sulfur
center of the dithioester to produce an intermediate carbon-centered radical. This carbon-
centered radical can then undergo β scission, either to reform the propagating radical or
to liberate a new carbon centered radical (leaving group) (V). Step V shows the
fragmentation of the intermediate occurring reversibly either toward the initial growing
Synthesis of Poly(vinylphosphonic acid)
44
chain or to the free re-initiating group (R) and a macro chain-transfer agent. The R group
reinitiates the polymerization by reacting with monomers and starts a new polymer chain
(VI). The R group of the RAFT agent is chosen so that it undergoes β-scission from the
RAFT-adduct radical in preference to the propagating species, but also so that it is
capable of reinitiating polymerization. As a result, the initial RAFT agent is rapidly
converted into polymeric RAFT agent, and R.
is converted into more propagating
species. The core step of RAFT polymerization is the equilibrium between propagating
radicals Pm, Pn, and dormant polymeric RAFT agents (VII). A fast equilibrium is
necessary for all the polymeric radicals to propagate with the same probability and
achieve low polydispersity polymers.52 Step II and III describe the unavoidable reactions
of termination present in all free radical polymerization systems, by either combination
(III) or disproportionation (II). However, as the termination products are small in number
relative to living chains, the final product consist of a large majority of polymeric chains
showing the re-initiating group (R) at one end, and the thiocarbonyl-thio group at the
other.
Synthesis of Poly(vinylphosphonic acid)
45
Initiator P1
Pn + M Pn+1
Pn + Pm Dn+m
kd ki
kp
kt,c
2II.
II.
III.
IV. Pn + Pm Dn
kt,d+ Dm
(a)
Initiator P1
Pn + M Pn+1
Pn + Pm Dn+m
kd ki
kp
kt,c
S S
Z
R
Pn +
S S
Z
RPn S S
Z
Pn
+ R
S S
Z
Pm
Pn +
S S
Z
PmPn S S
Z
Pn
+ Pmkβ k-β
k-β kβ
kβ,1
kβ,1
k−β,1
k−β,1
2I
R + M P1
VII.
VI.
V.
I.
II.
III.
IV. Pn + Pm Dn
kt,d+ Dm
(b)
Scheme 3.8: a) Basic mechanism of free radical polymerization54 b) General reversible
addition fragmentation chain transfer polymerization mechanism54.
Synthesis of Poly(vinylphosphonic acid)
46
3.5.2.1 Reversible Addition-Fragmentation Chain Transfer (RAFT) Polymerization
of Vinylphosphonic Acid and Its Dimethyl Ester
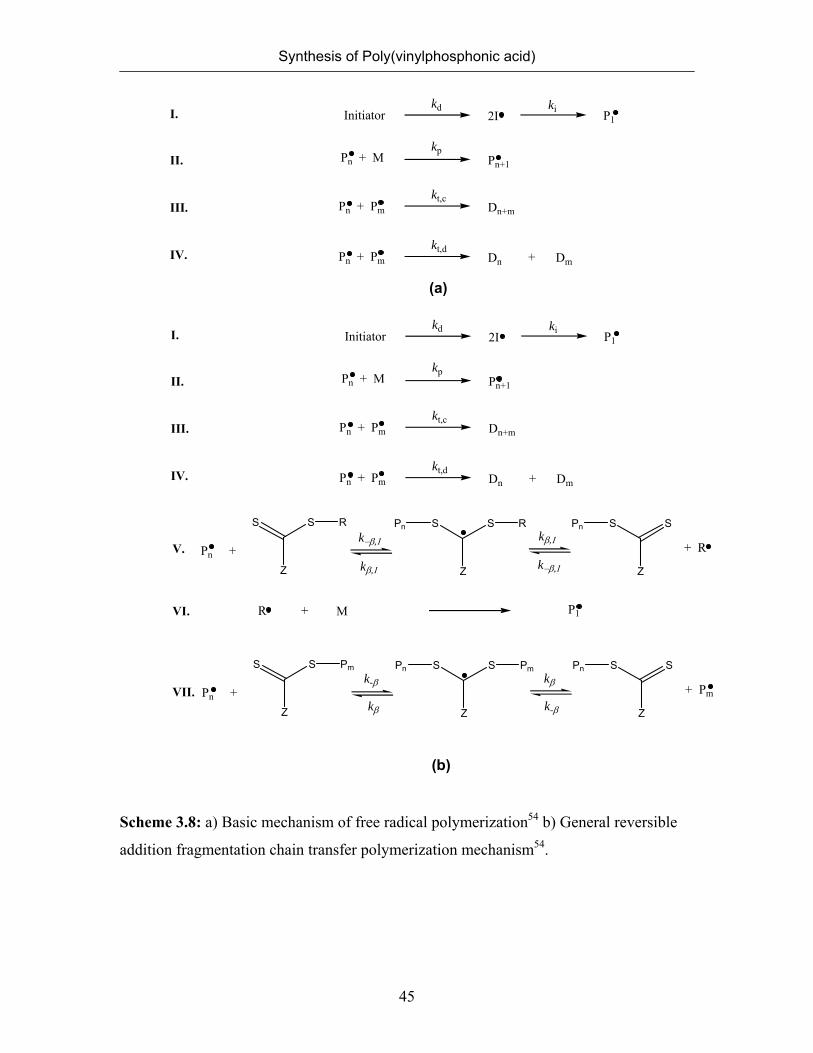
The polymerization of VPA acid and its dimethyl ester was investigated in the
presence of ethylxanthogenacetic acid (Scheme 3.9), which was used as the RAFT agent.
The Z group in this structure is O-Et. RAFT agents with an alkoxy group can also be
referred as xanthates.
O S
S
OH
O
Scheme 3.9: Chemical structure of ethylxanthogenacetic acid.
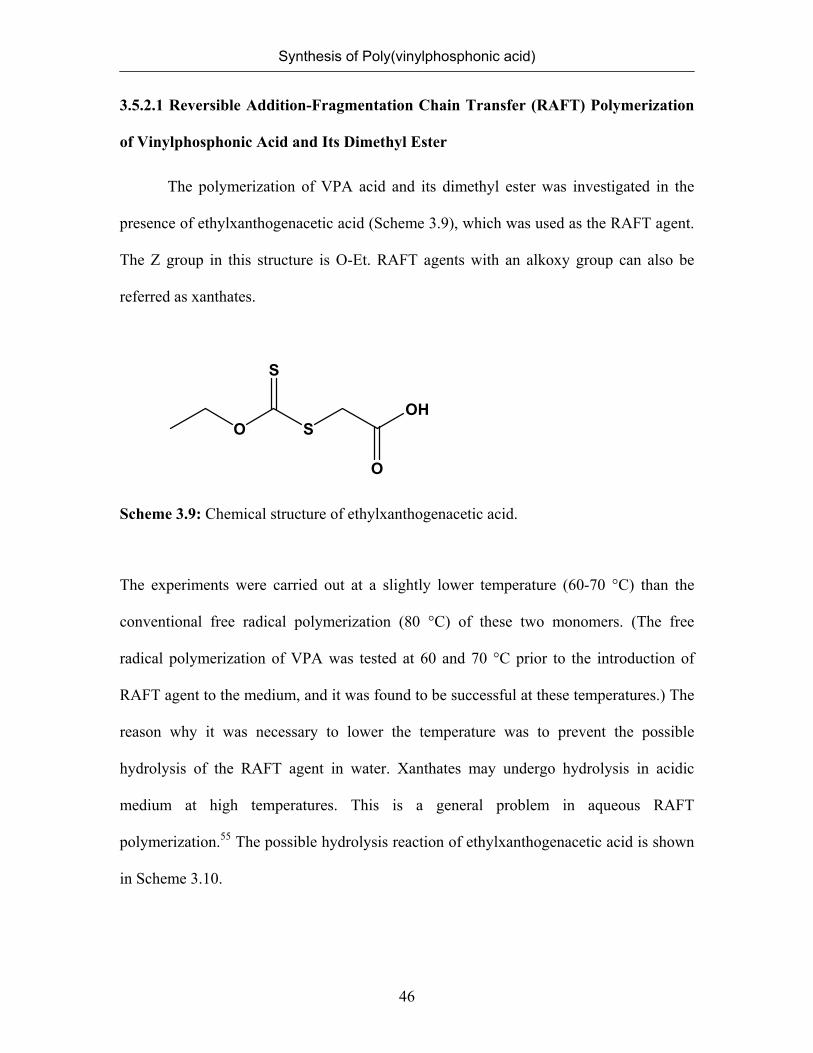
The experiments were carried out at a slightly lower temperature (60-70 °C) than the
conventional free radical polymerization (80 °C) of these two monomers. (The free
radical polymerization of VPA was tested at 60 and 70 °C prior to the introduction of
RAFT agent to the medium, and it was found to be successful at these temperatures.) The
reason why it was necessary to lower the temperature was to prevent the possible
hydrolysis of the RAFT agent in water. Xanthates may undergo hydrolysis in acidic
medium at high temperatures. This is a general problem in aqueous RAFT
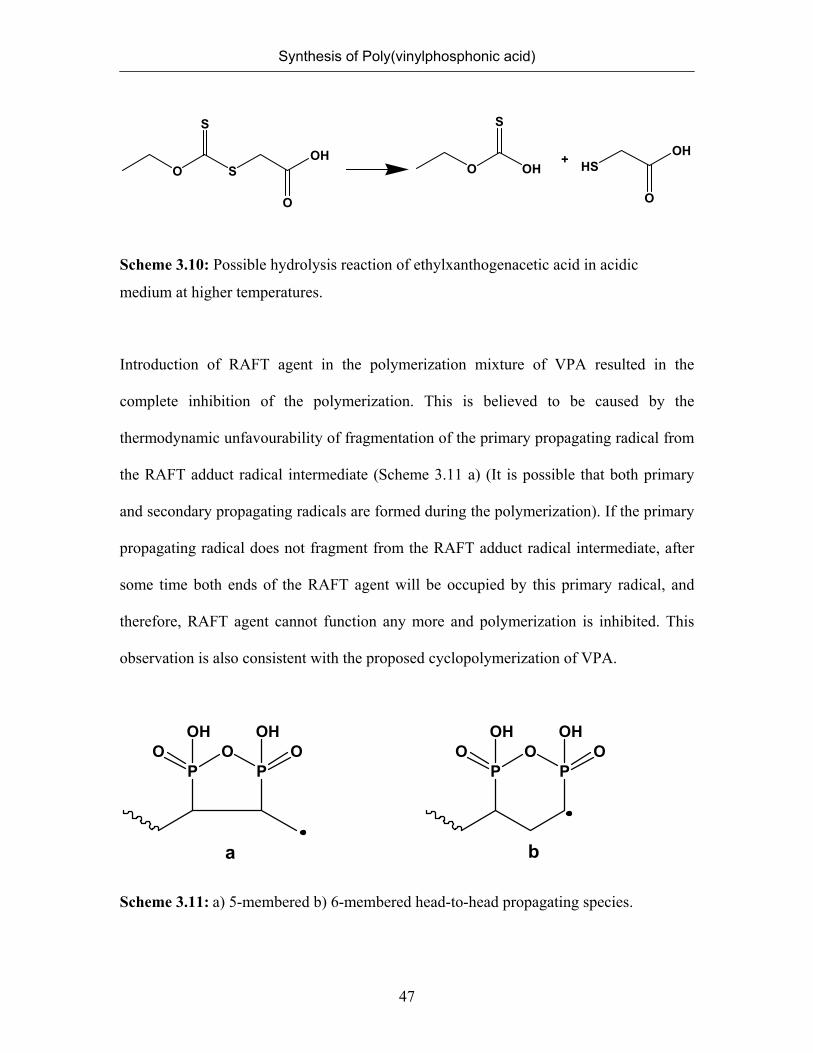
polymerization.55 The possible hydrolysis reaction of ethylxanthogenacetic acid is shown
in Scheme 3.10.
Synthesis of Poly(vinylphosphonic acid)
47
O S
S
OH
O
O OH
S
+ HSOH
O
Scheme 3.10: Possible hydrolysis reaction of ethylxanthogenacetic acid in acidic
medium at higher temperatures.
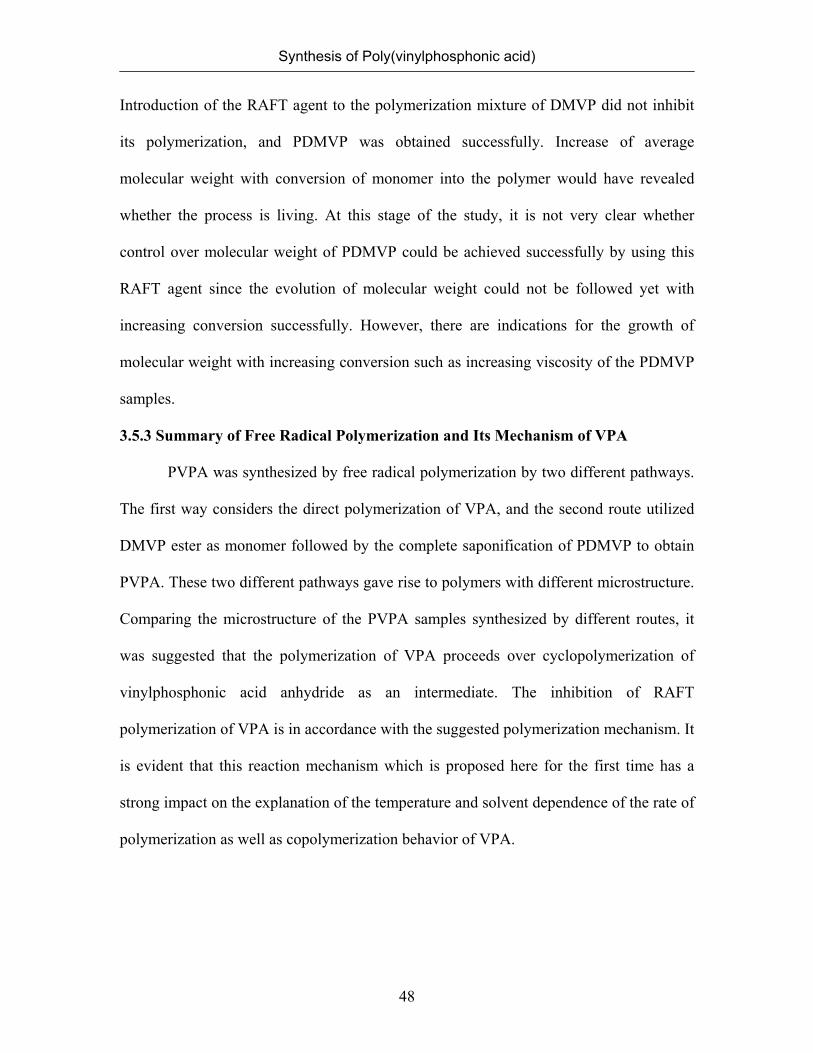
Introduction of RAFT agent in the polymerization mixture of VPA resulted in the
complete inhibition of the polymerization. This is believed to be caused by the
thermodynamic unfavourability of fragmentation of the primary propagating radical from
the RAFT adduct radical intermediate (Scheme 3.11 a) (It is possible that both primary
and secondary propagating radicals are formed during the polymerization). If the primary
propagating radical does not fragment from the RAFT adduct radical intermediate, after
some time both ends of the RAFT agent will be occupied by this primary radical, and
therefore, RAFT agent cannot function any more and polymerization is inhibited. This
observation is also consistent with the proposed cyclopolymerization of VPA.
PO O
OH
PO
OH
PO O
OH
PO
OH
a b
Scheme 3.11: a) 5-membered b) 6-membered head-to-head propagating species.
Synthesis of Poly(vinylphosphonic acid)
48
Introduction of the RAFT agent to the polymerization mixture of DMVP did not inhibit
its polymerization, and PDMVP was obtained successfully. Increase of average
molecular weight with conversion of monomer into the polymer would have revealed
whether the process is living. At this stage of the study, it is not very clear whether
control over molecular weight of PDMVP could be achieved successfully by using this
RAFT agent since the evolution of molecular weight could not be followed yet with
increasing conversion successfully. However, there are indications for the growth of
molecular weight with increasing conversion such as increasing viscosity of the PDMVP
samples.
3.5.3 Summary of Free Radical Polymerization and Its Mechanism of VPA
PVPA was synthesized by free radical polymerization by two different pathways.
The first way considers the direct polymerization of VPA, and the second route utilized
DMVP ester as monomer followed by the complete saponification of PDMVP to obtain
PVPA. These two different pathways gave rise to polymers with different microstructure.
Comparing the microstructure of the PVPA samples synthesized by different routes, it
was suggested that the polymerization of VPA proceeds over cyclopolymerization of
vinylphosphonic acid anhydride as an intermediate. The inhibition of RAFT
polymerization of VPA is in accordance with the suggested polymerization mechanism. It
is evident that this reaction mechanism which is proposed here for the first time has a
strong impact on the explanation of the temperature and solvent dependence of the rate of
polymerization as well as copolymerization behavior of VPA.
Synthesis of Poly(vinylphosphonic acid)
49
3.6 Polymerization of Acrylic Acid
Acrylic acid (AA) is one of the monomers that can only polymerize via free
radical mechanism. It can be polymerized by conventional free radical polymerization
with different initiation methods such as photoinitiation, 56, 57 redox initiation,58 thermal
initiation. Atactic PAA was prepared using conventional free radical initiators, whereas
photochemical polymerization of AA in ethanol solution at – 78 ˚C with sensitizing by
benzoins gave the syndiotactic form.
The sodium or ammonium salts of AA can be polymerized easily in water in the
presence of potassium persulfate at 30 °C.
Acrylic esters can be converted to their polymers in the presence of peroxide
catalyst at moderate temperatures. Additionally, alkyl acrylates can be polymerized to
high conversions in emulsion by activation with persulfate in the absence of air at 50 °C.
Long-chain alkyl ammonium salts or a long-chain alkyl sodium sulfate are suitable
emulsifiers.59
Polymers based on AA and its esters can also be synthesized by living ionic
polymerization in addition to the conventional free-radical polymerization. The
advantage of the living polymerization to the conventional radical polymerization is the
control of some key elements of macromolecular structures such as molecular weight,
polydispersity, chain architecture, and end functionality.
Monodisperse PAA was initially prepared by anionic polymerization of tert-buyl
acrylate followed by its hydrolysis, which leads to an isotactic crystalline polymer. Since
the advent of controlled radical polymerization, it is also possible to prepare PAA starting
from the monomer AA. Early works on controlled radical polymerization of AA showed
Synthesis of Poly(vinylphosphonic acid)
50
that this monomer is reluctant in both atom transfer radical polymerization ATRP), and
nitroxide mediated polymerization (NMP).60 With ATRP, some incompatibility with the
transition metal complex catalyst was suspected.61 With NMP, the acidic group was
proposed to be involved in side reactions with nitroxide. No mechanism was suggested
for these side reactions. Besides, unwanted chemical reactions, extremely high
propagation rate constant in free radical polymerization and rapid gelation62 are other
difficulties that may be encountered and may ruin the control of the polymerization.
Inspite of these challenges, synthesis of well defined homopolymers of AA was reported
in a small umber of publications when controlled radical polymerization was used.60
Polymerization of AA was found to be controlled with reversible addition fragmentation
transfer (RAFT). The first example homopolmerization of AA was performed in
dimethylformamide solution at 60 °C.63 Later Ladaviere was able to polymerize AA in
protic media64 (alcohol and water solution) by RAFT.
3.7 Polymerization of Vinyl Sulfonic Acid
Vinylsulfonic acid (VSA) can be polymerized by free radical polymerization.
Alderman and Hanford reported that VSA was polymerized in bulk very slowly to give a
soft, rubbery, dark-colored, water-soluble polymer upon initiation either by irradiation
with UV65 or using hydrogen peroxide.66 Jones and Barner claimed that VSA
polymerized readily if it was distilled in the absence of oxygen.67 Breslow and Hulse
prepared PVSA and found out that the polymerization proceeds readily in the presence of
UV light, hydrogen peroxide or potasium persulfate,68 whereas Overberger, Baldvin and
Gregore reported that VSA did not polymerize under the conditions used with radical and
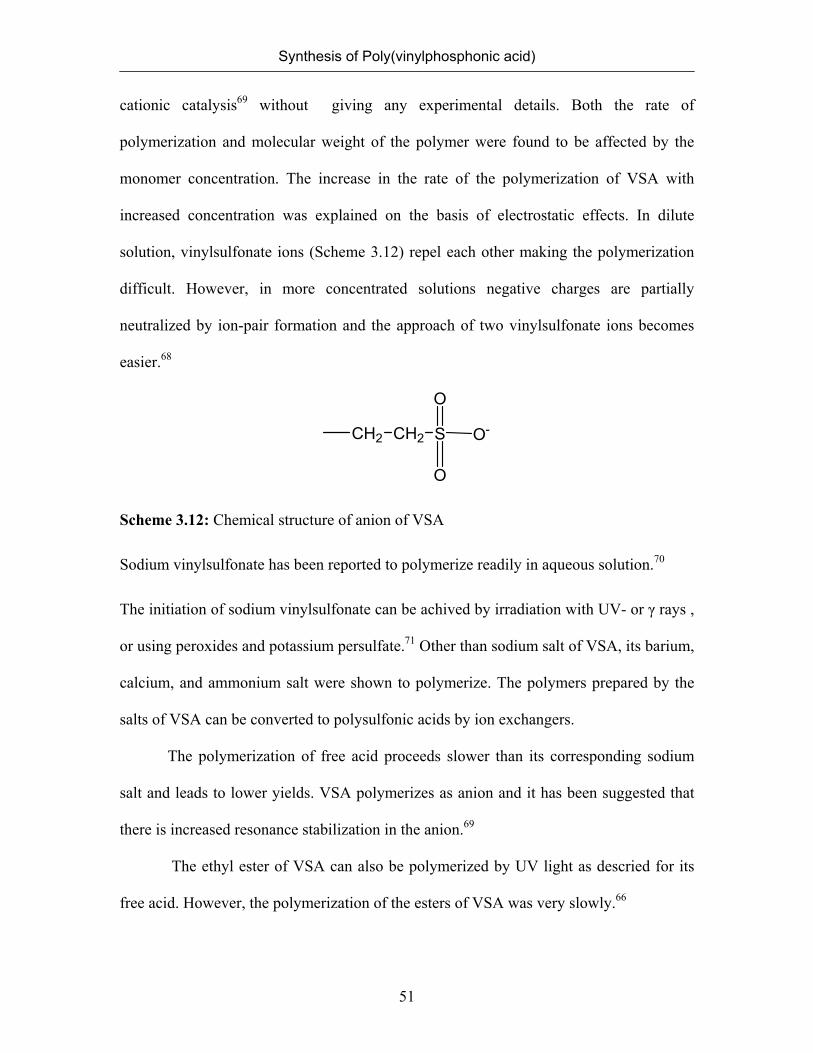
Synthesis of Poly(vinylphosphonic acid)
51
cationic catalysis69 without giving any experimental details. Both the rate of
polymerization and molecular weight of the polymer were found to be affected by the
monomer concentration. The increase in the rate of the polymerization of VSA with
increased concentration was explained on the basis of electrostatic effects. In dilute
solution, vinylsulfonate ions (Scheme 3.12) repel each other making the polymerization
difficult. However, in more concentrated solutions negative charges are partially
neutralized by ion-pair formation and the approach of two vinylsulfonate ions becomes
easier.68
CH2 CH2 S O-
O
O
Scheme 3.12: Chemical structure of anion of VSA
Sodium vinylsulfonate has been reported to polymerize readily in aqueous solution.70
The initiation of sodium vinylsulfonate can be achived by irradiation with UV- or γ rays ,
or using peroxides and potassium persulfate.71 Other than sodium salt of VSA, its barium,
calcium, and ammonium salt were shown to polymerize. The polymers prepared by the
salts of VSA can be converted to polysulfonic acids by ion exchangers.
The polymerization of free acid proceeds slower than its corresponding sodium
salt and leads to lower yields. VSA polymerizes as anion and it has been suggested that
there is increased resonance stabilization in the anion.69
The ethyl ester of VSA can also be polymerized by UV light as descried for its
free acid. However, the polymerization of the esters of VSA was very slowly.66
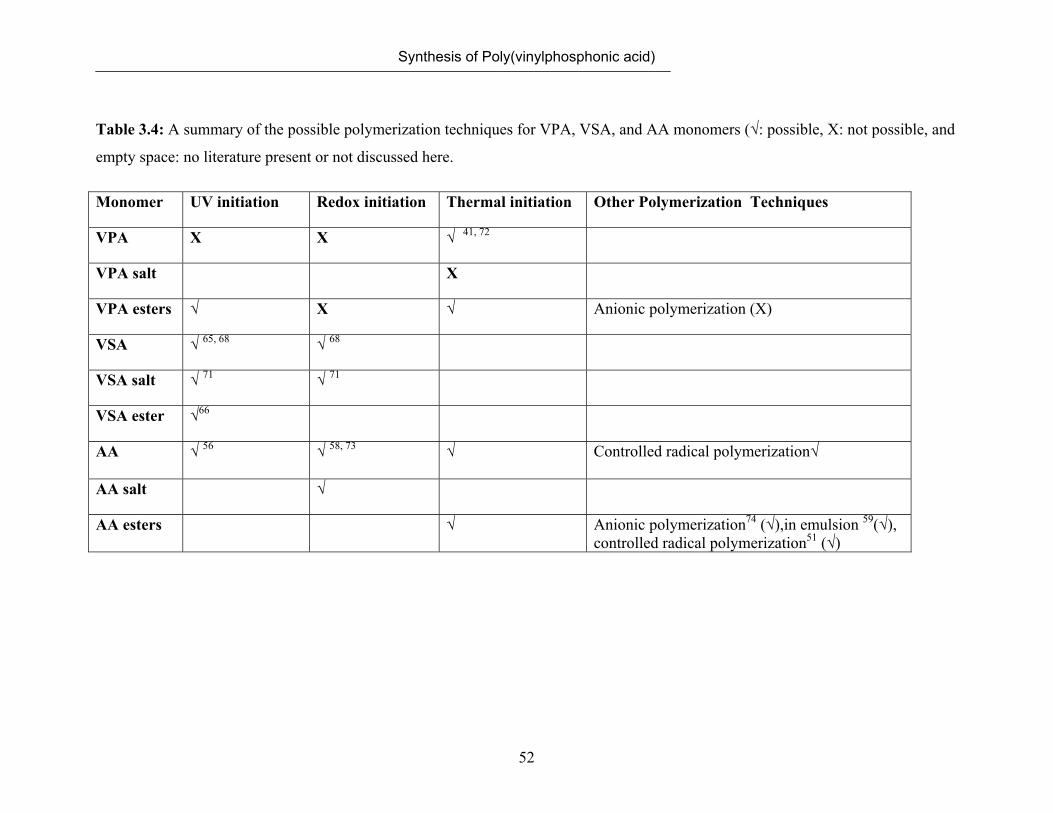
Synthesis of Poly(vinylphosphonic acid)
52
Table 3.4: A summary of the possible polymerization techniques for VPA, VSA, and AA monomers (√: possible, X: not possible, and
empty space: no literature present or not discussed here.
Monomer UV initiation Redox initiation Thermal initiation Other Polymerization Techniques
VPA X X √ 41, 72
VPA salt X
VPA esters √ X √ Anionic polymerization (X)
VSA √ 65, 68 √ 68
VSA salt √ 71 √ 71
VSA ester √66
AA √ 56 √ 58, 73 √ Controlled radical polymerization√
AA salt √
AA esters √ Anionic polymerization74 (√),in emulsion 59(√), controlled radical polymerization51 (√)
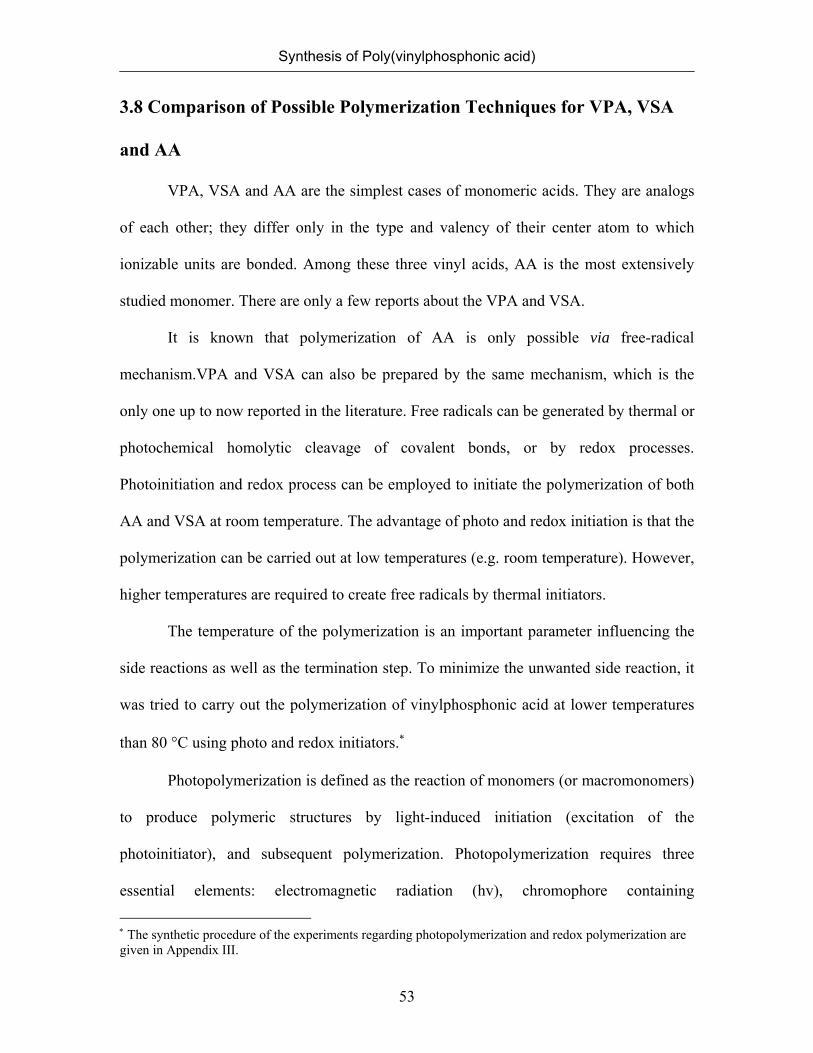
Synthesis of Poly(vinylphosphonic acid)
53
3.8 Comparison of Possible Polymerization Techniques for VPA, VSA
and AA
VPA, VSA and AA are the simplest cases of monomeric acids. They are analogs
of each other; they differ only in the type and valency of their center atom to which
ionizable units are bonded. Among these three vinyl acids, AA is the most extensively
studied monomer. There are only a few reports about the VPA and VSA.
It is known that polymerization of AA is only possible via free-radical
mechanism.VPA and VSA can also be prepared by the same mechanism, which is the
only one up to now reported in the literature. Free radicals can be generated by thermal or
photochemical homolytic cleavage of covalent bonds, or by redox processes.
Photoinitiation and redox process can be employed to initiate the polymerization of both
AA and VSA at room temperature. The advantage of photo and redox initiation is that the
polymerization can be carried out at low temperatures (e.g. room temperature). However,
higher temperatures are required to create free radicals by thermal initiators.
The temperature of the polymerization is an important parameter influencing the
side reactions as well as the termination step. To minimize the unwanted side reaction, it
was tried to carry out the polymerization of vinylphosphonic acid at lower temperatures
than 80 °C using photo and redox initiators.∗
Photopolymerization is defined as the reaction of monomers (or macromonomers)
to produce polymeric structures by light-induced initiation (excitation of the
photoinitiator), and subsequent polymerization. Photopolymerization requires three
essential elements: electromagnetic radiation (hv), chromophore containing
∗ The synthetic procedure of the experiments regarding photopolymerization and redox polymerization are given in Appendix III.
Synthesis of Poly(vinylphosphonic acid)
54
photoinitiators (PI), and monomers with unsaturated moieties such as a vinyl group.
Ultraviolet (UV: 190 ~ 400 nm) or visible light (Vis: 400 ~ 800 nm) can be used for
photopolymerization depending on the photoinitiator used. Photoinitiation involves
photon absorption, PI molecular excitation, and finally reactive fragment formation after
PI decomposition. The absorption of UV or Vis radiation can be considered to be a two-
step process, the first of which involves the electronic excitation. The lifetime of the
excited species (PI∗) is brief (10-8 to 10-9), and its existence is being terminated by
relaxation processes.75 The most common type of relaxation involves conversion of the
excitation energy to heat. Relaxation may occur by decomposition of PI∗ to form new
species such as radicals [I.] or ions [I+ / I-]. These fragments serve as direct initiators for
radical polymerization or anionic/cationic polymerization (Scheme 3.13).
PI + hv → PI∗ → PI (decay) (a)
PI + hv → PI∗ → [I.] or [I+ / I-] (b)
Scheme 3.13: Excitation of photoinitiators.
The photopolymerization of VPA was carried out with 2,2-dimethoxy-2-
phenylacetophenone as an initiator in methanol. 2,2-dimethoxy-2-phenylacetophenone
belongs to the Irgacure family, and has its maximum absorption at 365 nm. It is one of
the most frequently used photoinitiators.
Irradiation of 2,2-dimethoxy-2-phenylacetophenone results in the formation of
free radicals, which later initiate the polymerization (Scheme 3.14).
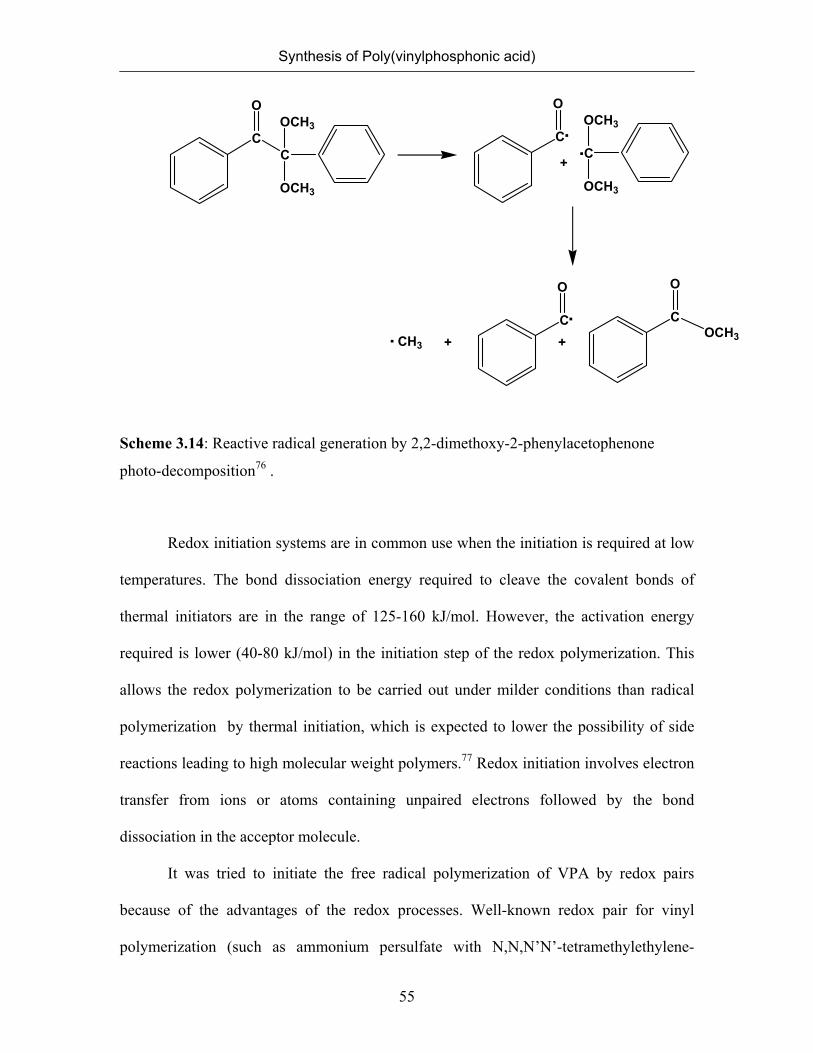
Synthesis of Poly(vinylphosphonic acid)
55
C
O
C
OCH3
OCH3
C
O
C
OCH3
OCH3
..
C
O
. COCH3
O
+
+
CH3. +
Scheme 3.14: Reactive radical generation by 2,2-dimethoxy-2-phenylacetophenone
photo-decomposition76 .
Redox initiation systems are in common use when the initiation is required at low
temperatures. The bond dissociation energy required to cleave the covalent bonds of
thermal initiators are in the range of 125-160 kJ/mol. However, the activation energy
required is lower (40-80 kJ/mol) in the initiation step of the redox polymerization. This
allows the redox polymerization to be carried out under milder conditions than radical
polymerization by thermal initiation, which is expected to lower the possibility of side
reactions leading to high molecular weight polymers.77 Redox initiation involves electron
transfer from ions or atoms containing unpaired electrons followed by the bond
dissociation in the acceptor molecule.
It was tried to initiate the free radical polymerization of VPA by redox pairs
because of the advantages of the redox processes. Well-known redox pair for vinyl
polymerization (such as ammonium persulfate with N,N,N’N’-tetramethylethylene-
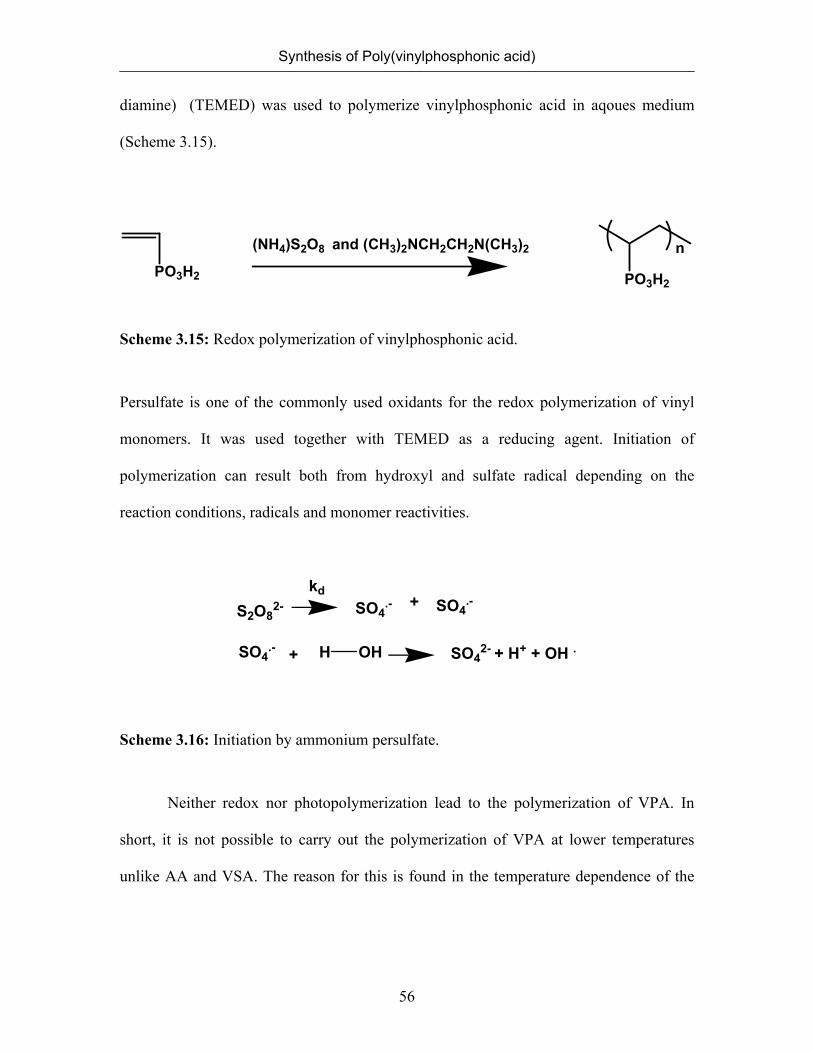
Synthesis of Poly(vinylphosphonic acid)
56
diamine) (TEMED) was used to polymerize vinylphosphonic acid in aqoues medium
(Scheme 3.15).
PO3H2
n (NH4)S2O8 and (CH3)2NCH2CH2N(CH3)2
PO3H2
Scheme 3.15: Redox polymerization of vinylphosphonic acid.
Persulfate is one of the commonly used oxidants for the redox polymerization of vinyl
monomers. It was used together with TEMED as a reducing agent. Initiation of
polymerization can result both from hydroxyl and sulfate radical depending on the
reaction conditions, radicals and monomer reactivities.
SO4.-+S2O8
2- SO4.-
kd
SO4.- + H OH SO4
2- + H+ + OH .
Scheme 3.16: Initiation by ammonium persulfate.
Neither redox nor photopolymerization lead to the polymerization of VPA. In
short, it is not possible to carry out the polymerization of VPA at lower temperatures
unlike AA and VSA. The reason for this is found in the temperature dependence of the
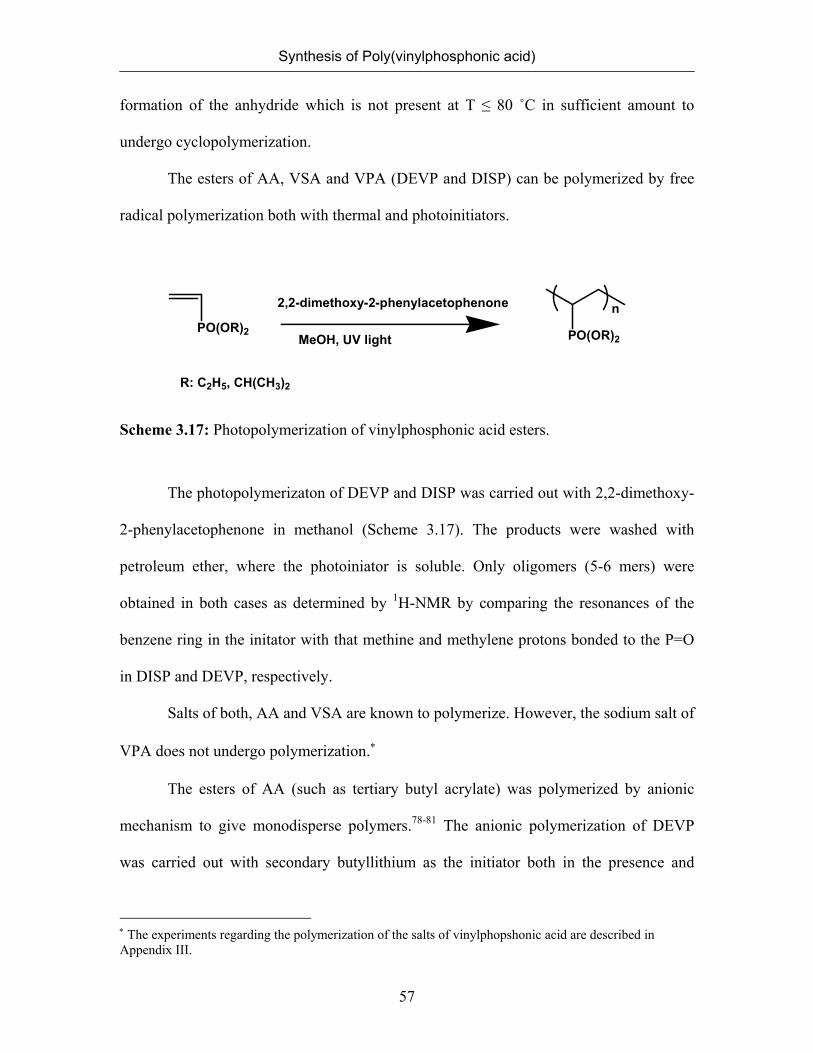
Synthesis of Poly(vinylphosphonic acid)
57
formation of the anhydride which is not present at T ≤ 80 ˚C in sufficient amount to
undergo cyclopolymerization.
The esters of AA, VSA and VPA (DEVP and DISP) can be polymerized by free
radical polymerization both with thermal and photoinitiators.
PO(OR)2
nPO(OR)2
2,2-dimethoxy-2-phenylacetophenone
MeOH, UV light
R: C2H5, CH(CH3)2
Scheme 3.17: Photopolymerization of vinylphosphonic acid esters.
The photopolymerizaton of DEVP and DISP was carried out with 2,2-dimethoxy-
2-phenylacetophenone in methanol (Scheme 3.17). The products were washed with
petroleum ether, where the photoiniator is soluble. Only oligomers (5-6 mers) were
obtained in both cases as determined by 1H-NMR by comparing the resonances of the
benzene ring in the initator with that methine and methylene protons bonded to the P=O
in DISP and DEVP, respectively.
Salts of both, AA and VSA are known to polymerize. However, the sodium salt of
VPA does not undergo polymerization.∗
The esters of AA (such as tertiary butyl acrylate) was polymerized by anionic
mechanism to give monodisperse polymers.78-81 The anionic polymerization of DEVP
was carried out with secondary butyllithium as the initiator both in the presence and
∗ The experiments regarding the polymerization of the salts of vinylphopshonic acid are described in Appendix III.
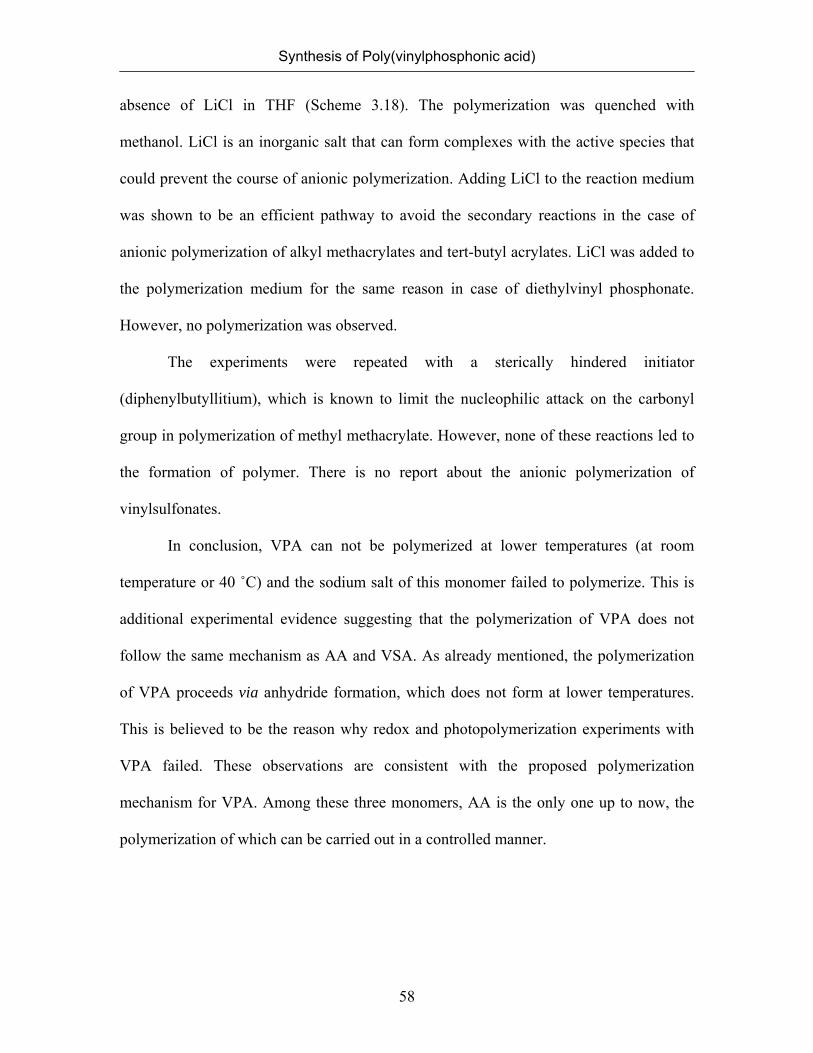
Synthesis of Poly(vinylphosphonic acid)
58
absence of LiCl in THF (Scheme 3.18). The polymerization was quenched with
methanol. LiCl is an inorganic salt that can form complexes with the active species that
could prevent the course of anionic polymerization. Adding LiCl to the reaction medium
was shown to be an efficient pathway to avoid the secondary reactions in the case of
anionic polymerization of alkyl methacrylates and tert-butyl acrylates. LiCl was added to
the polymerization medium for the same reason in case of diethylvinyl phosphonate.
However, no polymerization was observed.
The experiments were repeated with a sterically hindered initiator
(diphenylbutyllitium), which is known to limit the nucleophilic attack on the carbonyl
group in polymerization of methyl methacrylate. However, none of these reactions led to
the formation of polymer. There is no report about the anionic polymerization of
vinylsulfonates.
In conclusion, VPA can not be polymerized at lower temperatures (at room
temperature or 40 ˚C) and the sodium salt of this monomer failed to polymerize. This is
additional experimental evidence suggesting that the polymerization of VPA does not
follow the same mechanism as AA and VSA. As already mentioned, the polymerization
of VPA proceeds via anhydride formation, which does not form at lower temperatures.
This is believed to be the reason why redox and photopolymerization experiments with
VPA failed. These observations are consistent with the proposed polymerization
mechanism for VPA. Among these three monomers, AA is the only one up to now, the
polymerization of which can be carried out in a controlled manner.
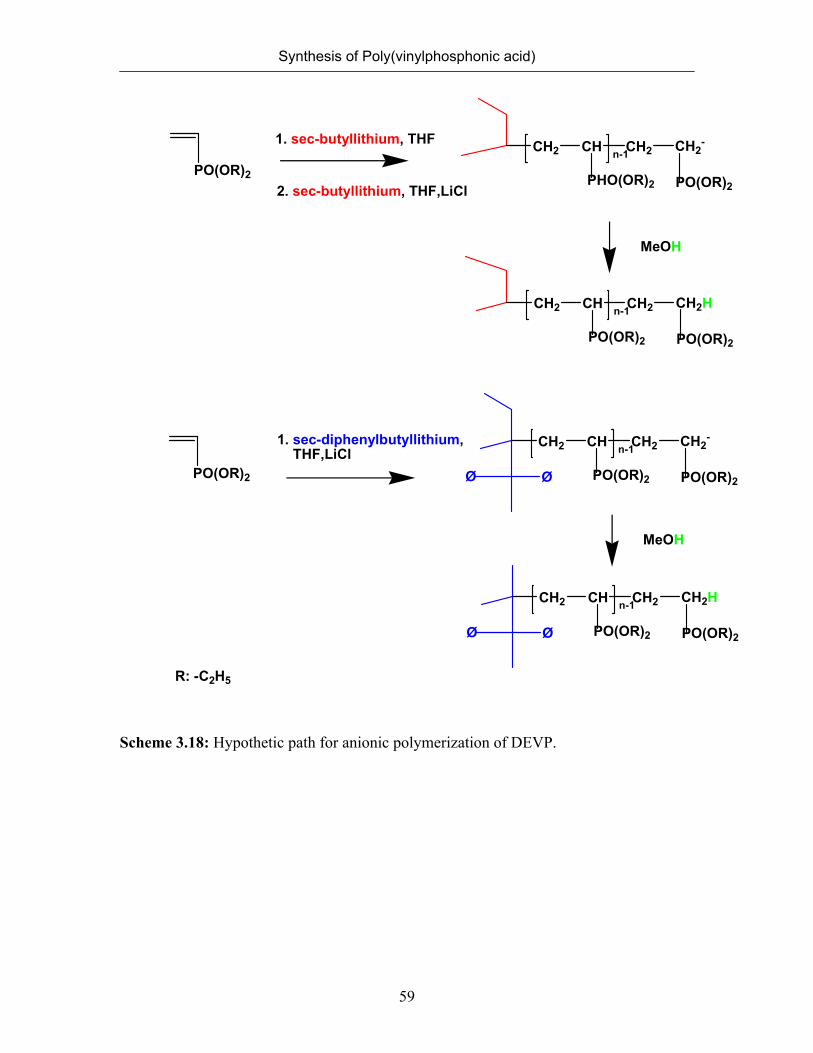
Synthesis of Poly(vinylphosphonic acid)
59
CH2 CH CH2
PHO(OR)2
MeOH
PO(OR)2
CH2-
n-11. sec-butyllithium, THF
2. sec-butyllithium, THF,LiCl
1. sec-diphenylbutyllithium, THF,LiCl
PO(OR)2
CH2 CH CH2
PO(OR)2 PO(OR)2
CH2Hn-1
PO(OR)2
CH2 CH CH2
PO(OR)2 PO(OR)2
CH2-
n-1
ØØ
MeOH
CH2 CH CH2
PO(OR)2 PO(OR)2
CH2Hn-1
ØØ
R: -C2H5
Scheme 3.18: Hypothetic path for anionic polymerization of DEVP.

CHAPTER 4
ACIDITY
4.1 Introduction
Polyelectrolytes are defined as macromolecules with ionizable groups in each
repeating unit. There are polyacids, polybases, and polyampholytes depending upon
whether the ionizable centers are cationic, anionic or whether a mixture of acidic and
basic groups occurs in the chain.
The polyelectrolytes can be distinguished by their behavior against pH variations.
Charged polymers are usually termed as strong polyelectrolyte when the charge amount
and its distribution along the polyelectrolyte are not sensitive to large pH variations and
depend only on the initial chemistry. The iogenic centers are completely dissociated into
ions. The number of elementary charges of a fully charged polyelectrolyte should be of
the same order as the number of monomeric units (degree of polymerization).82 They
remain fully charged over a wide pH range. Poly(diallyldimethylammoniumchloride),83
and PVSA84 may serve as examples for strong polyelectrolytes. On the other hand, when
the amount of charged sites varies as a function of pH, and therefore distribution of
ionization sites varies along the chain, the polymer is defined as a weak polyelectrolyte
such as PAA or poly(methacrylic acid). In other words, an equilibrium between
dissociated and nondissociated ionogenic∗ centers exists.
∗ able to create ions
Acidity
62
Polyelectrolytes exhibit properties related to their macromolecular as well as their
electrolyte nature. They behave like other macromolecules in their uncharged state.
However, perturbations appear upon charging. Their remarkable properties are due to the
interference between both types of properties. They have been the research interest of
many scientists due to their wide applications. Natural polyelectrolytes (mainly
polysaccharides) have been utilized for a long time as thickeners or gelling agents in
foods, pharmaceuticals, and cosmetics. Synthetic polyelectrolytes have been applied as
dispersants in latex particles. Polyelectrolytes are widely employed as water conditioners
and flocculating agents for the treatment of waste water.82
Weak polyacids and polybases are characterized by dissociation-association
equilibria in solution. The acid-base equilibria of weak polyelectrolytes in solutions have
been investigated for many decades.85
A carboxylic acid in aqueous solution dissociates as
COOH + H2O COO- + H3O+ (4.1)
Its dissociation constant, Ka, is expressed by
COOH)()OH)(COO( 3
−−
=+−
aK (4.2)
where parentheses denote the activity of each species. Often, however, the conventional
dissociation constant, K0, defined by
]COOH[]OH][COO[ 3
0 −−
=+−
K (4.3)

Acidity
63
is used instead of Ka since the activities of –COO- and –COOH are unknown, but only
their analytical concentrations [in brackets] are known. Therefore, K0 is not always a true
constant, while Ka must be.
The relation between pH and degree of ionization (α) for a carboxylic acid can be stated
by Henderson-Haselbach equation (Eq . (4.4)).
pH= pK0-log [(1-α)/α)] (4.4)
where the degree of ionization α is defined by
α = [-COO-] / [-COOH] + [-COO-] (4.5)
However, in the dissociation of polyelectrolytes an additional amount of work ΔGel is
required to remove the proton against the strong electrostatic forces of the charges
already present in the molecule. This requires the modification of the Henderson-
Haselbach equation (4.4) by,
pH= pK0-log [(1-α)/α)]+0.434ΔGel/RT (4.6)
where pK0 characterizes a monocarboxylic analogue of the polymer and ΔGel is expressed
in terms of electrostatic potential (ψ )
ΔGel=e ψ (4.7)
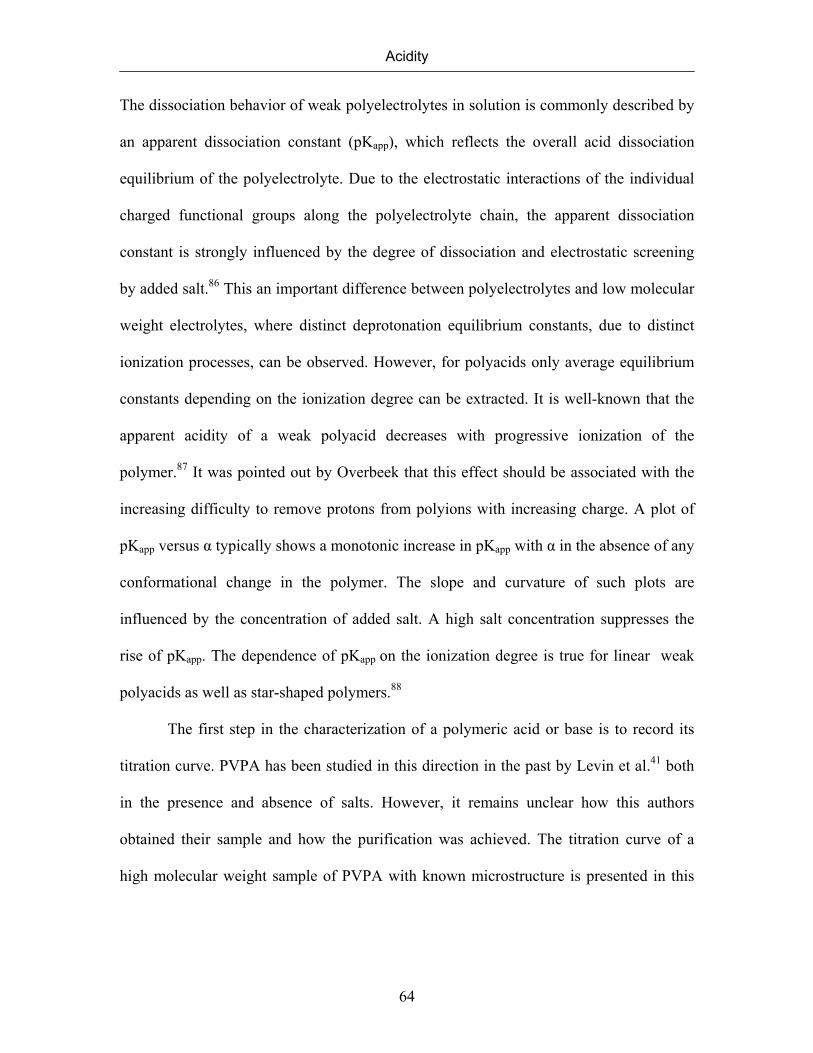
Acidity
64
The dissociation behavior of weak polyelectrolytes in solution is commonly described by
an apparent dissociation constant (pKapp), which reflects the overall acid dissociation
equilibrium of the polyelectrolyte. Due to the electrostatic interactions of the individual
charged functional groups along the polyelectrolyte chain, the apparent dissociation
constant is strongly influenced by the degree of dissociation and electrostatic screening
by added salt.86 This an important difference between polyelectrolytes and low molecular
weight electrolytes, where distinct deprotonation equilibrium constants, due to distinct
ionization processes, can be observed. However, for polyacids only average equilibrium
constants depending on the ionization degree can be extracted. It is well-known that the
apparent acidity of a weak polyacid decreases with progressive ionization of the
polymer.87 It was pointed out by Overbeek that this effect should be associated with the
increasing difficulty to remove protons from polyions with increasing charge. A plot of
pKapp versus α typically shows a monotonic increase in pKapp with α in the absence of any
conformational change in the polymer. The slope and curvature of such plots are
influenced by the concentration of added salt. A high salt concentration suppresses the
rise of pKapp. The dependence of pKapp on the ionization degree is true for linear weak
polyacids as well as star-shaped polymers.88
The first step in the characterization of a polymeric acid or base is to record its
titration curve. PVPA has been studied in this direction in the past by Levin et al.41 both
in the presence and absence of salts. However, it remains unclear how this authors
obtained their sample and how the purification was achieved. The titration curve of a
high molecular weight sample of PVPA with known microstructure is presented in this
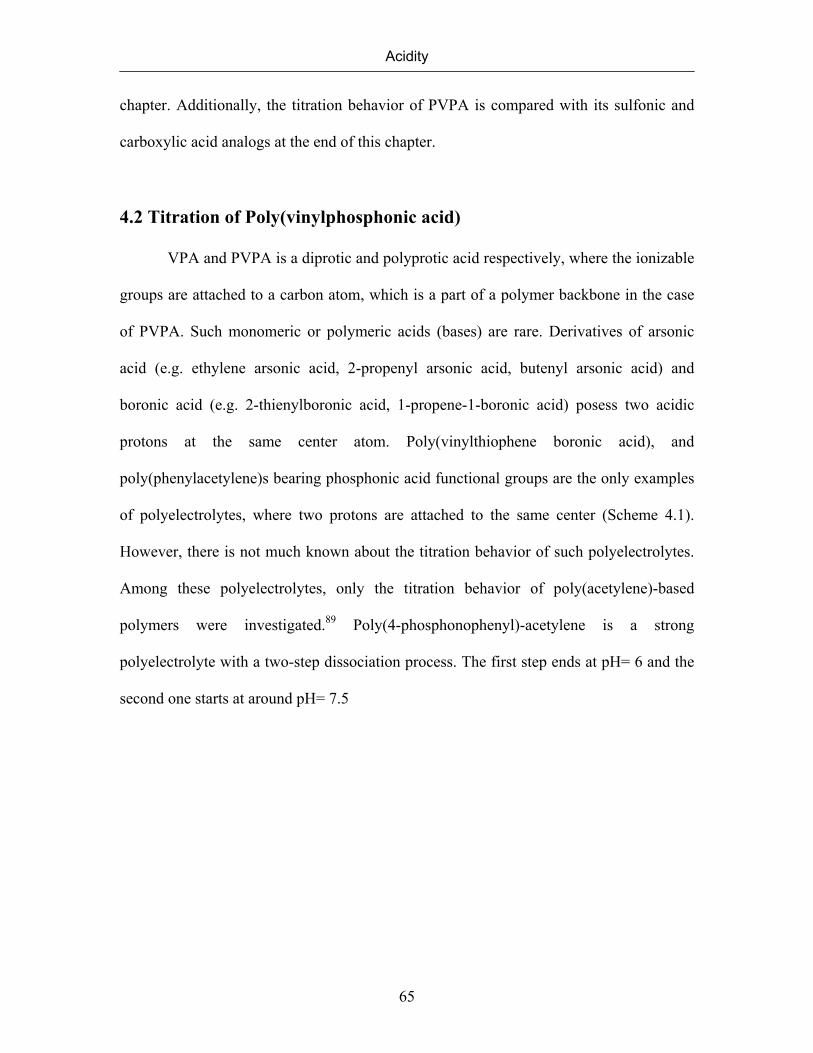
Acidity
65
chapter. Additionally, the titration behavior of PVPA is compared with its sulfonic and
carboxylic acid analogs at the end of this chapter.
4.2 Titration of Poly(vinylphosphonic acid)
VPA and PVPA is a diprotic and polyprotic acid respectively, where the ionizable
groups are attached to a carbon atom, which is a part of a polymer backbone in the case
of PVPA. Such monomeric or polymeric acids (bases) are rare. Derivatives of arsonic
acid (e.g. ethylene arsonic acid, 2-propenyl arsonic acid, butenyl arsonic acid) and
boronic acid (e.g. 2-thienylboronic acid, 1-propene-1-boronic acid) posess two acidic
protons at the same center atom. Poly(vinylthiophene boronic acid), and
poly(phenylacetylene)s bearing phosphonic acid functional groups are the only examples
of polyelectrolytes, where two protons are attached to the same center (Scheme 4.1).
However, there is not much known about the titration behavior of such polyelectrolytes.
Among these polyelectrolytes, only the titration behavior of poly(acetylene)-based
polymers were investigated.89 Poly(4-phosphonophenyl)-acetylene is a strong
polyelectrolyte with a two-step dissociation process. The first step ends at pH= 6 and the
second one starts at around pH= 7.5
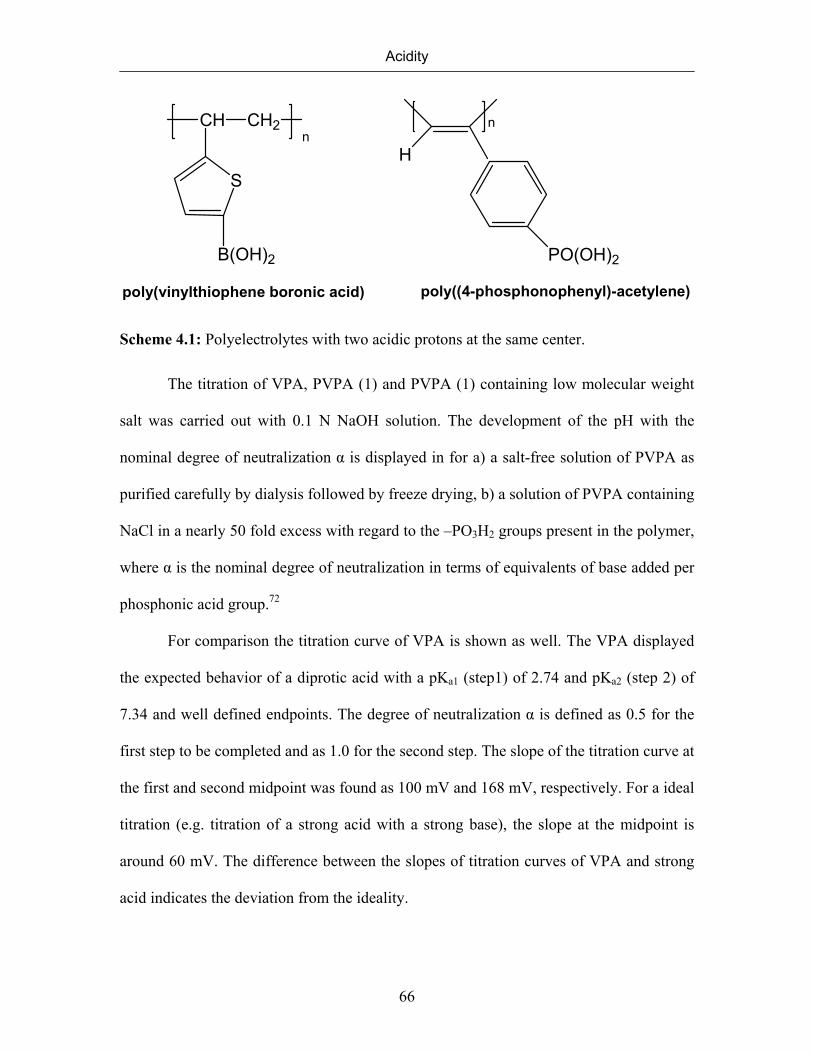
Acidity
66
S
CH CH2
B(OH)2
n
poly(vinylthiophene boronic acid)
PO(OH)2
H
n
poly((4-phosphonophenyl)-acetylene)
Scheme 4.1: Polyelectrolytes with two acidic protons at the same center.
The titration of VPA, PVPA (1) and PVPA (1) containing low molecular weight
salt was carried out with 0.1 N NaOH solution. The development of the pH with the
nominal degree of neutralization α is displayed in for a) a salt-free solution of PVPA as
purified carefully by dialysis followed by freeze drying, b) a solution of PVPA containing
NaCl in a nearly 50 fold excess with regard to the –PO3H2 groups present in the polymer,
where α is the nominal degree of neutralization in terms of equivalents of base added per
phosphonic acid group.72
For comparison the titration curve of VPA is shown as well. The VPA displayed
the expected behavior of a diprotic acid with a pKa1 (step1) of 2.74 and pKa2 (step 2) of
7.34 and well defined endpoints. The degree of neutralization α is defined as 0.5 for the
first step to be completed and as 1.0 for the second step. The slope of the titration curve at
the first and second midpoint was found as 100 mV and 168 mV, respectively. For a ideal
titration (e.g. titration of a strong acid with a strong base), the slope at the midpoint is
around 60 mV. The difference between the slopes of titration curves of VPA and strong
acid indicates the deviation from the ideality.

Acidity
67
Crofts and Kosolapoff have investigated the dissociation constants of
alkylphosphonic acids.90 The dissociation constants of VPA can be compared with those
of alkylphosphonic acid with the same number of carbon atoms, namely ethylphosphonic
acid. The first and second dissociation constants of ethylphosphonic acid were found as
2.43 and 8.05, respectively indicating that the first proton of ethylphosphonic acid is
easier to dissociate than that of VPA.
Contrary to the monomer, the polymer obtained by its free radical polymerization
in its purified form shows an almost linear increase of pH with α up to the nominal
degree of neutralization of 0.5, followed by an asymptotic approach of pH to its limiting
value at α = 1.0. A clear endpoint cannot be identified. Addition of excess NaCl during
titration results in a significant change of the titration curve. Again, a clear endpoint
cannot be discerned, but the absolute value of pH at any given α is considerably smaller
(up to α≤ 0.8) as compared to the salt-free polymer indicating a substantial buffer effect.
Our titration curve in the presence of excess NaCl resembles the one found in the
literature,41 which had been described as “pure”. Figure 4.1 compares our results with
those by Levin. We conclude that the experiment described by Levine41 et al. were
probably carried out for a sample which still contained much neutral salt.
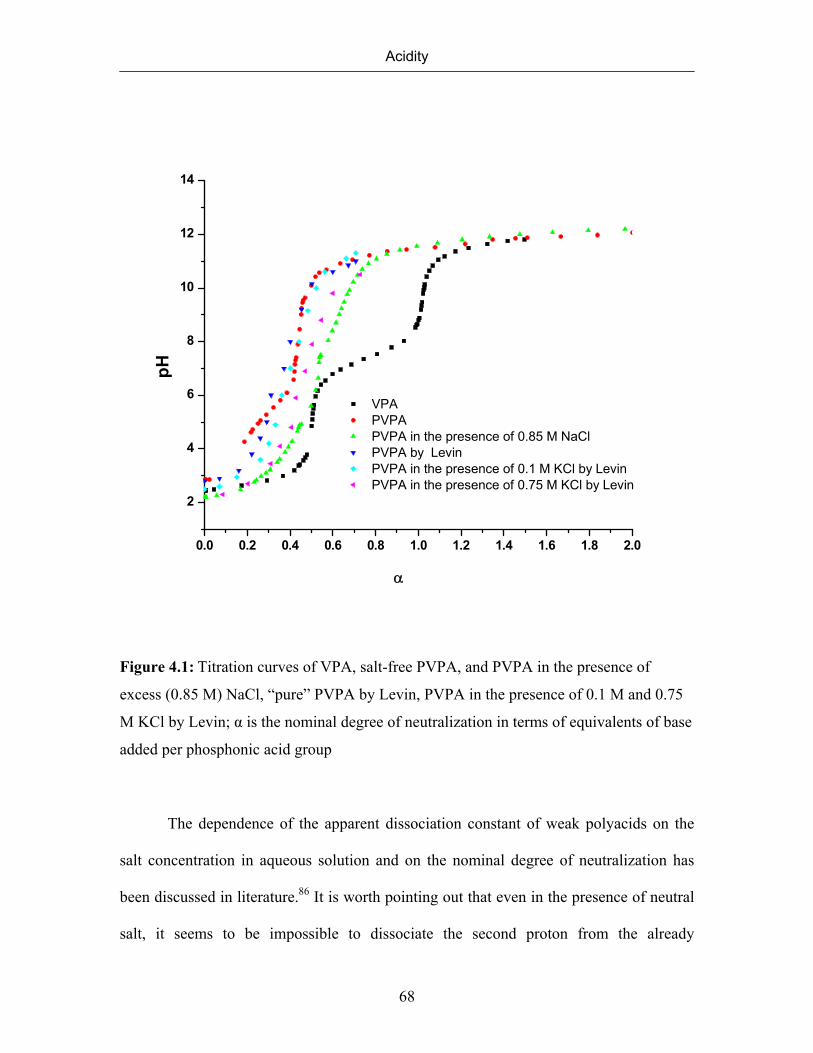
Acidity
68
0.0 0.2 0.4 0.6 0.8 1.0 1.2 1.4 1.6 1.8 2.0
2
4
6
8
10
12
14
α
pH
VPA PVPA PVPA in the presence of 0.85 M NaCl PVPA by Levin PVPA in the presence of 0.1 M KCl by Levin PVPA in the presence of 0.75 M KCl by Levin
Figure 4.1: Titration curves of VPA, salt-free PVPA, and PVPA in the presence of
excess (0.85 M) NaCl, “pure” PVPA by Levin, PVPA in the presence of 0.1 M and 0.75
M KCl by Levin; α is the nominal degree of neutralization in terms of equivalents of base
added per phosphonic acid group
The dependence of the apparent dissociation constant of weak polyacids on the
salt concentration in aqueous solution and on the nominal degree of neutralization has
been discussed in literature.86 It is worth pointing out that even in the presence of neutral
salt, it seems to be impossible to dissociate the second proton from the already
Acidity
69
deprotonated phosphonic acid groups in the polymer for electrostatic reasons and
consequently PVPA behaves more like a monoprotic acid. Shortly, PVPA exhibits the
characteristic features of polyelectrolytes in solution, which can be deduced from
evaluation of its titration behavior.
4.3 Titration of Poly (acrylic acid)
The potentiometric titration of PAA has been studied over a range of salt and
polymer concentrations from both, experimental and theoretical points of view since it is
the simplest common synthetic polycarboxylic acid.74, 86, 87, 91-93 The study of the solution
behavior of PAA in its partially or fully ionized form has a profound importance from the
theoretical viewpoint since it is widely used as a model of ‘normal’ behavior to be
expected from the polyelectrolytes in general.
The titration curve of PAA and PAA in the presence of a neutral salt is presented
in Figure 4.2. For comparison, titration curve of AA is also shown. AA is a monoprotic
acid with pKa of 4. 76 and has a well defined endpoint.72 The titration curves of PAA
differ considerably from the monomeric acid. It is apparent that the electrostatic
interactions play an important role in the solution behavior of PAA. Titration curve of
PAA demonstrates that the acidity of the polymeric acid decreases continuously upon
neutralization.
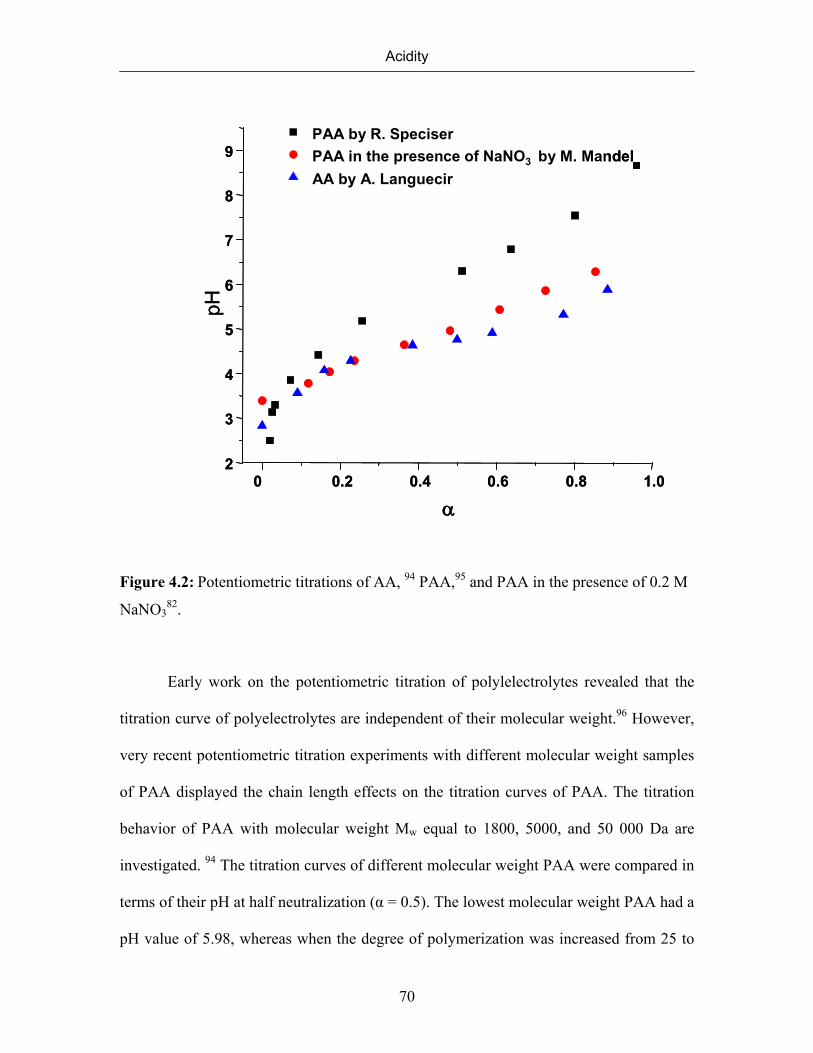
Acidity
70
0 0.2 0.4 0.6 0.8 1.02
3
4
5
6
7
8
9PAA by R. SpeciserPAA in the presence of NaNO3 by M. MandelAA by A. Languecir
pH
α0 0.2 0.4 0.6 0.8 1.0
2
3
4
5
6
7
8
9PAA by R. SpeciserPAA in the presence of NaNO3 by M. MandelAA by A. Languecir
pH
α
Figure 4.2: Potentiometric titrations of AA, 94 PAA,95 and PAA in the presence of 0.2 M
NaNO382.
Early work on the potentiometric titration of polylelectrolytes revealed that the
titration curve of polyelectrolytes are independent of their molecular weight.96 However,
very recent potentiometric titration experiments with different molecular weight samples
of PAA displayed the chain length effects on the titration curves of PAA. The titration
behavior of PAA with molecular weight Mw equal to 1800, 5000, and 50 000 Da are
investigated. 94 The titration curves of different molecular weight PAA were compared in
terms of their pH at half neutralization (α = 0.5). The lowest molecular weight PAA had a
pH value of 5.98, whereas when the degree of polymerization was increased from 25 to
Acidity
71
700, the pH value went up to 6.62 at α= 0.5. The PAA sample with 70 repeating units had
a pH of 6.36 at α equal to 0.5. However, it is difficult to understand why there should be
such a strong dependence on the molecular weight.
The titration curve of PAA (5.5x10⁻³ M) in the presence of a low molar mass
electrolyte (0.2 M NaNO3) is shown in Figure 4.2.82 The titration of PAA in the presence
of sodium nitrate shows the absence of a buffer region and a monotonous increase of the
pH with increasing degree of dissociation. In other words, the logarithm of the apparent
dissociation constant, pKapp increases steadily with ionization degree. This continuous
increase in pKapp explains the absence of a buffering effect. Additional work is required
to transfer the proton from the newly formed polyion to the bulk against the attraction of
the negatively charged polyion. As the concentration of low molecular weight salt was
increased, the increase in pKapp was suppressed implying the possibility of a higher
number of protons to be dissociated as expected due to the electrostatic screening.87
4.4 Titration of Poly (vinylsulfonic acid)
PVSA is the simplest strong polyacid. It is a polymer with interesting features
from the scientific viewpoint. For instance, it can be regarded as a model compound for
naturally occurring sulfuric acid esters of polysaccharides as well as a model for ion
exchangers.70
Potentiometric measurements proved that PVSA displays a titration behavior
which is entirely analogous to strong acids such as hydrochloric acid apart from the low
activity coefficients of the protons due to the electrostatic potential of the
macromolecule.65 Figure 4.3 presents the titration behavior of PVSA both in the presence
Acidity
72
and absence of salt, as well as titration behavior of hydrochloric acid and ethanesulfonic
acid for comparison. Hydrochloric acid and ethanesulfonic acid are strong acids and their
titration curves display the expected increase in pH with increasing degree of
neutralization.The titration curves of PVSA in the presence and absence of NaCl are
parallel to each other. Addition of NaCl (0.1 M) screens the large electrostatic potential
off leading to a decrease in pH value. All points determined in the polyelectrolyte
titration in the presence of low molecular weight salts lie on the HCl titration curve. In
other words, the titration curve of PVSA in the presence of salts resembles to the titration
curve of low molecular weight acids. 97 A straight line with slope of 1 was obtained upon
plotting pH versus the logarithm of (1-α)/α for ethanesulfonic acid and PVSA. This
indicates that the dissociation constant of PVPA stays constant along the whole
concentration regime as in the case of ethanesulfonic acid. These results are strange and
contradictory to the contribution of ΔGel to the titration behavior. As already indicated in
section 4.1, additional amount of work (ΔGel) is necessary to remove proton against the
strong electrostatic forces of the charges already present in the molecule. Therefore, the
titration curves of PVPA in the presence of a neutral salt cannot overlap with that of HCl.
The results present in the literature regarding the titration behavior of PVSA indicates
that PVSA samples used for titrations contain some low molecular weight species as
impurities. The low molecular species may be the rests of monomer or salts, which could
not be removed entirely during the purification step. Eisenberg and his coworkers
purified the PVSA by dialysis after polymerization of VSA. Kern et. al. polymerized
sodium salt of VSA and converted the polymer to its free acid form by addition of HCl,
the precipitate, NaCl, was removed from the medium by dialysis. However, complete

Acidity
73
removal of salts from polyelectrolytes is very difficult. Shortly, bearing the purification
steps used to obtain PVSA and the contribution of of ΔGel to the titration behavior, the
titration curves of PVSA were obtained with polymers of low purity.
0.0 0.2 0.4 0.6 0.8 1.00
2
4
6
8
10
pH
α
ethanesulfonic acid polyvinylsulfonic acid by Kern polyvinylsulfonic acid by Eisenberg polyvinylsulfonic acid in the presence of NaCl by Eisenberg HCl
Figure 4.3: Potentiometric titrations of ethanesulfonic acid, and PVSA by different
authors, and PVSA in the presence of NaCl65, 97, and HCl; α is the nominal degree of
neutralization in terms of equivalents of base added per sulfonic acid group.

Acidity
74
4.5 Comparison of titration behavior of PVPA, PVSA, and AA
PVPA, PAA, and PVSA are the simplest cases of polyacids. They are analogs of
each other (Scheme 4.2). They all exhibit the characteristic features of polyelectrolytes in
their aqueous solutions. PVPA and PAA are weak polyelectrolytes, whereas PVSA is a
strong polyacid. Therefore, the complications such as partial ionization that is
encountered with PAA, and PVPA do not arise in the case of PVSA.70, 97
PO3H2 CO2H SO3H
a b c
Scheme 4.2: Chemical structures of a) VPA b) AA c) VSA
One can compare the acidity of VPA with that of AA by the help of their
dissociation constants. VPA (pKa1=2.74) is a stronger acid than AA (pKa=4.76). Their
polymeric forms are similar in that their acidity decreases continuously upon increasing
degree of neutralization, which can be followed by a monotonous increase of pH. There
is a remarkable difference between their monomeric and polymeric forms in their pH
value at half-neutralization (α= 0.5). The difference in pH between VPA and its
homopolymer is 4.49 at α= 0.5, whereas this difference in the case of PAA ranges from
1.22 to 1.86 depending on the molecular weight of the polymer. This difference was
suppressed by the addition of excess low molecular weight salt to the medium to 0.13 in
the case of PVPA and the absolute value of pH at any given α is considerably smaller (up
to α≤ 0.8) as compared to the salt-free polymer indicating a substantial buffer effect.
Acidity
75
PAA displayed a similar behavior upon addition of neutral salt, the difference in the pH
between AA and PAA was decreased to 0.44 at α= 0.5. However, the addition of neutral
salts did not lead to the observation of well-defined end-points neither in PVPA nor in
PAA.
PVSA is a much stronger acid compared to both PVPA, and PAA. The
dissociation behavior of PVSA cannot be compared with those of PVPA, and PAA.
Upon titration, there are two possibilities about the placement of dissociated protons. It is
possible that these protons are still in the attraction sphere of the polyanion or they can
diffuse to the solution. This is valid for PVPA, PAA, and PVPA. It is difficult to exclude
one of the possibilities. There might be some of protons in the attraction sphere of the
polyion, and the rest in the solution. In case of PVSA, more protons should be localized
in the dilute solution than in the vicinity of the polyion. However, it is known that the
number of sodium ions of the sodium of polyacrylate is very low in the solution.70
Therefore, it can also be expected that the number of protons will be much higher in the
close vicinity than in the solution for PAA, and PVPA in contrast to PVSA. Additionally,
the titration curves of PVSA are contradictory to the contribution of ΔGel to the titration
behavior.
As a conclusion, the titration behavior of high molecular weight PVPA with
known microstructure was investigated by potentiometric titration. These results were
compared with the titration behavior of PAA, and PVSA, which were already
documented.

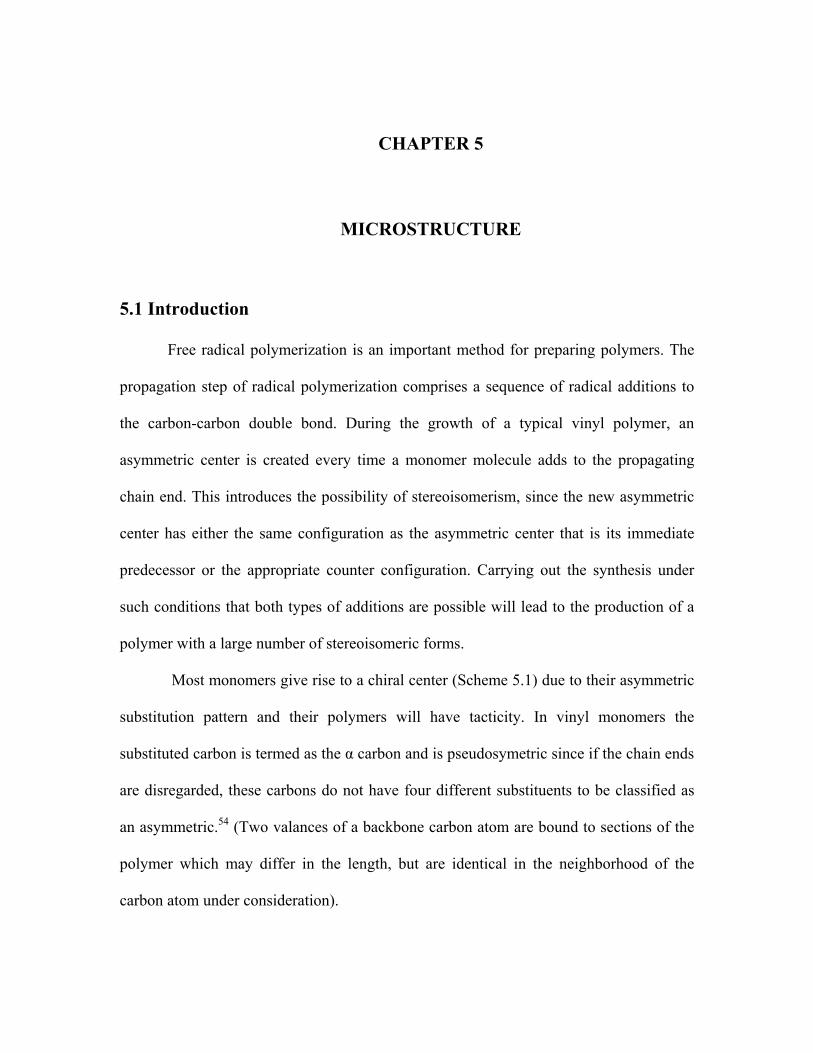
CHAPTER 5
MICROSTRUCTURE
5.1 Introduction
Free radical polymerization is an important method for preparing polymers. The
propagation step of radical polymerization comprises a sequence of radical additions to
the carbon-carbon double bond. During the growth of a typical vinyl polymer, an
asymmetric center is created every time a monomer molecule adds to the propagating
chain end. This introduces the possibility of stereoisomerism, since the new asymmetric
center has either the same configuration as the asymmetric center that is its immediate
predecessor or the appropriate counter configuration. Carrying out the synthesis under
such conditions that both types of additions are possible will lead to the production of a
polymer with a large number of stereoisomeric forms.
Most monomers give rise to a chiral center (Scheme 5.1) due to their asymmetric
substitution pattern and their polymers will have tacticity. In vinyl monomers the
substituted carbon is termed as the α carbon and is pseudosymetric since if the chain ends
are disregarded, these carbons do not have four different substituents to be classified as
an asymmetric.54 (Two valances of a backbone carbon atom are bound to sections of the
polymer which may differ in the length, but are identical in the neighborhood of the
carbon atom under consideration).
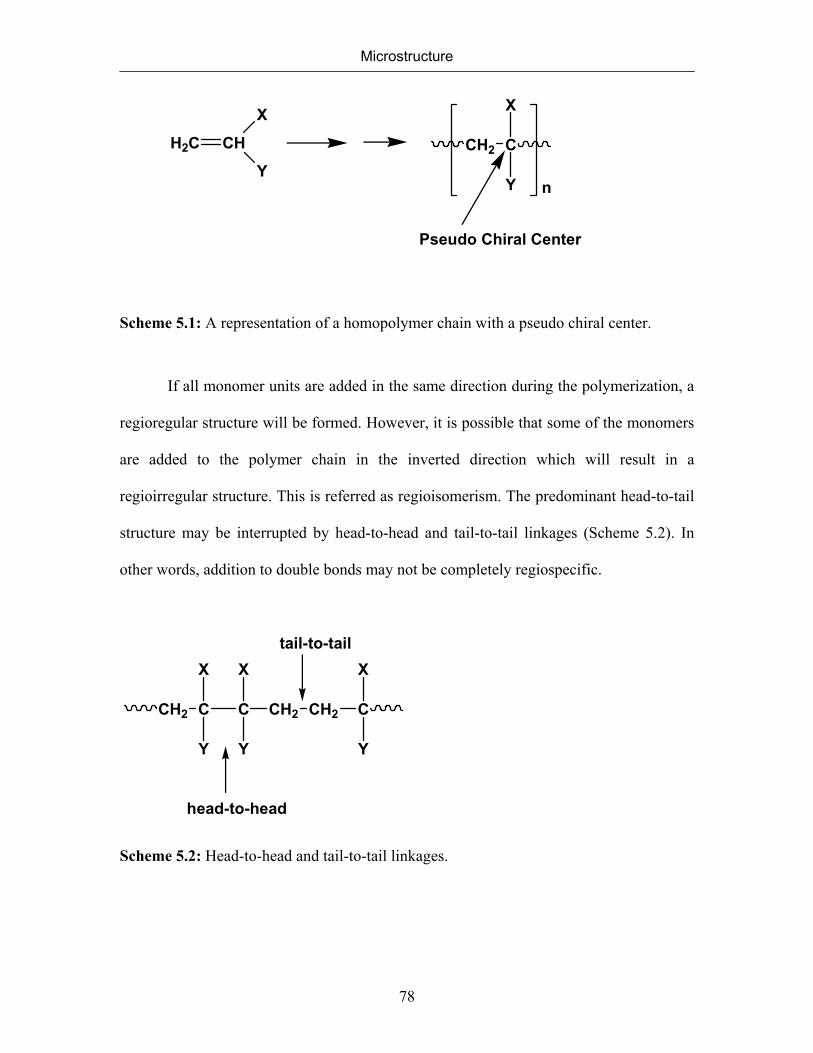
Microstructure
78
H2C CH
X
YCH2 C
X
Y n
Pseudo Chiral Center
Scheme 5.1: A representation of a homopolymer chain with a pseudo chiral center.
If all monomer units are added in the same direction during the polymerization, a
regioregular structure will be formed. However, it is possible that some of the monomers
are added to the polymer chain in the inverted direction which will result in a
regioirregular structure. This is referred as regioisomerism. The predominant head-to-tail
structure may be interrupted by head-to-head and tail-to-tail linkages (Scheme 5.2). In
other words, addition to double bonds may not be completely regiospecific.
CH2 C
X
Y
C
X
Y
CH2 CH2 C
X
Y
head-to-head
tail-to-tail
Scheme 5.2: Head-to-head and tail-to-tail linkages.

Microstructure
79
The words isotactic, syndiotactic, and atactic are used to describe the different
sterosequences in vinyl polymers (Scheme 5.3). The polymer chains are called isotactic
if the substituents X, and Y are on the same side of the zigzag backbone plane, i.e. they
have identical configuration. Syndiotactic chains are formed if the substituents alternate
from side to side, i.e. they have opposite configurations. Both isotactic and syndiotactic
chains are stereoregular structures. The atactic structure is characterized by an irregular,
random arrangement of neighboring substituent groups on either side of the backbone.
These stereochemical isomers can be presented with either a three dimensional (Scheme
5.3a) or a two dimensional projection (Scheme 5.3b), called "Fischer Projection".98
CH2
CCH2
CCH2
CCH2
CCH2
X YX YX YX Y
CH2
CCH2
CCH2
CCH2
CCH2
X YY XX YY X
CH2
CCH2
CCH2
CCH2
CCH2
X YY XY XX Y
isotactic
syndiotactic
atactic
X X X X
Y Y Y Y
X X X X
Y Y Y Y
X Y X Y
Y X Y X
X Y X Y
Y X Y X
X Y Y X
Y X X Y
X Y Y X
Y X X Y
(a) (b)
Scheme 5.3: Different possible stereochemical arrangements in a) three dimensional b) in
two dimensional representation.

Microstructure
80
In treatment of polymer stereochemistry, one only deals with relative
configurations. In other words, stereochemistry of polymers reveals information about
whether an asymmetric carbon atom is surrounded by like or dislike further asymmetric
centers. Therefore, the smallest structural unit which contains stereochemical information
is the diad. The diads are of two types: meso (m) and racemic (r). A meso diad has two
chiral centers of like configuration. On the other hand, two chiral centers have opposite
configuration in a racemic diad (Scheme 5.4).54 It is usual to discuss triads, tetrads,
pentads, etc. in terms of the consitutents of diads.
C
X
Y
CH2 C
X
Y
C
X
Y
CH2 C
Y
Xmeso (m) racemic (r)
Scheme 5.4: Types of diads.
One of the earliest methods used for obtaining information about stereoregularity
in polymers was to compare the solution NMR spectra of a polymer with those of a
model compound and other polymers. For example, 2,4,6-trimethyl heptane was used as a
model compound to study the stereochemical isomerism in polypropylene. The NMR-
peak assignments can be established by comparing the spectra of the polymer to those
from the isotactic, or syndiotactic polymers if they are available.
Statistical methods can be used to establish the chemical shift assignments of the
polymers based on the relative intensities of peaks in case the statistics of the chain
propagation are known or can be determined. Different statistics such as Bernouillian and
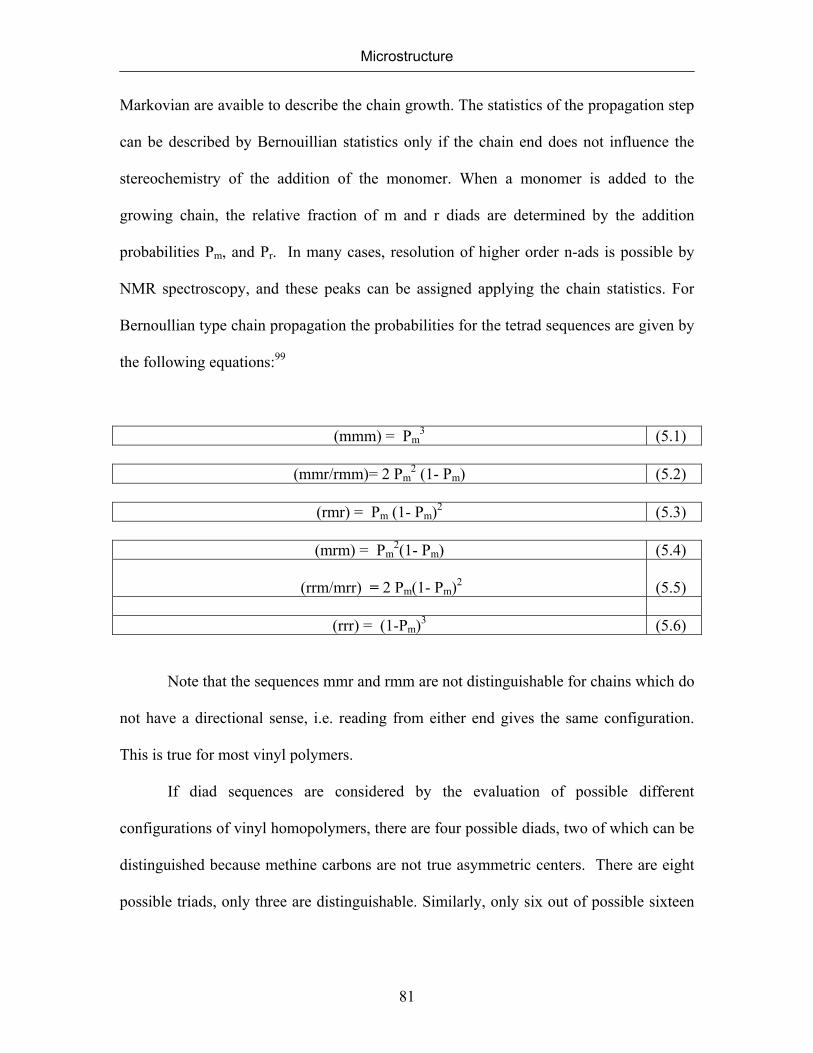
Microstructure
81
Markovian are avaible to describe the chain growth. The statistics of the propagation step
can be described by Bernouillian statistics only if the chain end does not influence the
stereochemistry of the addition of the monomer. When a monomer is added to the
growing chain, the relative fraction of m and r diads are determined by the addition
probabilities Pm, and Pr. In many cases, resolution of higher order n-ads is possible by
NMR spectroscopy, and these peaks can be assigned applying the chain statistics. For
Bernoullian type chain propagation the probabilities for the tetrad sequences are given by
the following equations:99
(mmm) = Pm3 (5.1)
(mmr/rmm)= 2 Pm
2 (1- Pm) (5.2)
(rmr) = Pm (1- Pm)2 (5.3)
(mrm) = Pm2(1- Pm) (5.4)
(rrm/mrr) = 2 Pm(1- Pm)2
(5.5)
(rrr) = (1-Pm)3 (5.6)
Note that the sequences mmr and rmm are not distinguishable for chains which do
not have a directional sense, i.e. reading from either end gives the same configuration.
This is true for most vinyl polymers.
If diad sequences are considered by the evaluation of possible different
configurations of vinyl homopolymers, there are four possible diads, two of which can be
distinguished because methine carbons are not true asymmetric centers. There are eight
possible triads, only three are distinguishable. Similarly, only six out of possible sixteen
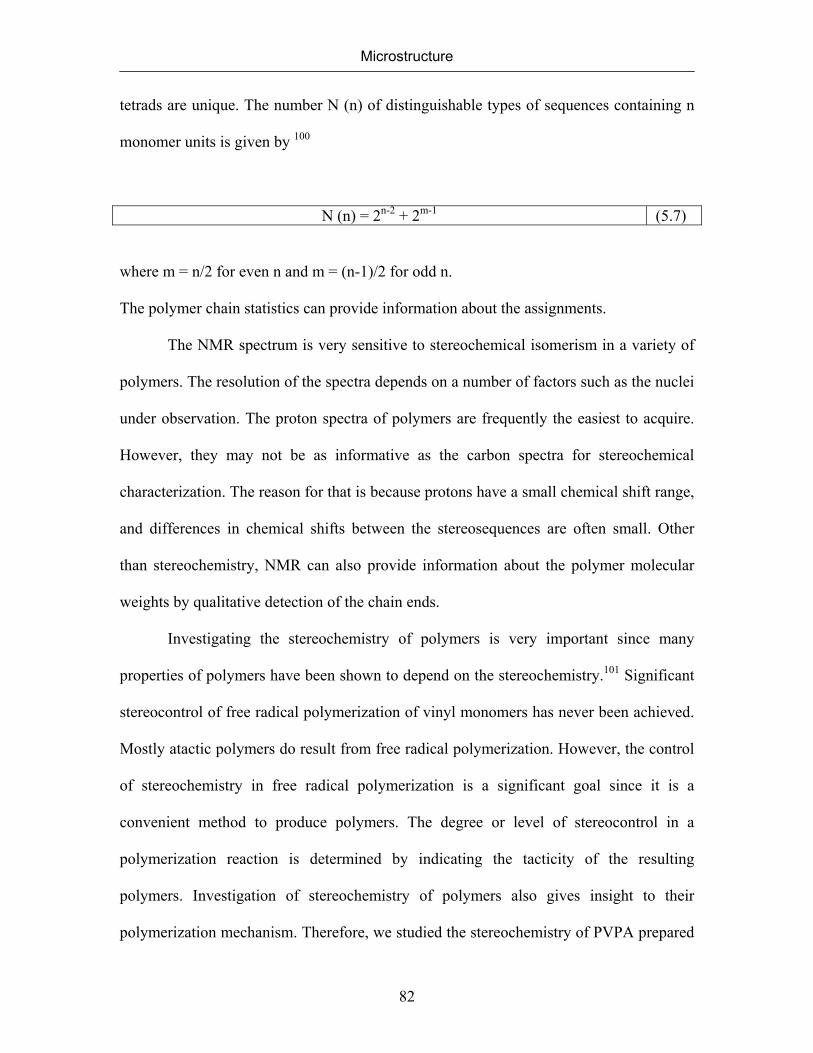
Microstructure
82
tetrads are unique. The number N (n) of distinguishable types of sequences containing n
monomer units is given by 100
N (n) = 2n-2 + 2m-1 (5.7)
where m = n/2 for even n and m = (n-1)/2 for odd n.
The polymer chain statistics can provide information about the assignments.
The NMR spectrum is very sensitive to stereochemical isomerism in a variety of
polymers. The resolution of the spectra depends on a number of factors such as the nuclei
under observation. The proton spectra of polymers are frequently the easiest to acquire.
However, they may not be as informative as the carbon spectra for stereochemical
characterization. The reason for that is because protons have a small chemical shift range,
and differences in chemical shifts between the stereosequences are often small. Other
than stereochemistry, NMR can also provide information about the polymer molecular
weights by qualitative detection of the chain ends.
Investigating the stereochemistry of polymers is very important since many
properties of polymers have been shown to depend on the stereochemistry.101 Significant
stereocontrol of free radical polymerization of vinyl monomers has never been achieved.
Mostly atactic polymers do result from free radical polymerization. However, the control
of stereochemistry in free radical polymerization is a significant goal since it is a
convenient method to produce polymers. The degree or level of stereocontrol in a
polymerization reaction is determined by indicating the tacticity of the resulting
polymers. Investigation of stereochemistry of polymers also gives insight to their
polymerization mechanism. Therefore, we studied the stereochemistry of PVPA prepared
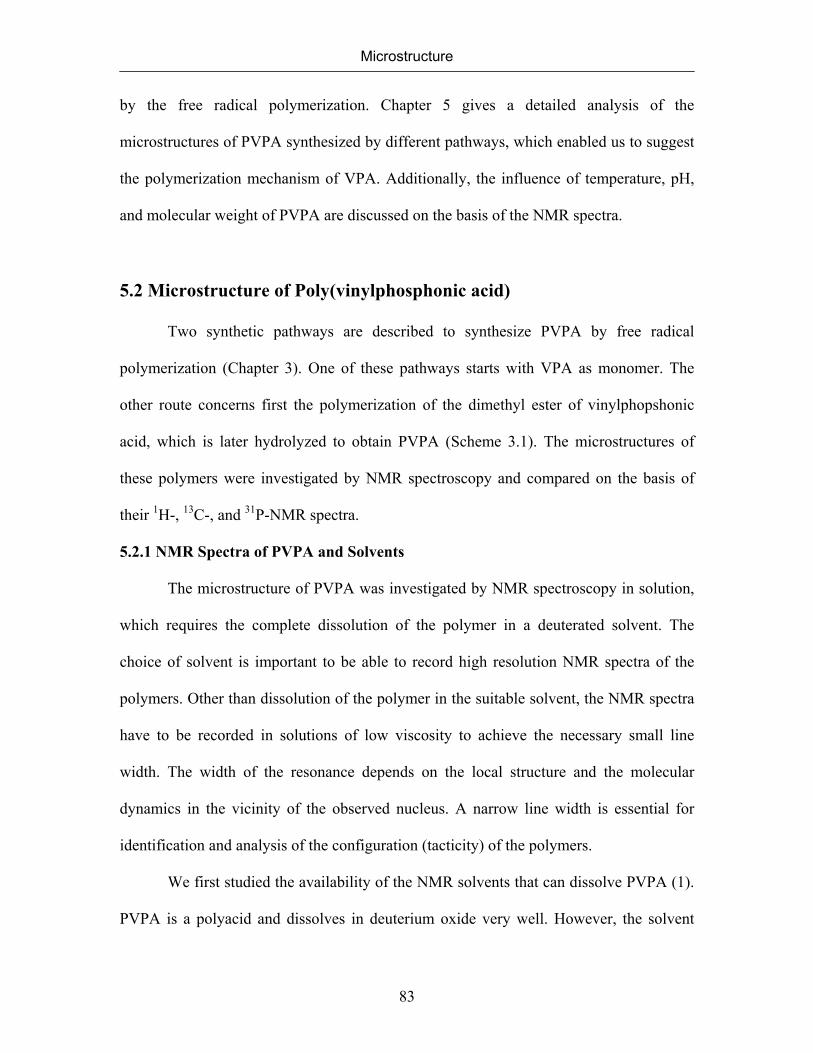
Microstructure
83
by the free radical polymerization. Chapter 5 gives a detailed analysis of the
microstructures of PVPA synthesized by different pathways, which enabled us to suggest
the polymerization mechanism of VPA. Additionally, the influence of temperature, pH,
and molecular weight of PVPA are discussed on the basis of the NMR spectra.
5.2 Microstructure of Poly(vinylphosphonic acid)
Two synthetic pathways are described to synthesize PVPA by free radical
polymerization (Chapter 3). One of these pathways starts with VPA as monomer. The
other route concerns first the polymerization of the dimethyl ester of vinylphopshonic
acid, which is later hydrolyzed to obtain PVPA (Scheme 3.1). The microstructures of
these polymers were investigated by NMR spectroscopy and compared on the basis of
their 1H-, 13C-, and 31P-NMR spectra.
5.2.1 NMR Spectra of PVPA and Solvents
The microstructure of PVPA was investigated by NMR spectroscopy in solution,
which requires the complete dissolution of the polymer in a deuterated solvent. The
choice of solvent is important to be able to record high resolution NMR spectra of the
polymers. Other than dissolution of the polymer in the suitable solvent, the NMR spectra
have to be recorded in solutions of low viscosity to achieve the necessary small line
width. The width of the resonance depends on the local structure and the molecular
dynamics in the vicinity of the observed nucleus. A narrow line width is essential for
identification and analysis of the configuration (tacticity) of the polymers.
We first studied the availability of the NMR solvents that can dissolve PVPA (1).
PVPA is a polyacid and dissolves in deuterium oxide very well. However, the solvent
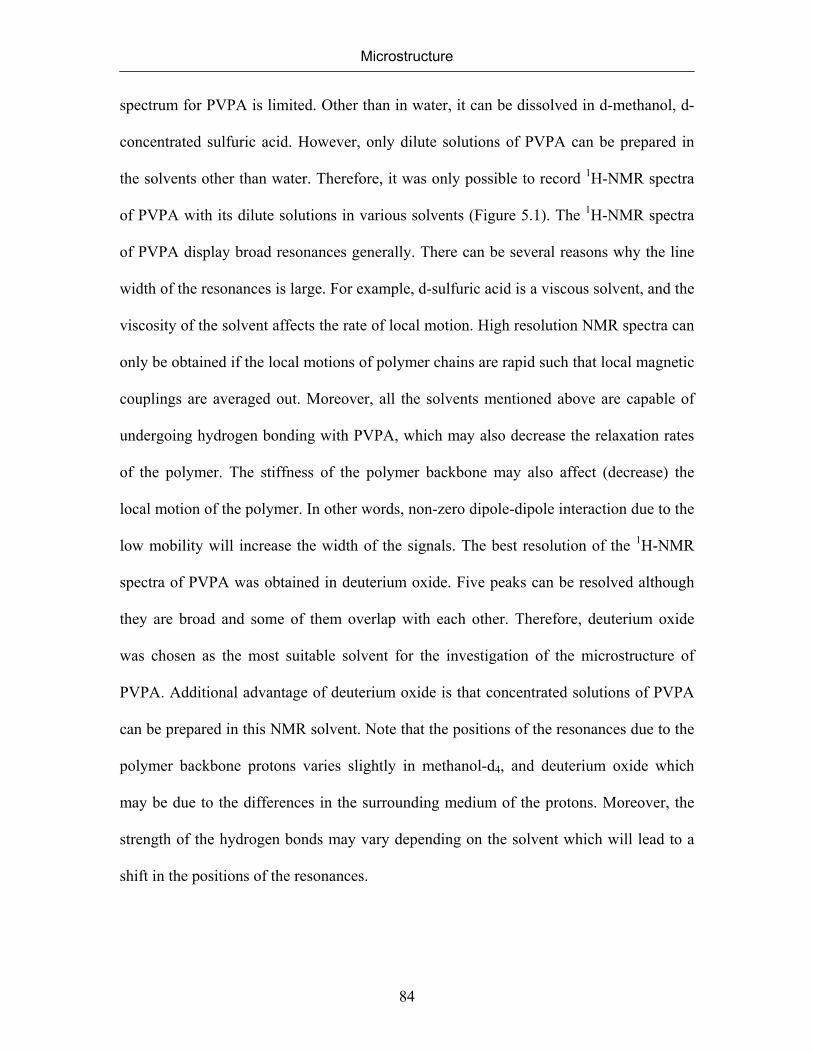
Microstructure
84
spectrum for PVPA is limited. Other than in water, it can be dissolved in d-methanol, d-
concentrated sulfuric acid. However, only dilute solutions of PVPA can be prepared in
the solvents other than water. Therefore, it was only possible to record 1H-NMR spectra
of PVPA with its dilute solutions in various solvents (Figure 5.1). The 1H-NMR spectra
of PVPA display broad resonances generally. There can be several reasons why the line
width of the resonances is large. For example, d-sulfuric acid is a viscous solvent, and the
viscosity of the solvent affects the rate of local motion. High resolution NMR spectra can
only be obtained if the local motions of polymer chains are rapid such that local magnetic
couplings are averaged out. Moreover, all the solvents mentioned above are capable of
undergoing hydrogen bonding with PVPA, which may also decrease the relaxation rates
of the polymer. The stiffness of the polymer backbone may also affect (decrease) the
local motion of the polymer. In other words, non-zero dipole-dipole interaction due to the
low mobility will increase the width of the signals. The best resolution of the 1H-NMR
spectra of PVPA was obtained in deuterium oxide. Five peaks can be resolved although
they are broad and some of them overlap with each other. Therefore, deuterium oxide
was chosen as the most suitable solvent for the investigation of the microstructure of
PVPA. Additional advantage of deuterium oxide is that concentrated solutions of PVPA
can be prepared in this NMR solvent. Note that the positions of the resonances due to the
polymer backbone protons varies slightly in methanol-d4, and deuterium oxide which
may be due to the differences in the surrounding medium of the protons. Moreover, the
strength of the hydrogen bonds may vary depending on the solvent which will lead to a
shift in the positions of the resonances.
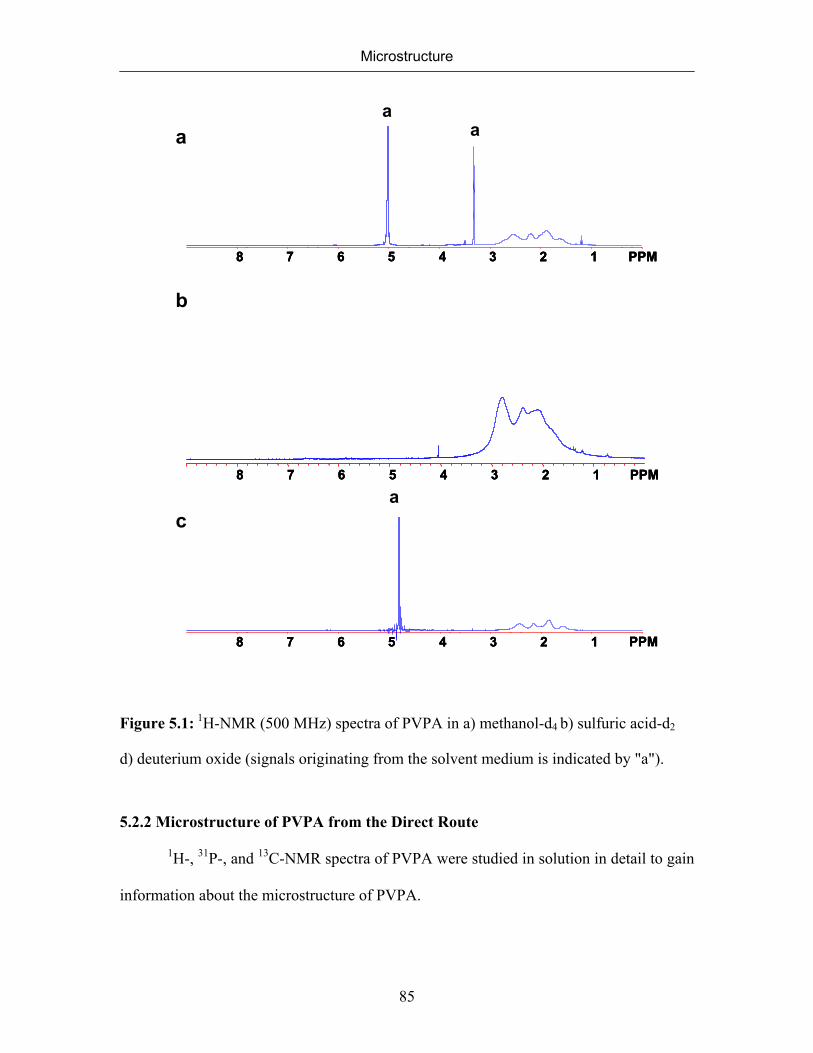
Microstructure
85
8 7 6 5 4 3 2 1 PPM8 7 6 5 4 3 2 1 PPM8 7 6 5 4 3 2 1 PPM
8 7 6 5 4 3 2 1 PPM8 7 6 5 4 3 2 1 PPM8 7 6 5 4 3 2 1 PPM
8 7 6 5 4 3 2 1 PPM8 7 6 5 4 3 2 1 PPM8 7 6 5 4 3 2 1 PPM
a
aaa
b
c
Figure 5.1: 1H-NMR (500 MHz) spectra of PVPA in a) methanol-d4 b) sulfuric acid-d2
d) deuterium oxide (signals originating from the solvent medium is indicated by "a").
5.2.2 Microstructure of PVPA from the Direct Route
1H-, 31P-, and 13C-NMR spectra of PVPA were studied in solution in detail to gain
information about the microstructure of PVPA.
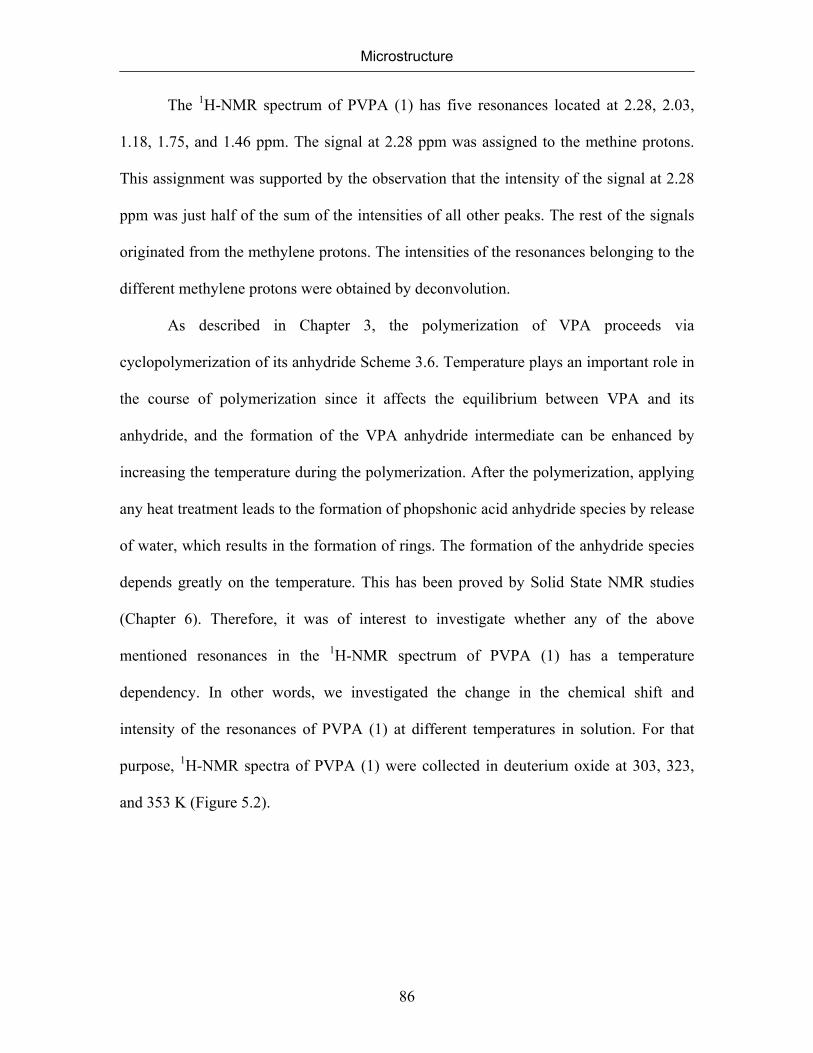
Microstructure
86
The 1H-NMR spectrum of PVPA (1) has five resonances located at 2.28, 2.03,
1.18, 1.75, and 1.46 ppm. The signal at 2.28 ppm was assigned to the methine protons.
This assignment was supported by the observation that the intensity of the signal at 2.28
ppm was just half of the sum of the intensities of all other peaks. The rest of the signals
originated from the methylene protons. The intensities of the resonances belonging to the
different methylene protons were obtained by deconvolution.
As described in Chapter 3, the polymerization of VPA proceeds via
cyclopolymerization of its anhydride Scheme 3.6. Temperature plays an important role in
the course of polymerization since it affects the equilibrium between VPA and its
anhydride, and the formation of the VPA anhydride intermediate can be enhanced by
increasing the temperature during the polymerization. After the polymerization, applying
any heat treatment leads to the formation of phopshonic acid anhydride species by release
of water, which results in the formation of rings. The formation of the anhydride species
depends greatly on the temperature. This has been proved by Solid State NMR studies
(Chapter 6). Therefore, it was of interest to investigate whether any of the above
mentioned resonances in the 1H-NMR spectrum of PVPA (1) has a temperature
dependency. In other words, we investigated the change in the chemical shift and
intensity of the resonances of PVPA (1) at different temperatures in solution. For that
purpose, 1H-NMR spectra of PVPA (1) were collected in deuterium oxide at 303, 323,
and 353 K (Figure 5.2).
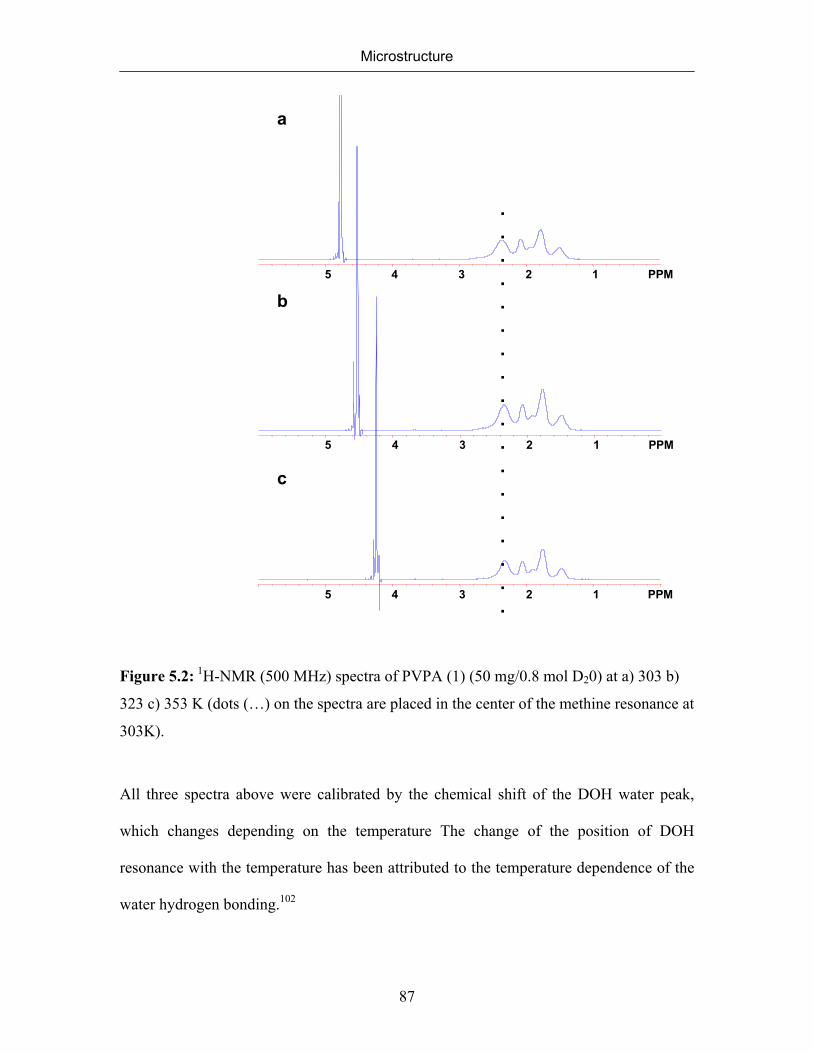
Microstructure
87
5 4 3 2 1 PPM
.
.
.
.
.
.
.
.
.
.
.
.
.
.
.
.
.
.
5 4 3 2 1 PPM
a
5 4 3 2 1 PPM
b
c
Figure 5.2: 1H-NMR (500 MHz) spectra of PVPA (1) (50 mg/0.8 mol D20) at a) 303 b)
323 c) 353 K (dots (…) on the spectra are placed in the center of the methine resonance at
303K).
All three spectra above were calibrated by the chemical shift of the DOH water peak,
which changes depending on the temperature The change of the position of DOH
resonance with the temperature has been attributed to the temperature dependence of the
water hydrogen bonding.102
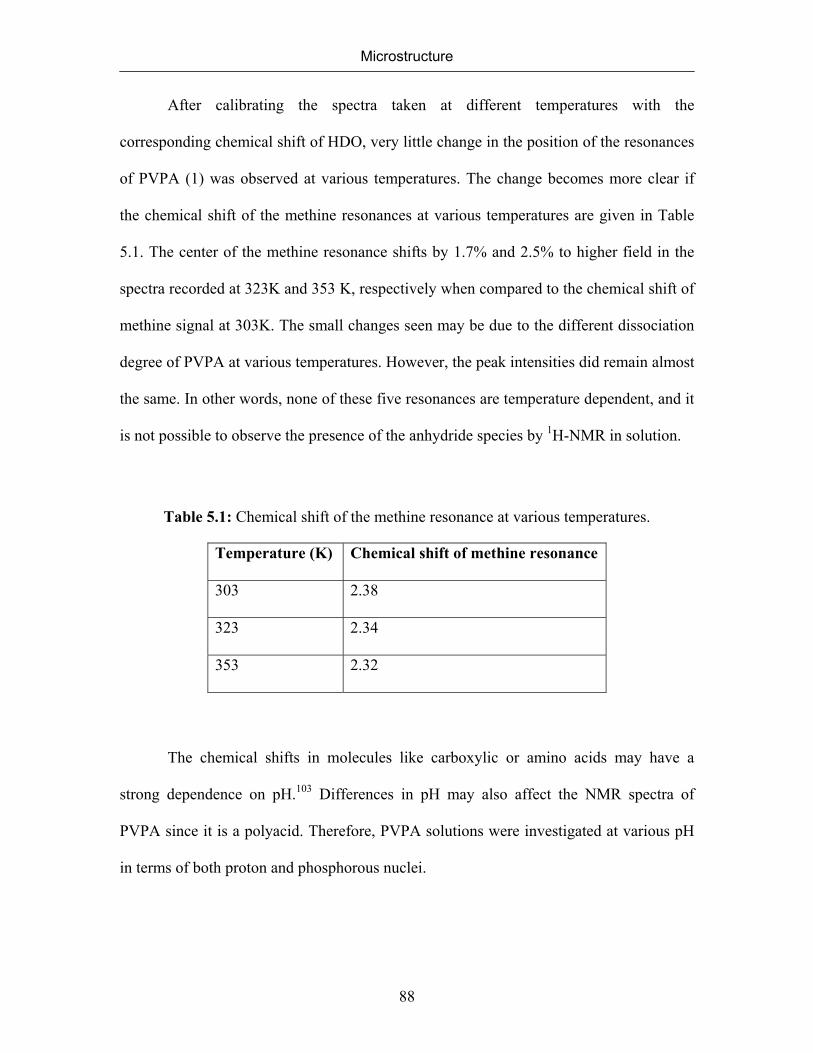
Microstructure
88
After calibrating the spectra taken at different temperatures with the
corresponding chemical shift of HDO, very little change in the position of the resonances
of PVPA (1) was observed at various temperatures. The change becomes more clear if
the chemical shift of the methine resonances at various temperatures are given in Table
5.1. The center of the methine resonance shifts by 1.7% and 2.5% to higher field in the
spectra recorded at 323K and 353 K, respectively when compared to the chemical shift of
methine signal at 303K. The small changes seen may be due to the different dissociation
degree of PVPA at various temperatures. However, the peak intensities did remain almost
the same. In other words, none of these five resonances are temperature dependent, and it
is not possible to observe the presence of the anhydride species by 1H-NMR in solution.
Table 5.1: Chemical shift of the methine resonance at various temperatures.
Temperature (K) Chemical shift of methine resonance
303 2.38
323 2.34
353 2.32
The chemical shifts in molecules like carboxylic or amino acids may have a
strong dependence on pH.103 Differences in pH may also affect the NMR spectra of
PVPA since it is a polyacid. Therefore, PVPA solutions were investigated at various pH
in terms of both proton and phosphorous nuclei.
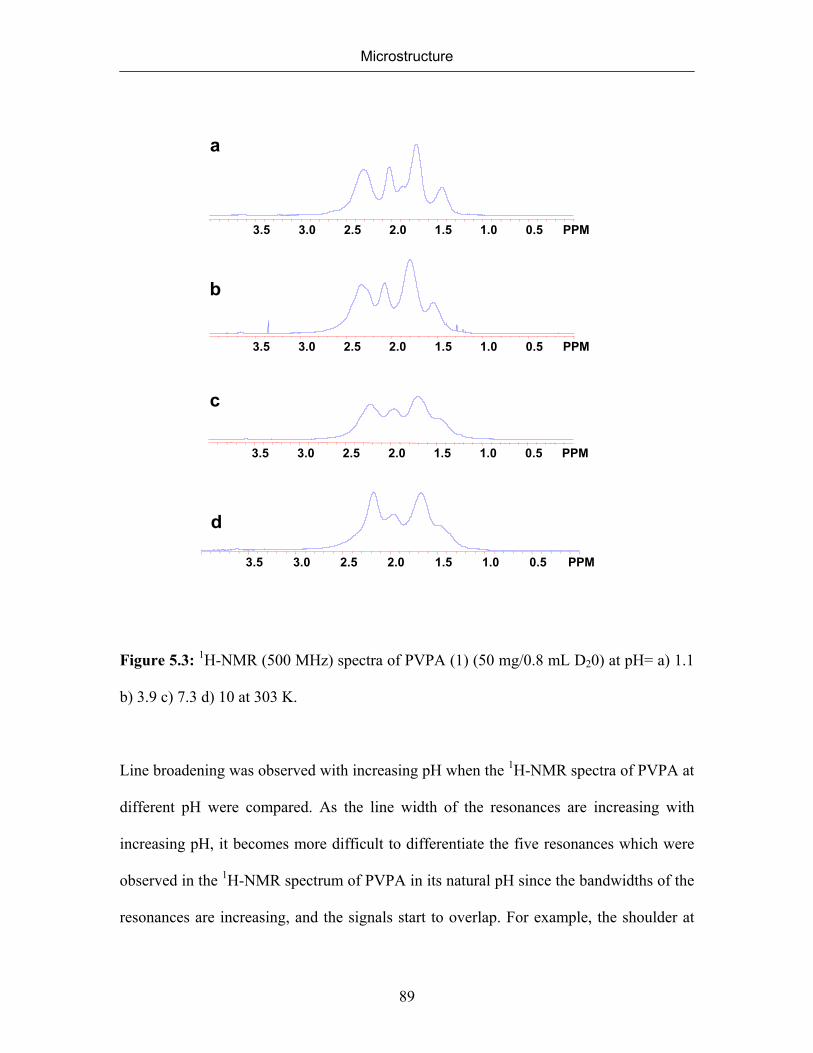
Microstructure
89
3.5 3.0 2.5 2.0 1.5 1.0 0.5 PPM
a
3.5 3.0 2.5 2.0 1.5 1.0 0.5 PPM
b
3.5 3.0 2.5 2.0 1.5 1.0 0.5 PPM
3.5 3.0 2.5 2.0 1.5 1.0 0.5 PPM
c
d
Figure 5.3: 1H-NMR (500 MHz) spectra of PVPA (1) (50 mg/0.8 mL D20) at pH= a) 1.1
b) 3.9 c) 7.3 d) 10 at 303 K.
Line broadening was observed with increasing pH when the 1H-NMR spectra of PVPA at
different pH were compared. As the line width of the resonances are increasing with
increasing pH, it becomes more difficult to differentiate the five resonances which were
observed in the 1H-NMR spectrum of PVPA in its natural pH since the bandwidths of the
resonances are increasing, and the signals start to overlap. For example, the shoulder at

Microstructure
90
the left side of the resonance at 1.80 ppm cannot be separated from the main resonance
any more at pH= 3.9, 7.3 and 10. As pH increases, some of the phosphonic acid groups
are deprotonated. In other words, some of the protons will be replaced by the sodium ion
since the titrant was a NaOH solution. Therefore, the polymer chain will contain ONa
groups in addition to OH groups at the phopshonic acid functionality. However,
deprotonation did not give rise to additional peaks due to the replacement of the proton
by sodium ion. Most probably, the spectrum containing the effect of neutralization is an
average spectrum. The chemical shifts are only average values for protonated and
deprotonated species due to a fast proton exchange between protonated and deprotonated
species. Therefore, although no additional resonances were observed, slight shifts in the
positions of the resonances are due to the differences in pH. At this stage of study, it
would not be correct to correlate the peak position with the absolute values of pH since
the solutions were prepared in D20 for NMR measurements, and their pH were measured
with a pH electrode calibrated with H20-based buffers. A correction of 0.4 has to be
added to pH meter readings to get pD values, which was not done during the calibration
of pH electrode. The pH dependence of NMR spectra has already been reported in the
literature for PAA.104 It was shown that variations in pH cause a shift in the peak
positions of the carbonyl carbon and the methine carbons of PAA. Deprotonation with
increasing pH resulted in a down field shift of each resonance. Moreover, the resolution
of the spectra was influenced by the variations in pH. There was no fine structure
apparent in the spectra at low pH, whereas at high pH the peak resolution for the methine
carbon was good, but poor for the methylene carbons.

Microstructure
91
The temperature dependence of PVPA solutions at different pH was investigated
by increasing the temperature from 303 K to 353 K at constant pH. Increasing
temperature lead to narrowing so that the resonances at high pH solutions have a better
resolution, At 353 K it was possible to observe five resonances for the PVPA solution at
pH= 10. The intensities of the resonances did not change with varying the temperature
beyond the experimental errors that are due to the deconvolution of very closely located
peaks.
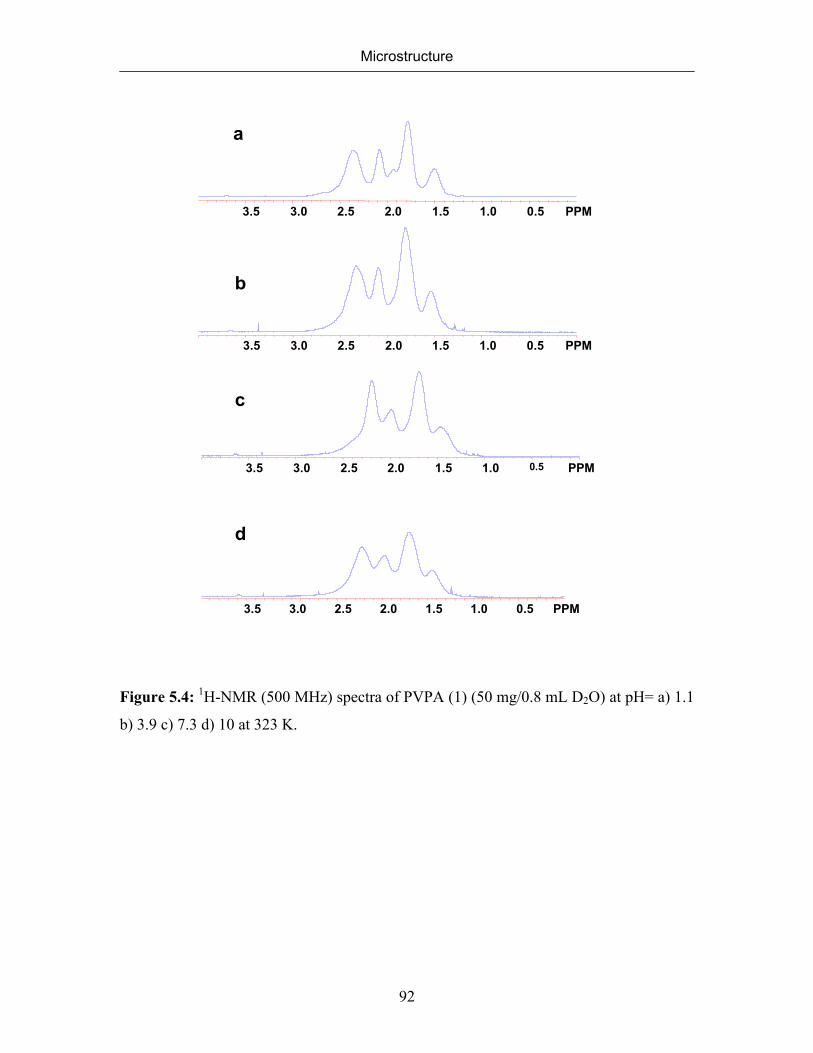
Microstructure
92
3.5 3.0 2.5 2.0 1.5 1.0 0.5 PPM
a
3.5 3.0 2.5 2.0 1.5 1.0 0.5 PPM
b
3.5 3.0 2.5 2.0 1.5 1.0 0.5 PPM
c
d
3.5 3.0 2.5 2.0 1.5 1.0 0.5 PPM
Figure 5.4: 1H-NMR (500 MHz) spectra of PVPA (1) (50 mg/0.8 mL D2O) at pH= a) 1.1
b) 3.9 c) 7.3 d) 10 at 323 K.
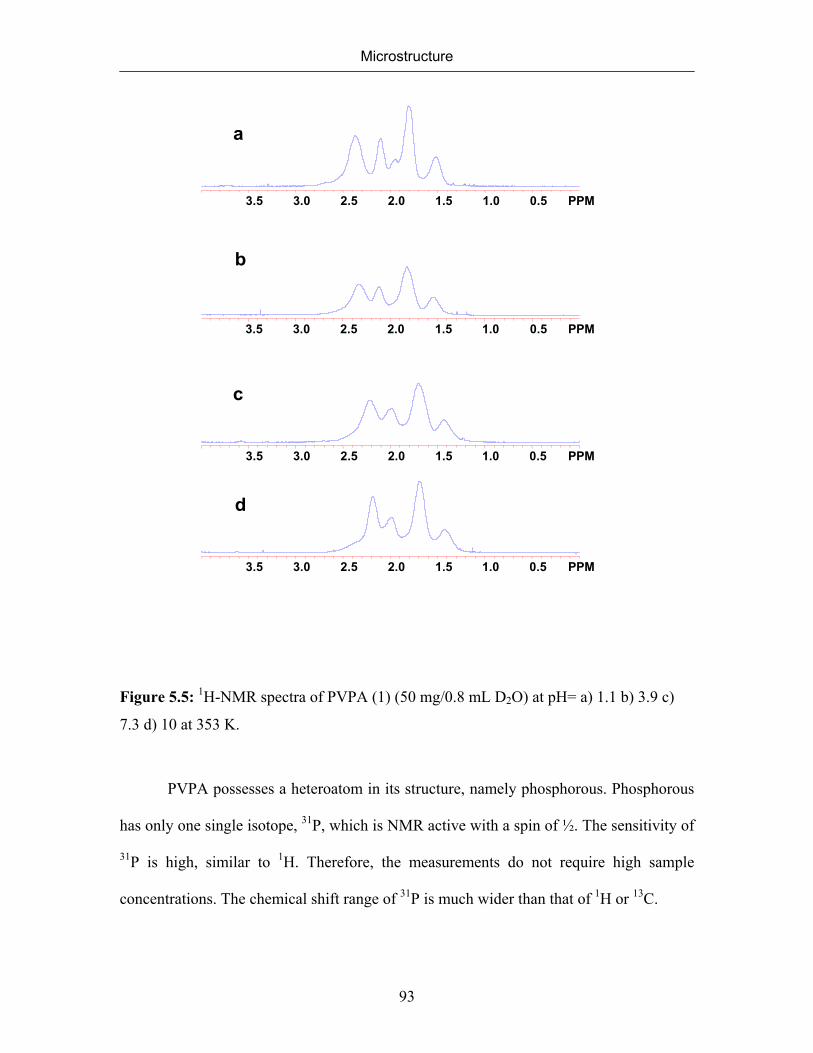
Microstructure
93
3.5 3.0 2.5 2.0 1.5 1.0 0.5 PPM
3.5 3.0 2.5 2.0 1.5 1.0 0.5 PPM
a
c
3.5 3.0 2.5 2.0 1.5 1.0 0.5 PPM
b
d
3.5 3.0 2.5 2.0 1.5 1.0 0.5 PPM
Figure 5.5: 1H-NMR spectra of PVPA (1) (50 mg/0.8 mL D2O) at pH= a) 1.1 b) 3.9 c)
7.3 d) 10 at 353 K.
PVPA possesses a heteroatom in its structure, namely phosphorous. Phosphorous
has only one single isotope, 31P, which is NMR active with a spin of ½. The sensitivity of
31P is high, similar to 1H. Therefore, the measurements do not require high sample
concentrations. The chemical shift range of 31P is much wider than that of 1H or 13C.
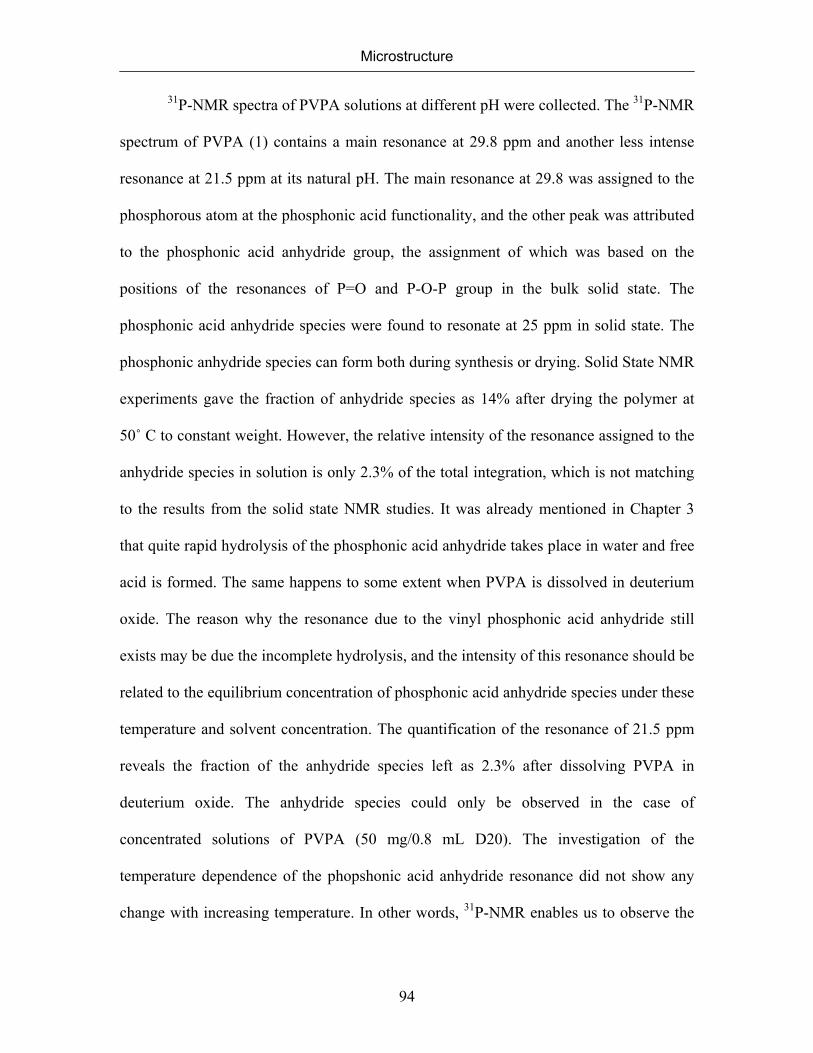
Microstructure
94
31P-NMR spectra of PVPA solutions at different pH were collected. The 31P-NMR
spectrum of PVPA (1) contains a main resonance at 29.8 ppm and another less intense
resonance at 21.5 ppm at its natural pH. The main resonance at 29.8 was assigned to the
phosphorous atom at the phosphonic acid functionality, and the other peak was attributed
to the phosphonic acid anhydride group, the assignment of which was based on the
positions of the resonances of P=O and P-O-P group in the bulk solid state. The
phosphonic acid anhydride species were found to resonate at 25 ppm in solid state. The
phosphonic anhydride species can form both during synthesis or drying. Solid State NMR
experiments gave the fraction of anhydride species as 14% after drying the polymer at
50˚ C to constant weight. However, the relative intensity of the resonance assigned to the
anhydride species in solution is only 2.3% of the total integration, which is not matching
to the results from the solid state NMR studies. It was already mentioned in Chapter 3
that quite rapid hydrolysis of the phosphonic acid anhydride takes place in water and free
acid is formed. The same happens to some extent when PVPA is dissolved in deuterium
oxide. The reason why the resonance due to the vinyl phosphonic acid anhydride still
exists may be due the incomplete hydrolysis, and the intensity of this resonance should be
related to the equilibrium concentration of phosphonic acid anhydride species under these
temperature and solvent concentration. The quantification of the resonance of 21.5 ppm
reveals the fraction of the anhydride species left as 2.3% after dissolving PVPA in
deuterium oxide. The anhydride species could only be observed in the case of
concentrated solutions of PVPA (50 mg/0.8 mL D20). The investigation of the
temperature dependence of the phopshonic acid anhydride resonance did not show any
change with increasing temperature. In other words, 31P-NMR enables us to observe the
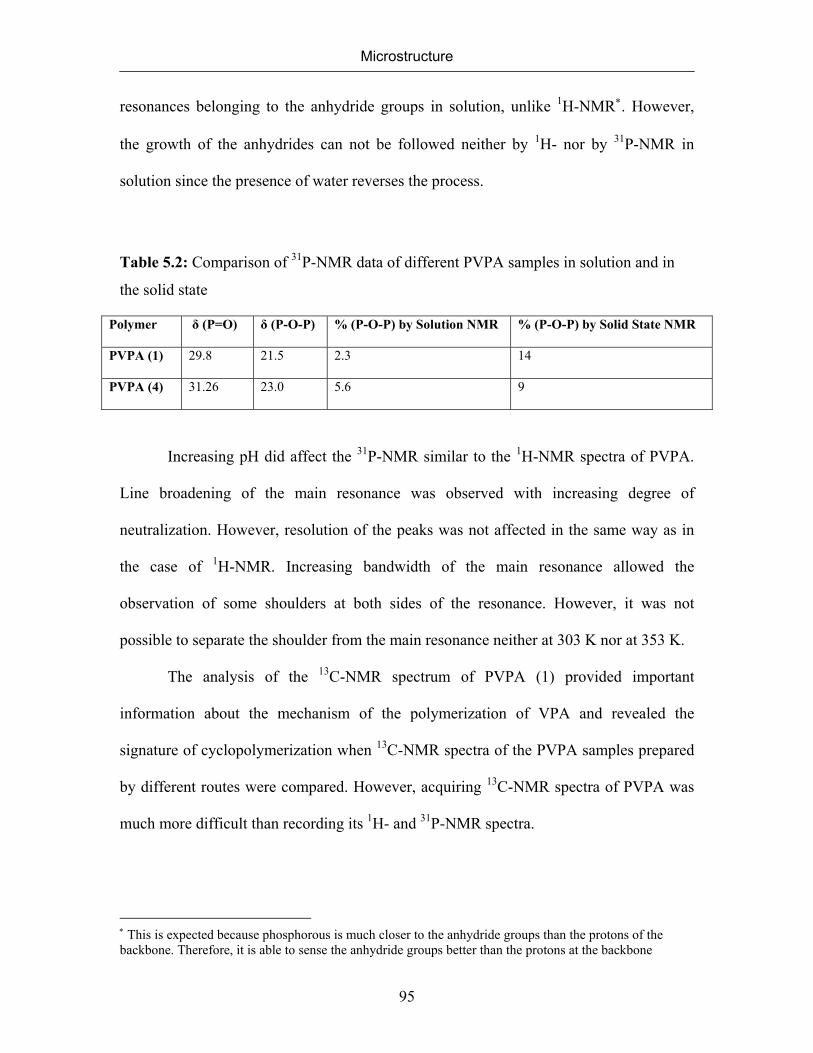
Microstructure
95
resonances belonging to the anhydride groups in solution, unlike 1H-NMR∗. However,
the growth of the anhydrides can not be followed neither by 1H- nor by 31P-NMR in
solution since the presence of water reverses the process.
Table 5.2: Comparison of 31P-NMR data of different PVPA samples in solution and in
the solid state
Polymer δ (P=O) δ (P-O-P) % (P-O-P) by Solution NMR % (P-O-P) by Solid State NMR
PVPA (1) 29.8 21.5 2.3 14
PVPA (4) 31.26 23.0 5.6 9
Increasing pH did affect the 31P-NMR similar to the 1H-NMR spectra of PVPA.
Line broadening of the main resonance was observed with increasing degree of
neutralization. However, resolution of the peaks was not affected in the same way as in
the case of 1H-NMR. Increasing bandwidth of the main resonance allowed the
observation of some shoulders at both sides of the resonance. However, it was not
possible to separate the shoulder from the main resonance neither at 303 K nor at 353 K.
The analysis of the 13C-NMR spectrum of PVPA (1) provided important
information about the mechanism of the polymerization of VPA and revealed the
signature of cyclopolymerization when 13C-NMR spectra of the PVPA samples prepared
by different routes were compared. However, acquiring 13C-NMR spectra of PVPA was
much more difficult than recording its 1H- and 31P-NMR spectra.
∗ This is expected because phosphorous is much closer to the anhydride groups than the protons of the backbone. Therefore, it is able to sense the anhydride groups better than the protons at the backbone
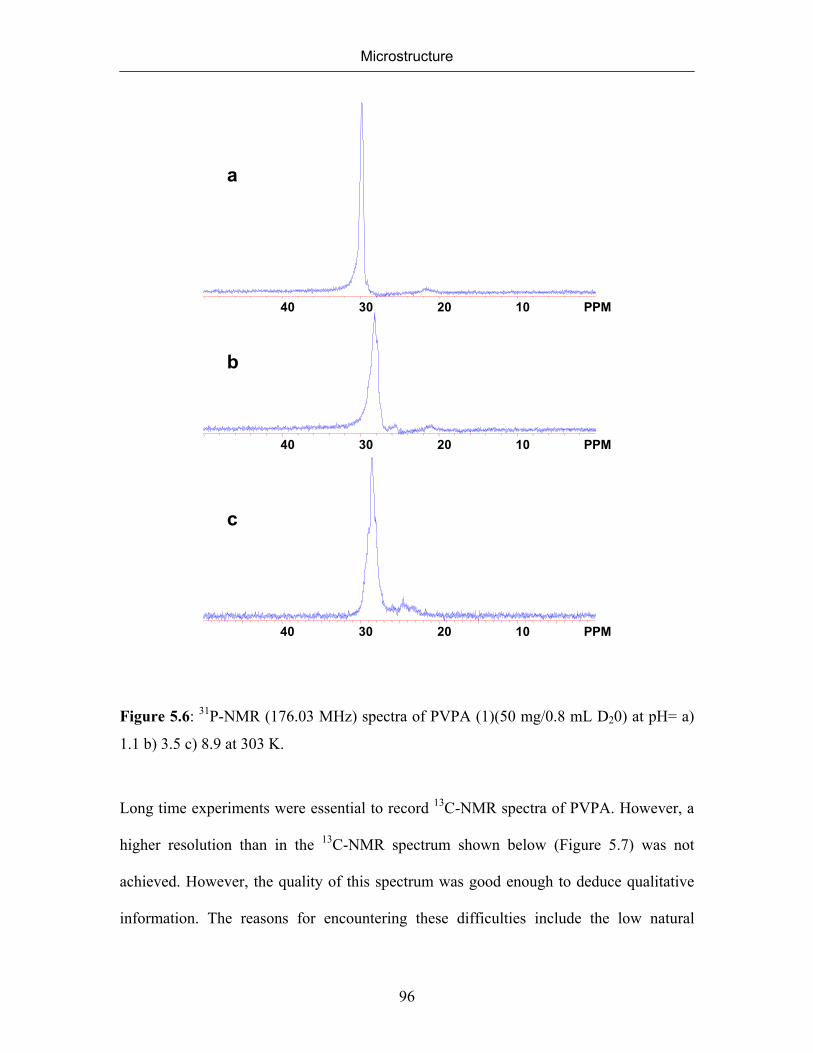
Microstructure
96
40 30 20 10 PPM
a
b
40 30 20 10 PPM
45 40 35 30 25 20 15 10 5 PPM
c
Figure 5.6: 31P-NMR (176.03 MHz) spectra of PVPA (1)(50 mg/0.8 mL D20) at pH= a)
1.1 b) 3.5 c) 8.9 at 303 K.
Long time experiments were essential to record 13C-NMR spectra of PVPA. However, a
higher resolution than in the 13C-NMR spectrum shown below (Figure 5.7) was not
achieved. However, the quality of this spectrum was good enough to deduce qualitative
information. The reasons for encountering these difficulties include the low natural

Microstructure
97
abundance of 13C nuclei (only 1.1% of the total carbon in a molecule consists of the spin
of ½ carbon-13 isotope), and the rigidity of the carbon backbone of the polymer.
The 13C-NMR spectrum of PVPA (1) exhibited two sets of signals. The first of
the signals consists of a singlet at 35 ppm, which was assigned to the methylene carbon,
and a doublet also centered at 35 ppm, which was assigned to the methine carbon. The
doublet arises from the hyperfine splitting of the methine carbon signal as a consequence
of the interaction with the phosphorous atom to which it was attached. In addition to
these signals, one singlet at 38 ppm and a doublet centered at 37.5 ppm were observed,
which is the second set of signals. The second set of signals was assigned to sequences
arising from head-head and tail-tail links in the polymer as indicated in the Figure 5.7.
The assignment of the second set of signals were done comparing the 13C-NMR
spectrum of PVPA obtained from the polymerization of VPA, which proceeds over the
cyclopolymerization of the vinylphosphonic acid intermediate, with that of PVPA(4)
obtained by the hydrolysis of PDMVP. The second set of the signals were absent in the
13C-NMR spectrum of PVPA prepared by the hydrolysis of PDMVP, the polymerization
of which does not follow the same mechanism as that of VPA.
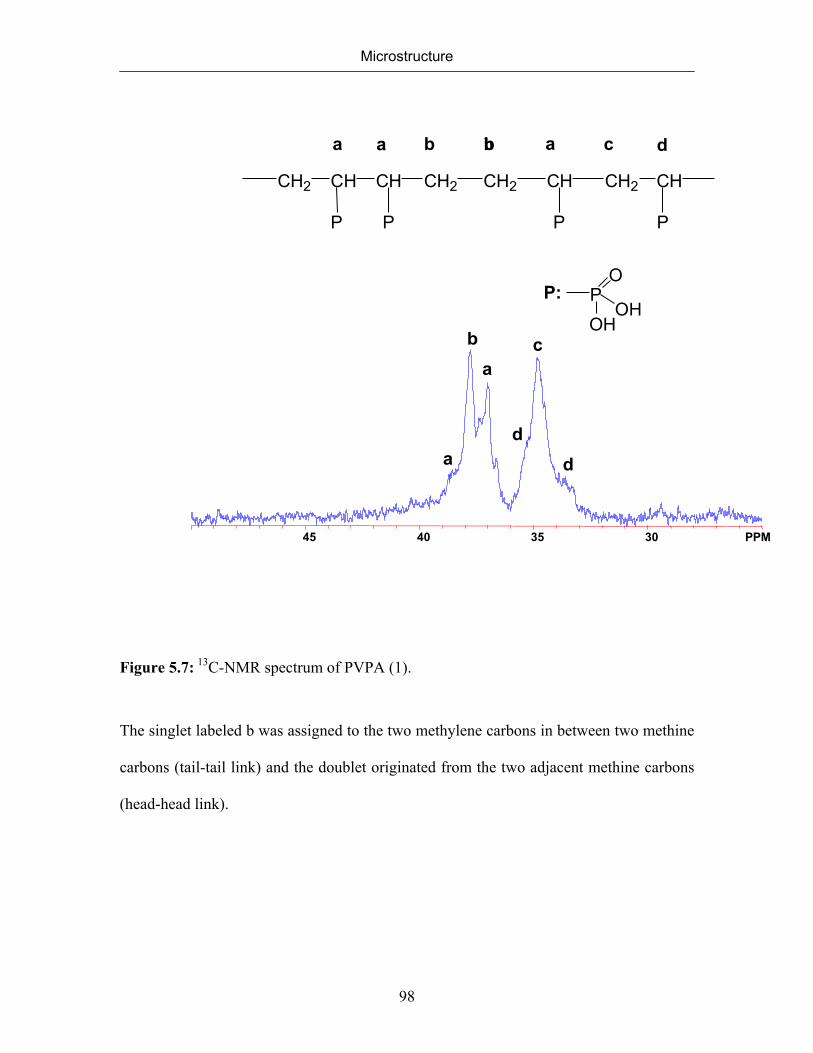
Microstructure
98
45 40 35 30 PPM
a
ba
d
c
d
PO
OHOH
P:
CH2 CH
P
CH CH2 CH2 CH
P
CH2 CH
PP
a a a cbbb d
Figure 5.7: 13C-NMR spectrum of PVPA (1).
The singlet labeled b was assigned to the two methylene carbons in between two methine
carbons (tail-tail link) and the doublet originated from the two adjacent methine carbons
(head-head link).
Microstructure
99
5.2.3 Microstructure of PVPA (4) Synthesized by the Hydrolysis of PDMVP
The microstructure of PVPA (4) prepared by the complete saponification of
PDMVP was elucidated inspecting the 1H, 31P, and 13C nuclei as a comparison to the
microstructure of the PVPA obtained by the cyclopolymerization of VPA. All spectra
were acquired with the PVPA (4) solutions in D20 in their natural pH.
The 1H-NMR spectrum of PVPA (4) has five resonances. Four of these
resonances that are located at 1.18, 1.46, 1.75, and 2.03 were assigned to the methylene
protons (Figure 5.9). The signal at 2.38 ppm belongs to the methine proton. This
assignment was supported by the observation that the intensity of the signals due to the
methylene protons is 2/3 of the sum of intensities of all peaks. The intensities of all peaks
were obtained separately by deconvoluting the 1H-NMR spectra.
As mentioned earlier, four different peaks were observed for the methylene
protons. To analyze the stereochemistry of PVPA (4), one has to consider corresponding
n-ads that give rise at least to four distinguishable signals. In this case, we have to
consider tetrad sequences, which give rise to 6 distinguishable signals. The presence of
only four resonances in the 1H-NMR spectrum of PVPA (4) indicates that some of the
signals overlap. The resonance at 1.18 ppm has the lowest intensity, the relative intensity
of this resonance was found as 0.103 from the experimental spectrum of PVPA (4). This
signal was assigned to the least probable tetrad sequence due to the lowest intensity. The
least probable tetrad sequence is mmm, the formation of this tetrad sequence requires that
all phosphonic acid functionalities are at the same side of the polymer backbone, i.e. they
have the same configuration, the probability of which is the lowest due to the steric
hindrance since the phosphonic acid group is bulky. After defining the probability of Pm,
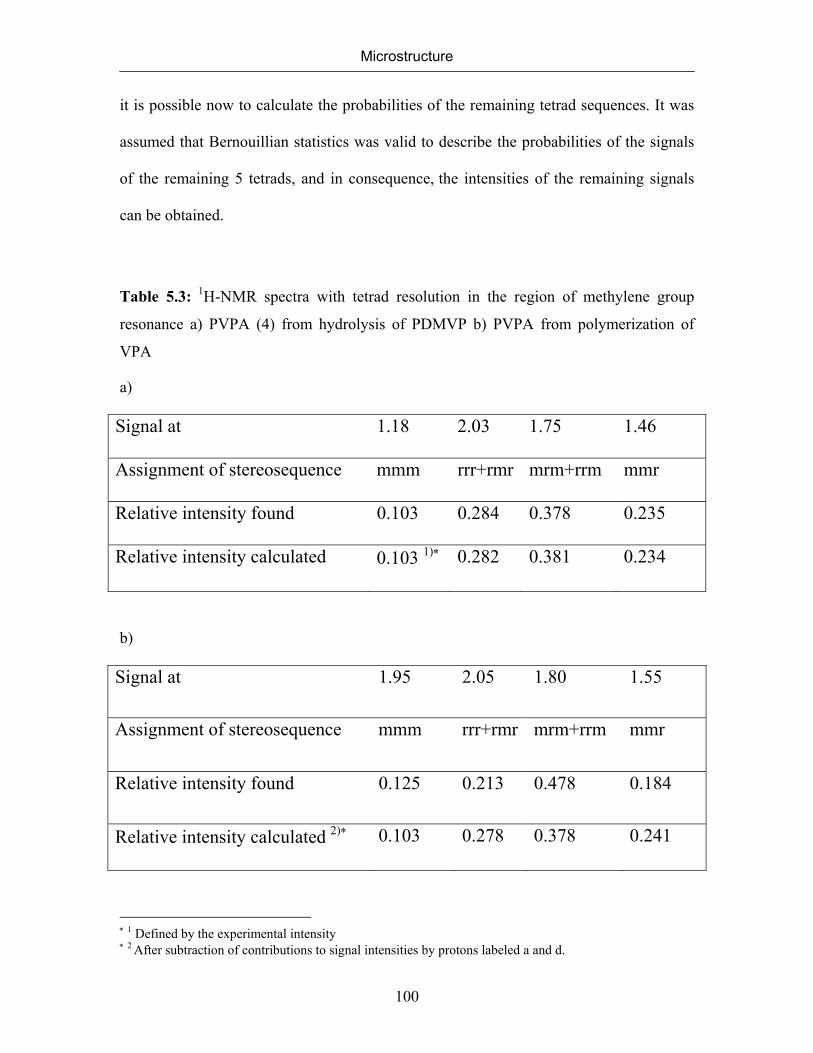
Microstructure
100
it is possible now to calculate the probabilities of the remaining tetrad sequences. It was
assumed that Bernouillian statistics was valid to describe the probabilities of the signals
of the remaining 5 tetrads, and in consequence, the intensities of the remaining signals
can be obtained.
Table 5.3: 1H-NMR spectra with tetrad resolution in the region of methylene group
resonance a) PVPA (4) from hydrolysis of PDMVP b) PVPA from polymerization of
VPA
a)
Signal at 1.18 2.03 1.75 1.46
Assignment of stereosequence mmm rrr+rmr mrm+rrm mmr
Relative intensity found 0.103 0.284 0.378 0.235
Relative intensity calculated 0.103 1)∗ 0.282 0.381 0.234
b)
Signal at 1.95 2.05 1.80 1.55
Assignment of stereosequence mmm rrr+rmr mrm+rrm mmr
Relative intensity found 0.125 0.213 0.478 0.184
Relative intensity calculated 2)∗ 0.103 0.278 0.378 0.241
∗ 1 Defined by the experimental intensity ∗ 2 After subtraction of contributions to signal intensities by protons labeled a and d.

Microstructure
101
The assignment of these intensities to the correct tetrad sequence was done after
considering all possible combinations of assignments that will produce the experimental
spectrum at the end. There are three possible combinations of the remaining tetrad
sequences with their calculated probabilities (Table 5.4). The first probability was chosen
because it produced the most consistent spectrum (giving rise to the minimum amount of
error) with the experimentally observed one.The assignment of the resonances is shown
in Figure 5.9 for PVPA (4) prepared by the hydrolysis of PDMVP. The consistency of
the calculated spectrum with the experimental one indicates that Bernouillian statistics
are valid to describe the probabilities of the tetrad sequences of PVPA (4). The 1H NMR
spectrum of PVPA (4) is consistent with a chain structure composed of head-to-tail
linked monomers of a nearly atactic configuration. Various tetrad sequences are drawn
both in two and three dimensional projection, and in ball-and stick models in Figure 5.10
and Figure 5.8, respectively.
The 13C-NMR spectrum of this polymer consists of two signals, a singlet at 35
ppm, and a doublet also centered at 35 ppm. The singlet was assigned to the methylene
carbon, and the doublet to the methine carbon. The doublet arises from hyperfine splitting
of the methine carbon with the phosphorous atom to which it was attached.
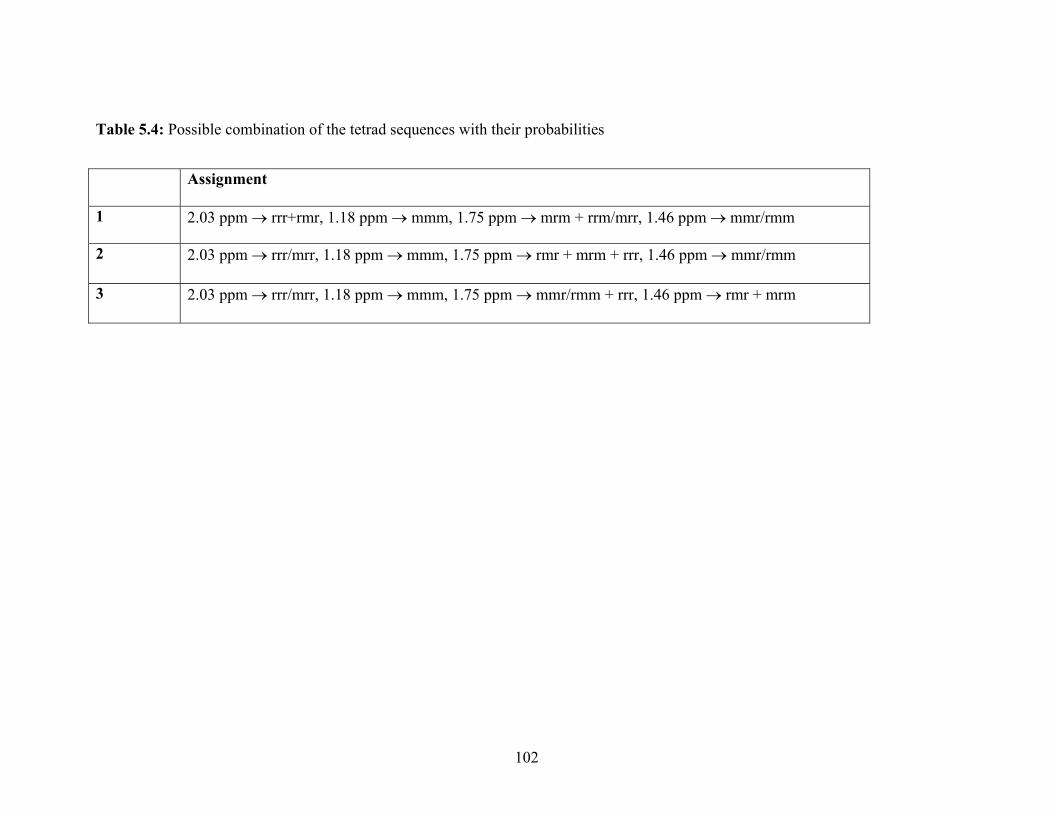
102
Table 5.4: Possible combination of the tetrad sequences with their probabilities
Assignment
1 2.03 ppm → rrr+rmr, 1.18 ppm → mmm, 1.75 ppm → mrm + rrm/mrr, 1.46 ppm → mmr/rmm
2 2.03 ppm → rrr/mrr, 1.18 ppm → mmm, 1.75 ppm → rmr + mrm + rrr, 1.46 ppm → mmr/rmm
3 2.03 ppm → rrr/mrr, 1.18 ppm → mmm, 1.75 ppm → mmr/rmm + rrr, 1.46 ppm → rmr + mrm
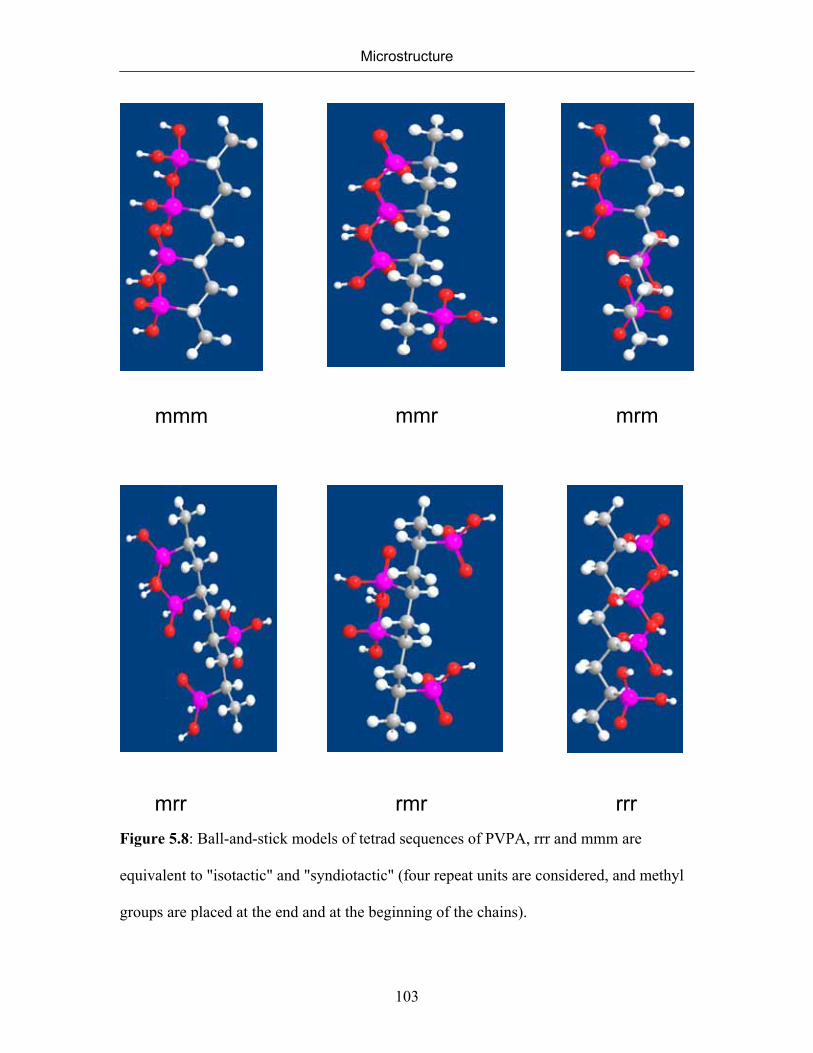
Microstructure
103
mmm mmr mrm
rrrrmrmrr Figure 5.8: Ball-and-stick models of tetrad sequences of PVPA, rrr and mmm are
equivalent to "isotactic" and "syndiotactic" (four repeat units are considered, and methyl
groups are placed at the end and at the beginning of the chains).
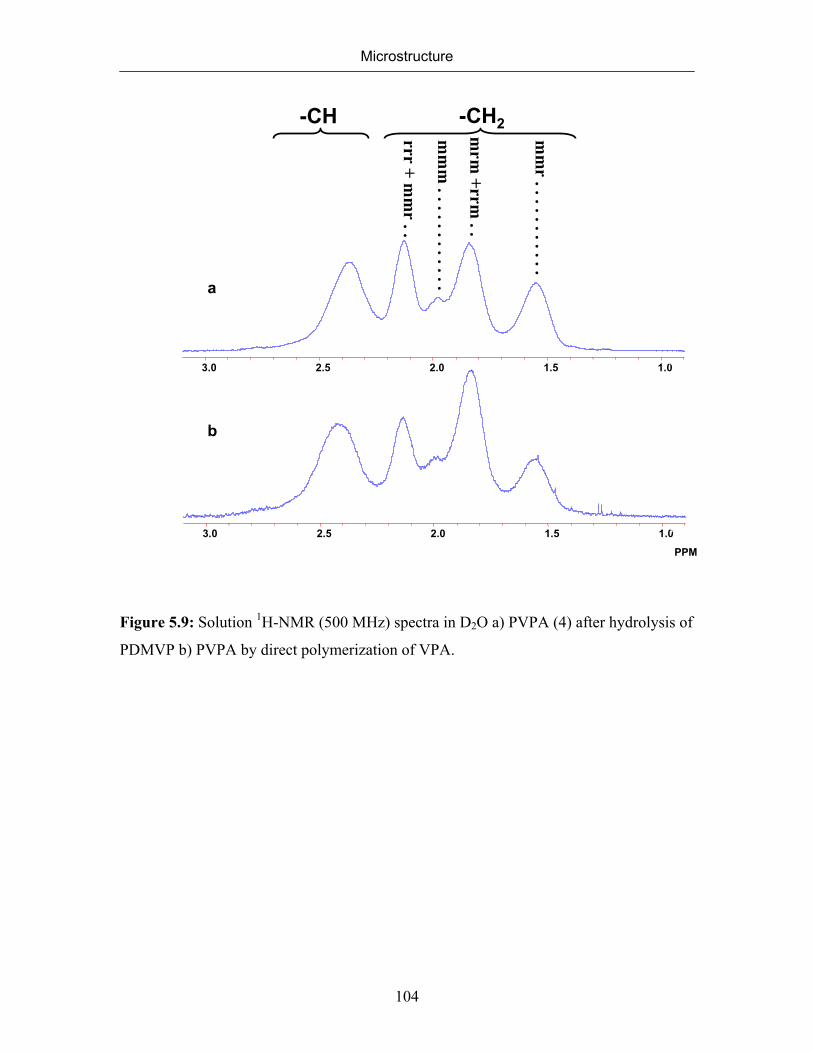
Microstructure
104
3.0 2.5 2.0 1.5 1.0PPM
b
3.0 2.5 2.0 1.5 1.0PPM
a
rrr+ m
mr
. .
mm
m. . . . . . . . . . . .
mrm
+rrm. .
mm
r. . . . . . . . . . .
-CH2-CH
PPM
Figure 5.9: Solution 1H-NMR (500 MHz) spectra in D2O a) PVPA (4) after hydrolysis of
PDMVP b) PVPA by direct polymerization of VPA.
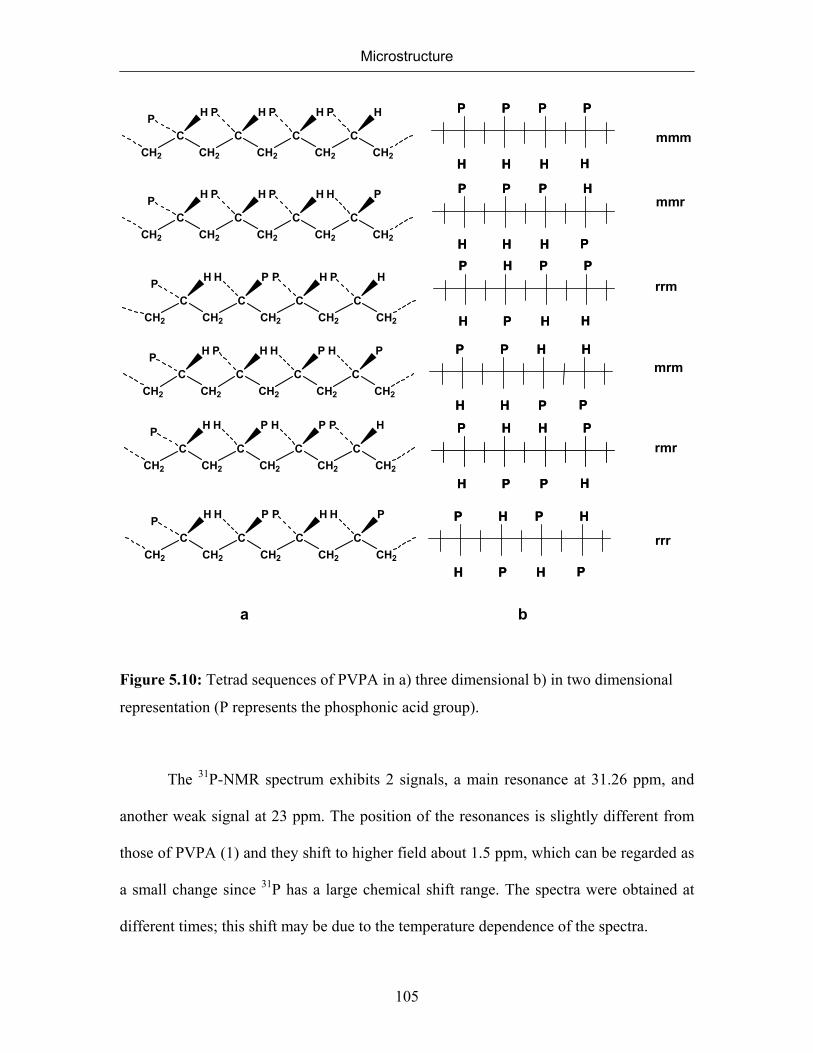
Microstructure
105
CH2
CCH2
CCH2
CCH2
CCH2
P H P H P H P H
CH2
CCH2
CCH2
CCH2
CCH2
P H P H P H H P
rmr
P P P P
H H H H
P P P P
H H H H
mmm
P P P H
H H H P
P P P H
H H H P
mmr
CH2
CCH2
CCH2
CCH2
CCH2
P H H P P H P HP H P P
H P H H
P H P P
H P H H
rrm
CH2
CCH2
CCH2
CCH2
CCH2
P H P H H P H P
CH2
CCH2
CCH2
CCH2
CCH2
P H H P H P P H
P P H H
H H P P
P P H H
H H P P
mrm
P H H P
H P P H
P H H P
H P P H
CH2
CCH2
CCH2
CCH2
CCH2
P H H P P H H P P H P H
H P H P
P H P H
H P H P
rrr
a b
Figure 5.10: Tetrad sequences of PVPA in a) three dimensional b) in two dimensional
representation (P represents the phosphonic acid group).
The 31P-NMR spectrum exhibits 2 signals, a main resonance at 31.26 ppm, and
another weak signal at 23 ppm. The position of the resonances is slightly different from
those of PVPA (1) and they shift to higher field about 1.5 ppm, which can be regarded as
a small change since 31P has a large chemical shift range. The spectra were obtained at
different times; this shift may be due to the temperature dependence of the spectra.

Microstructure
106
Figure 5.11: 31P-NMR (176.3 MHz) spectra of PVPA (4)(50 mg/0.8 mL D20) at pH 1.1
at 303 K
5.2.4 Assignment of the 1H-NMR Spectrum of PVPA (1) and Existence of the Defect
Species
The pattern of the resonances in the 1H-NMR spectrum of PVPA obtained by
radical polymerization of VPA (Figure 5.9b) looked similar to that of PVPA (4) obtained
by the hydrolysis of PDMVP, at first glance. However, the ratio of the signal intensities
was substantially different beyond experimental error. This becomes obvious comparing
the third row Table 5.3a with the equivalent row in Table 5.3b.
5 4 3 2 1 PP
Microstructure
107
In order to explain the observed intensity pattern we needed to assume a more
complicated structure of the polymer, PVPA (1). The nature of this complication
becomes obvious looking to the 13C-NMR spectra of PVPA (1) (Figure 5.7), which is
already explained in 5.1.2, and comparing it with the 13C NMR spectra of PVPA (4) (see
5.1.3). In short, comparing the 13C-NMR spectra of PVPA (1) and PVPA (4) showed that
PVPA synthesized by the polymerization of VPA has some other linkages additional to
those present in the PVPA that was prepared by the hydrolysis of PDMVP. PVPA (4)
only contains head-to-tail linkages. However, PVPA (1) also contains head-to-head and
tail-to-tail links additional to the head-to-tail links. Head-to-head and tail-to-tail links
form only during the polymerization of VPA since its polymerization proceeds over
cyclopolymerization. These additional linkages cause the differences in the relative
intensities of the resonances calculated and experimentally observed. To find out the
fraction of the head-to-head and tail-to-tail links present in PVPA (1), it was tried to
adjust the experimentally observed intensities of the resonances so that they become
equal to the relative intensities of the resonances of the methylene protons in PVPA (4).
Therefore, we need to subtract x and y from the relative intensity of the resonances
located at 1.8 ppm, and 1.95 ppm, respectively. Then the new total intensity of the
resonances due to the methylene sequences in PVPA (1) will be equal to (1-x-y).
Knowing these, we can set the relative intensities of the resonances of PVPA (1) in its
1H-NMR equal to those in the 1H-NMR spectrum of PVPA (4) to calculate the quantity
(x+y) by the following equations:
The new fraction of the resonance at 1.95 ppm among the methylene protons,
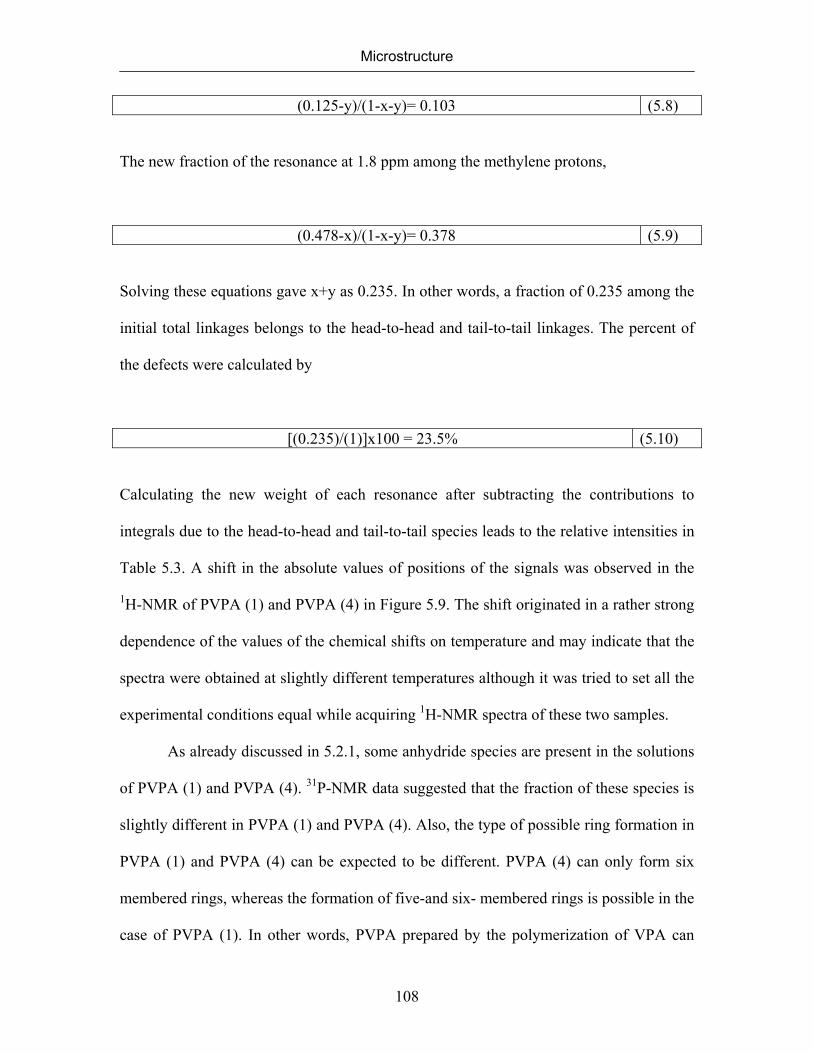
Microstructure
108
(0.125-y)/(1-x-y)= 0.103 (5.8)
The new fraction of the resonance at 1.8 ppm among the methylene protons,
(0.478-x)/(1-x-y)= 0.378 (5.9)
Solving these equations gave x+y as 0.235. In other words, a fraction of 0.235 among the
initial total linkages belongs to the head-to-head and tail-to-tail linkages. The percent of
the defects were calculated by
[(0.235)/(1)]x100 = 23.5% (5.10)
Calculating the new weight of each resonance after subtracting the contributions to
integrals due to the head-to-head and tail-to-tail species leads to the relative intensities in
Table 5.3. A shift in the absolute values of positions of the signals was observed in the
1H-NMR of PVPA (1) and PVPA (4) in Figure 5.9. The shift originated in a rather strong
dependence of the values of the chemical shifts on temperature and may indicate that the
spectra were obtained at slightly different temperatures although it was tried to set all the
experimental conditions equal while acquiring 1H-NMR spectra of these two samples.
As already discussed in 5.2.1, some anhydride species are present in the solutions
of PVPA (1) and PVPA (4). 31P-NMR data suggested that the fraction of these species is
slightly different in PVPA (1) and PVPA (4). Also, the type of possible ring formation in
PVPA (1) and PVPA (4) can be expected to be different. PVPA (4) can only form six
membered rings, whereas the formation of five-and six- membered rings is possible in the
case of PVPA (1). In other words, PVPA prepared by the polymerization of VPA can
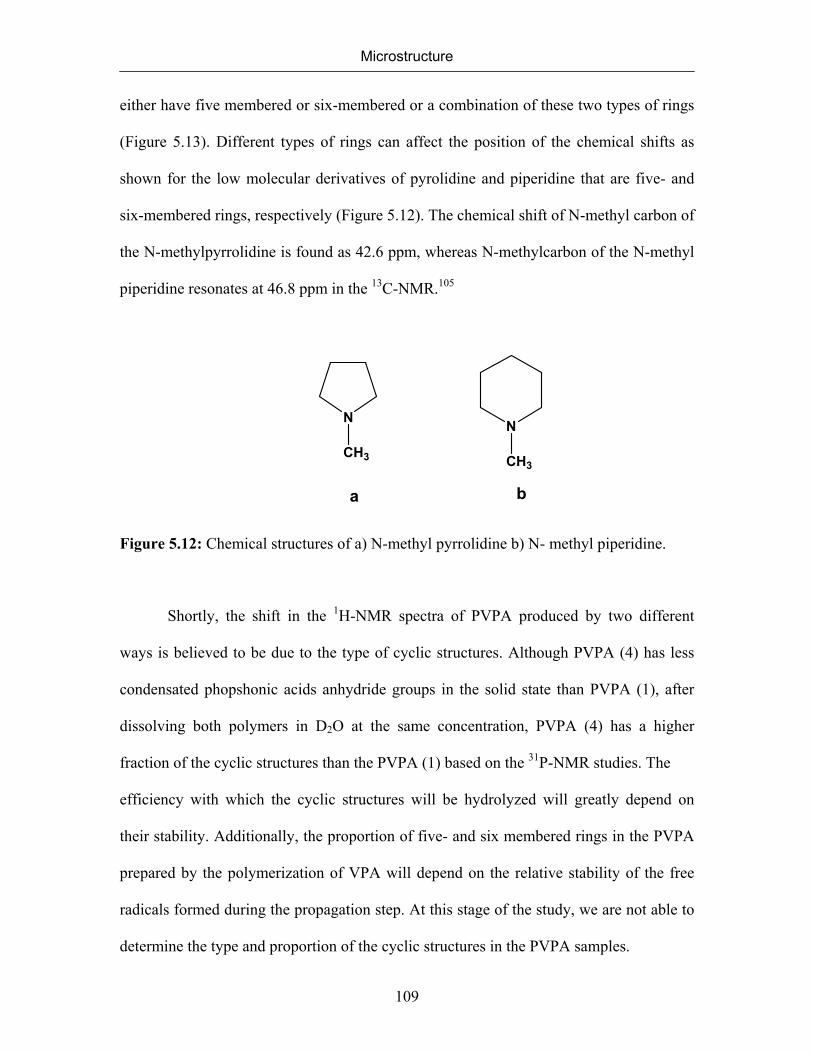
Microstructure
109
either have five membered or six-membered or a combination of these two types of rings
(Figure 5.13). Different types of rings can affect the position of the chemical shifts as
shown for the low molecular derivatives of pyrolidine and piperidine that are five- and
six-membered rings, respectively (Figure 5.12). The chemical shift of N-methyl carbon of
the N-methylpyrrolidine is found as 42.6 ppm, whereas N-methylcarbon of the N-methyl
piperidine resonates at 46.8 ppm in the 13C-NMR.105
N
CH3
N
CH3
a b
Figure 5.12: Chemical structures of a) N-methyl pyrrolidine b) N- methyl piperidine.
Shortly, the shift in the 1H-NMR spectra of PVPA produced by two different
ways is believed to be due to the type of cyclic structures. Although PVPA (4) has less
condensated phopshonic acids anhydride groups in the solid state than PVPA (1), after
dissolving both polymers in D2O at the same concentration, PVPA (4) has a higher
fraction of the cyclic structures than the PVPA (1) based on the 31P-NMR studies. The
efficiency with which the cyclic structures will be hydrolyzed will greatly depend on
their stability. Additionally, the proportion of five- and six membered rings in the PVPA
prepared by the polymerization of VPA will depend on the relative stability of the free
radicals formed during the propagation step. At this stage of the study, we are not able to
determine the type and proportion of the cyclic structures in the PVPA samples.
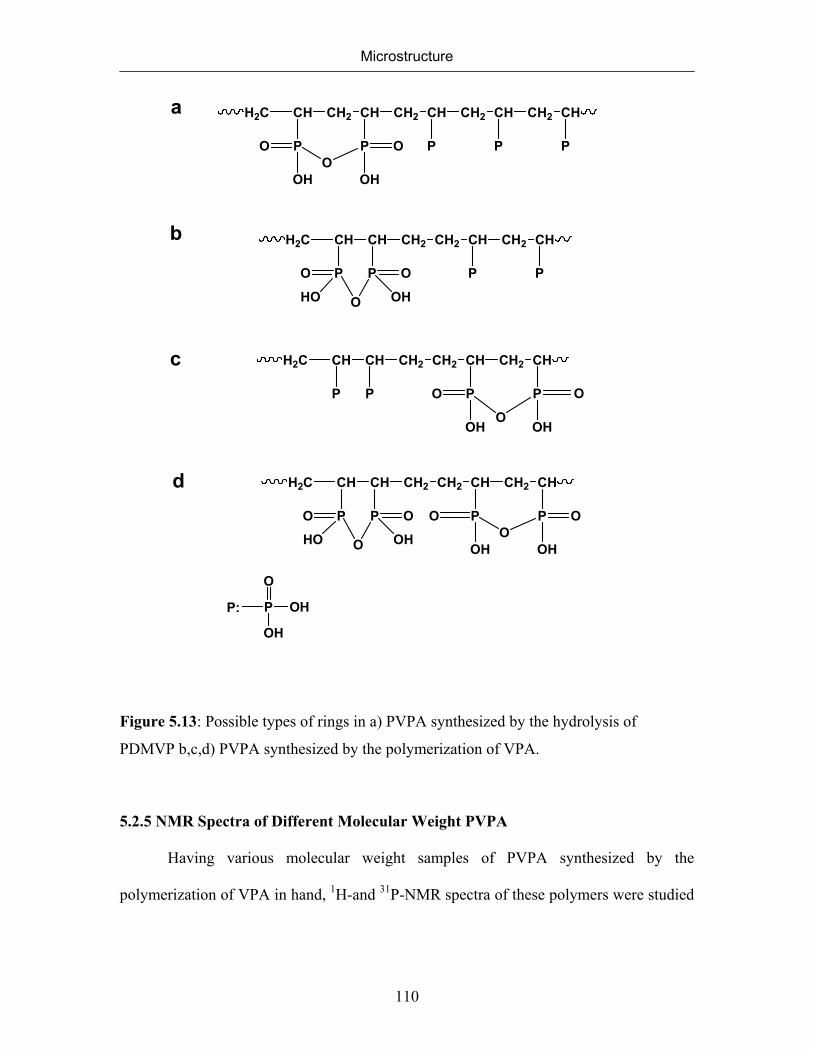
Microstructure
110
H2C CH
P
CH2 CH CH2
P
CH
P
CH2 CH CH2
P
CH
PO
OHO
O
OH
H2C CH
P
CH CH2 CH2 CH
P
CH2 CH
PP
O
O
OH
O
HO
H2C CH
P
CH CH2 CH2 CH
P
CH2 CH
PP
O
O
OHOH
O
H2C CH
P
CH CH2 CH2 CH
P
CH2 CH
PP
O
O
OH
O
HO OOO
OH OH
a
b
c
d
P: P
O
OH
OH
Figure 5.13: Possible types of rings in a) PVPA synthesized by the hydrolysis of
PDMVP b,c,d) PVPA synthesized by the polymerization of VPA.
5.2.5 NMR Spectra of Different Molecular Weight PVPA
Having various molecular weight samples of PVPA synthesized by the
polymerization of VPA in hand, 1H-and 31P-NMR spectra of these polymers were studied
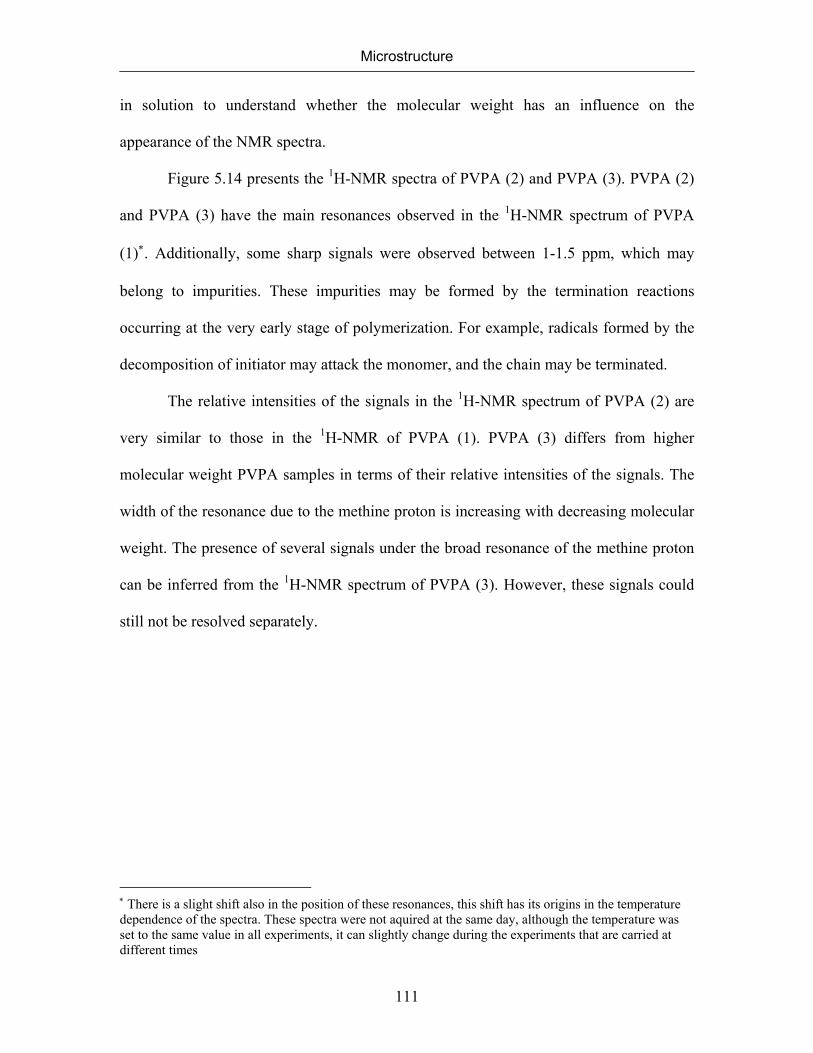
Microstructure
111
in solution to understand whether the molecular weight has an influence on the
appearance of the NMR spectra.
Figure 5.14 presents the 1H-NMR spectra of PVPA (2) and PVPA (3). PVPA (2)
and PVPA (3) have the main resonances observed in the 1H-NMR spectrum of PVPA
(1)∗. Additionally, some sharp signals were observed between 1-1.5 ppm, which may
belong to impurities. These impurities may be formed by the termination reactions
occurring at the very early stage of polymerization. For example, radicals formed by the
decomposition of initiator may attack the monomer, and the chain may be terminated.
The relative intensities of the signals in the 1H-NMR spectrum of PVPA (2) are
very similar to those in the 1H-NMR of PVPA (1). PVPA (3) differs from higher
molecular weight PVPA samples in terms of their relative intensities of the signals. The
width of the resonance due to the methine proton is increasing with decreasing molecular
weight. The presence of several signals under the broad resonance of the methine proton
can be inferred from the 1H-NMR spectrum of PVPA (3). However, these signals could
still not be resolved separately.
∗ There is a slight shift also in the position of these resonances, this shift has its origins in the temperature dependence of the spectra. These spectra were not aquired at the same day, although the temperature was set to the same value in all experiments, it can slightly change during the experiments that are carried at different times
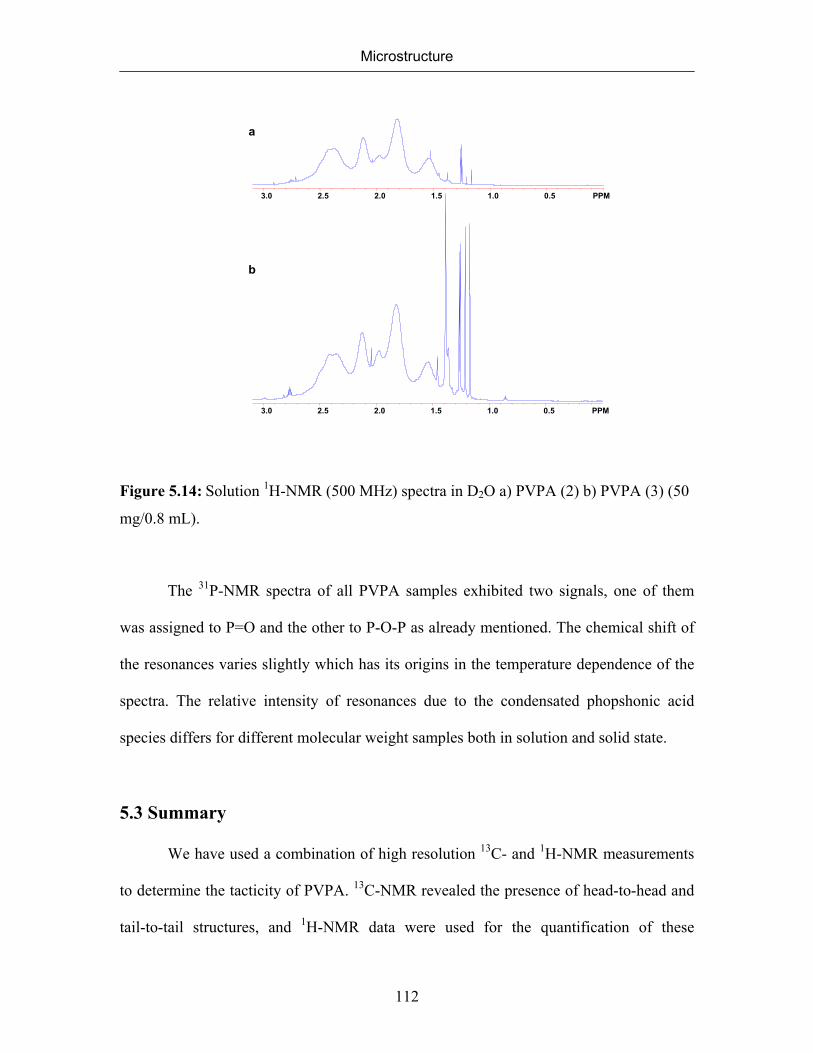
Microstructure
112
3.0 2.5 2.0 1.5 1.0 0.5 PPM
3.0 2.5 2.0 1.5 1.0 0.5 PPM
a
b
Figure 5.14: Solution 1H-NMR (500 MHz) spectra in D2O a) PVPA (2) b) PVPA (3) (50
mg/0.8 mL).
The 31P-NMR spectra of all PVPA samples exhibited two signals, one of them
was assigned to P=O and the other to P-O-P as already mentioned. The chemical shift of
the resonances varies slightly which has its origins in the temperature dependence of the
spectra. The relative intensity of resonances due to the condensated phopshonic acid
species differs for different molecular weight samples both in solution and solid state.
5.3 Summary
We have used a combination of high resolution 13C- and 1H-NMR measurements
to determine the tacticity of PVPA. 13C-NMR revealed the presence of head-to-head and
tail-to-tail structures, and 1H-NMR data were used for the quantification of these
Microstructure
113
structures. PVPA synthesized by free radical polymerization of VPA was found to be
nearly atactic. The assignment of the spectra and identification of the tacticity was
challenging having only one polymer with unknown tacticity and NMR spectra with
broad resonances. For the purpose of studying microstructure and tacticity of the
macromolecules, various polymer samples are needed that are obtained by different
techniques with different tacticities such as isotactic, syndiotactic and atactic. Having the
NMR spectra of the polymers that are purely isotactic and syndiotactic, the spectrum of a
polymer with unknown tacticity can be assigned. For example, to determine the tacticity
of PAA, isotactic and syndiotactic PAA were synthesized by different polymerization
techniques. The NMR spectra of PAA with unknown tacticity was assigned and the
tacticity was identified by comparing the NMR spectra of the PAA with unknown
tacticity with NMR spectra of isotactic and syndioactic PAA. This approach is used in the
identification of many other macromolecules such as poly(tert-butyl acrylate),106
poly(methylmethacrylate)107 etc.. However, there are not many alternatives for the
synthesis route of VPA. As already mentioned in Chapter 3, the anionic polymerization
of its diethyl ester failed. The only possible synthesis route is the free radical
polymerization of VPA an uncontrolled manner. The RAFT polymerization (which is a
controlled radical polymerization) was not successful yet in polymerizing the VPA
monomer.
The resolution of our 13C-and 1H-NMR spectra enables us to analyze the tacticity
of PVPA on a tetrad level. The NMR analysis of poly(methyl acrylate) has already been
achieved on a hexad level, and analysis of PAA has been reported at the pentad level.98 It
is important to be able to carry out the analysis of the polymers using as large
Microstructure
114
stereosequence as possible because more details about the microstructure of the polymers
can be discerned from the longer stereosequences. The fact that the resonances of PAA
both in its 1H- and 13C-NMR are better resolved than in the case of PVPA makes the
acquisition of only CH and CH2 spectra possible by irradiation with a suitable resonance
frequency. This gives important clue to the assignment of the peaks belonging to the
methylene and methine protons. However, acquisition of only CH or CH2 spectra was
impossible for PVPA due to the very close location of the signals belonging to methine
and methylene groups.
As a conclusion, the microstructure of PVPA was described for the first time by
high resolution NMR spectroscopy. Identification of the tacticity was possible by
comparing the NMR spectra of PVPA with different synthetic routes, which gave insight
to the polymerization mechanism of VPA. Investigation of the tacticity in vinyl polymers
is important since the tacticity determines many of their physical properties such as their
crystallizability, their softening or melting temperatures, and their mechanical
behavior.101 In the case of PVPA, stereochemistry may affect the condensation of
phosphonic acid groups which is an important parameter determining its conductivity.
CHAPTER 6
CONDUCTIVITY
6.1 Introduction
The interaction of electromagnetic radiation with matter gives rise to transitions
between the electronic, vibrational and rotational molecular energy states, which may be
observed by UV/visible and infra-red absorption frequencies above about 1012 Hz.
Absorptions due to the electric polarization and conduction processes are observed over
the entire range between 10-6 and 1012 Hz. The response of a material to the
electromagnetic waves in the frequency range between 10-6 and 1012 Hz may be observed
by Broadband Dielectric Spectroscopy. In this range, dipolar relaxations arising from the
reorientation motions of molecular dipoles and electrical conduction arising from the
translational motions of electric charge carriers take place. Dielectric Spectroscopy
provides important information about the dielectric properties of the material and
dynamics of bound and mobile charge carriers. The magnitude of the effects and the
frequency location of the energy absorption depends greatly on the physical and chemical
nature of a material, temperature and pressure at which the material is studied.108
Electrical conductivity is a measure of how well a material accommodates the
transport of electrical charge when potential is applied. The quantity of electrical charge
that passes in a conductor per unit time is the current. The current passing through unit
area perpendicular to the direction of flow is the current density j. The current density in
the x direction is proportional to the potential gradient.
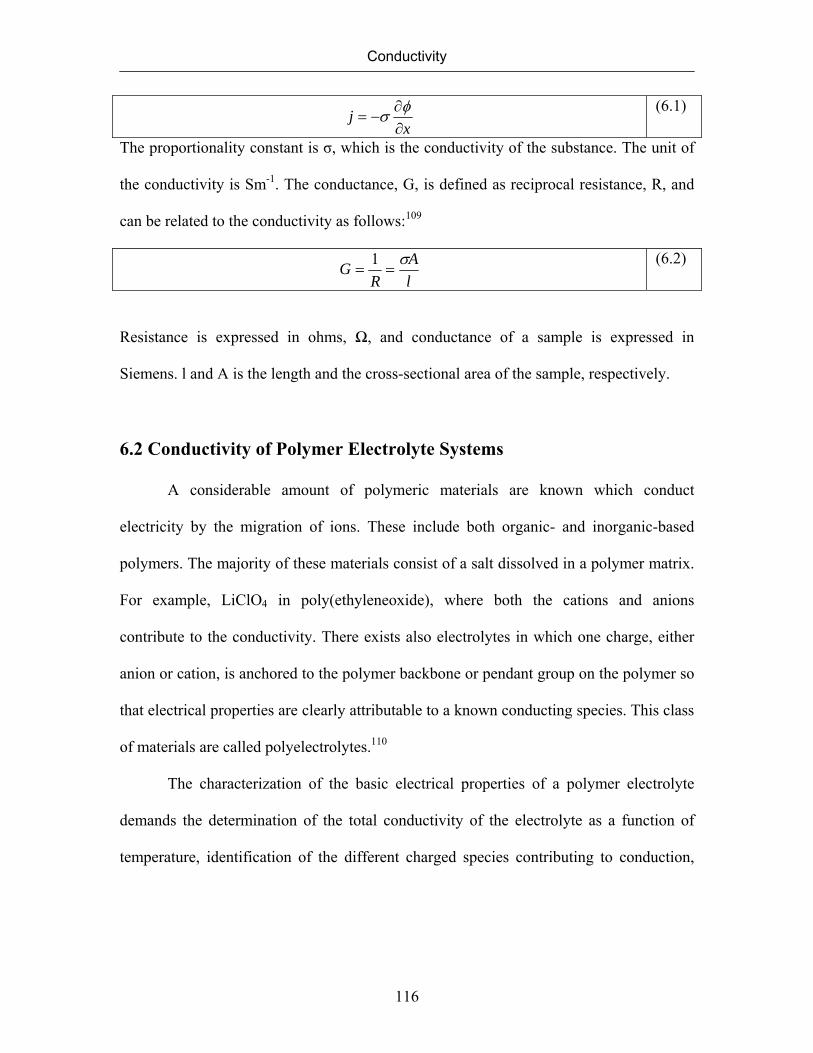
Conductivity
116
xj
∂∂
−=φσ
(6.1)
The proportionality constant is σ, which is the conductivity of the substance. The unit of
the conductivity is Sm-1. The conductance, G, is defined as reciprocal resistance, R, and
can be related to the conductivity as follows:109
lA
RG σ
==1
(6.2)
Resistance is expressed in ohms, Ω, and conductance of a sample is expressed in
Siemens. l and A is the length and the cross-sectional area of the sample, respectively.
6.2 Conductivity of Polymer Electrolyte Systems
A considerable amount of polymeric materials are known which conduct
electricity by the migration of ions. These include both organic- and inorganic-based
polymers. The majority of these materials consist of a salt dissolved in a polymer matrix.
For example, LiClO4 in poly(ethyleneoxide), where both the cations and anions
contribute to the conductivity. There exists also electrolytes in which one charge, either
anion or cation, is anchored to the polymer backbone or pendant group on the polymer so
that electrical properties are clearly attributable to a known conducting species. This class
of materials are called polyelectrolytes.110
The characterization of the basic electrical properties of a polymer electrolyte
demands the determination of the total conductivity of the electrolyte as a function of
temperature, identification of the different charged species contributing to conduction,

Conductivity
117
and transport numbers∗ as a function of temperature. Direct current, alternating current,
and transport number measurements are the main techniques discussed in the literature
for electrical characterization of ionically conducting polymers.111
6.3 Conductivity Measurements
6.3.1 Alternating Current Measurements
Alternating current (a.c.) methods represent the most popular approach to the
determination of the electrical properties of polymer electrolytes. Simple cells with
blocking electrodes may be used to determine the bulk electrolyte properties. Data
obtained by the alternating current methods carry information not only about the long-
range migration of ions but also about the polarization phenomena occurring within the
cell, such as relaxation of the trapped ions. 111
In an alternating current experiment, a sinusoidal voltage is applied to a cell and
the resulting sinusoidal current passing through the cell is determined. Two parameters
are required to relate the current flowing in consequence of the applied voltage. One of
V (t)
t
t
I (t)
V0
I0
V (t)
t
t
I (t)
V0
I0
∗ Transference number indicates the fraction of the current carried by each charged species

Conductivity
118
Figure 6.1: Representation of the sinusoidal voltage and current at a given frequency, V=
voltage, I = current, φ = phase difference between the potential and current.
these parameters represents the resistance and is equal to the ratio of the voltage and
current maxima, V max / I max. The other parameter, φ, is the phase shift between the
voltage and current. The combination of these two parameters represents the impedance,
Z, of the cell. Generally, both the magnitude of the impedance | Z | = V max / I max and its
phase angle φ are functions of the applied frequency. The impedance is measured as a
function of the frequency of the applied signal over a wide frequency range, typically
from 1mHz to 1 MHz. Impedance is a vectorial quantity, possessing both magnitude and
phase.
)sin()( 0 tVtV ω= (6.3)
)sin()( 0 φω += tItI (6.4)
where ω is the frequency.
x-axis
y-axis
Z" | Z | sin φ
| Z | cos φ
Z'
...
)
x-axis
y-axis
Z" | Z | sin φ
| Z | cos φ
Z'
...
) φ
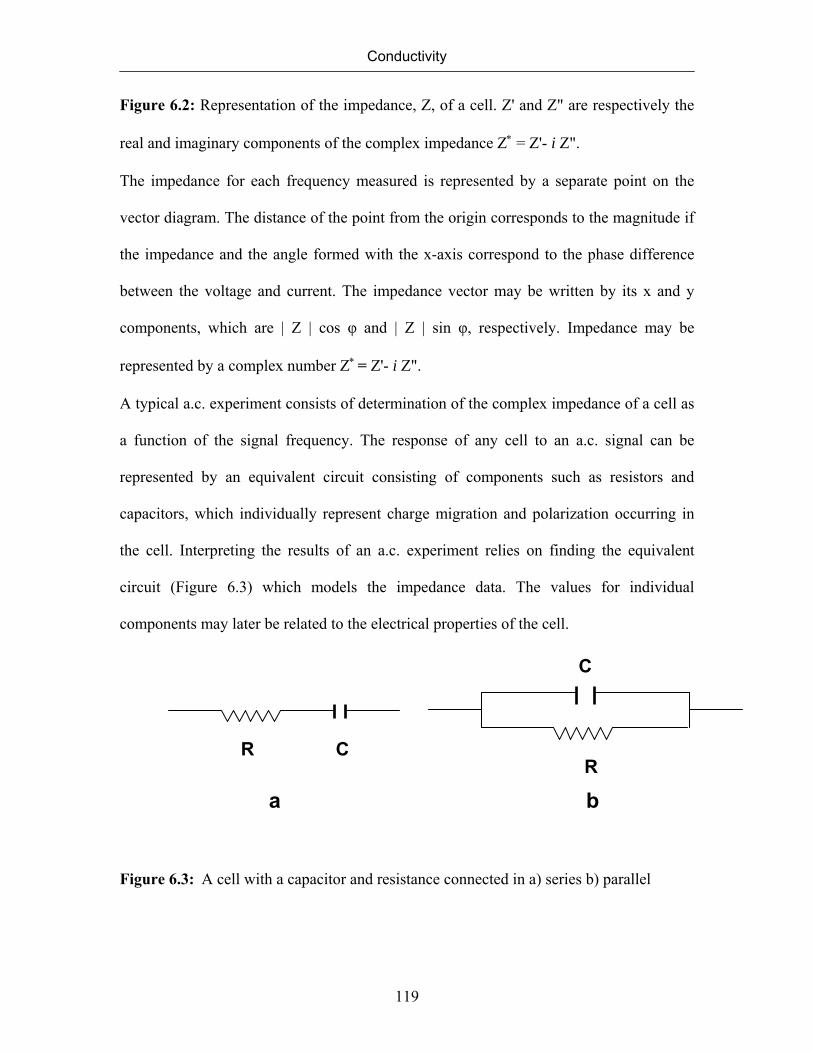
Conductivity
119
Figure 6.2: Representation of the impedance, Z, of a cell. Z' and Z" are respectively the
real and imaginary components of the complex impedance Z∗ = Z'- i Z".
The impedance for each frequency measured is represented by a separate point on the
vector diagram. The distance of the point from the origin corresponds to the magnitude if
the impedance and the angle formed with the x-axis correspond to the phase difference
between the voltage and current. The impedance vector may be written by its x and y
components, which are | Z | cos φ and | Z | sin φ, respectively. Impedance may be
represented by a complex number Z∗ = Z'- i Z".
A typical a.c. experiment consists of determination of the complex impedance of a cell as
a function of the signal frequency. The response of any cell to an a.c. signal can be
represented by an equivalent circuit consisting of components such as resistors and
capacitors, which individually represent charge migration and polarization occurring in
the cell. Interpreting the results of an a.c. experiment relies on finding the equivalent
circuit (Figure 6.3) which models the impedance data. The values for individual
components may later be related to the electrical properties of the cell.
Figure 6.3: A cell with a capacitor and resistance connected in a) series b) parallel
C
R R C
a b

Conductivity
120
A sinusoidal voltage applied to a resistor is always in the phase with the current passing
through it. In other words, φ = 0 and the magnitude of the impedance is simply given by
the resistance | Z | = R. The impedance is independent of the frequency. When a
sinusoidal voltage is applied to a capacitor, voltage lags behind the current by 90˚, i.e. φ=
- π/2. In this case, the magnitude of the impedance is frequency-dependent.:
CZ
ω1
= (6.5)
where C represents the capacitance.
The impedance of an equivalent circuit is calculated by summation of impedances of the
individual circuit elements as shown in Figure 6.3. When the components are connected
together in series, the individual impedances are directly additive.
RC ZZZ += (6.6)
RZR = and Ci
Zcω1
= (6.7)
CiZc
ω1
= (6.8)
Inserting (6.7) and (6.8) into the Equation (6.6), total impedance of a cell consisting of a
resistor and capacitor in series (Figure 6.3a) can be found as
CiRZ
ω−=∗
(6.9)
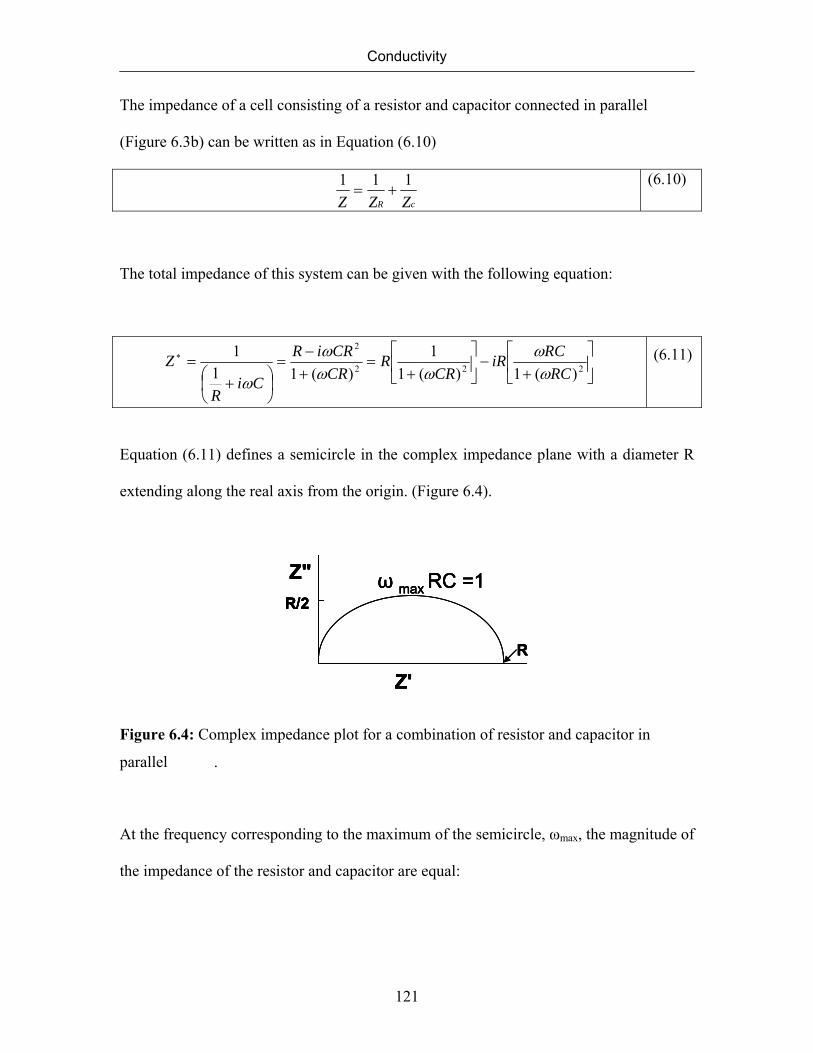
Conductivity
121
The impedance of a cell consisting of a resistor and capacitor connected in parallel
(Figure 6.3b) can be written as in Equation (6.10)
cR ZZZ111
+= (6.10)
The total impedance of this system can be given with the following equation:
⎥⎦
⎤⎢⎣
⎡+
−⎥⎦
⎤⎢⎣
⎡+
=+−
=⎟⎠⎞
⎜⎝⎛ +
=∗222
2
)(1)(11
)(111
RCRCiR
CRR
CRCRiR
CiR
Zω
ωωω
ω
ω (6.11)
Equation (6.11) defines a semicircle in the complex impedance plane with a diameter R
extending along the real axis from the origin. (Figure 6.4).
Z'
Z"R/2
R
ω max RC =1
Z'
Z"R/2
R
ω max RC =1
Z'
Z"R/2
R
ω max RC =1
Z'
Z"R/2
R
ω max RC =1
Figure 6.4: Complex impedance plot for a combination of resistor and capacitor in
parallel .
At the frequency corresponding to the maximum of the semicircle, ωmax, the magnitude of
the impedance of the resistor and capacitor are equal:
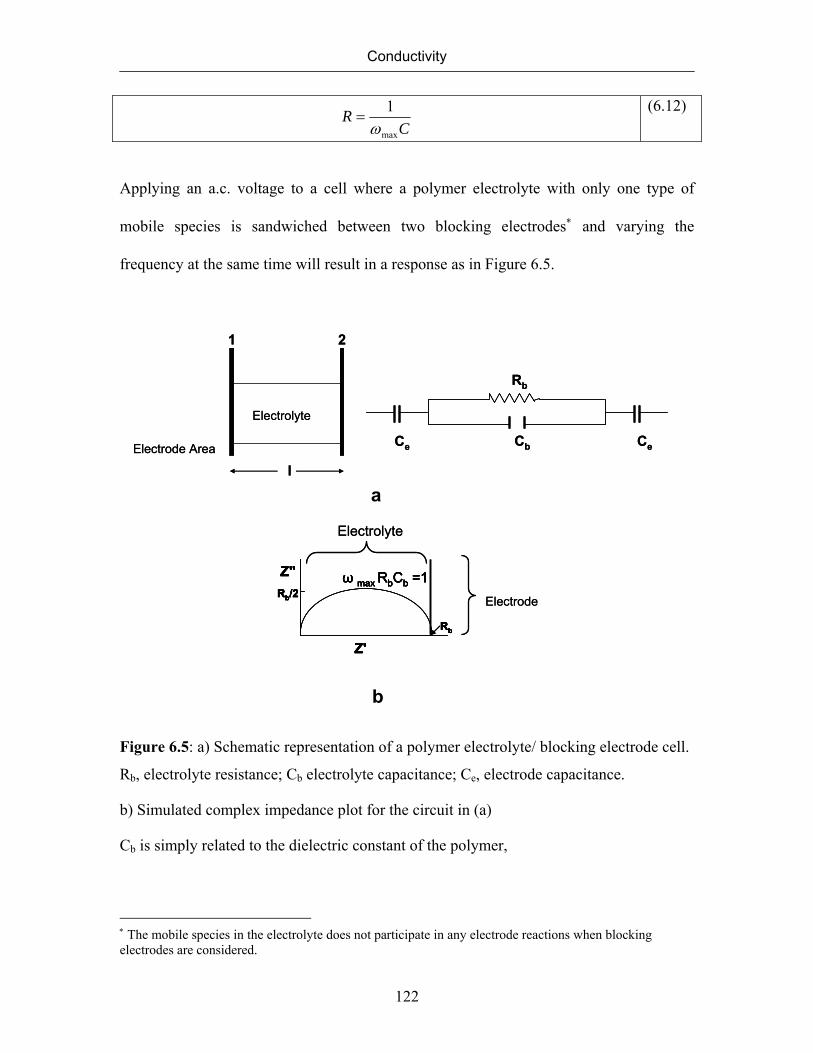
Conductivity
122
CR
max
1ω
= (6.12)
Applying an a.c. voltage to a cell where a polymer electrolyte with only one type of
mobile species is sandwiched between two blocking electrodes∗ and varying the
frequency at the same time will result in a response as in Figure 6.5.
l
Electrolyte
1 2
Electrode Area
l
Electrolyte
1 2
Electrode Area
Rb
CeCe Cb
Rb
CeCe Cb
a
Z'
Z"Rb/2
Rb
ω max RbCb =1Electrode
Electrolyte
Z'
Z"Rb/2
Rb
ω max RbCb =1
Z'
Z"Rb/2
Rb
ω max RbCb =1
Z'
Z"Rb/2
Rb
ω max RbCb =1
Z'
Z"Rb/2
Rb
ω max RbCb =1Electrode
Electrolyte
b
Figure 6.5: a) Schematic representation of a polymer electrolyte/ blocking electrode cell.
Rb, electrolyte resistance; Cb electrolyte capacitance; Ce, electrode capacitance.
b) Simulated complex impedance plot for the circuit in (a)
Cb is simply related to the dielectric constant of the polymer,
∗ The mobile species in the electrolyte does not participate in any electrode reactions when blocking electrodes are considered.
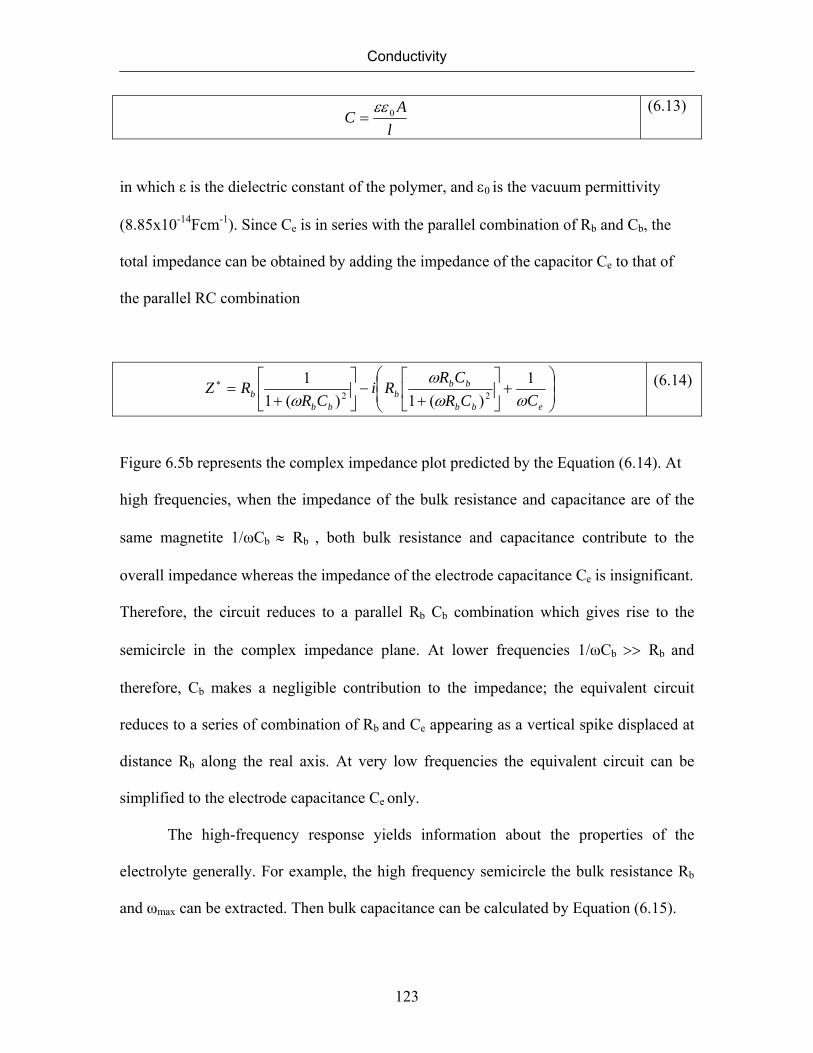
Conductivity
123
lA
C 0εε=
(6.13)
in which ε is the dielectric constant of the polymer, and ε0 is the vacuum permittivity
(8.85x10⁻¹⁴Fcm-1). Since Ce is in series with the parallel combination of Rb and Cb, the
total impedance can be obtained by adding the impedance of the capacitor Ce to that of
the parallel RC combination
⎟⎟⎠
⎞⎜⎜⎝
⎛+⎥
⎦
⎤⎢⎣
⎡+
−⎥⎦
⎤⎢⎣
⎡+
=∗
ebb
bbb
bbb CCR
CRRi
CRRZ
ωωω
ω1
)(1)(11
22 (6.14)
Figure 6.5b represents the complex impedance plot predicted by the Equation (6.14). At
high frequencies, when the impedance of the bulk resistance and capacitance are of the
same magnetite 1/ωCb ≈ Rb , both bulk resistance and capacitance contribute to the
overall impedance whereas the impedance of the electrode capacitance Ce is insignificant.
Therefore, the circuit reduces to a parallel Rb Cb combination which gives rise to the
semicircle in the complex impedance plane. At lower frequencies 1/ωCb >> Rb and
therefore, Cb makes a negligible contribution to the impedance; the equivalent circuit
reduces to a series of combination of Rb and Ce appearing as a vertical spike displaced at
distance Rb along the real axis. At very low frequencies the equivalent circuit can be
simplified to the electrode capacitance Ce only.
The high-frequency response yields information about the properties of the
electrolyte generally. For example, the high frequency semicircle the bulk resistance Rb
and ωmax can be extracted. Then bulk capacitance can be calculated by Equation (6.15).
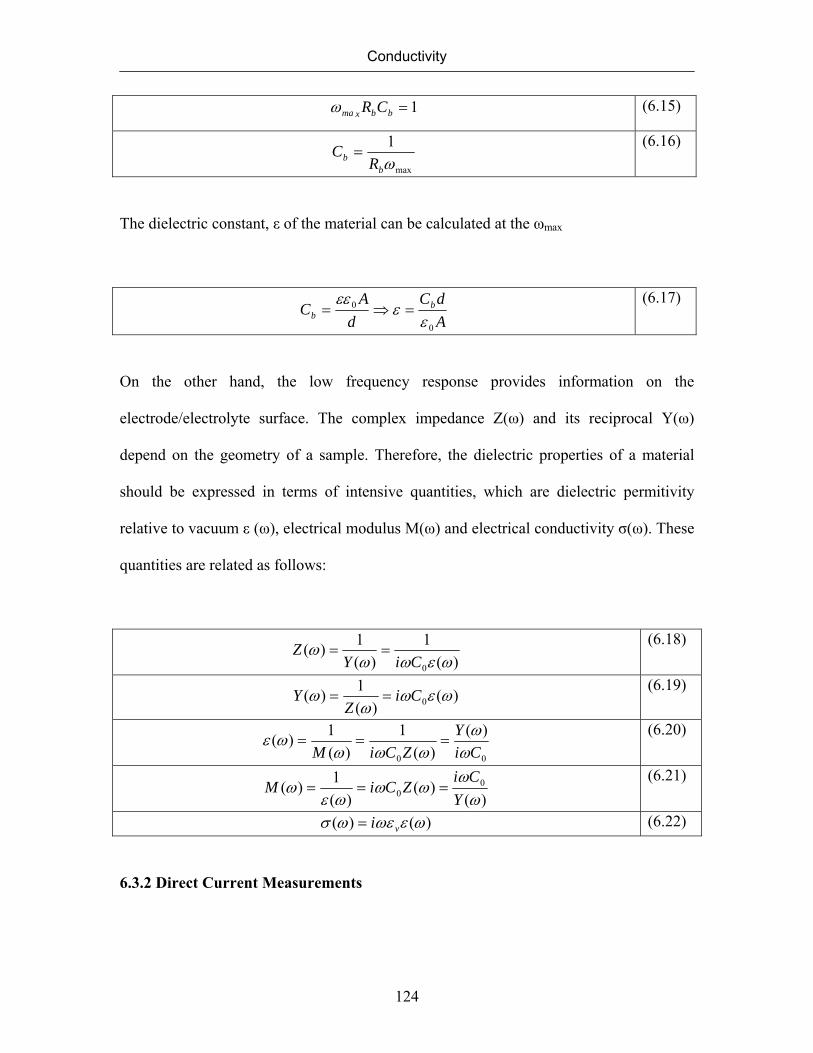
Conductivity
124
1=bbxma CRω (6.15)
max
1ωb
b RC =
(6.16)
The dielectric constant, ε of the material can be calculated at the ωmax
AdC
dA
C bb
0
0
εε
εε=⇒=
(6.17)
On the other hand, the low frequency response provides information on the
electrode/electrolyte surface. The complex impedance Z(ω) and its reciprocal Y(ω)
depend on the geometry of a sample. Therefore, the dielectric properties of a material
should be expressed in terms of intensive quantities, which are dielectric permitivity
relative to vacuum ε (ω), electrical modulus M(ω) and electrical conductivity σ(ω). These
quantities are related as follows:
)(1
)(1)(
0 ωεωωω
CiYZ ==
(6.18)
)()(
1)( 0 ωεωω
ω CiZ
Y == (6.19)
00
)()(
1)(
1)(Ci
YZCiM ω
ωωωω
ωε === (6.20)
)()(
)(1)( 0
0 ωω
ωωωε
ωY
CiZCiM ===
(6.21)
)()( ωεωεωσ vi= (6.22)
6.3.2 Direct Current Measurements
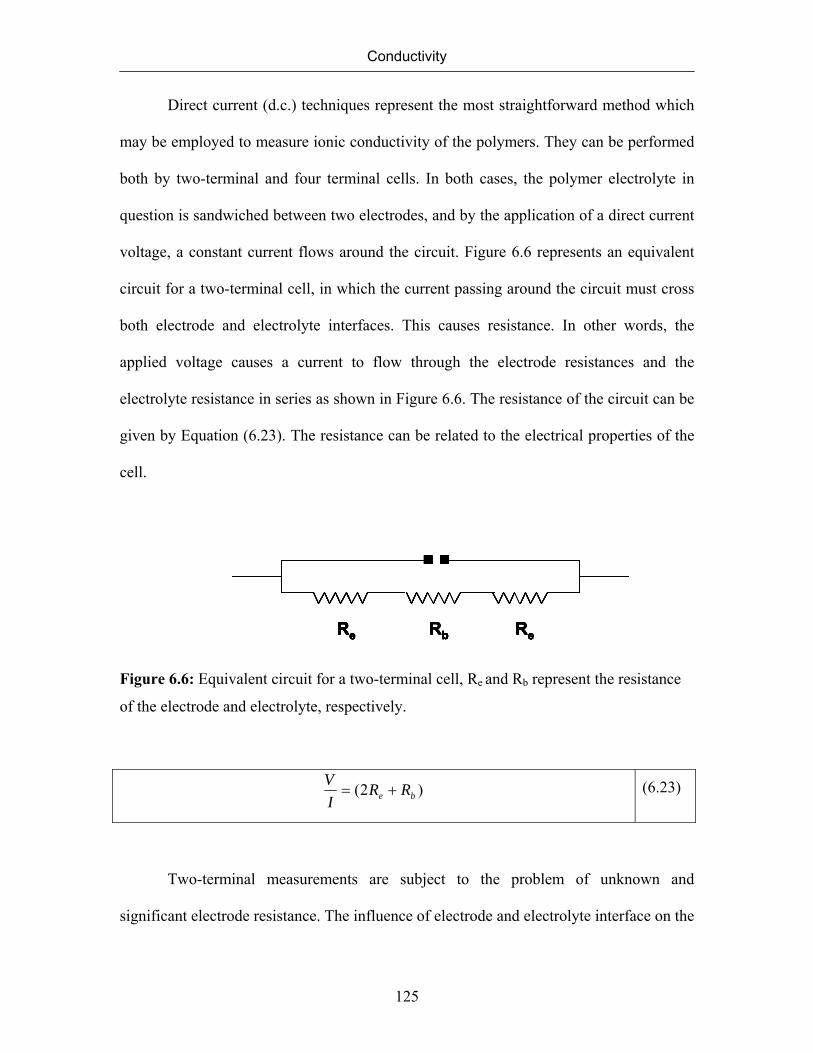
Conductivity
125
Direct current (d.c.) techniques represent the most straightforward method which
may be employed to measure ionic conductivity of the polymers. They can be performed
both by two-terminal and four terminal cells. In both cases, the polymer electrolyte in
question is sandwiched between two electrodes, and by the application of a direct current
voltage, a constant current flows around the circuit. Figure 6.6 represents an equivalent
circuit for a two-terminal cell, in which the current passing around the circuit must cross
both electrode and electrolyte interfaces. This causes resistance. In other words, the
applied voltage causes a current to flow through the electrode resistances and the
electrolyte resistance in series as shown in Figure 6.6. The resistance of the circuit can be
given by Equation (6.23). The resistance can be related to the electrical properties of the
cell.
.Rb ReRe
..Rb ReRe
..Rb ReRe
..Rb ReRe
..Rb ReRe
.Rb ReRe
....
Figure 6.6: Equivalent circuit for a two-terminal cell, Re and Rb represent the resistance
of the electrode and electrolyte, respectively.
)2( be RRIV
+= (6.23)
Two-terminal measurements are subject to the problem of unknown and
significant electrode resistance. The influence of electrode and electrolyte interface on the

Conductivity
126
measurements can be eliminated by adding another two electrodes. This makes the direct
determination of the electrolyte conductivity possible. In a four-terminal cell, two
electrodes serve only to pass a constant current through the cell whereas the other two
electrodes act purely as voltage probes measuring the potential drop across a region of the
electrolyte. The key to the elimination of the electrode resistances lies in the separation of
the electrodes passing the current from those measuring the voltage.111
6.4 Transport Processess
Ionic transport in solids are described in terms of number of charges per carrier qi,
number of charge carriers per unit volume ni, and the average mobility μi in an electric
field.112 The expression conductivity is the sum of all i carriers contribution
(Equation(6.24)):
)()()( TTnqT iii μσ Σ= (6.24)
The ion conductivity is related to the self diffusion coefficient, D, of the charged
specied by the Nernst-Einstein Equation.
knq
DT 2
=σ
(6.25)
where k is the Boltzmann constant.
Mobility is related to the diffusion coefficient by the following relation:

Conductivity
127
kTqD
=μ (6.26)
Temperature dependence of the ion hopping based conductivity in solids is
described by Arrhenius equation (Equation (6.27)).
⎟⎠⎞
⎜⎝⎛ −
=RT
Eaexp0σσ (6.27)
where Ea, R, T, σ0 present the activation energy, gas constant, and temperature, and
preexponential factor, respectively.
In Arrhenius type of behavior, activation energy (energy barrier height) is the rate
determining factor in the conduction process. Motion of ions in the polymer matrix is
a thermally activated process based on hopping over energy barrier of ions posessing
enough energy. With increasing temperature, more charged species posses enough energy
to overcome the barrier. Therefore, the conductivity increases with increasing
temperature. The preexponential factor is the limiting conductivity of the material at
infinite temperature.
The temperature dependence of the conductivity in polymer electrolytes has often
been taken as being indicative of a particular type of conduction mechanism.111, 113 In
particular, a distinction is generally made between systems that show an Arrhenius type
behavior and those that present a curvature in plots of log σ versus inverse temperature.

Conductivity
128
Empirical equations based on the free-volume theory such as the Vogel-Tamman-Fulcher
(VTF) equation (6.28) and Williams-Landel-Ferry (WLF) equation (6.29) have been used
to describe the curvature of the log σ versus inverse temperature plots.
⎟⎟⎠
⎞⎜⎜⎝
⎛−
−=
)(exp
00
TTBσσ (6.28)
where T0 is a reference temperature and σ0 contains a T-1/2 term in addition to other
constants. A time-temperature superposition holds which allows to correlate data
obtained at different frequencies and temperature by a shift factor∗, aT. A and B are
experimental constants frequently found as A= -17.44 and B=51.6. Tg is the glass
transition temperature.111
g
gT
TTBTTAa−+
−=
)(log (6.29)
6.5 A Mechanism for Iontransport by Funke
In solid electrolytes mass and charge are generally transported by the hopping
motion of charged defects. The mobile defects may be vacancies or disordered ions. The
hopping motion of the charged defects is strongly influenced by their repulsive
interaction. Understanding of the macroscopic properties like conductivity requires
consideration of the interactions between the mobile defects.114 In case of strong dilute
strong liquid electrolytes, models considering the Coulomb interaction among ions were
introduced by Debye, Hückel, Onsager, and Falkenhagen.115-117 A model for the
∗ Shift factor is the ratio of any mechanical relaxation process at temperature T to its value at some refence temperature.
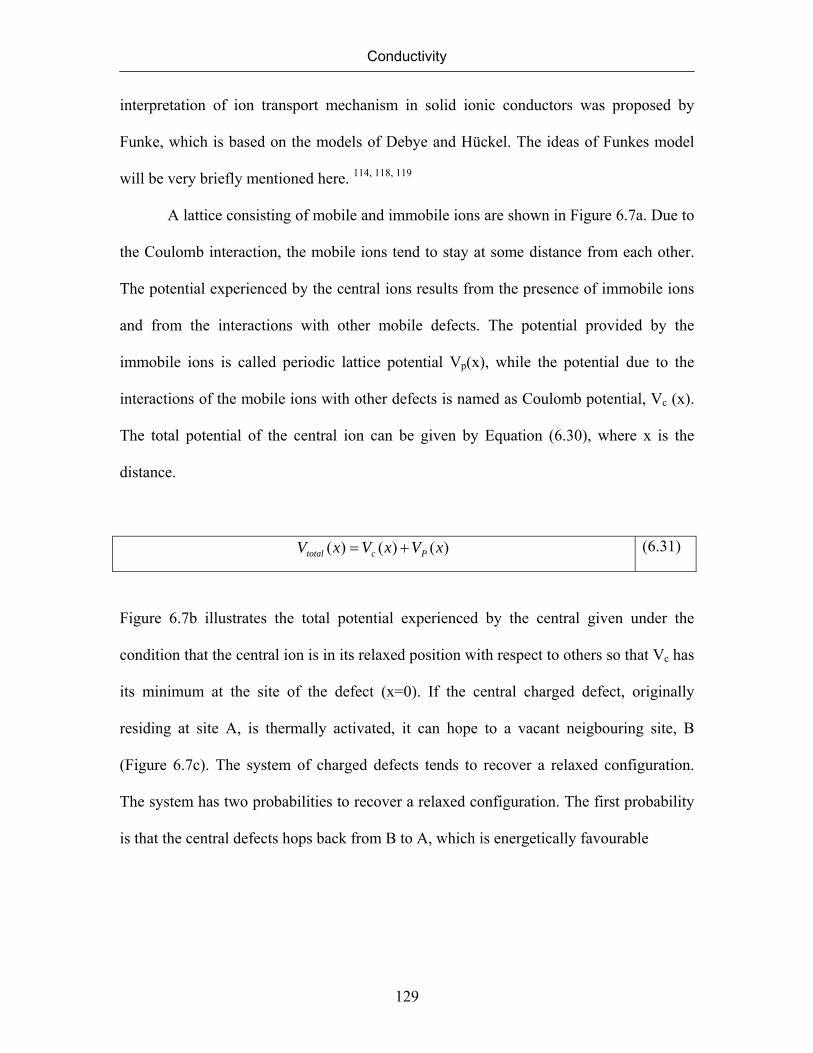
Conductivity
129
interpretation of ion transport mechanism in solid ionic conductors was proposed by
Funke, which is based on the models of Debye and Hückel. The ideas of Funkes model
will be very briefly mentioned here. 114, 118, 119
A lattice consisting of mobile and immobile ions are shown in Figure 6.7a. Due to
the Coulomb interaction, the mobile ions tend to stay at some distance from each other.
The potential experienced by the central ions results from the presence of immobile ions
and from the interactions with other mobile defects. The potential provided by the
immobile ions is called periodic lattice potential Vp(x), while the potential due to the
interactions of the mobile ions with other defects is named as Coulomb potential, Vc (x).
The total potential of the central ion can be given by Equation (6.30), where x is the
distance.
)()()( xVxVxV Pctotal += (6.31)
Figure 6.7b illustrates the total potential experienced by the central given under the
condition that the central ion is in its relaxed position with respect to others so that Vc has
its minimum at the site of the defect (x=0). If the central charged defect, originally
residing at site A, is thermally activated, it can hope to a vacant neigbouring site, B
(Figure 6.7c). The system of charged defects tends to recover a relaxed configuration.
The system has two probabilities to recover a relaxed configuration. The first probability
is that the central defects hops back from B to A, which is energetically favourable
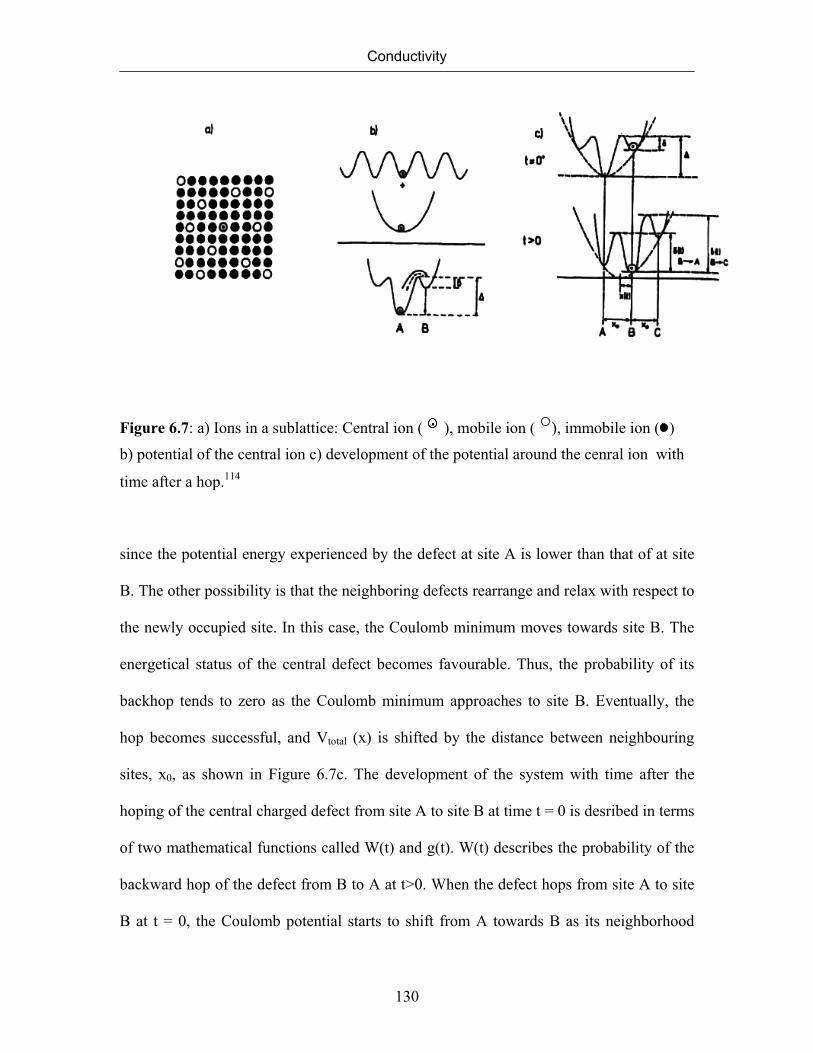
Conductivity
130
Figure 6.7: a) Ions in a sublattice: Central ion ( .. ), mobile ion ( ), immobile ion ( )
b) potential of the central ion c) development of the potential around the cenral ion with
time after a hop.114
since the potential energy experienced by the defect at site A is lower than that of at site
B. The other possibility is that the neighboring defects rearrange and relax with respect to
the newly occupied site. In this case, the Coulomb minimum moves towards site B. The
energetical status of the central defect becomes favourable. Thus, the probability of its
backhop tends to zero as the Coulomb minimum approaches to site B. Eventually, the
hop becomes successful, and Vtotal (x) is shifted by the distance between neighbouring
sites, x0, as shown in Figure 6.7c. The development of the system with time after the
hoping of the central charged defect from site A to site B at time t = 0 is desribed in terms
of two mathematical functions called W(t) and g(t). W(t) describes the probability of the
backward hop of the defect from B to A at t>0. When the defect hops from site A to site
B at t = 0, the Coulomb potential starts to shift from A towards B as its neighborhood
Conductivity
131
starts to relax. The shift of the Coulomb potential is described the function g(t). The
mathematical equations for these two functions are not given in this work.
6.6 Solid State Nuclear Magnetic Resonance
Knowledge concerning the chemical environment and proton motion is crucial for
understanding the conduction mechanism of proton conducting materials. Impedance
spectroscopy has been the most standard method to study the proton conducting
materials. It yields bulk conductivity data through the measurement of charge transport
but it does not directly provide information about the local mobility. Solid State NMR
spectroscopy is a powerful probe of ion motion on the molecular level since it allows us
to selectively observe the nuclei of interest.120, 121 Such information is helpful to give a
fundamental understanding of the observed differences in the proton conductivity. 1H
chemical shift values provide information about the chemical environments of the
protons and the line widths at various temperatures give an insight into the mobility. 1H-
NMR spectrum of solid polymers often exhibits severely broad signals due to the strong
1H-1H homonuclear dipolar coupling∗ and the random orientation of the molecule. In
recent years, fast magic angle spinning (MAS) has been used to average the 1H-1H
dipolar couplings∗ and thereby achieve high resolution spectra for organic solids. For
MAS NMR experiments, the sample is inclined by a specific angle (the magnitude of the
magic angle is 54.74°122) with regards to the magnetic field and spun fast during the
∗ The dominant interaction is the dipole-dipole coupling in solids. It is based on the interaction of the small local fields of the nuclear magnetic moments. Therefore, dipole-dipole coupling is independent of the applied magnetic field and depends on the spatial arrangement of the nuclei. The strength of the coupling decreases as the internuclear distance increases. In liquids, ions and molecules reorient rapidly on the NMR time scale. As a conseqeunce the direct dipole-dipole interactions are cancelled by motional averaging.
Conductivity
132
signal acquisition. This can effectively reduce or removes the aniosotropic interactions.
are averaged out. However, since the strength of dipolar interactions can be used to
determine the relative mobility of protons, methods which can selectively retrieve
information about the dipolar interaction removed by MAS are useful. Double quantum
filtering pulse sequences such as back-to-back allows us to recouple the dipolar couplings
between the protons which are rigid on the time scale of the pulse sequence and which
are close to each other in space.
The results of some Solid State NMR experiments that are important for the
discussion of conductivity behavior of PVPA are briefly mentioned in this chapter. The
details of the NMR techniques are not given here.
6.7 Conductivity of PVPA
PVPA is an interesting macromolecule with the highest density of phopshonic
acid functions tethered to the polymer backbone. As already mentioned in Chapter 1, the
details of the polymerization of VPA and the properties of the polymer were studied since
PVPA is a potential candidate to be a component of PEMs in a low humidity
environment at operating temperatures higher than 100 °C. There is no detailed report
about the proton conducting properties of homopolymer to the best of our knowledge
other than commercially available PVPA, which was only briefly mentioned in a
comparison with its composites.30 This chapter presents the conducting properties of
"pure" PVPA as the key constituent of polymer electrolyte membranes. The formation of
phosphonic acid anhydrides influences the conductivity of PVPA to a large extent.
Conductivity
133
Dielectric Spectroscopy was used to investigate the conductivity and Solid State
NMR was suggested as a tool to detect and quantify the anhydride formation in
phopshonic acid species for the first time. PVPA with different molecular weight and
microstructure were investigated in terms of their proton conductivity as well as self-
condensation of the phosphonic acid groups to have a better understanding of
relationships between structure and property.
6.7.1 Temperature Dependence of Conductivity of PVPA
The proton conductivity behavior of PVPA of known molecular weight, and
microstructure was investigated by Dielectric Spectroscopy in an open system under dry
conditions. PVPA samples were exposed to different drying procedures, followed by
conductivity measurements to determine the influence of the different drying procedure
on the conductivity as well as on the formation of phosphonic acid anhydride species. All
samples displayed frequency-independent plateau regions in their alternating current
versus frequency plots. The direct current conductivity of the samples was estimated
from the alternating current plateaus.
The proton conductivity of the high molecular weight (Mw=62 000 g/mol), and
nearly atactic PVPA (1) synthesized by free radical polymerization of VPA was recorded
after drying the sample at 50 °C under reduced pressure to a constant weight. The
conductivity of PVPA (1) was measured in four steps by using the temperature program
1, which is already described in the second chapter. This temperature program allowed us
to follow the changes in the conductivity between 20 and 210 °C. The frequency
dependent conductivity data of vacuum dried and annealed PVPA (1) are given in Figure
6.8 and Figure 6.9, from which direct current conductivity of PVPA (1) estimated.
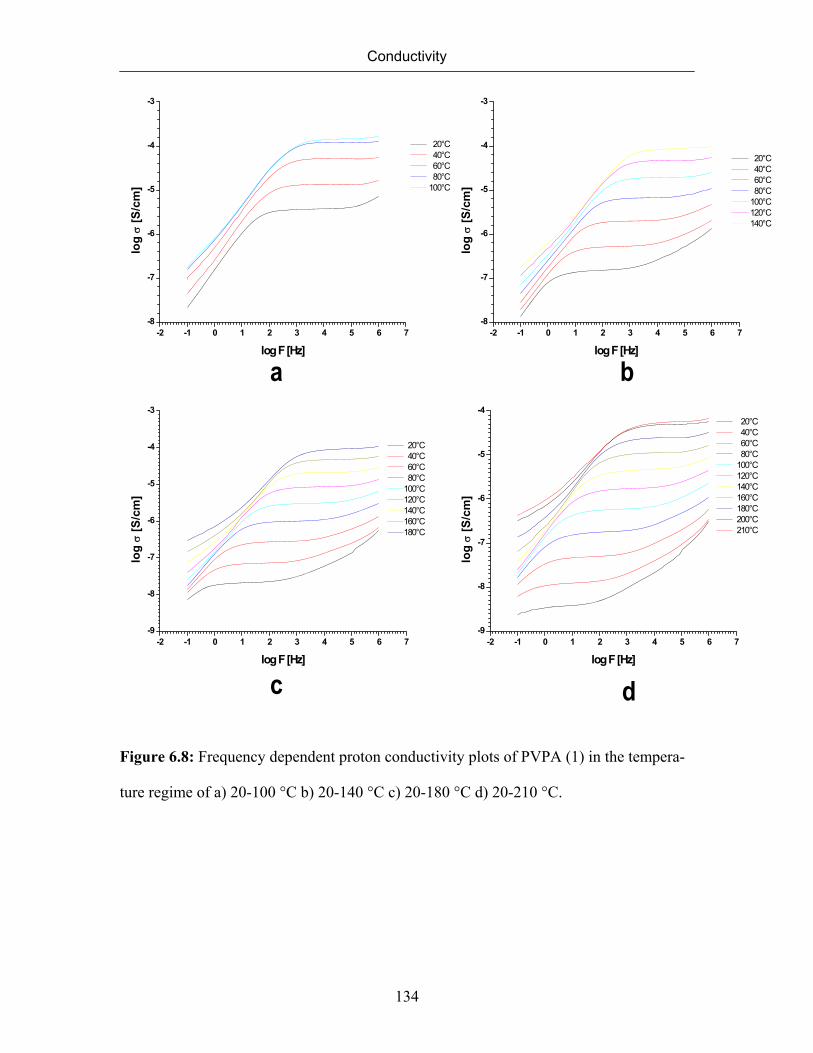
Conductivity
134
-2 -1 0 1 2 3 4 5 6 7-8
-7
-6
-5
-4
-3
log
σ [S
/cm
]
log F [Hz]
20°C 40°C 60°C 80°C 100°C
a-2 -1 0 1 2 3 4 5 6 7
-8
-7
-6
-5
-4
-3
log
σ [S
/cm
]
log F [Hz]
20°C 40°C 60°C 80°C 100°C 120°C 140°C
b
-2 -1 0 1 2 3 4 5 6 7-9
-8
-7
-6
-5
-4
log
σ [S
/cm
]
log F [Hz]
20°C 40°C 60°C 80°C 100°C 120°C 140°C 160°C 180°C 200°C 210°C
-2 -1 0 1 2 3 4 5 6 7-9
-8
-7
-6
-5
-4
-3
log
σ [S
/cm
]
log F [Hz]
20°C 40°C 60°C 80°C100°C120°C140°C160°C180°C
c d
Figure 6.8: Frequency dependent proton conductivity plots of PVPA (1) in the tempera-
ture regime of a) 20-100 °C b) 20-140 °C c) 20-180 °C d) 20-210 °C.
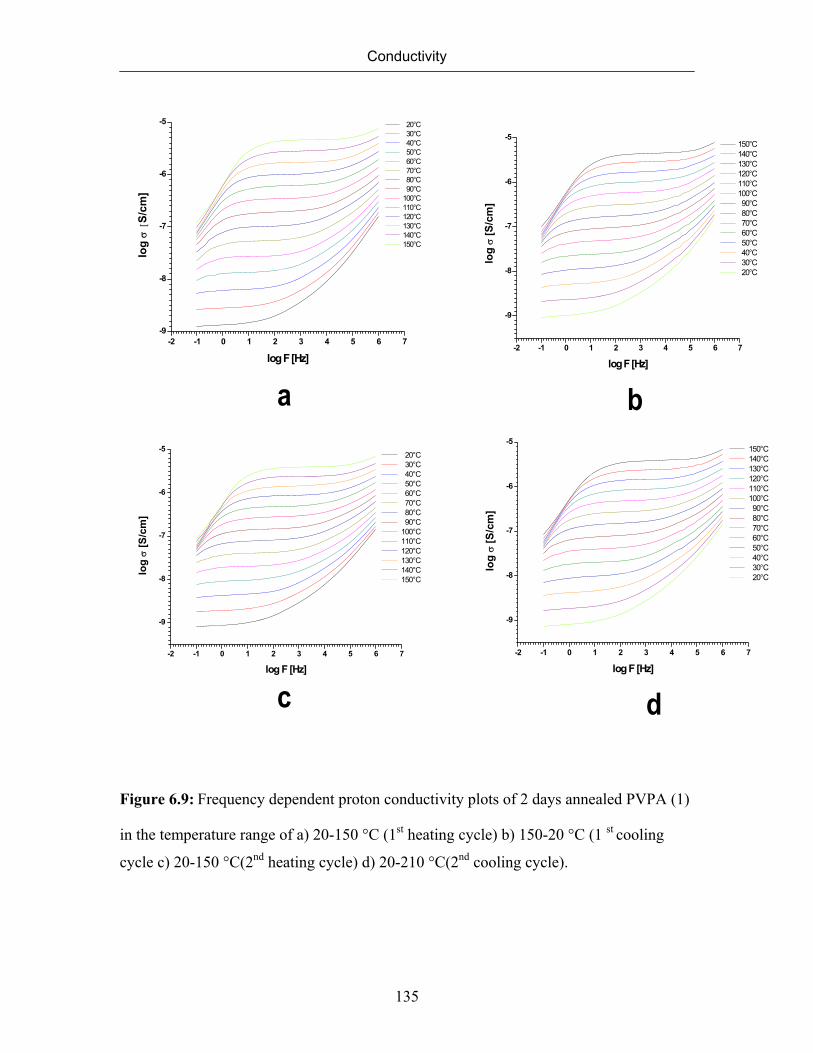
Conductivity
135
-2 -1 0 1 2 3 4 5 6 7-9
-8
-7
-6
-5
log
σ [
S/cm
]
log F [Hz]
20°C 30°C 40°C 50°C 60°C 70°C 80°C 90°C 100°C 110°C 120°C 130°C 140°C 150°C
-2 -1 0 1 2 3 4 5 6 7
-9
-8
-7
-6
-5
log
σ [S
/cm
]
log F [Hz]
150°C 140°C 130°C 120°C 110°C 100°C 90°C 80°C 70°C 60°C 50°C 40°C 30°C 20°C
a b
c-2 -1 0 1 2 3 4 5 6 7
-9
-8
-7
-6
-5
log
σ [S
/cm
]
log F [Hz]
20°C 30°C 40°C 50°C 60°C 70°C 80°C 90°C 100°C 110°C 120°C 130°C 140°C 150°C
-2 -1 0 1 2 3 4 5 6 7
-9
-8
-7
-6
-5
log
σ [S
/cm
]
log F [Hz]
150°C 140°C 130°C 120°C 110°C 100°C 90°C 80°C 70°C 60°C 50°C 40°C 30°C 20°C
d
Figure 6.9: Frequency dependent proton conductivity plots of 2 days annealed PVPA (1)
in the temperature range of a) 20-150 °C (1st heating cycle) b) 150-20 °C (1 st cooling
cycle c) 20-150 °C(2nd heating cycle) d) 20-210 °C(2nd cooling cycle).
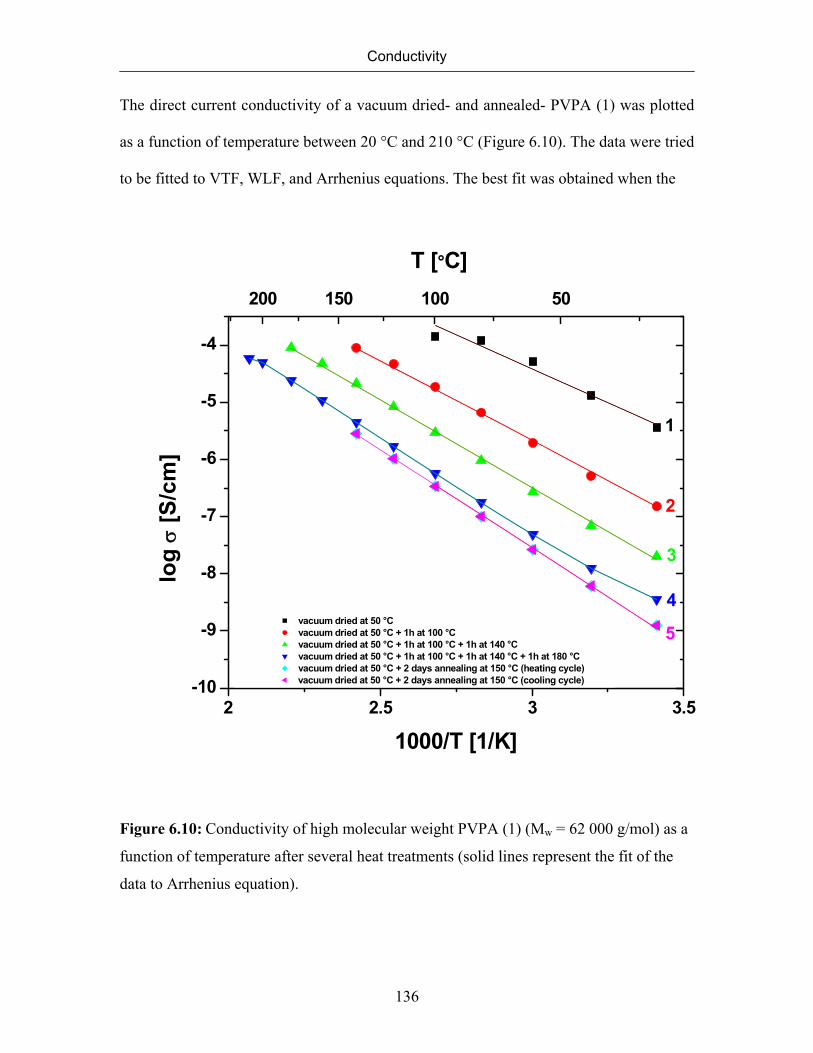
Conductivity
136
The direct current conductivity of a vacuum dried- and annealed- PVPA (1) was plotted
as a function of temperature between 20 °C and 210 °C (Figure 6.10). The data were tried
to be fitted to VTF, WLF, and Arrhenius equations. The best fit was obtained when the
2 2.5 3 3.5-10
-9
-8
-7
-6
-5
-4
200 150 100 50
T [°C]
vacuum dried at 50 °C vacuum dried at 50 °C + 1h at 100 °C vacuum dried at 50 °C + 1h at 100 °C + 1h at 140 °C vacuum dried at 50 °C + 1h at 100 °C + 1h at 140 °C + 1h at 180 °C vacuum dried at 50 °C + 2 days annealing at 150 °C (heating cycle) vacuum dried at 50 °C + 2 days annealing at 150 °C (cooling cycle)
log
σ [S
/cm
]
1000/T [1/K]
1
2
3
4
5
Figure 6.10: Conductivity of high molecular weight PVPA (1) (Mw = 62 000 g/mol) as a
function of temperature after several heat treatments (solid lines represent the fit of the
data to Arrhenius equation).
Conductivity
137
data was fitted to the Arrhenius law. Solid lines in represent the fitting of the data to
Arrhenius equation. Actually, there is a slight leveling off in the conductivity at 100 °C at
the end of the first data set in Figure 6.10. Thus, the data points seem to be curved
slightly. However, the reason for this leveling off in the conductivity at 100 °C is due to
the water loss. Thereby, we obtain similar values for the conductivity at 80 °C and 100
°C at the first heating cycle. In other words, the data did not reveal the signature of VTF
or WLF behavior in the temperature range studied.
The preexponential factor and activation energy for conductivity were extracted
from the slope and intercept of the log σ versus T-1 plot. The preexponential factor and
activation energy obtained from the conductivity data of PVPA (1) are given in Table 6.1.
All five data sets (labeled from 1 to 5 in Figure 6.10) reach the same limiting
conductivity at infinite temperature. In other words, they share a common of
preexponential factor, which is around 500 S/cm. However, the data sets have different
the activation energy. The activation energy was found to increase as the sample was
exposed to higher temperatures and longer times.
Table 6.1: Activation energy and preexponential factor for PVPA (1) extracted from the
conductivity data
Sample Temperature regime log σ0 Ea (kJ) vacuum dried PVPA (1) at 50 °C 20-100 °C 2.7 45 vacuum dried PVPA (1) at 50 °C 20-140°C 2.7 53 vacuum dried PVPA (1) at 50 °C 20-180 °C 2.7 58 vacuum dried PVPA (1) at 50 °C 20-210 °C 2.7 63 2 days annealed PVPA (1) at 150 °C 20-150° 2.7 65
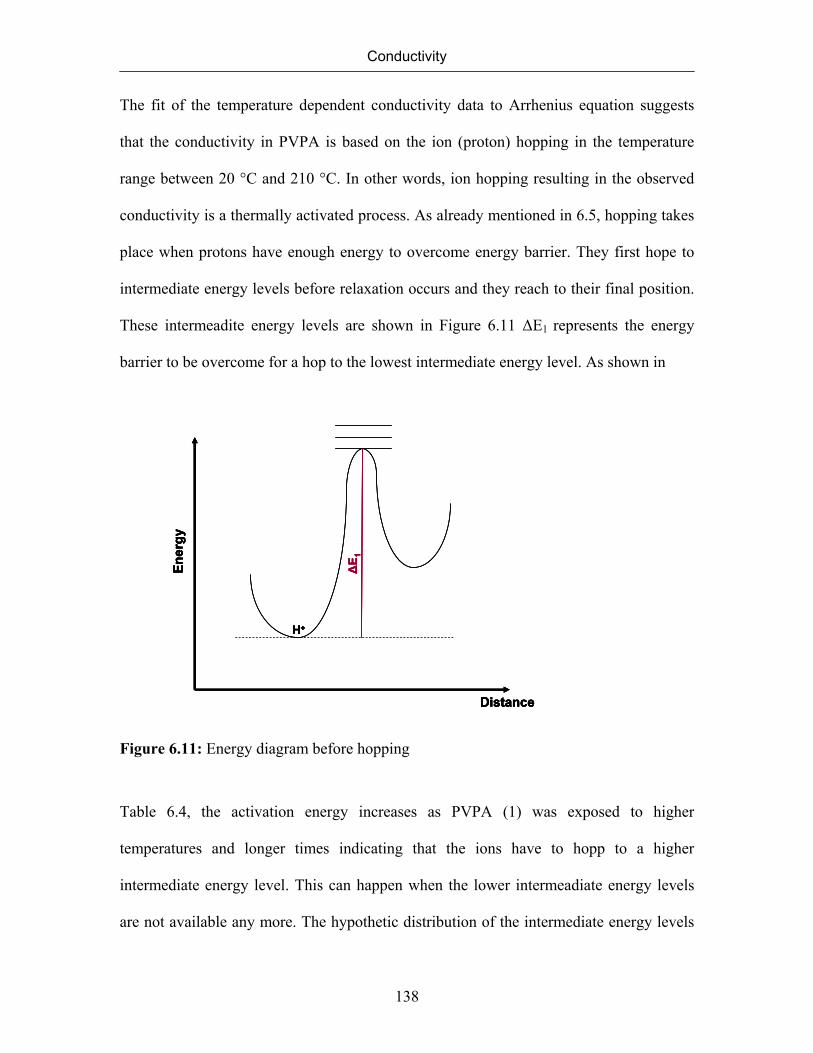
Conductivity
138
The fit of the temperature dependent conductivity data to Arrhenius equation suggests
that the conductivity in PVPA is based on the ion (proton) hopping in the temperature
range between 20 °C and 210 °C. In other words, ion hopping resulting in the observed
conductivity is a thermally activated process. As already mentioned in 6.5, hopping takes
place when protons have enough energy to overcome energy barrier. They first hope to
intermediate energy levels before relaxation occurs and they reach to their final position.
These intermeadite energy levels are shown in Figure 6.11 ΔE1 represents the energy
barrier to be overcome for a hop to the lowest intermediate energy level. As shown in
Ener
gy
Distance
ΔE 1
H+
Ener
gy
Distance
ΔE 1
H+
Ener
gy
Distance
ΔE 1
H+
Ener
gy
Distance
ΔE 1
H+
Figure 6.11: Energy diagram before hopping
Table 6.4, the activation energy increases as PVPA (1) was exposed to higher
temperatures and longer times indicating that the ions have to hopp to a higher
intermediate energy level. This can happen when the lower intermeadiate energy levels
are not available any more. The hypothetic distribution of the intermediate energy levels
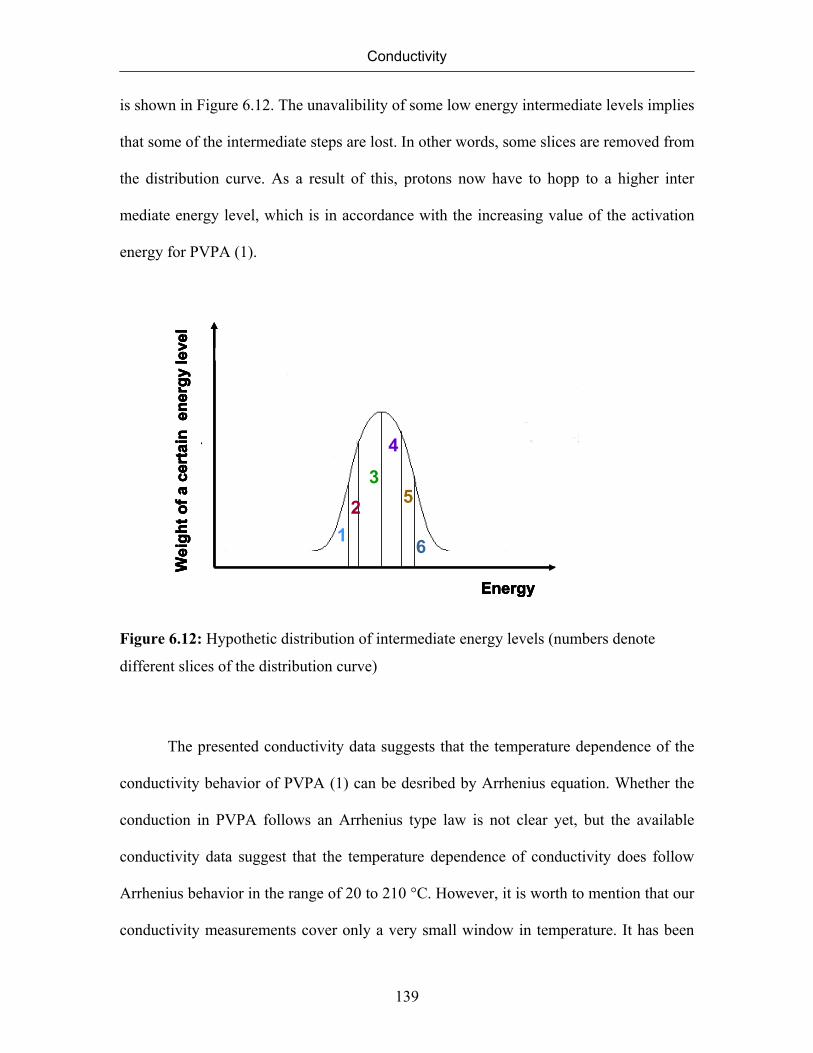
Conductivity
139
is shown in Figure 6.12. The unavalibility of some low energy intermediate levels implies
that some of the intermediate steps are lost. In other words, some slices are removed from
the distribution curve. As a result of this, protons now have to hopp to a higher inter
mediate energy level, which is in accordance with the increasing value of the activation
energy for PVPA (1).
Energy
Wei
ght o
f a c
erta
in e
nerg
y le
vel
12
35
6
4
Energy
Wei
ght o
f a c
erta
in e
nerg
y le
vel
12
35
6
Energy
Wei
ght o
f a c
erta
in e
nerg
y le
vel
12
35
6
Energy
Wei
ght o
f a c
erta
in e
nerg
y le
vel
12
35
12
35
6
4
Figure 6.12: Hypothetic distribution of intermediate energy levels (numbers denote
different slices of the distribution curve)
The presented conductivity data suggests that the temperature dependence of the
conductivity behavior of PVPA (1) can be desribed by Arrhenius equation. Whether the
conduction in PVPA follows an Arrhenius type law is not clear yet, but the available
conductivity data suggest that the temperature dependence of conductivity does follow
Arrhenius behavior in the range of 20 to 210 °C. However, it is worth to mention that our
conductivity measurements cover only a very small window in temperature. It has been

Conductivity
140
already reported that temperature dependence of some polymer electrolytes display
Arrhenius behavior at low temperatures and VTF behavior at high temperatures. This
probability still exists for PVPA case.
Conductivity of PVPA (1) increases as temperature increases among each data
set. However, the conductivity decreases relatively upon exposing the sample to higher
temperatures and longer times, which becomes clear when the conductivity values of
each data set (Figure 6.10) at a certain temperature were compared. The conductivities at
20 °C and 80 °C for each step of measurement are given in for the sake of simplicity in
Table 6.2.
Table 6.2: The log conductivity of PVPA (1) at 20 °C, at 80 °C
Data set log σ 20 °C (S/cm) log σ 80 °C (S/cm)
1 -5.5 -3.9
2 -6.9 -5.2
3 -7.7 -6.1
4 -8.4 -6.7
5 -8.91 -7.0
6.7.2 The Correlation between Conductivity and Formation of Anhydride Species
As already mentioned, the conductivity of PVPA (1) is decreasing when the
polymer was exposed to higher temperatures and longer times. The presence of water
improves the proton conductivity of PVPA at low temperatures. The decrease in the
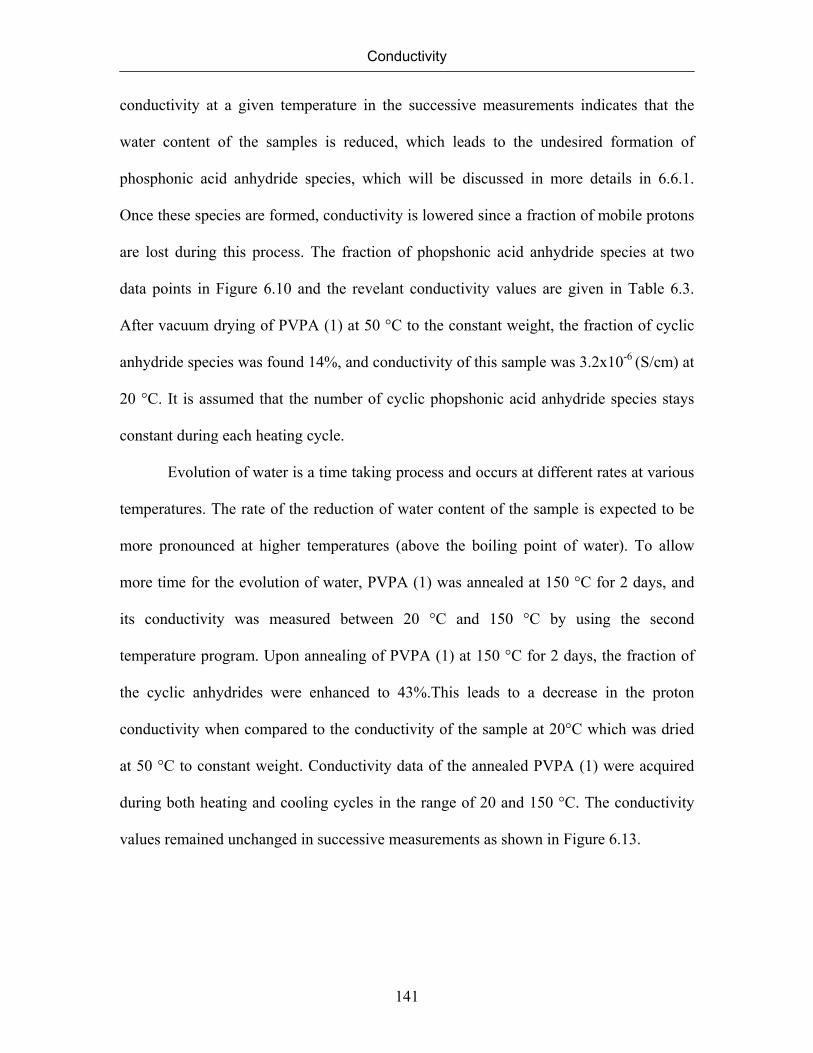
Conductivity
141
conductivity at a given temperature in the successive measurements indicates that the
water content of the samples is reduced, which leads to the undesired formation of
phosphonic acid anhydride species, which will be discussed in more details in 6.6.1.
Once these species are formed, conductivity is lowered since a fraction of mobile protons
are lost during this process. The fraction of phopshonic acid anhydride species at two
data points in Figure 6.10 and the revelant conductivity values are given in Table 6.3.
After vacuum drying of PVPA (1) at 50 °C to the constant weight, the fraction of cyclic
anhydride species was found 14%, and conductivity of this sample was 3.2x10⁻⁶ (S/cm) at
20 °C. It is assumed that the number of cyclic phopshonic acid anhydride species stays
constant during each heating cycle.
Evolution of water is a time taking process and occurs at different rates at various
temperatures. The rate of the reduction of water content of the sample is expected to be
more pronounced at higher temperatures (above the boiling point of water). To allow
more time for the evolution of water, PVPA (1) was annealed at 150 °C for 2 days, and
its conductivity was measured between 20 °C and 150 °C by using the second
temperature program. Upon annealing of PVPA (1) at 150 °C for 2 days, the fraction of
the cyclic anhydrides were enhanced to 43%.This leads to a decrease in the proton
conductivity when compared to the conductivity of the sample at 20°C which was dried
at 50 °C to constant weight. Conductivity data of the annealed PVPA (1) were acquired
during both heating and cooling cycles in the range of 20 and 150 °C. The conductivity
values remained unchanged in successive measurements as shown in Figure 6.13.
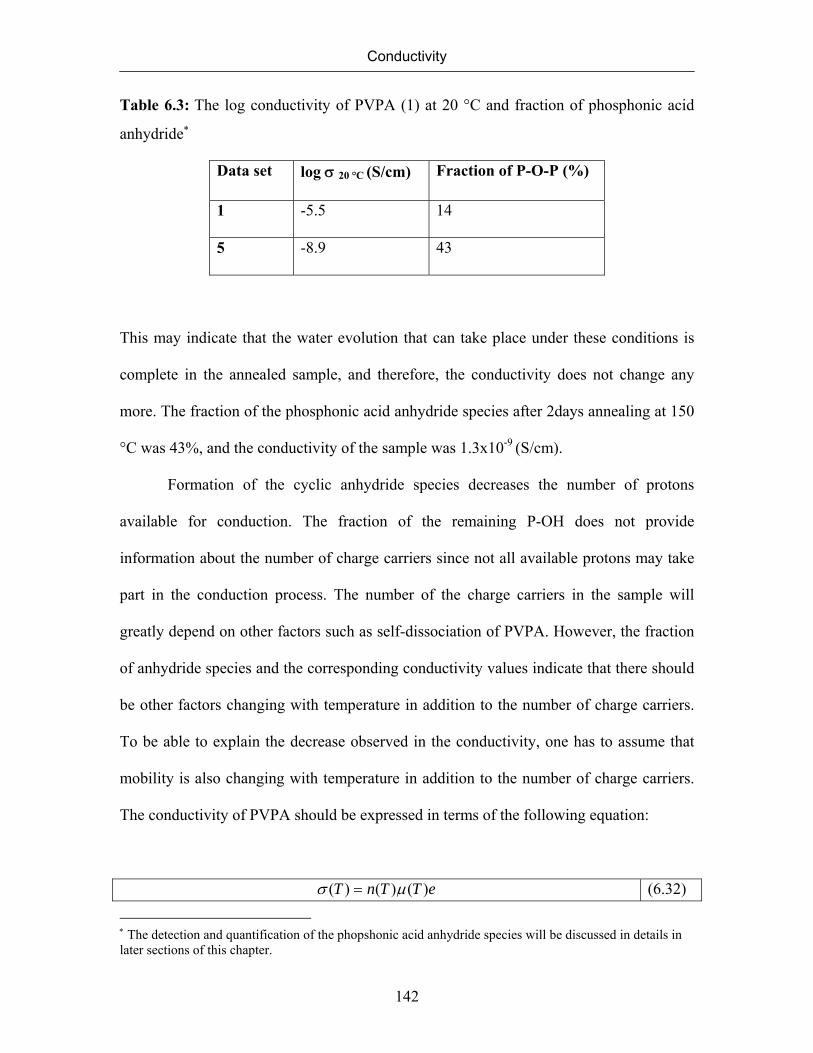
Conductivity
142
Table 6.3: The log conductivity of PVPA (1) at 20 °C and fraction of phosphonic acid
anhydride∗
Data set log σ 20 °C (S/cm) Fraction of P-O-P (%)
1 -5.5 14
5 -8.9 43
This may indicate that the water evolution that can take place under these conditions is
complete in the annealed sample, and therefore, the conductivity does not change any
more. The fraction of the phosphonic acid anhydride species after 2days annealing at 150
°C was 43%, and the conductivity of the sample was 1.3x10⁻⁹ (S/cm).
Formation of the cyclic anhydride species decreases the number of protons
available for conduction. The fraction of the remaining P-OH does not provide
information about the number of charge carriers since not all available protons may take
part in the conduction process. The number of the charge carriers in the sample will
greatly depend on other factors such as self-dissociation of PVPA. However, the fraction
of anhydride species and the corresponding conductivity values indicate that there should
be other factors changing with temperature in addition to the number of charge carriers.
To be able to explain the decrease observed in the conductivity, one has to assume that
mobility is also changing with temperature in addition to the number of charge carriers.
The conductivity of PVPA should be expressed in terms of the following equation:
eTTnT )()()( μσ = (6.32)
∗ The detection and quantification of the phopshonic acid anhydride species will be discussed in details in later sections of this chapter.
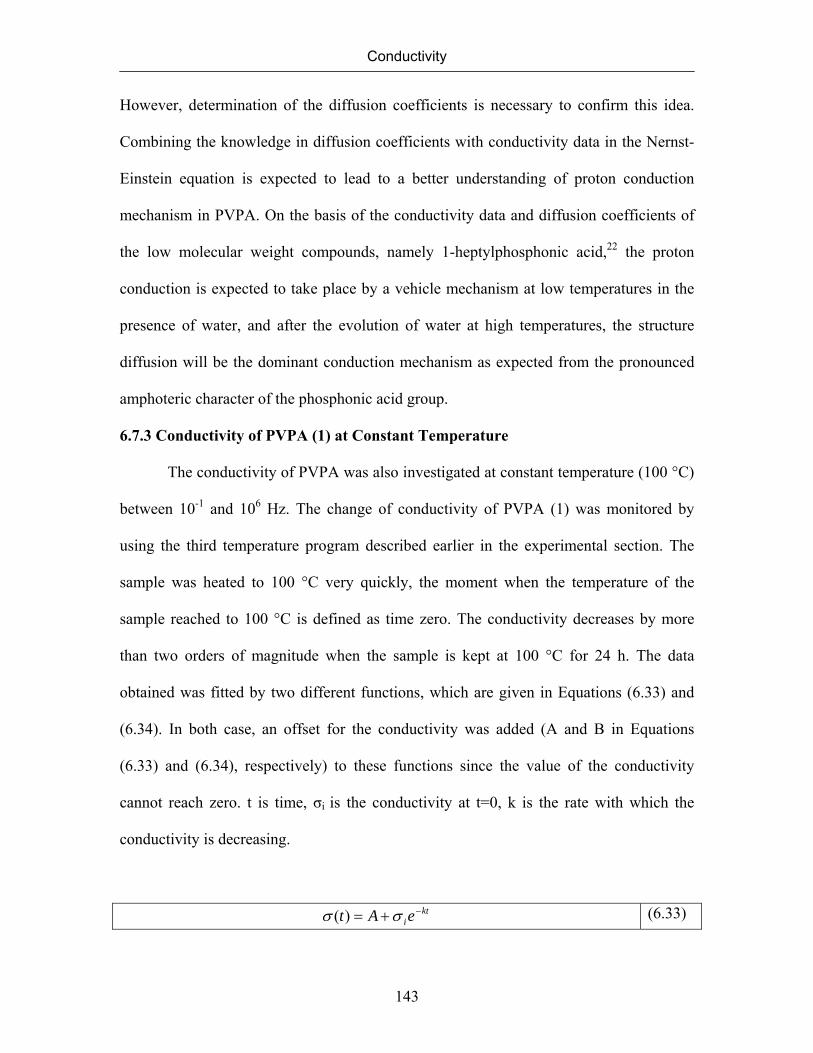
Conductivity
143
However, determination of the diffusion coefficients is necessary to confirm this idea.
Combining the knowledge in diffusion coefficients with conductivity data in the Nernst-
Einstein equation is expected to lead to a better understanding of proton conduction
mechanism in PVPA. On the basis of the conductivity data and diffusion coefficients of
the low molecular weight compounds, namely 1-heptylphosphonic acid,22 the proton
conduction is expected to take place by a vehicle mechanism at low temperatures in the
presence of water, and after the evolution of water at high temperatures, the structure
diffusion will be the dominant conduction mechanism as expected from the pronounced
amphoteric character of the phosphonic acid group.
6.7.3 Conductivity of PVPA (1) at Constant Temperature
The conductivity of PVPA was also investigated at constant temperature (100 °C)
between 10-1 and 106 Hz. The change of conductivity of PVPA (1) was monitored by
using the third temperature program described earlier in the experimental section. The
sample was heated to 100 °C very quickly, the moment when the temperature of the
sample reached to 100 °C is defined as time zero. The conductivity decreases by more
than two orders of magnitude when the sample is kept at 100 °C for 24 h. The data
obtained was fitted by two different functions, which are given in Equations (6.33) and
(6.34). In both case, an offset for the conductivity was added (A and B in Equations
(6.33) and (6.34), respectively) to these functions since the value of the conductivity
cannot reach zero. t is time, σi is the conductivity at t=0, k is the rate with which the
conductivity is decreasing.
ktieAt −+= σσ )( (6.33)

Conductivity
144
ktBt
i
i
σσ
σ+
+=1
)( (6.34)
The conductivity data of PVPA (1) at constant temperature can be better
described by Equation (6.34) rather than by Equation (6.33). This becomes more clear by
comparing the two different fits of the data when y axis of the conductivity plot is in a
logarithmic scale (Figure 6.13). The reason why the decay of conductivity fits better to
the mathematical function in Equation (6.34) is not clear yet. Most probably, the
conductivity of PVPA is a complicated result of many different processes as in most
polymer electrolytes.111
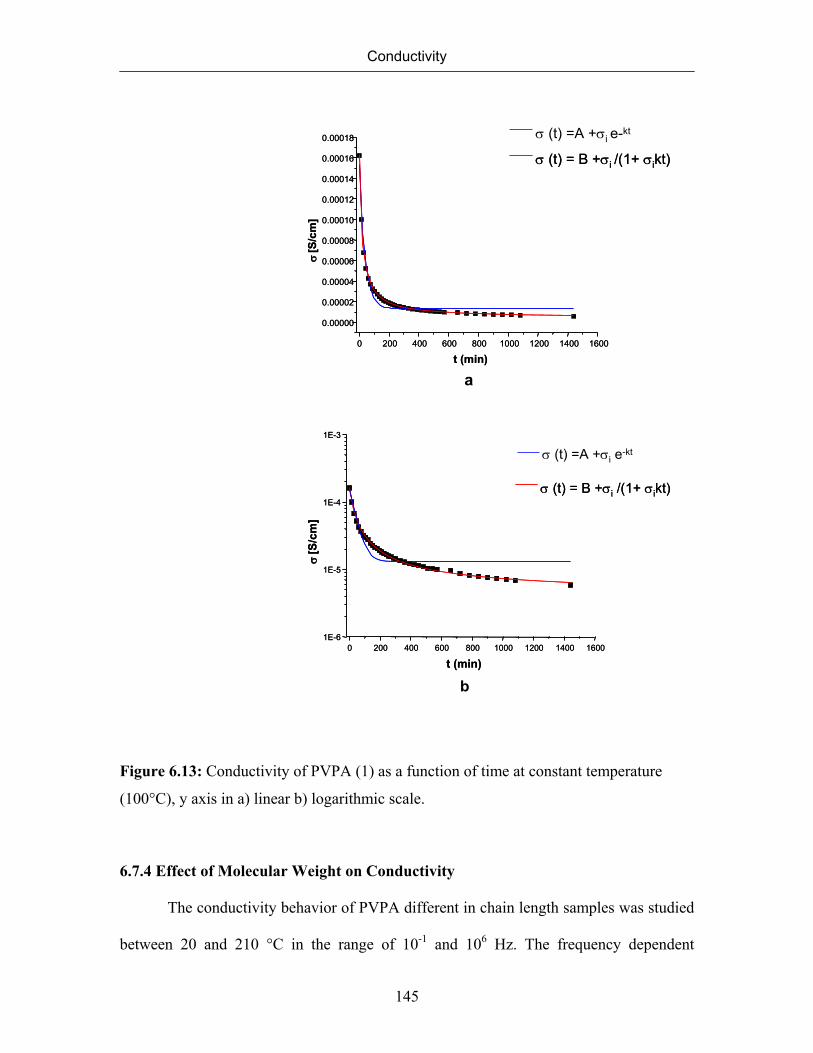
Conductivity
145
0 200 400 600 800 1000 1200 1400 1600
0.00000
0.00002
0.00004
0.00006
0.00008
0.00010
0.00012
0.00014
0.00016
0.00018 σ (t) =A +σi e-kt
σ (t) = B +σi /(1+ σikt)
σ[S
/cm
]
t (min)0 200 400 600 800 1000 1200 1400 1600
0.00000
0.00002
0.00004
0.00006
0.00008
0.00010
0.00012
0.00014
0.00016
0.00018 σ (t) =A +σi e-kt
σ (t) = B +σi /(1+ σikt)
σ[S
/cm
]
t (min)
a
0 200 400 600 800 1000 1200 1400 16001E-6
1E-5
1E-4
1E-3
σ (t) = B +σi /(1+ σikt)
σ (t) =A +σi e-kt
σ[S
/cm
]
t (min)0 200 400 600 800 1000 1200 1400 1600
1E-6
1E-5
1E-4
1E-3
σ (t) = B +σi /(1+ σikt)
σ (t) =A +σi e-kt
σ[S
/cm
]
t (min)
b
Figure 6.13: Conductivity of PVPA (1) as a function of time at constant temperature
(100°C), y axis in a) linear b) logarithmic scale.
6.7.4 Effect of Molecular Weight on Conductivity
The conductivity behavior of PVPA different in chain length samples was studied
between 20 and 210 °C in the range of 10-1 and 106 Hz. The frequency dependent
Conductivity
146
conductivity data of different molecular weight PVPA samples are presented in Figure
6.14, Figure 6.15, and Figure 6.16. The direct current conductivity of the samples was
estimated from the alternating current plateaus and they were plotted as a function of
temperature between 20 and 210 °C (Figure 6.17, Figure 6.18, Figure 6.19).
All PVPA samples displayed conductivity between 20 and 210 °C. The
conductivity behavior of PVPA (2), PVPA (3), and PVPA (4) resemble the conductivity
behavior of the high molecular weight PVPA (1), which is already discussed in details in
6.7.1. The conductivity of all PVPA samples increase as temperature is increased.
However, a drop in conductivity was observed when the samples were exposed to higher
temperatures and longer times due to the water loss and formation of cyclic anhydride
species. The fraction of phosphonic acid anhydride species PVPA (2), PVPA (3), and
PVPA (4) were not studied by Solid State NMR.
The conductivity data of different PVPA samples seem to fit to the Arrhenius
equation as in the case of the high molecular weight PVPA (1). The fit of the data to the
Arrhenius equation is shown with the solid lines in the temperature dependent
conductivity plots. The preexponential factor and activation energy for each sample was
extracted from the intercept and the slope of log σ versus T-1 plots, respectively (Table
6.4). The data sets obtained after different heat treatments of the same polymer sample
reach the same limiting conductivity at infinite temperature. However, they differ in their
activation energy. These observations are valid for all PVPA samples.
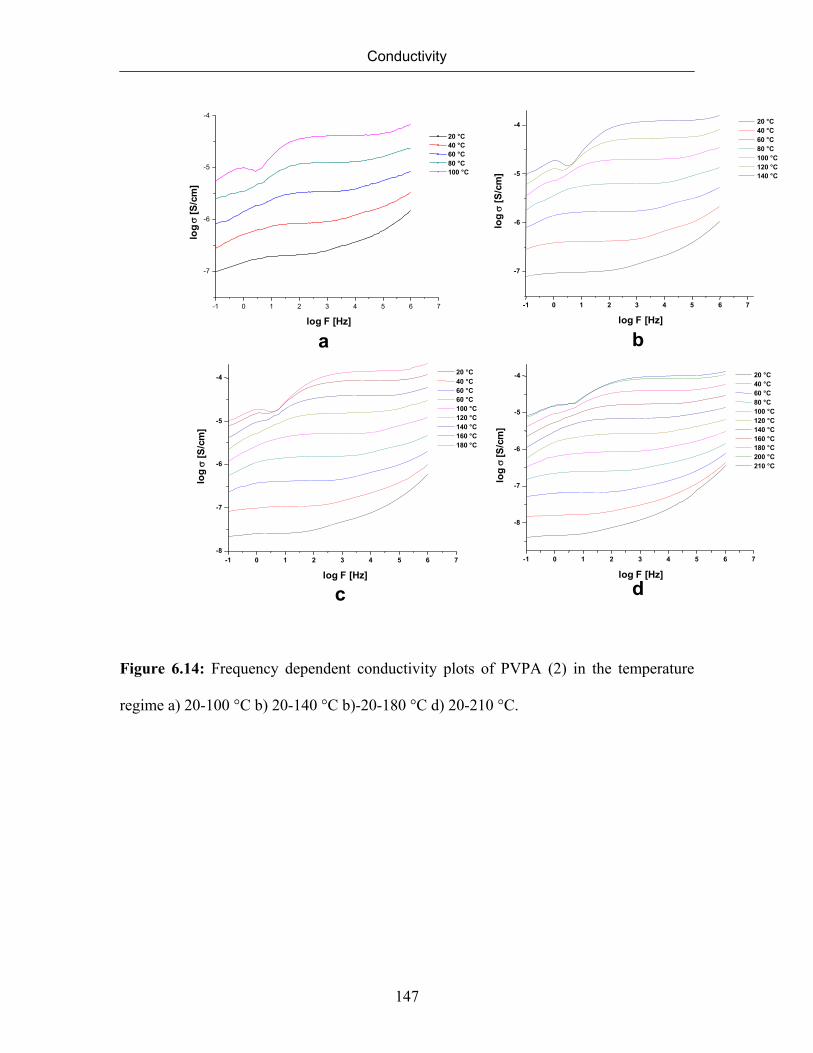
Conductivity
147
-1 0 1 2 3 4 5 6 7
-8
-7
-6
-5
-4
log
σ[S
/cm
]
log F [Hz]
20 °C40 °C60 °C80 °C100 °C120 °C140 °C160 °C180 °C200 °C210 °C
-1 0 1 2 3 4 5 6 7-8
-7
-6
-5
-4
log
σ[S
/cm
]
log F [Hz]
20 °C40 °C60 °C60 °C100 °C120 °C140 °C160 °C180 °C
-1 0 1 2 3 4 5 6 7
-7
-6
-5
-4
log
σ[S
/cm
]
log F [Hz]
20 °C40 °C60 °C80 °C100 °C
-1 0 1 2 3 4 5 6 7
-7
-6
-5
-4
log
σ[S
/cm
]
log F [Hz]
20 °C40 °C60 °C80 °C100 °C120 °C140 °C
a b
c d
Figure 6.14: Frequency dependent conductivity plots of PVPA (2) in the temperature
regime a) 20-100 °C b) 20-140 °C b)-20-180 °C d) 20-210 °C.
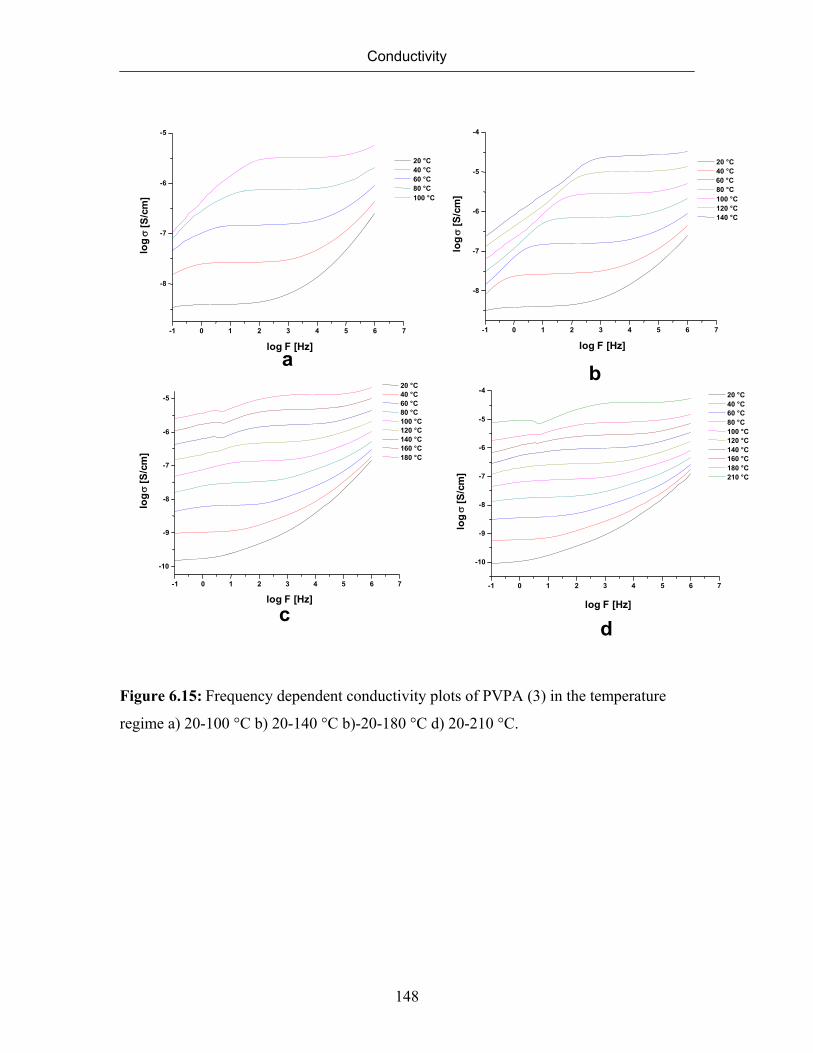
Conductivity
148
-1 0 1 2 3 4 5 6 7
-10
-9
-8
-7
-6
-5
log
σ[S
/cm
]
log F [Hz]
20 °C40 °C60 °C80 °C100 °C120 °C140 °C160 °C180 °C
-1 0 1 2 3 4 5 6 7
-8
-7
-6
-5lo
g σ
[S/c
m]
log F [Hz]
20 °C40 °C60 °C80 °C100 °C
-1 0 1 2 3 4 5 6 7
-10
-9
-8
-7
-6
-5
-4
log
σ[S
/cm
]
log F [Hz]
20 °C40 °C60 °C80 °C100 °C120 °C140 °C160 °C180 °C210 °C
-1 0 1 2 3 4 5 6 7
-8
-7
-6
-5
-4
log
σ[S
/cm
]
log F [Hz]
20 °C40 °C60 °C80 °C100 °C120 °C140 °C
ab
cd
Figure 6.15: Frequency dependent conductivity plots of PVPA (3) in the temperature
regime a) 20-100 °C b) 20-140 °C b)-20-180 °C d) 20-210 °C.

Conductivity
149
-1 0 1 2 3 4 5 6 7
-7
-6
-5lo
g σ
[S/c
m]
log F [Hz]
20 °C40 °C60 °C80 °C100 °C
-1 0 1 2 3 4 5 6 7
-8
-7
-6
-5
-4
log
σ[S
/cm
]
log F [Hz]
20 °C40 °C60 °C80 °C100 °C120 °C140 °C160 °C180 °C
0 2 4 6
-9
-8
-7
-6
-5
-4
log
σ[S
/cm
]
log F [Hz]
20 °C40 °C60 °C80 °C100 °C120 °C140 °C160 °C180 °C210 °C
a b
c d
-1 0 1 2 3 4 5 6 7-8
-7
-6
-5
-4
log σ
[S/c
m]
log F [Hz]
20 °C40 °C60 °C80 °C100 °C120 °C140 °C
Figure 6.16: Frequency dependent conductivity plots of PVPA (4) in the temperature
regime a) 20-100 °C b) 20-140 °C b)-20-180 °C d) 20-210 °C.
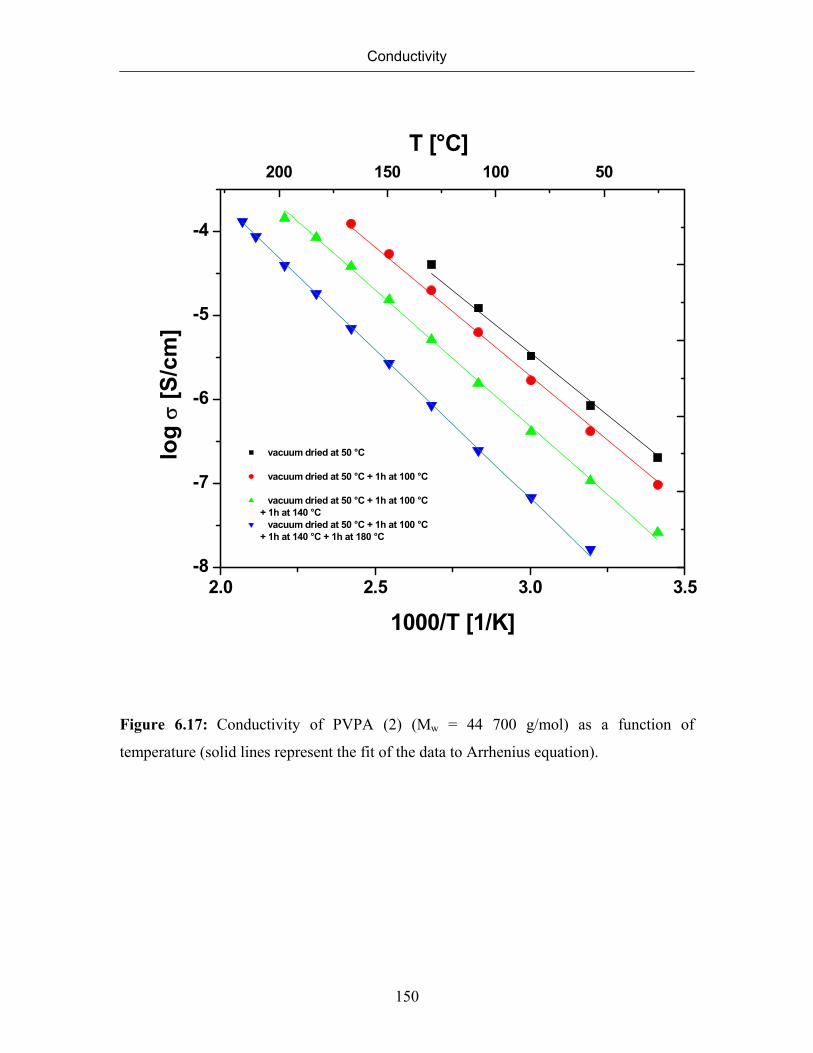
Conductivity
150
2.0 2.5 3.0 3.5-8
-7
-6
-5
-4
200 150 100 50T [°C]
vacuum dried at 50 °C
vacuum dried at 50 °C + 1h at 100 °C
vacuum dried at 50 °C + 1h at 100 °C + 1h at 140 °C
vacuum dried at 50 °C + 1h at 100 °C + 1h at 140 °C + 1h at 180 °C
log
σ [S
/cm
]
1000/T [1/K]
Figure 6.17: Conductivity of PVPA (2) (Mw = 44 700 g/mol) as a function of
temperature (solid lines represent the fit of the data to Arrhenius equation).
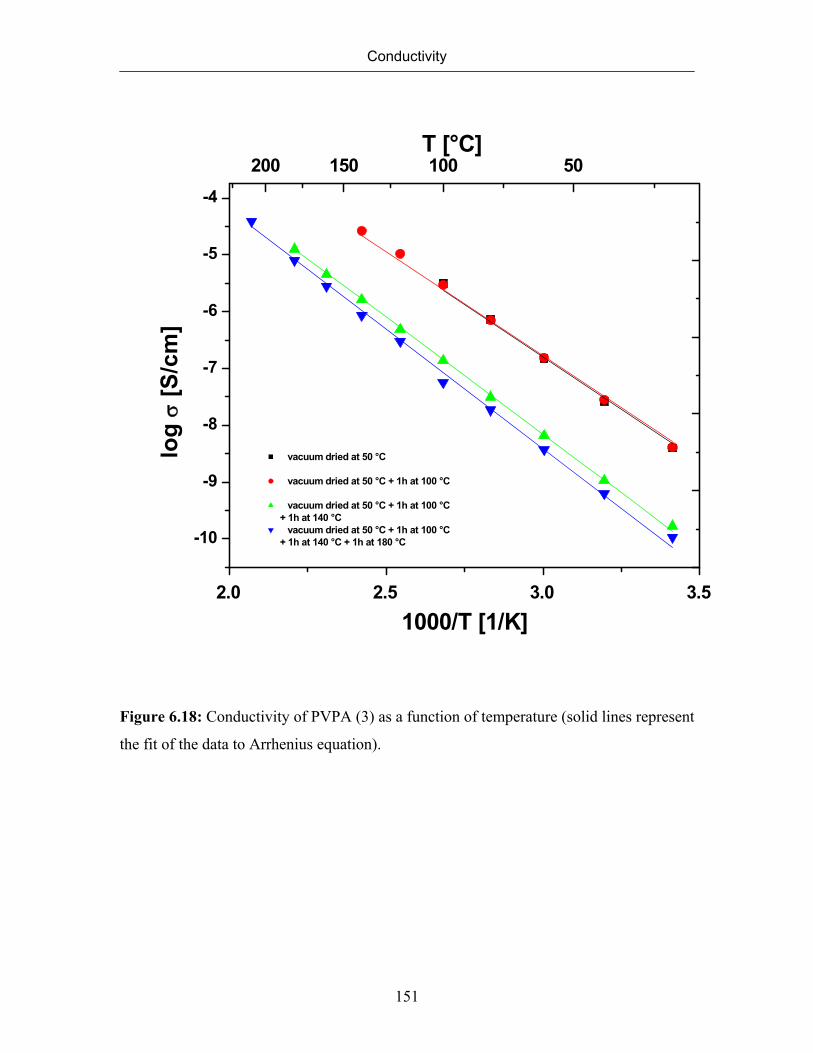
Conductivity
151
2.0 2.5 3.0 3.5
-10
-9
-8
-7
-6
-5
-4
200 150 100 50
vacuum dried at 50 °C
vacuum dried at 50 °C + 1h at 100 °C
vacuum dried at 50 °C + 1h at 100 °C + 1h at 140 °C
vacuum dried at 50 °C + 1h at 100 °C + 1h at 140 °C + 1h at 180 °C
T [°C]lo
g σ
[S/c
m]
1000/T [1/K]
Figure 6.18: Conductivity of PVPA (3) as a function of temperature (solid lines represent
the fit of the data to Arrhenius equation).

Conductivity
152
2.0 2.5 3.0 3.5
-9
-8
-7
-6
-5
-4
200 150 100 50
vacuum dried at 50 °C
vacuum dried at 50 °C + 1h at 100 °C
vacuum dried at 50 °C + 1h at 100 °C + 1h at 140 °C
vacuum dried at 50 °C + 1h at 100 °C + 1h at 140 °C + 1h at 180 °C
log
σ [S
/cm
]
1000/T [1/K]
T [°C]
Figure 6.19: Conductivity of PVPA (4) as a function of temperature (solid lines represent
the fit of the data to Arrhenius equation).
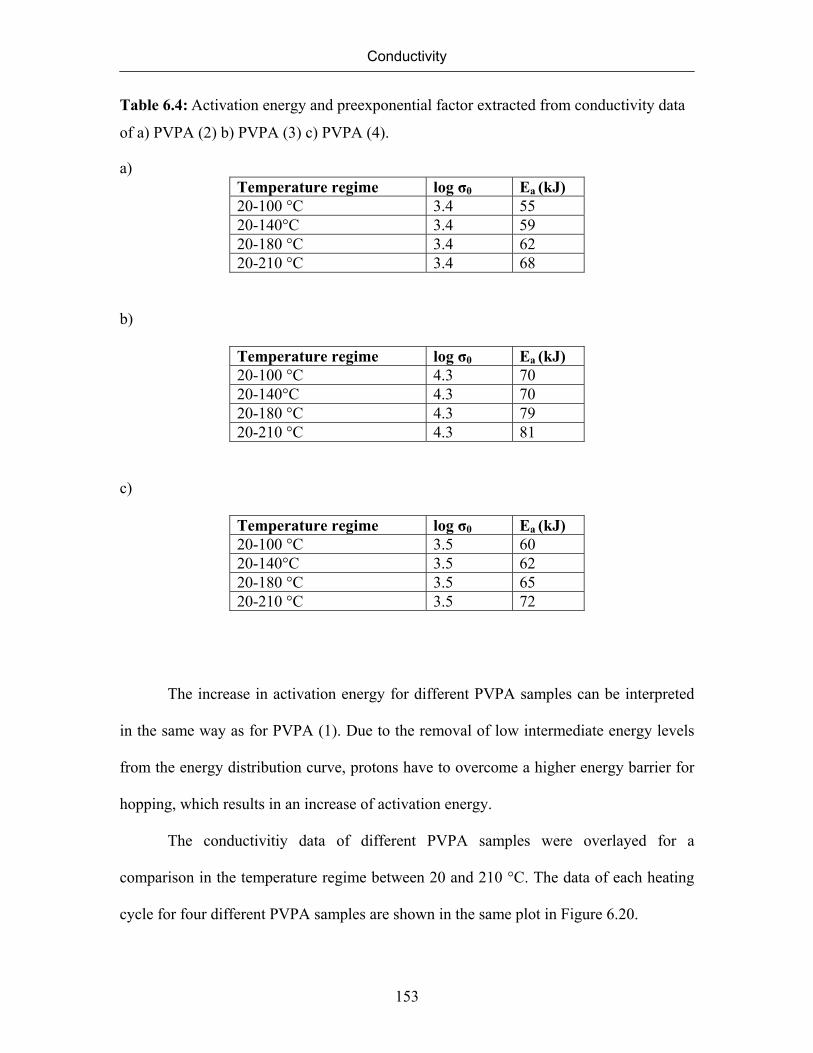
Conductivity
153
Table 6.4: Activation energy and preexponential factor extracted from conductivity data
of a) PVPA (2) b) PVPA (3) c) PVPA (4).
a) Temperature regime log σ0 Ea (kJ) 20-100 °C 3.4 55 20-140°C 3.4 59 20-180 °C 3.4 62 20-210 °C 3.4 68
b)
Temperature regime log σ0 Ea (kJ) 20-100 °C 4.3 70 20-140°C 4.3 70 20-180 °C 4.3 79 20-210 °C 4.3 81
c)
Temperature regime log σ0 Ea (kJ) 20-100 °C 3.5 60 20-140°C 3.5 62 20-180 °C 3.5 65 20-210 °C 3.5 72
The increase in activation energy for different PVPA samples can be interpreted
in the same way as for PVPA (1). Due to the removal of low intermediate energy levels
from the energy distribution curve, protons have to overcome a higher energy barrier for
hopping, which results in an increase of activation energy.
The conductivitiy data of different PVPA samples were overlayed for a
comparison in the temperature regime between 20 and 210 °C. The data of each heating
cycle for four different PVPA samples are shown in the same plot in Figure 6.20.

Conductivity
154
2.5 3.0 3.5
-8
-7
-6
-5
-4
150 100 50
log σ
[S/c
m]
1000/T [1/K]
T (°C)
2.0 2.5 3.0 3.5
-10
-9
-8
-7
-6
-5
-4
200 150 100 50
log σ
[S/c
m]
1000/T [1/K]
T (°C)
2.0 2.5 3.0 3.5
-10
-9
-8
-7
-6
-5
-4
200 150 100 50
log
σ[S
/cm
]
1000/T [1/K]
T (°C)d
b
c
a
2.5 3.0 3.5-9
-8
-7
-6
-5
-4
100 50
log σ
[S/c
m]
1000/T [1/K]
T (°C)
Figure 6.20: Temperature dependence of proton conductivity of PVPA of various
molecular weights between a) 20-100 ˚C b) 20-140 ˚C c) 20-180 ˚C d) 20-210 ˚C (
PVPA (1)( Mw = 62 000 g/mol)( PVPA (2) )( Mw = 44 700 g/mol) PVPA (3) (Mw
X), PVPA(4) (Mw X) (X: not known)).
The various samples have different conductivities at the beginning of the
measurement. The highest molecular weight PVPA displays the highest conductivity
initially, and the conductivity is lowest for the shortest polymer obtained by the
polymerization of VPA. The initial difference in the proton conductivity of the various
Conductivity
155
PVPA samples may be explained by their different water content. However, after the heat
treatment at 100 °C for 1 hour, the conductivity of PVPA (1) and PVPA (2) become very
similar, and at the end of the first temperature program, all PVPA exhibit almost the same
conductivity.
At temperatures below the boiling point of water, water contributes to the proton
conductivity to a large extent. The water molecules can act as additional proton solvents
and contribute to the proton transport either by self-diffusion while carrying a proton
(vehicle mechanism) or by rapid exchange of protons via hydrogen bridges (hopping
mechanism). Both cases will improve the conductivity and reduce the activation energy
for proton hopping.123 Therefore, difference in the water content of the samples leads to
different conductivity values. After evolution of water from the polymer samples, they
exhibit similar conductivity values independent of the molecular weight.
As mentioned in the experimental part, pellets were prepared to perform the
conductivity studies of PVPA. However, it was also tried to cast membranes from the
aqueous solutions of these polymer samples. Good quality films were obtained only with
the highest molecular weight sample. It was not possible to prepare films of the materials
with shorter chains good enough for conductivity measurements. The films were very
fragile, and holes were formed during the drying procedure. Although current results
imply that the molecular weight does not play role in the conductivity at higher
temperatures, the mechanical properties of the various chain length polymers are
different, which is important for preparation of the proton exchange membranes.
Conductivity
156
6.8 Solid State NMR Studies of PVPA
6.8.1 Formation and Quantification of Phosphonic Acid Anhydride Species
The formation of phosphonic acid anhydride species may result from either
condensation of two P-OH groups next to each other along the same chain, or the
condensation of P-OH groups on different chains. In other words, P-O-P linkages can
form either intra- or intermolecularly (Scheme 6.1). The formation of P-O-P linkages has
already been proposed in the case of commercial PVPA from Polyscience, which was
soluble in water at room temperature. Heating the sample increased the time required for
dissolution. After being heated to 500 °C or higher, the polymer became insoluble.124 The
reason for the insolubility of the polymer was reported to arise from the formation P-O-P
linkages. We think that the condenstation of phoshonic acid groups takes place
intramolecularly since the polymer after the heat treatments described above is still
completely soluble in water.
The presence of the condensated phopshonic acid species was detected by Solid
State NMR Specstroscopy. 1H magic angle spinning (MAS) NMR spectrum of PVPA (1)
displays two major resonances at 2.3 and 10.6 ppm, which are assigned to the backbone
protons (CH2 and CH) and P-OH protons, respectively (Figure 6.21a). 1H chemical shift

Conductivity
157
CH CH2
P
CH
OH
OH
P
CH2
OH
OH
CH
P OH
OH
CH2
CH CH2 CH CH2 CH CH2
P
OH
OH P
OH
OH P
OH
OH
Intermolecular
Intramolecular
O O O
O O O
CH CH2
P
CH
OH P
CH2
OH
CH
P OH
CH2
CH CH2 CH CH2 CH CH2
P
O
OH P
O
OH P
O
OH
O O O
O O O
CH CH2
P
CH
P
CH2 CH
P OH
OH
CH2
CH CH2 CH CH2 CH CH2
P
OH
OH P
OH
PH
OH
OH
O O
O O
OOH OH
O
O
- H20
- H20
Scheme 6.1: Intramolecular and intermolecular anhydride formation in PVPA.
is very sensitive to the hydrogen bonding.125 Therefore, 1H-MAS NMR also provides
information about the nature of the hydrogen bonding.125 The correlations between the 1H
chemical shift and the nature of the hydrogen bonding have been studied for carboxylic
acids and phosphoric acid. A larger shift was observed for systems with shorter O---O
Conductivity
158
distances. In other words, strong hydrogen bonding causes a downfield shift. Similarly,
the downfield shift to 10.6 ppm of P-OH signal indicates the presence of a strong
hydrogen bonding between phopshonic acid groups of PVPA. The relative intensities of
the resonances at 2.3 ppm to that of at 10.6 ppm should be 3 to 2 considering the
repeating unit of the polymer. The excess intensity of P-OH resonance can be attributed
to the water molecules undergoing fast exchange through hydrogen bonding. It is worth
to note that the NMR signal intensity is affected by the relaxation and mobility.
Therefore, it is problematic to use the intensity of P-OH signal for a precise quantitative
analysis of water content. However, the minor resonance at 6.6 ppm indicates the
presence of a small amount of water trapped in the system.
The 31P-MAS NMR spectrum of PVPA was dominated by a resonance at 33 ppm
due to the phosphonic acid groups. A weak shoulder was observed at 25 ppm (Figure
6.21b), which was assigned to the phosphonic acid anhydride. The spectrum was
deconvoluted by WIN-NMR to obtain the intensity of each signal. The ratio of the
intensity of the resonance at 25 ppm to the sum of the intensities of the signals at 25 ppm
and 33 ppm gave the fraction of the phosphonic acid anhydride species. The fraction of
the anhydride form was found as 14% for PVPA (1) dried at 50 °C to the constant
weight. To see the effect of the temperature on the formation of anhydride species, 31P-
MAS NMR and 1H-MAS NMR spectra of the annealed PVPA (1) was recorded. As a
result of annealing, the fraction of phosphonic acid anhydride species was enhanced,
which was indicated by an increase in the relative signal intensity of the resonance at 25
ppm in the 31P-MAS NMR spectrum of PVPA (1). After annealing PVPA (1) at 150 °C
for 2 days, the polymer possessed 43% condensated phopshonic acid groups. A
Conductivity
159
correlation between the fraction of phosphonic acid anhydride species and the
conductivity of PVPA (1) is given in, and the effect of the phosphonic acid anhydride
groups on the conductivity is discussed in 6.7.2.
1H-MAS NMR spectrum of PVPA (1) confirmed the formation of condensated
phosphonic acid species by a decrease in the P-OH signal intensity. The intensity of the
P-OH resonance was expected to decrease since the number of OH protons decreases
upon formation of phopshonic acid anhydride species. Both 1H- and 31P-NMR results are
consistent with the assignment of the phosphonic acid anhydride resonance, and
additionally, they confirm the enhancement of the phopshonic acid anhydride formation
at higher temperatures, which leads to the observed decrease in the proton conductivity.
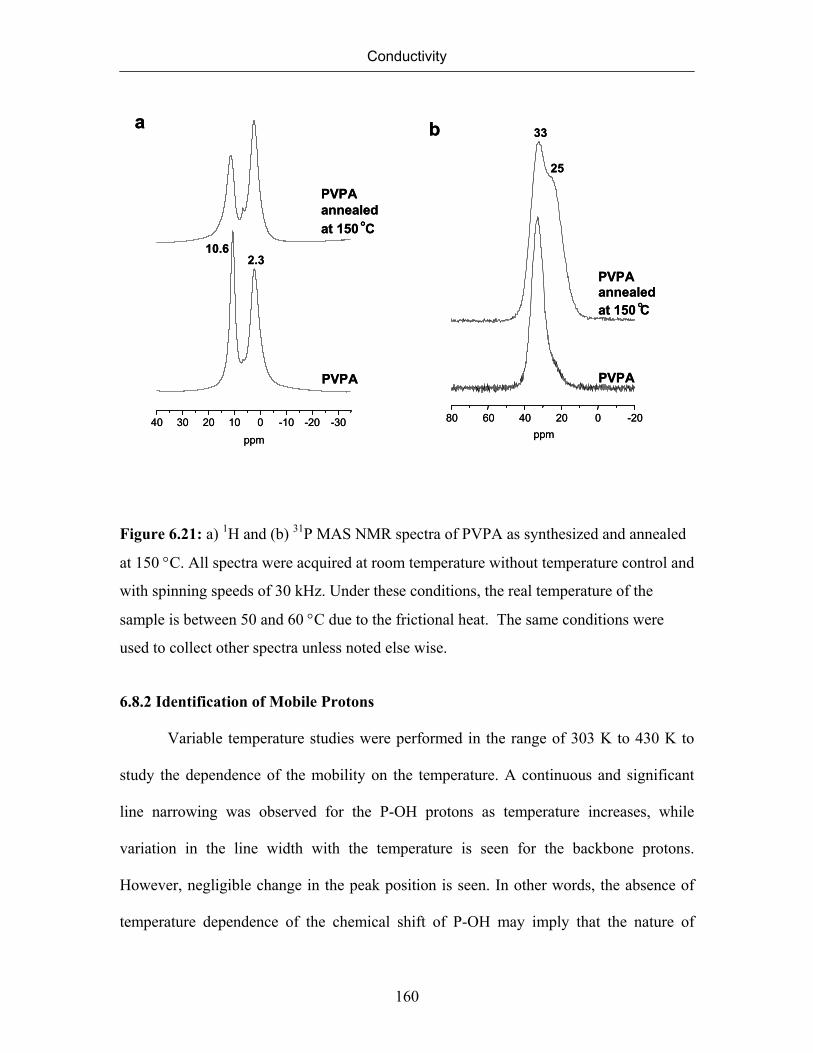
Conductivity
160
80 60 40 20 0 -20
b
25
ppm
PVPAannealed at 150 oC
PVPA
33
80 60 40 20 0 -20
b
25
ppm
PVPAannealed at 150 oC
PVPA
33
40 30 20 10 0 -10 -20 -30
a
ppm
2.310.6
PVPAannealed at 150 oC
PVPA
40 30 20 10 0 -10 -20 -30
a
ppm
2.310.6
PVPAannealed at 150 oC
PVPA
Figure 6.21: a) 1H and (b) 31P MAS NMR spectra of PVPA as synthesized and annealed
at 150 °C. All spectra were acquired at room temperature without temperature control and
with spinning speeds of 30 kHz. Under these conditions, the real temperature of the
sample is between 50 and 60 °C due to the frictional heat. The same conditions were
used to collect other spectra unless noted else wise.
6.8.2 Identification of Mobile Protons
Variable temperature studies were performed in the range of 303 K to 430 K to
study the dependence of the mobility on the temperature. A continuous and significant
line narrowing was observed for the P-OH protons as temperature increases, while
variation in the line width with the temperature is seen for the backbone protons.
However, negligible change in the peak position is seen. In other words, the absence of
temperature dependence of the chemical shift of P-OH may imply that the nature of
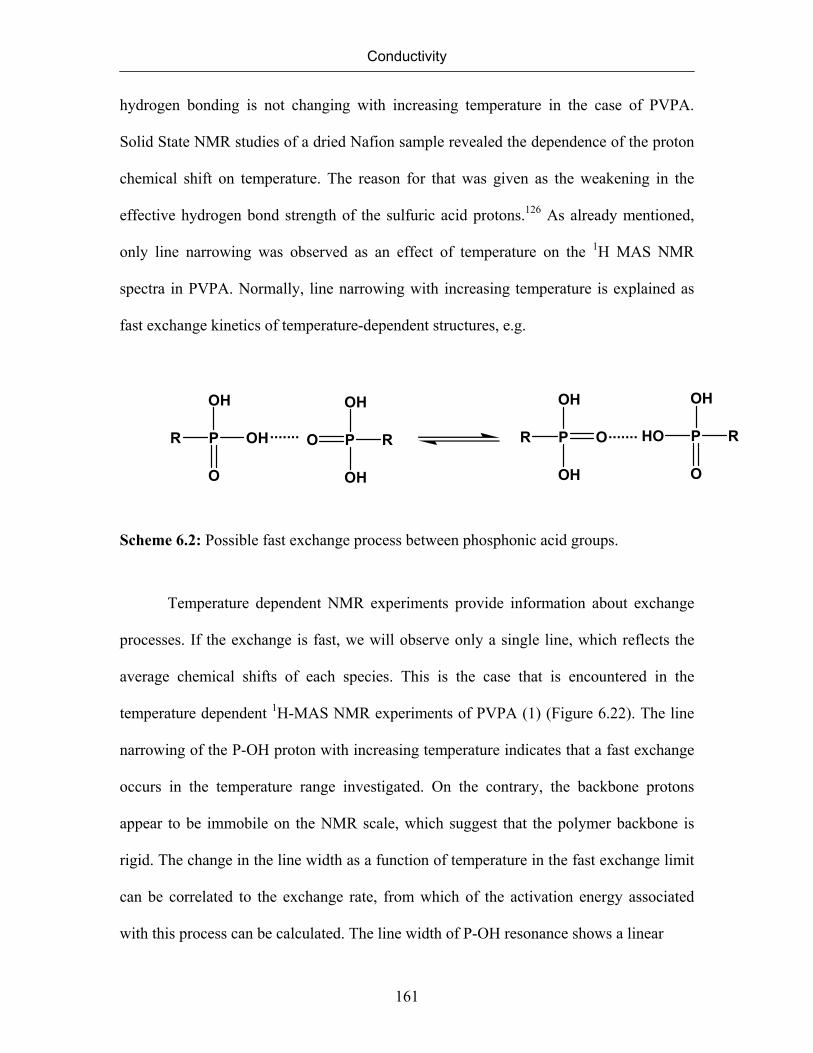
Conductivity
161
hydrogen bonding is not changing with increasing temperature in the case of PVPA.
Solid State NMR studies of a dried Nafion sample revealed the dependence of the proton
chemical shift on temperature. The reason for that was given as the weakening in the
effective hydrogen bond strength of the sulfuric acid protons.126 As already mentioned,
only line narrowing was observed as an effect of temperature on the 1H MAS NMR
spectra in PVPA. Normally, line narrowing with increasing temperature is explained as
fast exchange kinetics of temperature-dependent structures, e.g.
R P OH
O
OH
P R
OH
OH
O R P O
OH
OH
HO P R
O
OH
....... .......
Scheme 6.2: Possible fast exchange process between phosphonic acid groups.
Temperature dependent NMR experiments provide information about exchange
processes. If the exchange is fast, we will observe only a single line, which reflects the
average chemical shifts of each species. This is the case that is encountered in the
temperature dependent 1H-MAS NMR experiments of PVPA (1) (Figure 6.22). The line
narrowing of the P-OH proton with increasing temperature indicates that a fast exchange
occurs in the temperature range investigated. On the contrary, the backbone protons
appear to be immobile on the NMR scale, which suggest that the polymer backbone is
rigid. The change in the line width as a function of temperature in the fast exchange limit
can be correlated to the exchange rate, from which of the activation energy associated
with this process can be calculated. The line width of P-OH resonance shows a linear
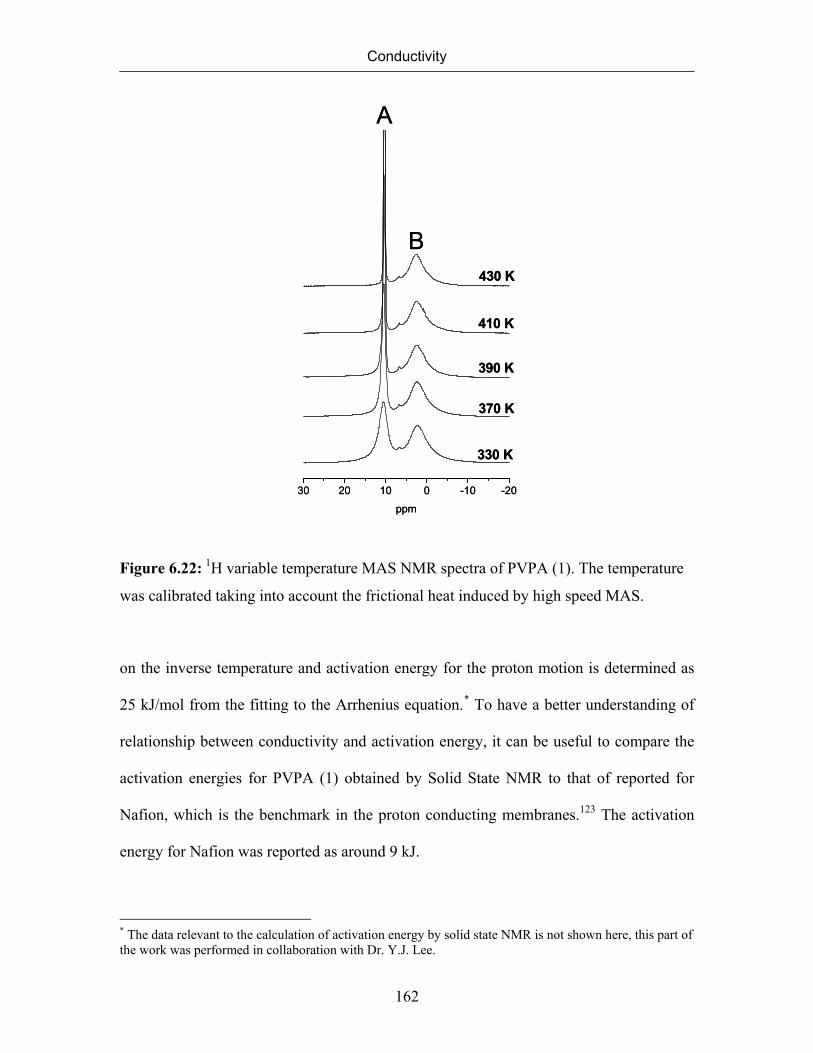
Conductivity
162
30 20 10 0 -10 -20
430 K
410 K
390 K
370 K
330 K
ppm
A
B
30 20 10 0 -10 -20
430 K
410 K
390 K
370 K
330 K
ppm
A
B
Figure 6.22: 1H variable temperature MAS NMR spectra of PVPA (1). The temperature
was calibrated taking into account the frictional heat induced by high speed MAS.
on the inverse temperature and activation energy for the proton motion is determined as
25 kJ/mol from the fitting to the Arrhenius equation.* To have a better understanding of
relationship between conductivity and activation energy, it can be useful to compare the
activation energies for PVPA (1) obtained by Solid State NMR to that of reported for
Nafion, which is the benchmark in the proton conducting membranes.123 The activation
energy for Nafion was reported as around 9 kJ.
* The data relevant to the calculation of activation energy by solid state NMR is not shown here, this part of the work was performed in collaboration with Dr. Y.J. Lee.
Conductivity
163
6.8.3 Rigidity of the Polyvinyl Backbone (Detection of Immobile Protons)
Other than OH protons attached to the phosphonic acid functionality, PVPA
possesses protons on the polymer backbone. In order to investigate the effect of
temperature on the mobility of the backbone protons, 13C CP MAS spectra were obtained
at room and elevated temperatures as shown in Figure 6.23.
At room temperature, a single 13C resonance at 32 ppm was observed, which was
assigned to the polyvinyl backbone. The resolution was not good enough to make a more
detailed assignment of the 13C-NMR spectrum. The spectrum remains unchanged at
elevated temperature. The temperature behavior of 13C-NMR, in conjunction with the 1H
VT NMR data suggests that the backbone protons are immobile at least on NMR time
scale. No glass transition was observed in the temperature range studied. When a
substance undergoes a glass transition, a dramatic decrease in the line widths occurs,
which is not the case for PVPA. Other than Solid State NMR, we also used Differential
Scanning Calorimetry in the temperature regime between 20 °C and 300 °C to observe
whether PVPA undergoes glass transition. However, we did not detect any glass
transition.127*
* The thermal properties of PVPA have been investigated in collaboration with Dr. A. Kaltbeitzel. The thermograms are not shown in this work.
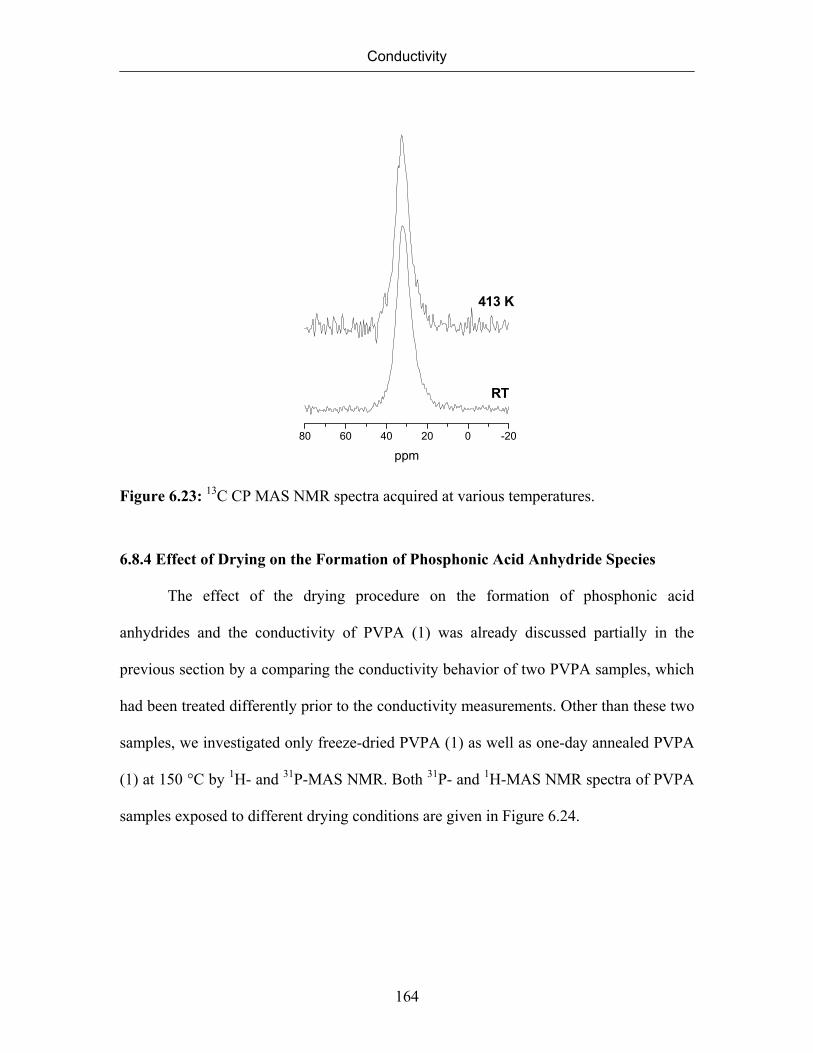
Conductivity
164
80 60 40 20 0 -20
ppm
RT
413 K
Figure 6.23: 13C CP MAS NMR spectra acquired at various temperatures.
6.8.4 Effect of Drying on the Formation of Phosphonic Acid Anhydride Species
The effect of the drying procedure on the formation of phosphonic acid
anhydrides and the conductivity of PVPA (1) was already discussed partially in the
previous section by a comparing the conductivity behavior of two PVPA samples, which
had been treated differently prior to the conductivity measurements. Other than these two
samples, we investigated only freeze-dried PVPA (1) as well as one-day annealed PVPA
(1) at 150 °C by 1H- and 31P-MAS NMR. Both 31P- and 1H-MAS NMR spectra of PVPA
samples exposed to different drying conditions are given in Figure 6.24.

Conductivity
165
50 40 30 20 10
Vacuum dried at 50°CFreeze dried1 day annealed at 150 °C2 days annealing at 150 °Cand dissolved in water 2 days annealed PVPA
25
ppm
33
50 40 30 20 10
Vacuum dried at 50°CFreeze dried1 day annealed at 150 °C2 days annealing at 150 °Cand dissolved in water 2 days annealed PVPA
25
ppm
33
15 10 5 0 -5
11.3
9.8Vacuum dried at 50°CFreeze dried
1day annealed at 150 °C
2 days annealing at 150 °Cand dissolved in water2 days annealed PVPA (1)
ppm
2.3
10.6
15 10 5 0 -5
11.3
9.8Vacuum dried at 50°CFreeze dried
1day annealed at 150 °C
2 days annealing at 150 °Cand dissolved in water2 days annealed PVPA (1)
ppm
2.3
10.6
Figure 6.24: The effect of drying on the formation of phopshonic acid anhydride: a) 31P-
MAS NMR and b) 1H-MAS NMR of PVPA exposed to different drying conditions.
It is expected that these PVPA samples differ in their water content since they are
dried differently. Qualitative information about their relative water content can be
obtained by the position of the P-OH resonance in their 1H-MAS NMR spectra. Due to
the fast exchange between water molecules and phosphonic acid group, position of the P-
OH signal shifts depending on the water content. Taking into account the fact that the
resonance of pure water appears at 4.8 ppm, a gradual shift to lower frequency is
predicted as the water content increases. Bearing this information in mind we can order
the samples in the increasing water content as follows:
2 days annealed PVPA < 1day annealed PVPA< vacuum dried PVPA< freeze-dried PVPA
1H-MAS NMR spectra of PVPA exposed to different drying conditions differ in
the position of their P-OH signal as well as the relative intensity and the line width of this
signal. Comparing the intensity of the P-OH resonance with that of backbone protons
Conductivity
166
clearly reveals the decrease of the number of OH protons in the annealed samples. This is
consisted with the suggestion that some of the OH protons are lost due to the formation f
phosphonic acid anhydride at high temperature. The line width for P-OH resonance in
1H-MAS NMR spectrum becomes narrower as the water content of the sample increases.
The P-OH resonance of 2 days annealed PVPA(1) at 150 °C annealed displayed the
broadest line width. The position of the resonance due to the polymer backbone protons
remains unchanged no matter which sample is under investigation.
31P-MAS NMR spectra of all PVPA samples exhibit 2 resonances at 33 and 25
ppm due to the phosphonic acid and phosphonic acid anhydride functionality. As
expected, the relative intensities of these peaks vary depending on the drying procedure
indicating that PVPA (1) samples exposed to different heat treatments contain different
fraction of phosphonic acid anhydride species. We only calculated the fraction of cyclic
anhydride species for two samples, namely, for the vacuum dried PVPA at 50 °C and 2
days annealed PVPA (1) at 150 °C. The fraction of cyclic anhydrides in vacuum dried
PVPA (1) and 2 days annealed PVPA (1) was found as 14% and 43%, respectively. The
effect of these cyclic anhydride species on the conductivity is already discussed in 6.6.1.
The reversibility of phosphonic acid anhydride formation was studied by
dissolving the annealed PVPA in water for 4h at room temperature followed by freeze-
drying. 31P MAS NMR of this sample after freeze drying has more condensated groups
than the dried PVPA (1) indicating that not all the phosphonic acid anhydride species
formed during the annealing procedure were hydrolyzed to free acid. This reveals that the
reaction leading to the formation of phosphonic acid anhydride species is not completely
reversible. The reversibility of this process may depend on the experimental conditions.
Conductivity
167
We found out that phosphonic acid anhydride signal almost vanished in the 31P-MAS
NMR spectrum after annealing the sample at 250 °C for 5 h and storing the polymer at
room temperature under 98% relative humidity for 2 days.127
6.8.5 Double Quantum Spectrum of PVPA
31P two dimensional double quantum (DQ) spectroscopy reveals information
about the spatial proximity between the different phosphonic acid groups. Since the
intensity of a double quantum signal is a function of inverse internuclear distance, and
recoupling times. DQ signal can provide information about the internuclear distances by
carefully choosing recoupling times. For example, presence of 31P-31P spin pairs within a
distance of 0.4 nm is expected to give rise to a DQ signal when back-to-back pulse
sequence is applied with 260 μs recoupling times (8 rotor periods under 30 kHz MAS
condition). Double quantum coherences are generated only from relatively strong dipole-
dipole couplings, in other words from the spins in very close proximity to each other.
Weak dipolar couplings, in other words the spin pairs separated further apart can be
detected by extending the recoupling times. 31P DQ experiments have been successfully
applied to various phosphate glasses to determine the connectivities between
phosphorous.125, 128
Figure 6.25 displays the two dimensional DQ NMR spectra of PVPA obtained at
430 K. Autocorrelation signals among phosphonic acid pairs (n) and among acid
anhydride pairs (na), respectively, are observed along the diagonal at 8 τ recoupling,
indicating each moiety is in close contact to each other. The diagonal represents the
dipolar couplings between the like 31P in PVPA. There is DQ cross peak indicating the
Conductivity
168
correlation between phosphonic acid and anhydride designated as na. At longer
recoupling time, the autocorrelation signal among phosphonic acid (n) and cross peak
between both acid moieties (na) increase in intensity, while the autocorrelation signal of
acid anhydride pairs (a) remains unaffected. The stronger autocorrelation signal from the
acid anhydride at short recoupling time suggest that these phosphorous are closer in space
in comparison to the normal phosphonic acid groups. This is expected from the geometry
of the anhydride. The P-P distances are 3.0 nm for the phosphonic acid anhydride and
4.9-5.3 nm for phosphonic acid. The existence of DQ cross peak between two acid
moieties indicates spatial proximities between phosphonic acid and phosphonic acid
anhydrides. This demonstrates that there is no domain separation between phosphonic
acid and phosphonic acid anhydride. Thus, it is clear that the condensation of phosphonic
acid occurs randomly throughout the system without forming any domain segregation.
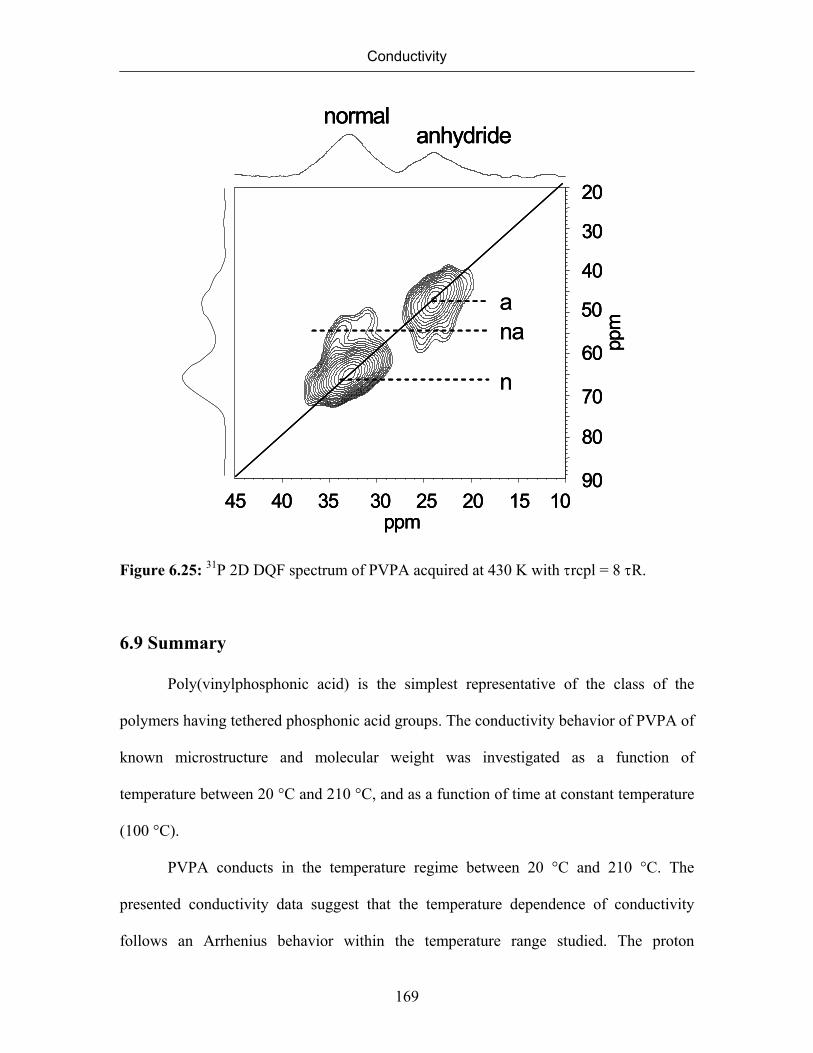
Conductivity
169
20
90
80
70
60
50
40
30
ppm
1045 40 35 30 25 20 15ppm
normalanhydride
na
n
a
20
90
80
70
60
50
40
30
ppm
1045 40 35 30 25 20 15ppm
normalanhydride
20
90
80
70
60
50
40
30
ppm
1045 40 35 30 25 20 15ppm
normalanhydride
na
n
a
Figure 6.25: 31P 2D DQF spectrum of PVPA acquired at 430 K with τrcpl = 8 τR.
6.9 Summary
Poly(vinylphosphonic acid) is the simplest representative of the class of the
polymers having tethered phosphonic acid groups. The conductivity behavior of PVPA of
known microstructure and molecular weight was investigated as a function of
temperature between 20 °C and 210 °C, and as a function of time at constant temperature
(100 °C).
PVPA conducts in the temperature regime between 20 °C and 210 °C. The
presented conductivity data suggest that the temperature dependence of conductivity
follows an Arrhenius behavior within the temperature range studied. The proton
Conductivity
170
conduction in PVPA seems to be facilated by the presence of water at low temperatures
where it acts as a vehicle.
The differences in the microstructures of PVPA samples is a consequence of the
different polymerization mechanisms of VPA and DMVP as already discussed in Chapter
3 in details. Polymerization of DMVP proceeds by head-to-tail addition. Therefore, the
PVPA obtained by the hydrolysis of PDMVP has a more regular structure compared to
the PVPA obtained by the direct polymerization of VPA since it only contains head-to-
tail linkages, whereas the polymerization of VPA leads to the presence of head-to-head
and tail-to-tail in addition to head-to-tail linkages. In other words, regioisomerism was
observed in the case of PVPA obtained directly by polymerization of VPA. The possible
types of the rings that can form are different for these two PVPA samples. PVPA samples
having various types of the rings in the structure can lead to a difference in the
conductivities depending on the relative stability of these rings. The presence and
formation of cyclic phosphonic acid anhydride species was detected by Solid State NMR.
Formation of these groups influences conductivity by a large extent. The formation of
these cyclic anhydride species is unavaidable due to thermal treatment of the polymer
after synthesis.
There are many open questions about mechanisms involved in the conductivity of
PVPA. It is still unclear whether the conductivity can be described by only Arrhenius
behavior at elevated temperatures.
CHAPTER 7
CONCLUSION AND OUTLOOK
Polymers with proton conducting units tethered to a polymer backbone was
suggested as an alternative to polymer electrolytes, where the conductivity greatly
depends on the presence of water and therefore, the operating temperature of the fuel cell
must be maintained below the boiling point of water. PVPA contains a high concentration
of phosphonic acid groups, and provides a good model system for the study of the
correlation of the structure and proton conduction mechanisms. The details of the
synthesis of PVPA and the properties of the resulting polymer were investigated for the
first time with emphasis on its potential application in fuel cells that are supposed to
operate at temperatures higher than 100 °C in a low humidity environment as the key
constituent of polymer electrolyte membranes.
The possible synthetic routes leading to PVPA were explored. Free radical
polymerization at 80 °C or higher temperatures is the only route available for direct
polymerization of VPA. The reason for the failure of polymerizations of VPA at lower
temperatures is due to the peculiar polymerization mechanism of VPA. A detailed
analysis of the 1H- and 13C-NMR spectra of PVPA prepared by free radical
polymerization of VPA revealed that it contained a substantial fraction of head-head and
tail-tail linkages. This unexpected result suggested that the polymer was actually formed
by cyclopolymerization starting from the vinylphosphonic acid anhydride which may be
present in equilibrium with the free acid.
Chapter 7
172
Free radical polymerization of VPA gave a high molecular weight∗ (Mw of 6.2 x
104g/mol) atactic PVPA. The microstructure, as revealed by NMR spectra, was described
for the first time for this type of polymer. The solution properties which characterize
PVPA as a polyelectrolyte were reported. Additionally, the properties relevant for the
application of PVPA in fuel cells were investigated. All PVPA samples displayed
conductivity in the temperature regime (20-210 °C) studied. Conductivity data of PVPA
suggest that the temperature dependence of conductivity of PVPA follows an Arrhenius
type of behavior between 20 and 210 °C. It was attempted to understand the nature of the
proton conduction in PVPA. The phosphonic acid functionality in PVPA undergoes
condensation leading to the formation of cyclic anhydrides, which was enhanced at
elevated temperatures. Formation of cyclic anhydrides affects the proton conductivity to a
large extent.
To have a clearer picture of the underlying complex conduction mechanism, the
proton mobility of the polymer should be investigated at various temperatures. In order to
use PVPA as a proton exchange membrane in fuel cells, the conductivity of the polymer
should be improved since 10-2 S/cm is the minimum conductivity at room temperature
that is required by the industry. PVPA alone is rigid because of the presence of a high
concentration of phosphonic acid groups, which are bonded by hydrogen bridges to each
other. The rigidity of the polymer may be decreased by the reduction of the concentration
of phopshonic acid groups, which may be achieved by the copolymerization of VPA with
other comonomers. If the comonomers are chosen appropriately, it may be possible to
change the dissolution behavior of PVPA. Since PVPA is water-soluble and water is
∗ The high molecular weight polymer was obtained when the initiator concentration was 0.1 mol percent relative to the monomer.

Chapter 7
173
produced during the operation of the fuel cell, the polymer may be washed out with time
unless it is used in a protected way. Achieving copolymers of VPA that are insoluble in
water may solve this problem. Knowledge about the polymerization mechanism of VPA
will be very helpful to develop synthetic procedures to obtain copolymers of VPA.

References:
1. Carrette, L.; Friedrich, K. A.; Stimming, U. ChemPhysChem 2000, 1, (4), 162. 2. Kordesch, K. V. Electrochim. Acta 1971, 16, 597. 3. Larminie, J.; Dicks, A., Fuel Cell Systems Explained. 2 ed.; John Wiley & Sons
Inc: England, 2003. 4. Savadogo, O. Journal of New Materials for Electrocehmical Sytems 1998, 1, 47. 5. Cohen, R. In Gemini Fuel Cell System, Power Sources Conference, 24-26 th May,
1966; 1966; p 21. 6. Gierke, T. D. J. Electrochem. Soc. 1977, (134), 319c. 7. Kreuer, K. D. J. Membr. Sci. 2001, 185, 29. 8. Kreuer, K. D. Solid State Ionics 1997, 97, (1), 1. 9. Ianniello, R.; Schmidt, V. M.; Stimming, U.; Strumper, J.; Wallan, A.
Electrochim. Acta 1994, 39, 1863. 10. Baschuk, J. J. Int. J. Energy. Res. 2001. 11. Wainright, J. S.; Wang, J. T.; Savinelli, R. F.; Litt, M.; Moadell, H. Proc. -
Electrochem. Soc. 1994, 94, 255. 12. Defendini, F.; Armand, M.; Gorecki, W.; Berthier, C. Extended Abstract,
Electrochemical Society,San Diego Meeting 3 1986, 86. 13. Donoso, P.; Gorecki, W.; Berthier, C.; Defendini, F.; Poinsignon, C.; Armand, M.
Solid State Ionics 1988, 28, 969. 14. Petty-Weeks, S.; Zupanic, J. J.; Swedo, J. R. Solid State Ionics 1988, 31, (2), 117. 15. Przyluski, J.; Wioczerek, W.; Potarzweski, Z.; Saiti, P.; Giadano, N., Recent
Advances in Fast Proton Conducting Materials and Devices. WorldScientific: Singapore, 1990.
16. Wainright, J.; Wang, J. T.; Weng, D.; Savinelli, R. F.; Litt, M. J. Electrochem. Soc. 1995, (142), L121.
17. Kreuer, K. D.; Fuchs, A.; Ise, M.; Spaeth, M.; Maier, J. Electrochim. Acta 1998, 43, (10-11), 1281.
18. Kreuer, K. D., Solid State Ionics: Science and Technology New Proton Conducting Polymers for Fuel Cell Applications. World Science Publishing: Singapore, 1998; p 263.
19. Schuster, M.; Meyer, W. H.; Wegner, G.; Herz, H. G.; Ise, M.; Schuster, M.; Kreuer, K. D.; Maier, J. Solid State Ionics 2001, 145, 82.
20. Lee, S. Y.; Scharfenberger, G.; Meyer, W. H.; Wegner, G. Adv. Mater. 2005, 17, (5), 626.
21. Scharfenberger, G.; Meyer, W. H.; Wegner, G.; Schuster, M. F. H.; Kreuer, K. D.; Maier, J. Fuel Cells 2006, 6, (3-4), 237.
22. Schuster, M.; Rager, T.; Noda, A.; Kreuer, K. D.; Maier, J. Fuel Cells 2005, 5, (3), 355.
23. Vanysek, P., Handbook of Chemistry and Physics. 76 ed.; CRC Press: NY, USA, 1995.
24. Meng, Y. Z.; Tjong, S. C.; Hay, A. S.; Wang, S. J. Eur. Polym. J. 2003, 39, 627. 25. Stone, C.; Daynard, T. S.; Hu, L. Q.; Mah, C.; Steck, A. E. Jounal of New
Materials for Electrochemical Systems 2000, 3, 43.
Reference
176
26. Allcock, H. R.; Hofmann, M. A.; Ambler, C. M.; Morford, R. V. Macromol. 2002, 35, 3484.
27. Florjanczyk, Z.; Wielgus-Barry, E.; Poltarzweski, Z. Solid State Ionics 2001, 145, (1-4), 119.
28. Yamabe, M.; Akiyama, K.; Akatsuka, Y.; Kato, M. Eur. Polym. J. 2000, 36, 1035.
29. Steininger, H.; Schuster, M. F. H.; Kreuer, K. D.; Maier, J. Solid State Ionics 2006, 177, (26-32), 2457.
30. Yamada, M.; Honma, I. Polym. 2005, 45, 2986. 31. Pike, R. M.; Cohen, R. A. J. Polym. Sci. 1960, 44, 531. 32. McIvor, R. A.; Grant, G. A.; Hubley, C. E. Can. J. Chem. 1956, 34, 1611. 33. Berghauser, G.; Uhlig, F. U.S. Patent 4,153,461. 1979. 34. Anbar, M.; John, G. A. S.; Scott, A. C. J. Dent. Res. 1974, 53, (4), 867. 35. Ellis, J.; Wilson, A. D. J. Mater. Sci. Lett. 1990, 9, 1058. 36. Braybook, J. H.; Nicholson, J. W. J. Mater. Chem. 1993, 3, (4), 361. 37. Park, C. H.; Nam, S. Y.; Lee, Y. M. J. App. Poly. Sci. 1999, 74, 83. 38. Eom, G. T.; Oh, S. Y.; Park, T. G. J. App. Poly. Sci. 1998, 70, 1947. 39. Arcus, C. L.; Matthews, R. J. S. Chemistry and Industry 1958, 28, 890. 40. Erdemi, H.; Bozkurt, A. Eur. Polym. J. 2004, 40, 1925. 41. Levin, Y. A.; Romanov, V. G.; Ivanov, B. Y. Vysokomol. Soyed. 1975, A17, (4),
766. 42. Jin, S.; Gonsalves, K. E. Macromol. 1998, 31, 1010. 43. Kosolapoff, G. M. J. Am. Chem. Soc. 1952, 74, 3427. 44. Kosolapoff, G. M. J. Am. Chem. Soc. 1948, 70, 1971. 45. Billmeyer, J. F. W., Textbook of Polymer Science. 3 ed.; John Wiley and Sons:
1970. 46. Polymer Handbook. 4 ed.; John Wiley and Sons Inc.: NY, USA, 1999. 47. Moedritzer, K. J. Am. Chem. Soc. 1961, 83, 4381. 48. Feng, X.; Pan, C.; Wang, J. T.; Liu, Y.; Pan, C. Y. Macromol. Chem. Phys. 2001,
202, (3403). 49. Liu, Y.; Pan, C. Y. J. Polym. Sci. Part A: Polym. Chem. 1997, 35, 3403. 50. Coote, M. L.; Krenske, E. H.; Izgorodina, E. I. Macromol. Rapid. Commun. 2006,
27, 473. 51. Goto, A.; Fukuda, T. Prog. Polym. Sci. 2004, 29, 329. 52. Li, C.; Han, J.; Ryu, C. Y.; Benicewicz, B. C. Macromol. 2006, 39, 3175. 53. Perrier, S.; Takolpuckdee, P. J. Polym. Sci. Part A: Polym. Chem. 43, 5347. 54. Moad, G.; Solomon, D. H., The Chemistry of Free Radical Polymerization. 1 ed.;
Elsevier Science Inc.: 1995. 55. McCormick, C. L.; Lowe, A. B. Acc. Chem. Res. 2004, 37, 312. 56. Bamford, C. H.; Eastmond, G. C.; Ward, J. C. Proceedings of Royal Society
1963, A 271, 357. 57. Anseth, K. S.; Scott, A. R.; Peppas, N. A. Macromol. 1996, 29, 8308. 58. Bokias, G.; Durand, A.; Hourdet, D. Macromol. Chem. Phys. 1998, 199, 1387. 59. Schildknecht, C., Vinyl and Related Polymers. John Wiley and Sons Inc.: NY,
USA, 1962. 60. Oiu, J.; Charleux, B.; Matyjaszweski, K. Prog. Polym. Sci. 2002, 26, (10), 2083.
Reference
177
61. Patten, T. E.; Matyjaszewski, K. Adv. Mater. 1998, 10, 901. 62. Kuchta, F. D.; Herk, A. L. V.; German, A. N. Macromol. 2000, 33, 3641. 63. Chiefari, J.; Chong, Y. K.; Ercole, F.; Krstina, J.; Jeffery, J.; Lee, T. P. T.;
Madunne, R. T. A.; Meijs, G. G.; Moad, C. L.; Moad, G.; Rizzardo, E.; Thang, S. H. Macromol. 1998, (31), 5559.
64. Ladaviere, C.; Dorr, N.; Claverie, J. P. Macromol. 2001, 34, 5370. 65. Eisenberg, H.; Mohan, G. R. J. Phys. Chem. 1959, 63, 671. 66. Aldermann, V. V.; Hanford, W. E. U.S. Patent 2,348,705. 1944. 67. Jones, G. D.; Barnes, C. E. U.S. Patent 2,515,714. 1950. 68. Breslow, D. S.; Hulse, G. E. J. Am. Chem. Soc. 1954, 76, 6399. 69. Overberger, C. G.; Baldwin, D. E.; Gregor, H. P. J. Phys. Chem. 1950, 72, 4864. 70. Kern, W.; Schulz, R. C. Angew. Chem. 1957, 69, (5), 153. 71. Breslow, D. S.; Kutner, A. J. Polym. Sci. 1958, 27, 295. 72. Bingöl, B.; Meyer, W. H.; Wagner, M.; Wegner, G. Macromol. Rapid. Commun.
2006, 27, 1719. 73. Liu, Z.; Brooks, B. W. Polym. Int. 1998, 45, 217. 74. Miller, M. L.; Donnell, K. O.; Sokgman, J. J. Colloid. Sci. 1962, 17, 649. 75. Skoog, D. A.; Holler, F. H.; Nieman, T. A., Principles of Instrumental Analysis. 5
ed.; Saunders College Publishing: San Fransisco, USA, 1998. 76. Wang, D.; Elisseeff, J. H., Photopolymerization. In Encyclopedia of Biomaterials
and Biomedical Engineering, Marcel Dekker: 2004; p 1212. 77. Sarac, A. S. Progress in Polymer Science 1999, 24, 1149. 78. Quhadi, T.; Forte, R.; Jerome, R.; Fayt, R.; Theyssie, P. 1984. 79. Quhadi, T.; Forte, R.; Jerome, R.; Fayt, R.; Theyssie, P. 1988. 80. Fayt, R.; Forte, R.; Jacobs, C.; Jerome, R.; Quhadi, T.; Teyssie, P.; Varshney, S.
K. Macromol. 1987, (20), 1442. 81. Varshney, S. K.; Hauteeker, J. P.; Fayt, R.; Jerome, R.; Teyssie, P. Macromol.
1990, (23), 2618. 82. Mandel, M., Ecylopedia of Polymer Science and Engineering. Wiley: NY, USA,
1987; Vol. 11. 83. Burke, S. E.; Barett, C. J. Langmuir 2003, 19, 3297. 84. Molyneaux, P., Water Soluble Synthetic Polymers. CRC Press: Florida, USA,
1983. 85. Katchalsky, A.; Spinik, P. J. Polym. Sci. 1947, 2, 432. 86. Woodbury, C. P. J. Phys. Chem. 1993, 97, 3623. 87. Nagasawa, M.; Murase, T.; Kondo, K. J. Phys. Chem. 1965, 69, 4005. 88. Plamper, F. A.; Becker, H.; Lanzendörfer, M.; Patel, M.; Wittemann, A.; Ballauff,
M.; Müller, A. H. E. Macromol. Chem. Phys. 2005, 206, 1813. 89. Onouchi, H.; Hasegawa, T.; Kashiwagi, D.; Ishiguro, H.; Maeda, K.; Yashima, E.
Macromol. 2005, 38, 8625. 90. Crofts, P. C.; Kosolapoff, G. M. J. Am. Chem. Soc. 1953, 75, 3379. 91. Kodama, H.; Miyajima, T.; Mori, M.; Takahshi, M.; Nishimura, H.; Ishiguro, S.
Colloid Polym. Sci. 1997, 275, 938. 92. Kawaguchi, Y.; Nagasawa, M. J. Phys. Chem. 1969, 73, (12), 4382. 93. Mandel, M. Polym. J. 1970, 6, 807.
Reference
178
94. Lagueci, A.; Ulrich, S.; Labille, J.; Rouge, N. F.; Stoll, S.; Buffle, J. Eur. Polym. J. 2006, 42, 1135.
95. Speiser, R.; Hills, C. H.; Eddy, C. R. J. Phys. Colloid Chem. 1945, 49, 334. 96. Arnold, A.; Overbeek, J. T. G. J. Phys. Chem. 1950, 69, 192. 97. Kern, W.; Herold, W.; Scherhag, B. Makromol. Chem. 1955/1956, 17, 231. 98. Tonelli, A. E., NMR Spectroscopy and Polymer Microstructure: The
Conformational Connection. VCH: NY, USA, 1989. 99. Koenig, J. L., Chemical Microstructure of Polymer Chains. Wiley Interscience
Publ: NY, USA, 1980. 100. Frisch, H. L.; Mallows, C. L.; Bovey, F. A. J. Chem. Phys. 1966, 45, 1565. 101. Bovey, F. A. Acc. Chem. Res. 1968, 1, 175. 102. Gottlieb, H. E.; Kotlyar, V.; Nudelmann, A. J. Org. Chem. 1997, 62, 7512. 103. Gunther, H., NMR Spectroscopy. John Wiley and Sons Inc.: NY, USA, 1996. 104. Chang, C.; Muccio, D. D.; Pierre, T. S. Macromol. 1985, 18, 2154. 105. Kodaira, T.; Liu, Q. Q.; Satoyamka, M.; Urushisaki, M.; Utsumi, H. Polym. 1999,
40, 6947. 106. Suchoparek, M.; Spevacek, J. Macromol. 1993, 26, 102. 107. Nishioka, A.; Yamaguchi, I.; Shimizu, H. J. Polym. Sci. 1960, 45, (145), 232. 108. Kremer, F.; Schönhals, A., Broadband Dielectric Spectroscopy. Springer:
Heidelberg, Germany, 2004. 109. Atkins, P. W., Physical Chemistry. 2 ed.; Oxford University Press: Oxford,
England, 1999. 110. Hardy, L. C.; Schriver, D. F. J. Am. Chem. Soc. 1085, 107, 3823. 111. MacCallum, J. R.; Vincent, C. A., Polymer Electrolye Reviews. Elsevier Applied
Science: NY, USA, 1987; Vol. 1. 112. Owen, J., Ionic Conductivity. In Comprehensive Polymer Science, Geoffrey, A.,
Ed. Pergamon Press: Oxford, England, 1989. 113. Armand, M. Solid State Ionics 1983, 9, (10), 945. 114. Funke, K. Solid State Ionics 1986, 18-19, 183. 115. Debye, P.; Hückel, E. Phys. Z. 1923, 24, 185. 116. Debye, P.; Falkenhagen, H. Phys. Z. 1928, 29, 401. 117. Onsager, L. Phys. Z. 1926, 27, 388. 118. Funke, K.; Hoppe, R. Solid State Ionics 1990, 40, 200. 119. Funke, K. Mat. Res. Soc. Symp. Proc. 1991, 210, 97. 120. Goward, G. R.; Schuster, M. F. H.; Sebastiani, D.; Schnell, I.; Spiess, H. W. J.
Phys. Chem. B 2003, 106, 9322. 121. Hickmann, B. S.; Mascal, M.; Titman, J. J.; Wood, I. G. J. Am. Chem. Soc. 1999,
121, 11486. 122. Grimmer, A. R.; Blümich, B., Solid State NMR I: Methods. Springer Verlag:
Heidelberg, Germany, 1994. 123. Mauritz, K. A.; Moore, R. B. Chem. Rev. 2004, 104, 4535. 124. Jiang, D. D.; Yao, Q.; McKinney, M. A.; Wilkie, C. A. Polym. Degrad. Stab.
1999, 63, 423. 125. Harris, R. K.; Jackson, P.; Mervin, L. H.; Say, B. J. J. Chem. Soc., Faraday.
Trans. 1 1988, 84, (11), 3649. 126. Ye, G.; Janzen, N.; Goward, G. R. Macromol. 2006, 39, 3283.
Reference
179
127. Kaltbeitzel, A.; Schauff, S.; Steininger, H.; Bingöl, B.; Brunklaus, G.; Meyer, W. H.; Spiess, H. W. Solid State Ionics Conference Papers submitted.
128. Feike, M.; Graf, R.; Schnell, I.; Jager, C.; Spiess, H. W. J. Am. Chem. Soc. 1996, 118, 9631.

Appendix I: NMR Spectra
A: 1H-NMR spectra of poly(vinylphosphonic acid)s and polyphopshonates before
purification to determine the conversion
1.
85
44
5.
97
10
In
te
gr
al
( p p m)- 2024681 01 21 41 6
a
b
Vinyl groupsleft
CH2 CH
P(O)(OCH3)2
n
b
a
Figure 1: 1H-NMR (300 MHz) spectrum of PDMVP in D2O
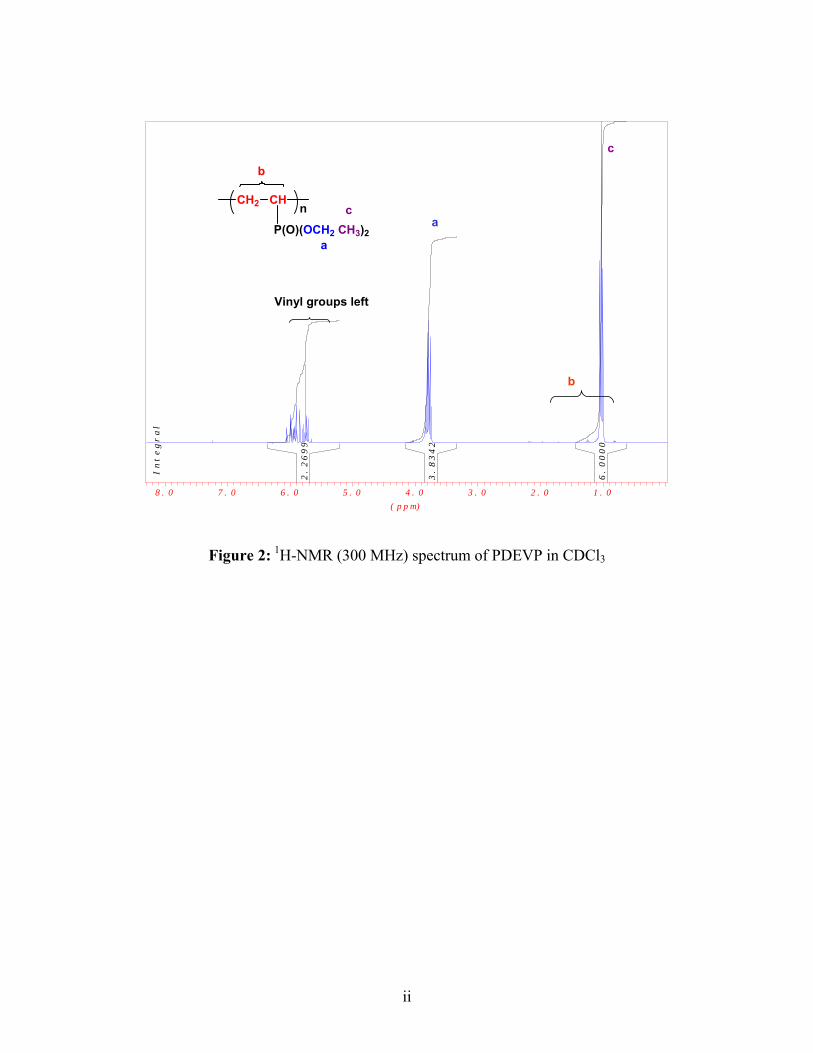
ii
CH2 CH
P(O)(OCH2 CH3)2
n
b
a
ca
c
b
Vinyl groups left2
.2
69
9
3.
83
42
6.
00
00
In
te
gr
al
( p p m)1 . 02 . 03 . 04 . 05 . 06 . 07 . 08 . 0
Figure 2: 1H-NMR (300 MHz) spectrum of PDEVP in CDCl3
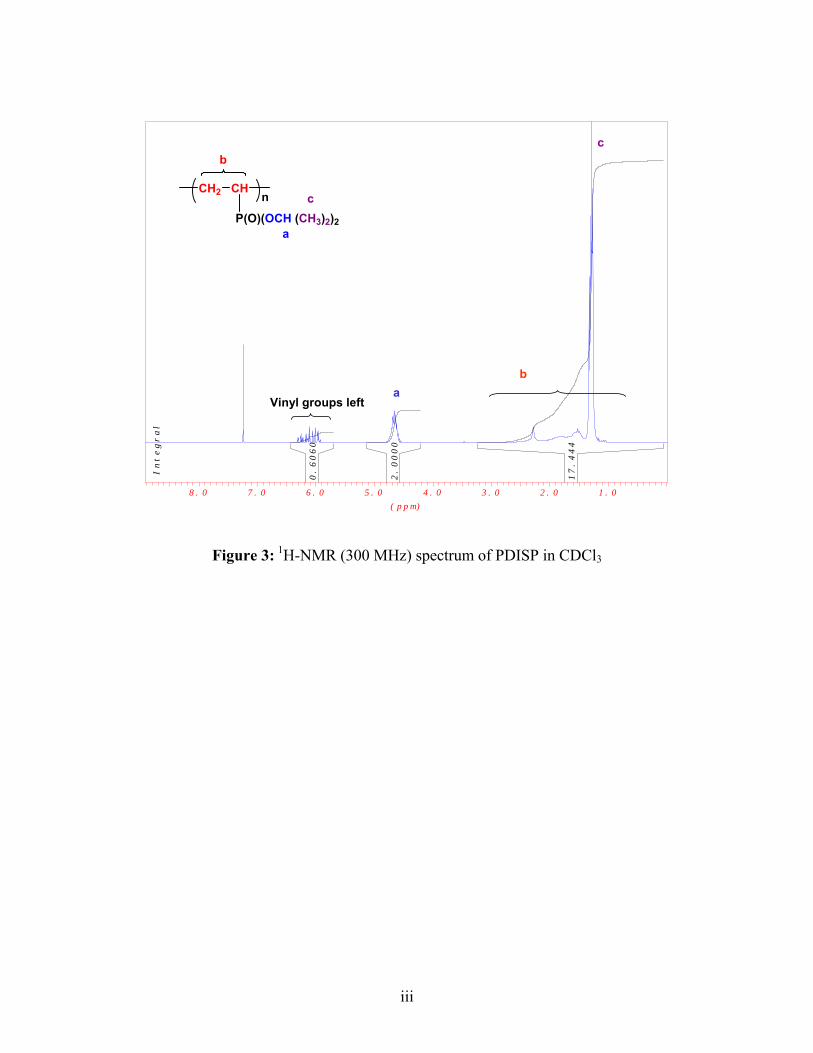
iii
Vinyl groups lefta
CH2 CH
P(O)(OCH (CH3)2)2
n
b
a
c
b
c
0.
60
60
2.
00
00
17
.4
44
In
te
gr
al
( p p m)1 . 02 . 03 . 04 . 05 . 06 . 07 . 08 . 0
Figure 3: 1H-NMR (300 MHz) spectrum of PDISP in CDCl3
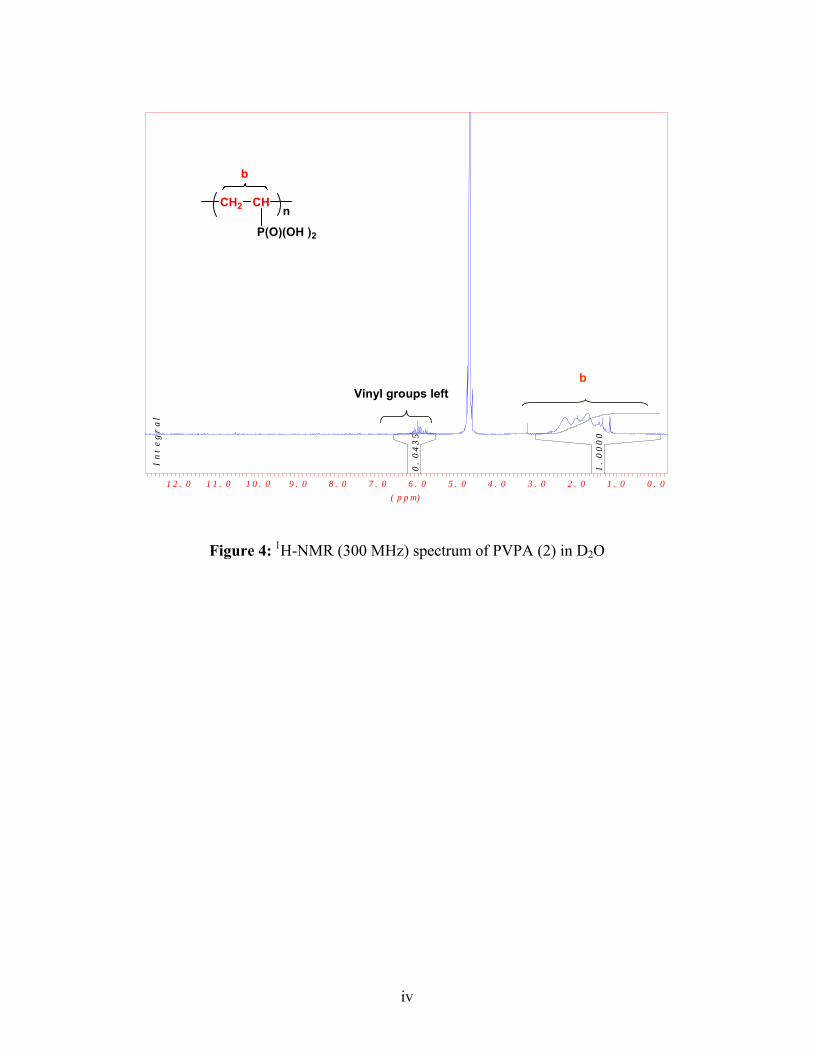
iv
CH2 CH
P(O)(OH )2
n
b
0.
04
35
1.
00
00
In
te
gr
al
( p p m)0 . 01 . 02 . 03 . 04 . 05 . 06 . 07 . 08 . 09 . 01 0 . 01 1 . 01 2 . 0
bVinyl groups left
Figure 4: 1H-NMR (300 MHz) spectrum of PVPA (2) in D2O
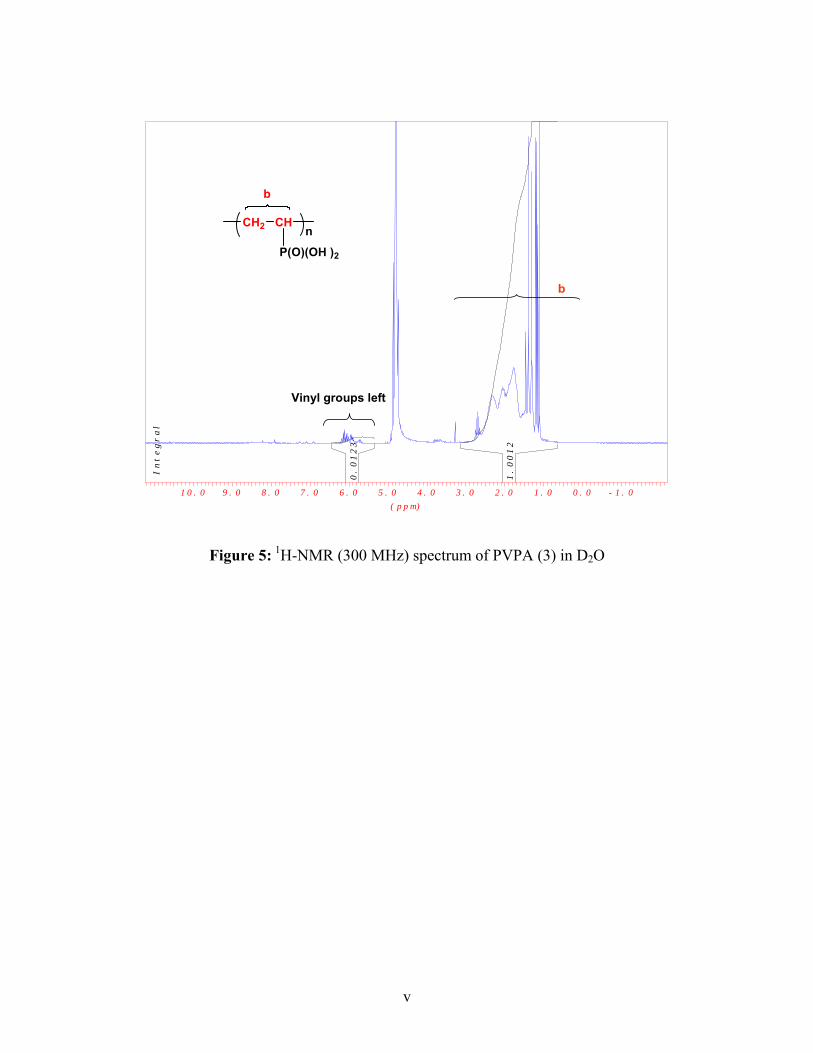
v
CH2 CH
P(O)(OH )2
n
b
Vinyl groups left
0.
01
23
1.
00
12
In
te
gr
al
( p p m)- 1 . 00 . 01 . 02 . 03 . 04 . 05 . 06 . 07 . 08 . 09 . 01 0 . 0
b
Figure 5: 1H-NMR (300 MHz) spectrum of PVPA (3) in D2O

vi
B: 1H- NMR spectra of Poly(vinylphosphonates) after purification
CH2 CH
P(O)(OCH2 CH3)2
n
b
a
c
ba
c
7 6 5 4 3 2 1 PPM7 6 5 4 3 2 1 PPM
Figure 6: 1H-NMR (500 MHz) spectrum of PDEVP (50 mg/0.8 mL CDCl3)
\
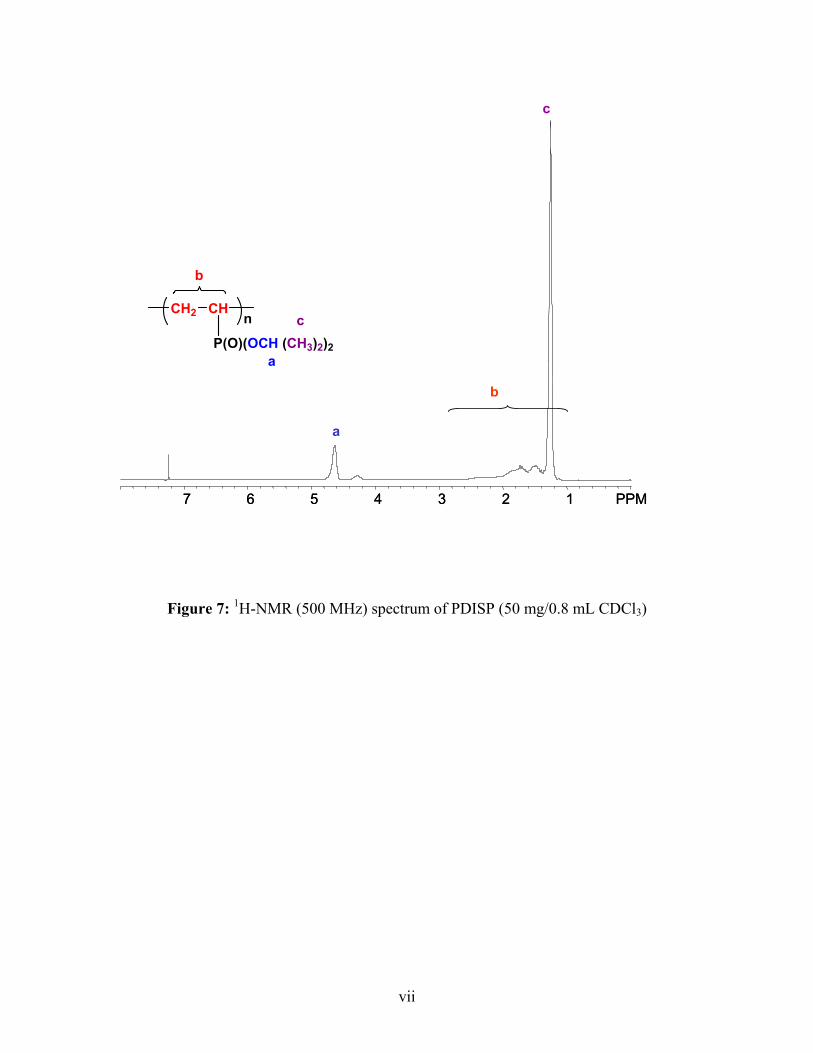
vii
CH2 CH
P(O)(OCH (CH3)2)2
n
b
a
c
7 6 5 4 3 2 1 PPM7 6 5 4 3 2 1 PPM
c
b
a
Figure 7: 1H-NMR (500 MHz) spectrum of PDISP (50 mg/0.8 mL CDCl3)
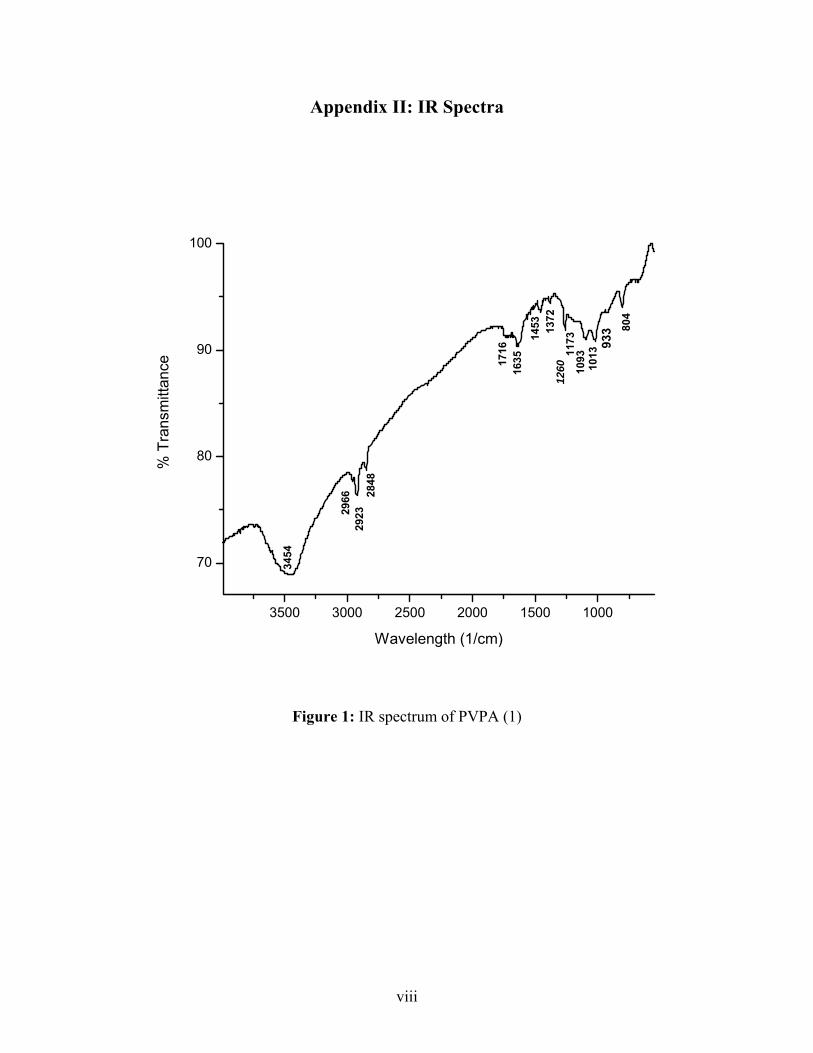
viii
Appendix II: IR Spectra
3500 3000 2500 2000 1500 1000
70
80
90
100
% T
rans
mitt
ance
Wavelength (1/cm)
3454
2966
2923
2848
1716
1635
1453 13
7212
60 1093
1013
933 80
4
1173
Figure 1: IR spectrum of PVPA (1)
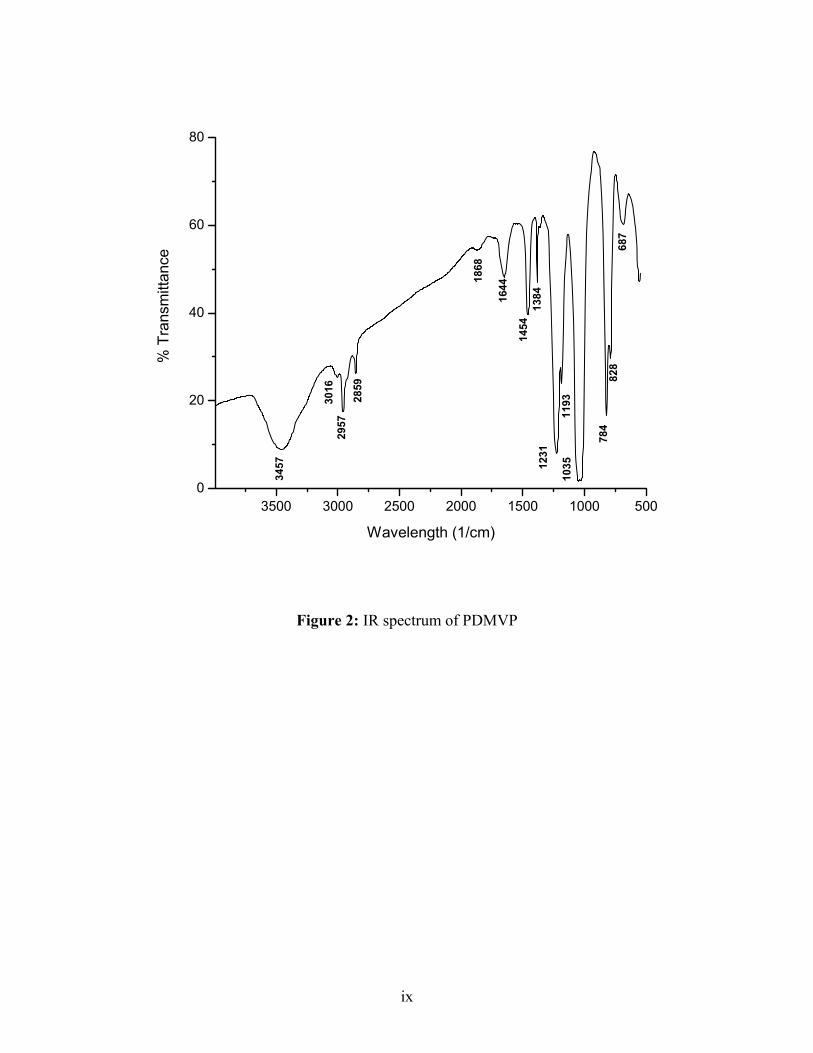
ix
3500 3000 2500 2000 1500 1000 5000
20
40
60
80
% T
rans
mitt
ance
Wavelength (1/cm)
3457
3016
2957
2859
1868
1644
1454
1384
1231
1193
1035
828
784
687
Figure 2: IR spectrum of PDMVP

x
4000 3500 3000 2500 2000 1500 1000 5000
20
40
60
80
100
688.
1277
6.11
940.
4210
22.5
811
63.5
3
1216
.48
1392
.4714
39.5
8
2907
.46
2983
% T
rans
mitt
ance
Wavelength (1/cm)13
64.0
4
1098
.5
Figure 3: IR spectrum of PDEVP
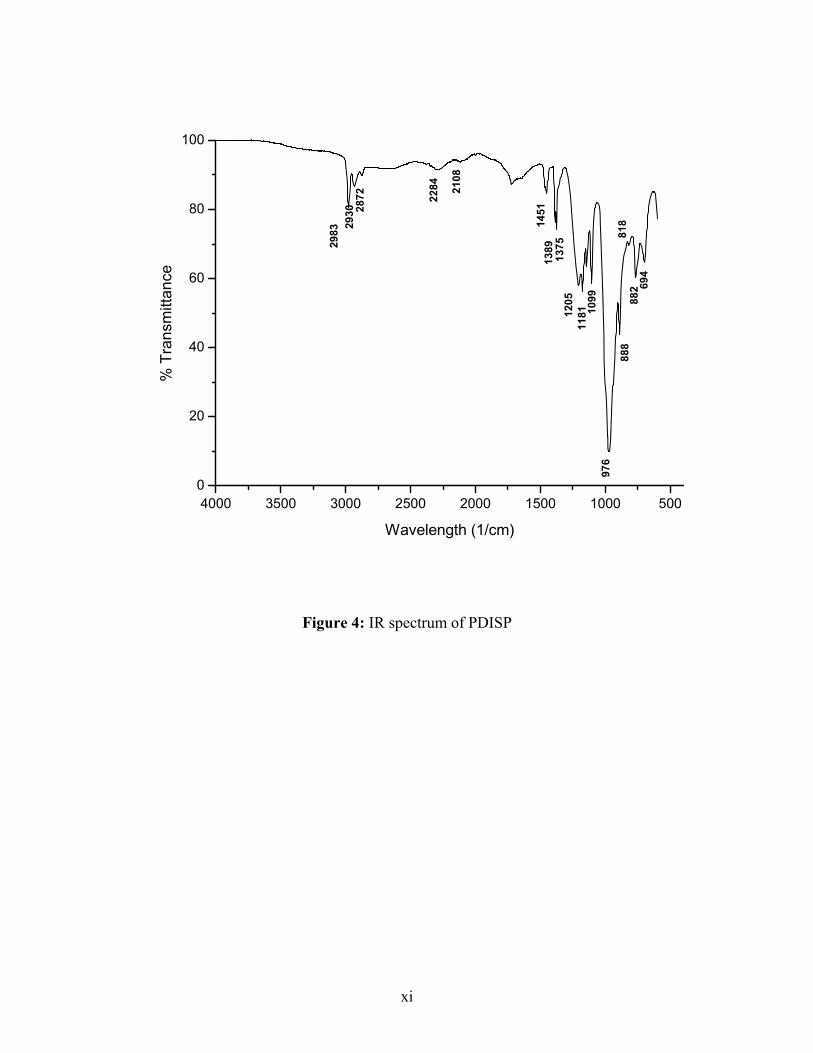
xi
4000 3500 3000 2500 2000 1500 1000 5000
20
40
60
80
100
694
882
976
1099
118112
0513
75
1451
2108
2284
2872
2930
2983
% T
rans
mitt
ance
Wavelength (1/cm)13
89
888
818
Figure 4: IR spectrum of PDISP
xii
APPENDIX III: Synthetic Procedure for Photopolymerization of VPA,
DEVP, and DISP, Redox Polymerization of VPA, Polymerization of
Salts of VPA, and Anionic Polymerization of DEVP
3.1 Materials
Only the chemicals which are not described in the experimental section (Chapter
2) are mentioned here. 2,2-dimethoxy-2-phenylacetophenone (Aldrich, 98%), ammonium
persulfate (APS) (Aldrich, 98%), N,N,N’N’-tetramethylethylenediamine (TEMED)
(Aldrich, 98%), 4,4-Azobis(4-cyanovaleric acid) (Aldrich, 98%), secondary butyllithium
solution in cyclohexane (Aldrich) were used as received.
3.2 Photopolymerization of VPA, DISP, and DEVP
VPA (0.09 mol, 9.723 g) and 2,2-dimethoxy-2-phenylacetophenone (0.009 mol,
2.3 g) were dissolved in methanol (70 mL). DISP (0.0356 mol, 7 mL) and 2,2-
dimethoxy-2-phenylacetophenone (0.00356 mol, 0.91 g ) were dissolved in methanol (70
mL). DEVP (0.0455 mol, 7 mL), and 2,2-dimethoxy-2-phenylacetophenone (0.00455
mol, 1.166g) were dissolved in methanol (70 mL). All polymerization reactions were
irradiated by a mercury lamp at room temperature.
3.3 Redox Polymerization of VPA
VPA (0.0025 mol), APS (0.00005 mol), TEMED (0.00000533 mol) were reacted
in water. Both mol percent of APS to VPA and TEMED to APS were varied in different
experiments. The mol percent of APS to VPA and TEMED to APS was varied between 2
and 0.1, and 10 to 1, respectively.

xiii
3.4 Polymerization of Salts of VPA
A solution of VPA ( 3 M) was prepared in water (5 mL), which was titrated
against sodium hydoxide solution to adjust the pH of the reaction medium
differently.AIBA was used as initiator. The mol percent of the initiator to monomer was
0.1. The reaction mixture was heated at 80 °C for several hours. The pH dependent
polymerization was also investigated in the presence of an acid initiator, 4,4-Azobis(4-
cyanovaleric acid) under the same reaction conditions as AIBA.
3.5 Attempted Anionic Polymerization of DEVP
The anionic polymerization of DEVP was carried out with secondary butyllithium
as initiator in tetrahydrofuran. Both monomer, and solvent were distilled and all glasware
were degased prior to the polynerization. First, DEVP (5g) was dissolved in
tetrahydrofuran (50 mL), which was cooled to – 78 °C before the addition of the initiator.
The mol ratio of secondary butyllithium to monomer was 0.004. Methanol (1 mL) was
used to quench the polymerization. The same procedure was repeated in the presence of
lithium chloride (2.6 mmoles). Morover, diphenylbutyllithium was also tried as a more
sterically hindered initiator. The reactions with diphenylbutyllithium were carried out
both in the absence and presence of LiCl. All experimets were carried out at two different
temperatures, -78 °C, and at room temperature.