15N and 133Cs Solid NMR Studies on Ionic Dynamics in...
8
This work has been digitalized and published in 2013 by Verlag Zeitschrift für Naturforschung in cooperation with the Max Planck Society for the Advancement of Science under a Creative Commons Attribution 4.0 International License. Dieses Werk wurde im Jahr 2013 vom Verlag Zeitschrift für Naturforschung in Zusammenarbeit mit der Max-Planck-Gesellschaft zur Förderung der Wissenschaften e.V. digitalisiert und unter folgender Lizenz veröffentlicht: Creative Commons Namensnennung 4.0 Lizenz. 15 N and 133 Cs Solid NMR Studies on Ionic Dynamics in Plastic CsN0 2 * H. Honda 3 , M. Kenmotsu 3 , N. Onoda-Yamamuro 3 , H. Ohki 3 , S. Ishimaru 3 , R. Ikeda, and Y. Furukawa b 3 Department of Chemistry, University of Tsukuba, Tsukuba 305, Japan b Faculty of School Education, Hiroshima University. Higashi-Hiroshima 739, Japan Z. Naturforsch. 51a, 761-768 (1996); received October 24, 1995 The temperature dependence of the 15 N and 133 Cs NMR spin-lattice relaxation times, the 15 N spin-spin relaxation time, and the 1S N and 133 Cs spectra of CsNOi was observed in the plastic phase (209.2 < T < 673 K (m. p.)) and the low-temperature phase (Phase II). In Phase II we found the N07 180°-flip, which could be attributed to the anomalous increase of the heat capacity curve, and determined the activation energy of this motion to be 8.7-11.7 kJ mol -1 . The l5 N and 133 Cs spectra in this phase are inconsistent with the reported crystal structure R3m and can be explained by lower crystal symmetry. In the plastic phase we detected a new anionic motion with 11 kJ mol -1 , an isotropic N07 reorientation with 8.5-9 kJ mol -1 , and ionic self-diffusion with 47 kJ mol . The presence of ionic self-diffusion was confirmed by measuring the electrical conductivity. Keywords: |S N and 133 Cs Solid NMR, Plastic crystal. Phase transition. Chemical shift anisotropy, Electric field gradient. 1. Introduction The nitrites MN0 2 (M = K, Rb, Cs, Tl) are ionic crystals showing plastic phases [1 - 8]. The dynamic properties of potassium [9], rubidium [10], and thal- lium [11] nitrite in the plastic phase, such as molecular diffusion and isotropic reorientation, are quite anal- ogous to those in molecular plastic phases [12]. The onset of isotropic reorientation of the NOJ ions in the plastic phase enables the highly symmetric NaCl or CsCl type cubic structure. At the transition from the low-temperature phase of these nitrites, the heat capacity exhibits an anomalous long tail on the low- temperature side extending over 100 K [2 - 4, 6 - 8], This anomaly implies that the disorder in structure takes place far below the transition point. Two solid phases in CSNO2 have been reported [1 -5]. The plastic phase (Phase I) obtainable be- tween 209.2 and 673 K (melting point) forms a CsCl-type cubic lattice with space group Pm3m and * Presented at the XHIth International Symposium on Nuclear Quadrupole Interactions, Providence, Rhode Island, USA, July 23-28, 1995. Reprint requests to Prof. R. Ikeda. Fax: 81-298-53-6503. ao = 438.9 pm [1], Raman [3, 4] and neutron powder diffraction [13] studies have revealed the presence of the two kinds of N07 reorientation motions in Phase 1. The transition entropy from Phase II to I amounts to 17.3 J K~' mol -1 and is almost the same as the melting entropy (17.79 J K" 1 mol" 11 ) [2 - 5], Phase II has a rhombohedral lattice with R3m and ao = 430.7 pm, a = 87.22° [1], The dielectric constant in this phase [3, 4] shows a marked dispersion attributable to some anionic motion with an activation energy of 13.8 kJ mol -1 . The freezing of this motion is expected to occur at the glass transition at « 40 K [3, 4], In the present study we have studied temperature dependences of the l5 N and 133 Cs NMR spectra and relaxation times to get information about the N07 motional modes in Phase II and the plastic phase. 2. Experimental CsNOi and Cs 15 N0 2 were prepared from NaN0 2 (Wako Pure Chemical Industries Ltd.) and Na 15 N0 2 (99 wt% l5 N, ICON Inc.), respectively, using a cation exchange resin (Diaion SK-1, Mitsubishi Kasei Corp.). A small amount of 15 NO^ ions involved in the Cs 15 N0 2 eluent was removed by an anion exchange resin (Dowex 1-X8, The Dow Chemical Company). 0932-0784 / 96 / 0500-773 $ 06.00 © - Verlag der Zeitschrift für Naturforschung, D-72072 Tübingen
Transcript of 15N and 133Cs Solid NMR Studies on Ionic Dynamics in...
This work has been digitalized and published in 2013 by Verlag Zeitschrift für Naturforschung in cooperation with the Max Planck Society for the Advancement of Science under a Creative Commons Attribution4.0 International License.
Dieses Werk wurde im Jahr 2013 vom Verlag Zeitschrift für Naturforschungin Zusammenarbeit mit der Max-Planck-Gesellschaft zur Förderung derWissenschaften e.V. digitalisiert und unter folgender Lizenz veröffentlicht:Creative Commons Namensnennung 4.0 Lizenz.
15N and 133Cs Solid NMR Studies on Ionic Dynamics in Plastic CsN0 2 *
H. Honda3 , M. Kenmotsu3 , N. Onoda-Yamamuro3 , H. Ohki3 , S. Ishimaru3 , R. Ikeda, and Y. Furukawab
3 Department of Chemistry, University of Tsukuba, Tsukuba 305, Japan b Faculty of School Education, Hiroshima University. Higashi-Hiroshima 739, Japan
Z. Naturforsch. 51a, 761-768 (1996); received October 24, 1995
The temperature dependence of the 15N and 133Cs N M R spin-lattice relaxation times, the 15N spin-spin relaxation time, and the 1SN and 133Cs spectra of C s N O i was observed in the plastic phase (209.2 < T < 673 K (m. p.)) and the low-temperature phase (Phase II). In Phase II we found the N 0 7 180°-flip, which could be attributed to the anomalous increase of the heat capacity curve, and determined the activation energy of this motion to be 8.7-11.7 kJ m o l - 1 . The l 5 N and 133Cs spectra in this phase are inconsistent with the reported crystal structure R3m and can be explained by lower crystal symmetry. In the plastic phase we detected a new anionic motion with 11 kJ m o l - 1 , an isotropic N 0 7 reorientation with 8.5-9 kJ m o l - 1 , and ionic self-diffusion with 47 kJ mol . The presence of ionic self-diffusion was confirmed by measuring the electrical conductivity.
Keywords: | S N and 133Cs Solid NMR, Plastic crystal. Phase transition. Chemical shift anisotropy, Electric field gradient.
1. Introduction
The nitrites M N 0 2 (M = K, Rb, Cs, Tl) are ionic crystals showing plastic phases [1 - 8]. The dynamic properties of potassium [9], rubidium [10], and thal-lium [11] nitrite in the plastic phase, such as molecular diffusion and isotropic reorientation, are quite anal-ogous to those in molecular plastic phases [12]. The onset of isotropic reorientation of the N O J ions in the plastic phase enables the highly symmetric NaCl or CsCl type cubic structure. At the transition from the low-temperature phase of these nitrites, the heat capacity exhibits an anomalous long tail on the low-temperature side extending over 100 K [2 - 4, 6 - 8], This anomaly implies that the disorder in structure takes place far below the transition point.
Two solid phases in CSNO2 have been reported [1 - 5 ] . The plastic phase (Phase I) obtainable be-tween 209.2 and 673 K (melting point) forms a CsCl-type cubic lattice with space group Pm3m and
* Presented at the XHIth International Symposium on Nuclear Quadrupole Interactions, Providence, Rhode Island, USA, July 23-28, 1995.
Reprint requests to Prof. R. Ikeda. Fax: 81-298-53-6503.
ao = 438.9 pm [1], Raman [3, 4] and neutron powder diffraction [13] studies have revealed the presence of the two kinds of N 0 7 reorientation motions in Phase 1. The transition entropy f rom Phase II to I amounts to 17.3 J K ~ ' m o l - 1 and is almost the same as the melting entropy (17.79 J K " 1 mol"11) [2 - 5], Phase II has a rhombohedral lattice with R3m and ao = 430.7 pm, a = 87.22° [1], The dielectric constant in this phase [3, 4] shows a marked dispersion attributable to some anionic motion with an activation energy of 13.8 kJ mol - 1 . The freezing of this motion is expected to occur at the glass transition at « 40 K [3, 4],
In the present study we have studied temperature dependences of the l 5 N and 133Cs NMR spectra and relaxation times to get information about the N 0 7 motional modes in Phase II and the plastic phase.
2. Experimental
CsNOi and C s 1 5 N 0 2 were prepared from N a N 0 2
(Wako Pure Chemical Industries Ltd.) and N a 1 5 N 0 2
(99 wt% l 5 N, ICON Inc.), respectively, using a cation exchange resin (Diaion SK-1, Mitsubishi Kasei Corp.). A small amount o f 1 5 N O ^ ions involved in the C s 1 5 N 0 2 eluent was removed by an anion exchange resin (Dowex 1-X8, The Dow Chemical Company).
0932-0784 / 96 / 0500-773 $ 06.00 © - Verlag der Zeitschrift für Naturforschung, D-72072 Tübingen
762 H. Honda, R. Ikeda et al. • Ionic Dynamics in Plastic C s N 0 2
500 300 7 7 K 100
10'Y"1 / K
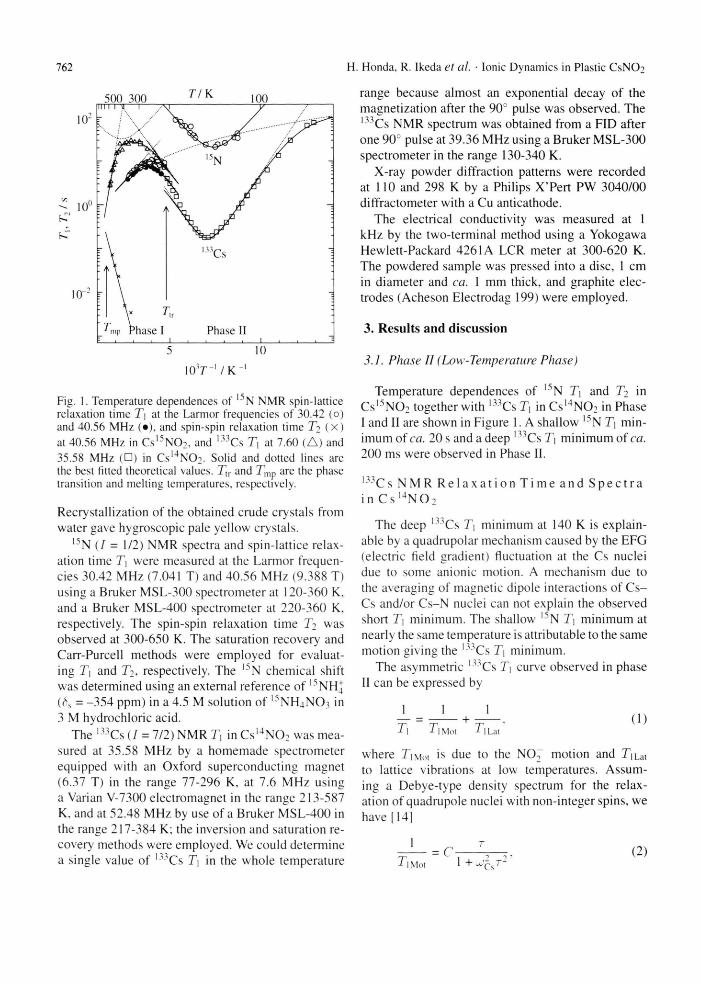
Fig. 1. Temperature dependences of 1 5 N N M R spin-lattice relaxation time T\ at the Larmor f requencies of 30.42 (o) and 40.56 M H z ( • ) , and spin-spin relaxation time T2 ( X )
at 40.56 M H z in C s 1 5 N 0 2 , and l 3 3 C s T\ at 7.60 ( A ) and 35.58 M H z ( • ) in C s l 4 N 0 2 . Solid and dotted lines are the best fitted theoretical values. Tlr and Tmp are the phase transition and melting temperatures, respectively.
Recrystallization of the obtained crude crystals f rom water gave hygroscopic pale yellow crystals.
15N (I = 1/2) NMR spectra and spin-lattice relax-ation time T\ were measured at the Larmor frequen-cies 30.42 MHz (7.041 T) and 40.56 MHz (9.388 T) using a Bruker MSL-300 spectrometer at 120-360 K. and a Bruker MSL-400 spectrometer at 220-360 K. respectively. The spin-spin relaxation time T2 was observed at 300-650 K. The saturation recovery and Carr-Purcell methods were employed for evaluat-ing T\ and T2, respectively. The 15N chemical shift was determined using an external reference of '""NH} ( 4 = - 3 5 4 ppm) in a 4.5 M solution of 1 5 N H 4 N 0 3 in 3 M hydrochloric acid.
The 133Cs ( / = 7/2) NMR T, in C s l 4 N 0 2 was mea-sured at 35.58 MHz by a homemade spectrometer equipped with an Oxford superconducting magnet (6.37 T) in the range 77-296 K, at 7.6 MHz using a Varian V-7300 electromagnet in the range 213-587 K. and at 52.48 MHz by use of a Bruker MSL-400 in the range 217-384 K; the inversion and saturation re-covery methods were employed. We could determine a single value of l 3 3 Cs T\ in the whole temperature
range because almost an exponential decay of the magnetization after the 90° pulse was observed. The 1 3 3Cs NMR spectrum was obtained from a FID after one 90° pulse at 39.36 MHz using a Bruker MSL-300 spectrometer in the range 130-340 K.
X-ray powder diffraction patterns were recorded at 110 and 298 K by a Philips X P e r t PW 3040/00 diffractometer with a Cu anticathode.
The electrical conductivity was measured at 1 kHz by the two-terminal method using a Yokogawa Hewlett-Packard 4261A LCR meter at 300-620 K. The powdered sample was pressed into a disc, 1 cm in diameter and cct. 1 mm thick, and graphite elec-trodes (Acheson Electrodag 199) were employed.
3. Results and discussion
3.1. Phase II (Low-Temperature Phase)
Temperature dependences of 15N T\ and T2 in CS 1 5 N0 2 together with 133Cs T\ in C s L 4 N 0 2 in Phase I and II are shown in Figure 1. A shallow 15N T\ min-imum of ca. 20 s and a deep 133Cs T\ minimum of ca. 200 ms were observed in Phase II.
1 3 3 Cs N M R R e l a x a t i o n T i m e a n d S p e c t r a i n C s ! 4 N 0 2
The deep l 3 3 Cs T\ minimum at 140 K is explain-able by a quadrupolar mechanism caused by the EFG (electric field gradient) fluctuation at the Cs nuclei due to some anionic motion. A mechanism due to the averaging of magnetic dipole interactions of C s -Cs and/or C s - N nuclei can not explain the observed short T\ minimum. The shallow l 3 N T\ minimum at nearly the same temperature is attributable to the same motion giving the l 3 3 Cs T\ minimum.
The asymmetric 1 - Cs T\ curve observed in phase II can be expressed by
T\ Ti Mot T\ Lat
where T\ yiol is due to the N 0 7 motion and Timt to lattice vibrations at low temperatures. Assum-ing a Debye-type density spectrum for the relax-ation of quadrupole nuclei with non-integer spins, we have 114]
Mot ' + w L ; C s r 2
763 H. Honda , R. Ikeda et al. • Ionic Dynamics in Plastic CsN0 2
Phase Motional Mode £ a / k J m o P 1 To / s Observation
II 180°-Flip 8 . 7 ± 2 2 . 2 x 1 0 - 1 2 l 5 N T i 1 1 . 7 ± 2 2 . 2 x l O " 1 3 1 3 3Cs T ,
I C2-Reorientat ion 1 1 ± 2 1 3 3Cs T\ 11* 15N Ti
Isotropic Reorientat ion 9 . 0 ± 2 15N Ti 9 . 0 ± 2 1 . 6 x l 0 " 9 1 3 3Cs T ,
Se l f -Dif fus ion 4 7 ± 2 1 3 3Cs T\ 3 3 ± 3 l 5 N T2
Table 1. Motional modes , activation energies (£"a) and the pre-exponential factors (T0) for N 0 7 ions derived f r o m spin-lattice and spin-spin relaxation t imes (T i , T2) of , 5 N in C s 1 5 N O : and 1 3 3Cs T, in C S I 4 N 0 2 . * The same value evaluated f rom l 3 3 Cs T i data was assumed.
while the contribution f rom lattice vibrations is given by [14]
1
T\ = AT2. (3)
l L a t
Here, C , r , and uJca are a constant depending on the motional mode, the correlation time of the mo-tion, and the 133Cs angular Larmor frequency, respec-tively. We assume an Arrhenius-type temperature de-pendence of r :
T = to exp A RT
(4)
We fitted the ( 1 ) - ( 4 ) to the observed 1 3 3 CsTi data and showed the obtained best-fitted T\ curve in Figure 1.
\ 310K
190K
50
Av2J
0
v / k H z
145K
-50
Small deviations from the experimental data seen in the high-temperature range of the T\ minimum can be attributed to the influence of the phase transition. The evaluated activation parameters are listed in Table 1.
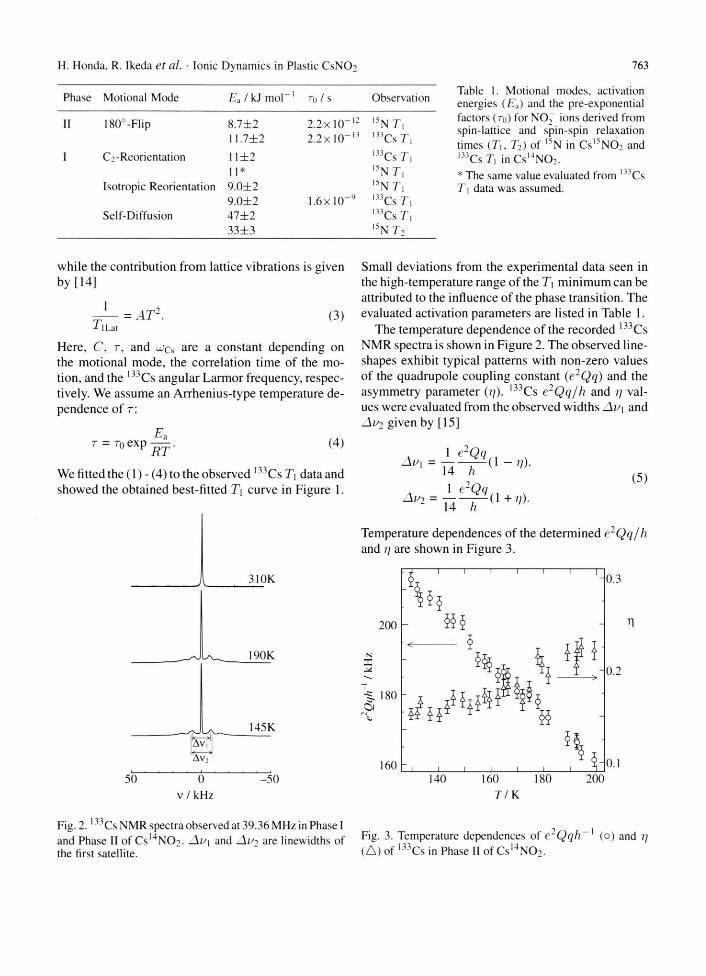
The temperature dependence of the recorded 1 3 3Cs NMR spectra is shown in Figure 2. The observed line-shapes exhibit typical patterns with non-zero values of the quadrupole coupling constant (e 2 Qq ) and the asymmetry parameter (//). l 3 3 Cs e2Qq/h and r/ val-ues were evaluated from the observed widths Ai>\ and Av2 given by [15]
1 e2Qq = ~[4~li ~ (5)
Temperature dependences of the determined e2Qq/h and q are shown in Figure 3.
160 180 7 7 K
Fig. 2 . 1 3 3 C s N M R spectra observed at 39.36 M H z in Phase I and Phase II of C s 1 4 N 0 2 . Av\ and Av2 are l inewidths of the first satellite.
Fig. 3. Temperature dependences of e2Qqh ( A ) of 1 3 3 C s in Phase II of C s 1 4 N 0 2 .
(o) and q
764 H. Honda, R. Ikeda et al. • Ionic Dynamics in Plastic C s N 0 2
'""N N M R R e l a x a t i o n T i m e a n d S p e c t r a in C s l 5 N 0 2
The relaxation mechanism for the 1 !>NT| minimum in C s l 5 N O i observed in Phase II is attributable to the fluctuation of the chemical shift(CS) anisotropy at the l 5 N nuclei. The observed T\ value can be expressed as [14]
1 3 4 , r —- ~ — A ü j 2
T - r . (6 ) T\ 10 l + ^ J r 2
where r , u;N, and denote the correlation time of the expected anionic motion, the l 5 N Larmor angu-lar frequency, and the line-width narrowed by the CS averaging, respectively. Equations (4) and (6) were fitted to the observed l 5 N T\ values, and the obtained best-fitted T\ curve is shown in Figure 1. The evalu-ated activation parameters are given in Table 1.
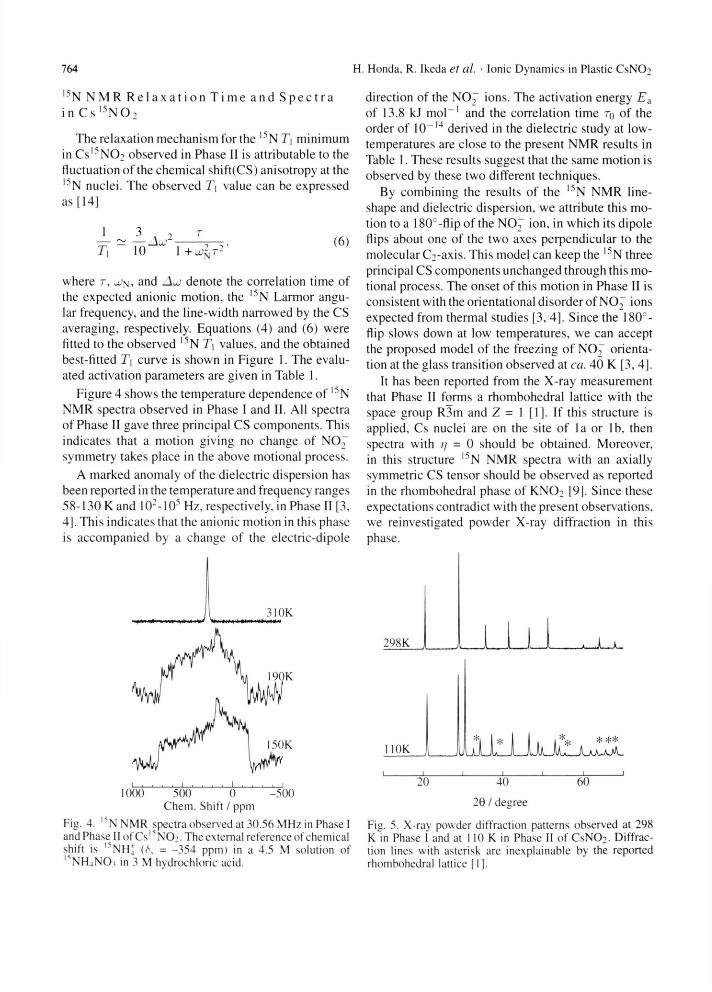
Figure 4 shows the temperature dependence of l 5 N NMR spectra observed in Phase I and II. All spectra of Phase II gave three principal CS components. This indicates that a motion giving no change of N 0 7 symmetry takes place in the above motional process.
A marked anomaly of the dielectric dispersion has been reported in the temperature and frequency ranges 58-130 K and 102-105 Hz, respectively, in Phase II [3, 4], This indicates that the anionic motion in this phase is accompanied by a change of the electric-dipole
direction of the N 0 7 ions. The activation energy E a
of 13.8 kJ m o l - 1 and the correlation time r() of the order of 10"1 4 derived in the dielectric study at low-temperatures are close to the present NMR results in Table 1. These results suggest that the same motion is observed by these two different techniques.
By combining the results of the l 5 N NMR line-shape and dielectric dispersion, we attribute this mo-tion to a 180°-flip of the N O ^ ion, in which its dipole flips about one of the two axes perpendicular to the molecular C2-axis. This model can keep the 15N three principal CS components unchanged through this mo-tional process. The onset of this motion in Phase II is consistent with the orientational disorder of N 0 7 ions expected from thermal studies [3, 4], Since the 180°-flip slows down at low temperatures, we can accept the proposed model of the freezing of NO-T orienta-tion at the glass transition observed at ca. 40 K [3, 4],
It has been reported from the X-ray measurement that Phase II forms a rhombohedral lattice with the space group R3m and Z = 1 [1], If this structure is applied. Cs nuclei are on the site of la or lb . then spectra with // = 0 should be obtained. Moreover, in this structure 15N NMR spectra with an axially symmetric CS tensor should be observed as reported in the rhombohedral phase of K N 0 2 [9], Since these expectations contradict with the present observations, we reinvestigated powder X-ray diffraction in this phase.
31 OK
190K
50K
1000 500 0 Chem. Shift / ppm
- 5 0 0
Fig. 4. 15N N M R spectra observed at 30.56 MHz in Phase I and Phase II of Cs '^NCK The external reference of chemical shift is ' " N H j = - 3 5 4 ppm) in a 4.5 M solution of " N H j N C h in 3 M hydrochloric acid.
298K U L ! I j u
10K LAJJ IJ LiA
20 40
20 / degree
60
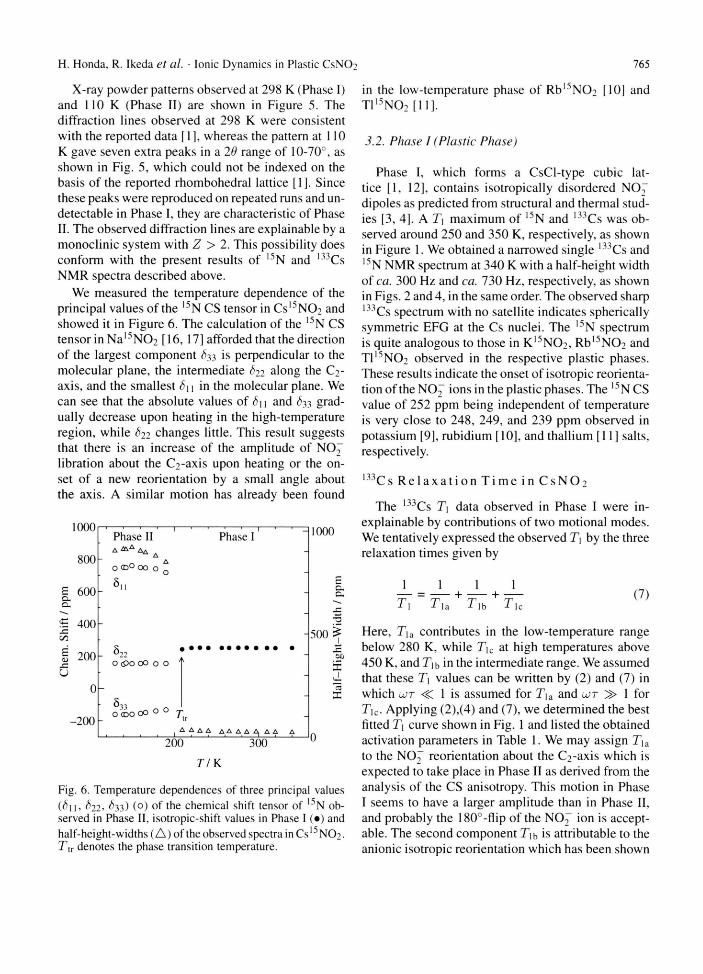
Fig. 5. X-ray powder diffraction patterns observed at 298 K i n Phase I and at 110 K in Phase II of C s N 0 2 . Diffrac-tion lines with asterisk are inexplainable by the reported rhombohedral lattice [1],
765 H. Honda, R. Ikeda et al. • Ionic Dynamics in Plastic CsN02
X-ray powder patterns observed at 298 K (Phase I) and 110 K (Phase II) are shown in Figure 5. The diffract ion lines observed at 298 K were consistent with the reported data [ 1 ], whereas the pattern at 110 K gave seven extra peaks in a 20 range of 10-70°, as shown in Fig. 5, which could not be indexed on the basis of the reported rhombohedral lattice [1], Since these peaks were reproduced on repeated runs and un-detectable in Phase I, they are characteristic of Phase II. The observed diffract ion lines are explainable by a monocl inic system with Z > 2. This possibility does conform with the present results of 1 5N and 133Cs N M R spectra described above.
We measured the temperature dependence of the principal values of the 1 5N CS tensor in Cs '^NCh and showed it in Figure 6. The calculation of the l 5 N CS tensor in Na 1 : , N02 [16, 17] afforded that the direction of the largest componen t 633 is perpendicular to the molecular plane, the intermediate ^22 along the Cj-axis, and the smallest <5| 1 in the molecular plane. We can see that the absolute values of <*>n and 633 grad-ually decrease upon heating in the high-temperature region, while S22 changes little. This result suggests that there is an increase of the ampli tude of N O 7 libration about the C2-axis upon heating or the on-set of a new reorientation by a small angle about the axis. A similar motion has already been found
1000r
8 0 0 -
600-
400-
200-
0-
- 2 0 0 •
Phase II A A A A
O CD° OO O
5,,
Phase I
o <po 00 O o
o c o o o o o J
200 A A A A A A A A A , A A
1000
500 £
300
77 K
Fig. 6. Temperature dependences of three principal values (611, Ö22, <$33) ( ° ) of the chemical shift tensor of l 5 N ob-served in Phase II, isotropic-shift values in Phase I ( • ) and half-height-widths ( A ) of the observed spectra in Cs 1 5 NO2. T n denotes the phase transition temperature.
in the low-temperature phase of Rb15NC>2 [10] and T 1 I 5 N 0 2 [11].
3.2. Phase I (Plastic Phase)
Phase I, which forms a CsCl- type cubic lat-tice [1, 12], contains isotropically disordered N 0 7 dipoles as predicted f rom structural and thermal stud-ies [3, 4], A T\ max imum of 1 5N and 1 3 3Cs was ob-served around 250 and 350 K, respectively, as shown in Figure 1. We obtained a narrowed single 1 3 3Cs and 1 5N N M R spectrum at 340 K with a half-height width of ca. 300 Hz and ca. 730 Hz, respectively, as shown in Figs. 2 and 4, in the same order. The observed sharp 1 3 3Cs spectrum with no satellite indicates spherically symmetric EFG at the Cs nuclei. The i 5 N spectrum is quite analogous to those in K l : i N 0 2 , Rb 1 : , N02 and T11 : ,N02 observed in the respective plastic phases. These results indicate the onset of isotropic reorienta-tion of the N 0 7 ions in the plastic phases. The 1 5N CS value of 252 ppm being independent of temperature is very close to 248, 249, and 239 ppm observed in potassium [9], rubidium [10], and thall ium [11] salts, respectively.
1 3 3 C s R e l a x a t i o n T i m e i n C s N 0 2
The 1 3 3Cs T\ data observed in Phase I were in-explainable by contributions of two motional modes. We tentatively expressed the observed T\ by the three relaxation t imes given by
T , T 1 1 1
T ib T i c (7)
Here, T\ a contributes in the low-temperature range below 280 K, while T\c at high temperatures above 450 K, and T ^ in the intermediate range. We assumed that these T\ values can be written by (2) and (7) in which ÜJT 1 is assumed for T\a and UOR 1 for T\c. Applying (2),(4) and (7), we determined the best fitted T\ curve shown in Fig. 1 and listed the obtained activation parameters in Table 1. We may assign T\a
to the N 0 7 reorientation about the C2-axis which is expected to take place in Phase II as derived f rom the analysis of the CS anisotropy. This motion in Phase I seems to have a larger ampli tude than in Phase II, and probably the 180°-flip of the N 0 7 ion is accept-able. The second component T\ b is attributable to the anionic isotropic reorientation which has been shown
766 H. Honda, R. Ikeda et al. • Ionic Dynamics in Plastic C s N 0 2
from the l 5 N spectrum analysis. The determined acti-vation energy of 9 ± 2 kJ mo l" 1 for this motion agrees well with 9.0 kJ m o l - 1 evaluated from 15N T\ in C s 1 5 N 0 2 , as discussed below. The third component T\c can be assigned to the ionic self-diffusion. This assignment is supported by the analysis of l 3 N Ti and the temperature dependence of electrical conductivity given below.
, 5 N R e l a x a t i o n T i m e in C S 1 5 N 0 2
Temperature dependences of | S N T\ and T2 ob-served in Phase I are shown in Figure 1. The observed l r,N T2 values increased with temperature and became longer than 10 ms above 400 K. These T2 values can be explained by the onset of ionic self-diffusion from the following calculation: We estimated the T2 value from the magnetic dipolar linewidth AH of I SN in a powder sample of Phase I, where isotropically rotat-ing anions are assumed, using the relation [ 14]
k - («)
(AH)2
~ 4 ' 1 J 1 ( 9 )
' ik
where ~/n, 7cs» ar>d Ics denote the gyromagnetic ratios and spin quantum numbers of l 5 N and l 3 3 Cs nuclei, respectively. r t J and r^. are l 5 N - 1 5 N and 1 5 N- 1 3 3 Cs
inter-nuclear distances, respectively. The first and second terms in (9) are contributions from 1 5N-1 5N and 1 5 N- l 3 3 Cs magnetic dipolar interactions, respectively. Assuming the isotropically reorienting N 0 7 ions without self-diffusion, we evaluated a T2
value of 5.5 ms from (8) and (9). The model of the N O J isotropic reorientation and Cs+ self-diffusion gives a calculated T2 value of 33 ms. Since the T2 > 10 ms observed above 400 K is much longer 5.5 ms for the model of isotropically rotating N O ^ ions, this T2 increase with temperature is attributed to the aver-aging of the interionic magnetic dipolar interactions due to the cationic self-diffusion. From the slope of the T2 temperature dependence, we obtained an ac-tivation energy of 3 3 ± 3 kJ m o l - 1 for the cationic self-diffusion.
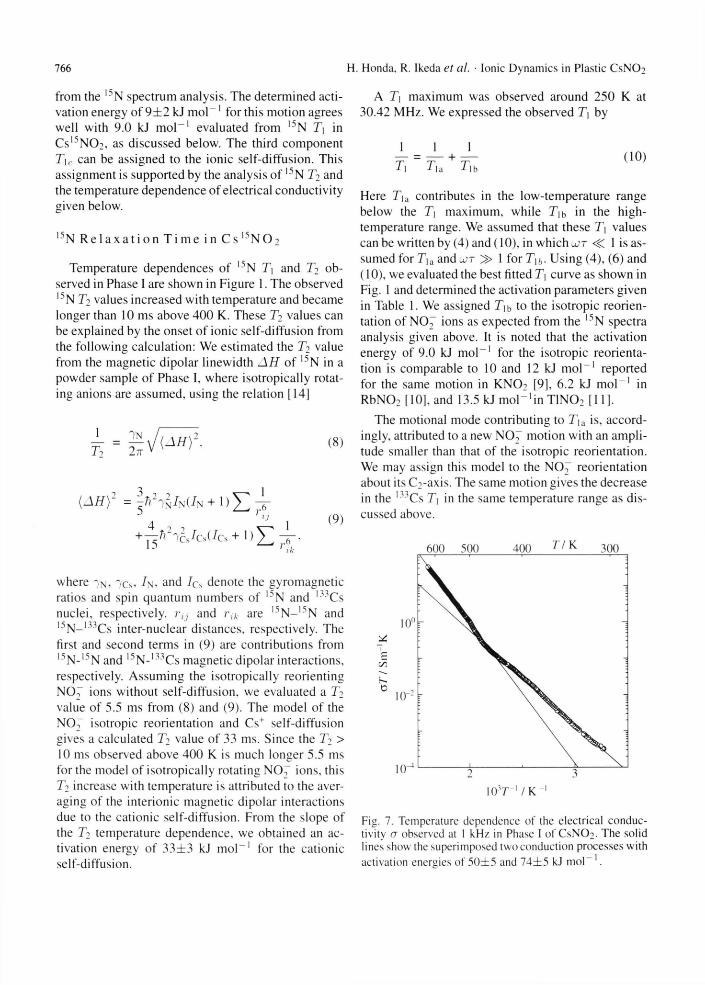
A T\ maximum was observed around 250 K at 30.42 MHz. We expressed the observed T\ by
Here T(a contributes in the low-temperature range below the T\ maximum, while T\b in the high-temperature range. We assumed that these T\ values can be written by (4) and (10), in which JOT 1 is as-sumed for T]a and u j r 1 for Using (4), (6) and (10), we evaluated the best fitted T\ curve as shown in Fig. 1 and determined the activation parameters given in Table 1. We assigned T\\, to the isotropic reorien-tation of NO J ions as expected from the l 5 N spectra analysis given above. It is noted that the activation energy of 9.0 kJ m o l - 1 for the isotropic reorienta-tion is comparable to 10 and 12 kJ m o l - 1 reported for the same motion in K N 0 2 [9], 6.2 kJ m o l - 1 in R b N 0 2 110], and 13.5 kJ m o l 1 ' i n T1N0 2 [11].
The motional mode contributing to T\d is, accord-ingly, attributed to a new N 0 7 motion with an ampli-tude smaller than that of the isotropic reorientation. We may assign this model to the N 0 7 reorientation about its C2-axis. The same motion gives the decrease in the 133Cs T\ in the same temperature range as dis-cussed above.
10°
c7}
10 4
Fig. 7. Temperature dependence of the electrical conduc-tivity a observed at 1 kHz in Phase I of C s N 0 2 . The solid lines show the super imposed two conduct ion processes with activation energies of 5 0 ± 5 and 7 4 ± 5 kJ m o P 1 .
600 500 400 7 7 K 300
767 H. Honda, R. Ikeda et al. • Ionic Dynamics in Plastic CsN02
E l e c t r i c a l C o n d u c t i v i t y (a)
We measured the electrical conductivity (er) to con-firm the presence of ionic self-diffusion. The temper-ature dependence of aT is shown in Figure 7. Upon heating, a rapid increase of a to the order of 10~2 S m _ 1 was observed around 600 K. This clearly implies the presence of ionic conduct ion in conformity with the present N M R analysis.
Since the value of aT is proportional to the diffu-sion constant, if we apply the Nernst-Einstein relation, the diffusional activation energy can be derived f rom the slope of log aT plotted against T ~1. We analyzed the data shown in Fig. 7, by assuming the presence of two conduct ing processes, which gave activation energies of 5 0 ± 5 and 7 4 ± 5 kJ m o l - 1 . The lower value agrees well with 47 kJ m o l - 1 obtained f rom the present N M R data analysis. The other value seems to stem f rom the barrier for anionic self-diffusion.
4. Conclus ion
The anomalous increase of the heat capacity ob-served over a wide temperature range below the phase transition at 209.2 K in C s N 0 2 was shown to be ex-plained by the excitation of 180°-flip of N 0 7 ions in Phase II. This motion was determined f rom the tem-perature dependences of the 15 N N M R spectra, which retained the three kinds of different CS components in the whole temperature range of Phase II. The pres-ence of this motion is supported by the reported data of the dielectric dispersion and relaxation [3, 4], The l 5 N and 1 3 3Cs l ineshapes indicating the absence of the C3 site symmetry at the respective ions conflict with the reported structure R 3 m [ 1 ]. The X-ray diffraction
patterns observed in this phase al lowed us to attribute the structure of this phase to a monocl inic system, although the space group is unknown. This structure is consistent with the l:>N and 1 3 3Cs N M R spectra observed in the present study.
In the plastic phase (Phase I) having a CsCl-type cubic lattice, the anionic isotropic reorientation and a new motion attributable to the N O 7 reorientation about its C 2 -axis , were derived f rom l 5 N and 1 3 3Cs N M R T\. The activation energy of 9.0 kJ m o l - 1 deter-mined for the isotropic reorientation are close to 13.5 kJ m o l - 1 obtained in T1N0 2 [11] having a CsCl-type cubic structure, and 10 and 12 kJ m o l - 1 in K N 0 2 [9], and 6.2 and 8.5 kJ m o l - 1 in R b N 0 2 [10], both form-ing the NaCl- type cubic lattice. On the other hand, the obtained activation energy of 47 kJ m o l - 1 for cationic self-diffusion derived f rom T\ became the same as that in T 1 N 0 2 [18, 19], whereas it is much smaller than 110 kJ m o l " 1 in R b N 0 2 [10], This dif-ference in the diffusional barriers can be attributed to the difference in the diffusional process in which ions can directly j u m p to the nearest vacant site in the CsCl- type lattice, whereas two successive j u m p s over a high barrier are needed in the NaCl- type lattice [ 2 0 - 2 2 ] ,
Acknowledgement
We are grateful to Dr. Y. Onoda and Dr. M. Tansho in National Institute for Research in Inorganic Mate-rials for the use of the MSL-400 spectrometer. This work was partly supported by a Grant-in-aid for Sci-entific Research No. 06453055 f rom the Ministry of Education, Science and Culture, Japan.
[1] P. W. Richter and C. W. F. T. Pistorius, J. Solid State Chem. 5, 276 (1972).
[2] S. C. Mraw, R. J. Boak, and L. A. K. Staveley, J. Chem. Thermodyn. 8, 1001 (1976).
[3] K. Moriya, T. Matsuo, and H. Suga, Chem. Phys. Lett. 8 2 , 5 8 1 (1981).
[4] K. Moriya, T. Matsuo, and H. Suga, J. Phys. Chem. Solids, 44, 1103 (1983).
[5] K. Moriya, T. Matsuo, and H. Suga, Thermochim. Acta, 132, 133 (1988).
[6] S. C. Mraw, R. J. Boak, and L. A. K. Staveley, J. Chem. Thermodyn. 10, 359 (1978).
[7] K. Moriya, T. Matsuo, and H. Suga, Bull. Chem. Soc. Japan 61, 1911 (1988).
[8] K. Moriya, T. Matsuo, H. Suga, and S. Seki, Chem. Lett. 1427 (1977).
[9] M. Kenmotsu, H. Honda, H. Ohki, R. Ikeda, T. Erata, A. Tasaki, and Y. Furukawa, Z. Naturforsch.49a, 247 (1994).
[10] H. Honda, M. Kenmotsu, H. Ohki, R. Ikeda, and Y. Furukawa, Ber. Bunsenges. Phys. Chem.99, 1009 (1995).
[11] H. Honda, S. Ishimaru, N. O-Yamamuro, and R. Ikeda, Z. Naturforsch. 50a, 871 (1995).
768 H. Honda, R. Ikeda et al. • Ionic Dynamics in Plastic CsN0 2
[12] J. N. Sherwood. The Plastically Crystalline State. John Wiley & Sons, Chichester 1979.
[13] D. Hohlwein, A. Hoser, and W. Prandl. Z. Kristallogr. 177, 93 (1986).
[14] A. Abragam, The Principles of Nuclear Magnetism. Oxford University Press, London 1961.
[15] M. H. Cohen and R. Reif, Solid State Phys. 5, 321 (1957).
[16] R. E. Wasylishen, R. D. Curitis, K. Eichele, M. D. Lumsden, G. H. Penner, W. P. Power, and G. Wu. NATO ASI Ser. Ser. C. 386, 297 (1993).
[17] J. Mason, NATO ASI Ser. Ser. C 386, 449 (1993). [18] Y. Furukawa and H. Kiriyama, Chem. Phys. Lett. 93,
617 (1982). [19] Y. Furukawa. H. Nagase. R. Ikeda, and D. Nakamura ,
Bull. Chem. Soc. Japan. 64, 3105 (1991). [20] M. Tansho, Y. Furukawa, D. Nakamura , and R. Ikeda,
Ber. Bunsenges. Phys. Chem. 96, 550 (1992). [21] N. E. Byer and H. S. Sack, Phys. Rev. Lett. 17, 72
(1966). [22] R. J. Quigley and T. P. Das, Solid State Commun . 5,
487 (1967).