ASSESSMENT OF AIR POLLUTION TREND IN MEDAN CITY
8
ASSESSMENT OF AIR POLLUTION TREND IN MEDAN CITY Arief Wibowo Suryo, Hendri Irwandi ......................................... 149 ASSESSMENT OF AIR POLLUTION TREND IN MEDAN CITY ANALISA TREN SPM DI KOTA MEDAN 1 2 Arief Wibowo Suryo *, Hendri Irwandi 1 BBMKG Wilayah I Medan, Jl. Ngumban Surbakti no. 15, Medan.20131 2 Stasiun Klimatologi Sampali, Jl. Meteorologi Raya 17, Medan. 20371 *E-mail : [email protected] Naskah masuk: 02 Juni 2016; Naskah diperbaiki: 11 Oktober 2016; Naskah diterima: 22 Desember 2016 ABSTRACT Medan, as the capital city of the North Sumatra province as well as one of largest metropolitan areas in Indonesia, has suffered from increasing air pollution in the city. The tremendous population growth has created a wide range of urban problems such as the increase of industrial areas and the number of transportation means that lead to the diminished air quality in the area. This study divided Medan into two distinctive areas, namely urban area and suburban area. Air pollution data used for this analysis was taken from Suspended Particulate Matter (SPM) collected by BMKG observation stations in Medan from year 1983 to 2014. Methodology used in this paper is Trend regresssion analysis. This method is used to estimate the significance of a certain time series, that tend to decrease or incease. According to the trend Analysis of SPM, the area showed an increasing trend of 6.3% in urban area, and of 66% in suburban area. Generally, the increase of SPM that passed the threshold happened in the dry season, which occurs from January until June. The result has displayed there are decreasing of air quality in Medan city, in hope for the policy makers to react accordingly and to plan ways to prevent negative effects of air pollution. Keywords: Medan, SPM, Urban, Suburban, Increasing ABSTRAK Kota Medan merupakan kota terbesar ketiga di Indonesia dimana dengan tingginya laju peningkatan populasi penduduk, pengembangan daerah industri serta kebutukan sarana transportasi dan kendaraan yang menimbulkan meningkatnya tingkat polutan. Kota Medan dibagi atas dua kriteria wilayah antara lain: wilayah urban dan suburban. Data polusi udara yang digunakan antara lain data SPM periode tahun 1983-2014. Metodologi yang digunakan dalam tulisan ini adalah Regresi Tren. Metode ini digunakan untuk mengukur seberapa signifikansinya dari kecenderungan suatu data time series. Berdasarkan analisis tren SPM di Kota Medan menunjukkan tren meningkat dengan peningkatan 6.3% diwilayah urban dan 66% diwilayah suburban. Umumnya peningkatan SPM diatas ambang batas terjadi pada periode Musim Kemarau yang terjadi pada periode Januari-Juni. Hasil analisis menunjukkan telah terjadi penurunan kualitas udara diwilayah Kota Medan perlu peran serta pemerintah dalam upaya mengantisipasi dampak meningkatnya tingkat polutan di Kota Medan. Kata kunci: Kota Medan, SPM, Meningkat. 1. Background Air pollution is a major environmental health problem in Indonesia. Although the effects of air pollution on health are very complex because there are many different sources, many have studied that the aerosol inside ambient air quality in our atmosphere contributes greatly. Urban areas in particular, are affected by air pollution, which mainly comes from industry and transportation activities. A number of previous studies have concluded that previous activities mentioned are the biggest contributor and factor to the outdoor air pollution. Although several natural sources also contribute to some degree, such as volcano activities and forest fire, but still the anthropogenic sources that are counted as the biggest percentage to air pollution. The main concern especially for outdoor air pollution is its negative effects to human health [1,2,3,4](Barman et al., 2010; Shah et al., 2013; Sofianopoulou, Rushton, Diggle, & Pless-Mulloli, 2013; Stafoggia et al., 2013). Air pollutants that are inhaled could affect lungs and human respiratory systems, also taken up by the blood and pumped all-round the body (Meng,
Transcript of ASSESSMENT OF AIR POLLUTION TREND IN MEDAN CITY

ASSESSMENT OF AIR POLLUTION TREND IN MEDAN CITY Arief Wibowo Suryo, Hendri Irwandi.........................................
149
ASSESSMENT OF AIR POLLUTION TREND IN MEDAN CITY
ANALISA TREN SPM DI KOTA MEDAN
1 2Arief Wibowo Suryo *, Hendri Irwandi1 BBMKG Wilayah I Medan, Jl. Ngumban Surbakti no. 15, Medan.20131
2 Stasiun Klimatologi Sampali, Jl. Meteorologi Raya 17, Medan. 20371*E-mail : [email protected]
Naskah masuk: 02 Juni 2016; Naskah diperbaiki: 11 Oktober 2016; Naskah diterima: 22 Desember 2016
ABSTRACT
Medan, as the capital city of the North Sumatra province as well as one of largest metropolitan areas in Indonesia, has suffered from increasing air pollution in the city. The tremendous population growth has created a wide range of urban problems such as the increase of industrial areas and the number of transportation means that lead to the diminished air quality in the area. This study divided Medan into two distinctive areas, namely urban area and suburban area. Air pollution data used for this analysis was taken from Suspended Particulate Matter (SPM) collected by BMKG observation stations in Medan from year 1983 to 2014. Methodology used in this paper is Trend regresssion analysis. This method is used to estimate the significance of a certain time series, that tend to decrease or incease. According to the trend Analysis of SPM, the area showed an increasing trend of 6.3% in urban area, and of 66% in suburban area. Generally, the increase of SPM that passed the threshold happened in the dry season, which occurs from January until June. The result has displayed there are decreasing of air quality in Medan city, in hope for the policy makers to react accordingly and to plan ways to prevent negative effects of air pollution.
Keywords: Medan, SPM, Urban, Suburban, Increasing
ABSTRAK
Kota Medan merupakan kota terbesar ketiga di Indonesia dimana dengan tingginya laju peningkatan populasi penduduk, pengembangan daerah industri serta kebutukan sarana transportasi dan kendaraan yang menimbulkan meningkatnya tingkat polutan. Kota Medan dibagi atas dua kriteria wilayah antara lain: wilayah urban dan suburban. Data polusi udara yang digunakan antara lain data SPM periode tahun 1983-2014. Metodologi yang digunakan dalam tulisan ini adalah Regresi Tren. Metode ini digunakan untuk mengukur seberapa signifikansinya dari kecenderungan suatu data time series. Berdasarkan analisis tren SPM di Kota Medan menunjukkan tren meningkat dengan peningkatan 6.3% diwilayah urban dan 66% diwilayah suburban. Umumnya peningkatan SPM diatas ambang batas terjadi pada periode Musim Kemarau yang terjadi pada periode Januari-Juni. Hasil analisis menunjukkan telah terjadi penurunan kualitas udara diwilayah Kota Medan perlu peran serta pemerintah dalam upaya mengantisipasi dampak meningkatnya tingkat polutan di Kota Medan.
Kata kunci: Kota Medan, SPM, Meningkat.
1. Background
Air pollution is a major environmental health problem in Indonesia. Although the effects of air pollution on health are very complex because there are many different sources, many have studied that the aerosol inside ambient air quality in our atmosphere contributes greatly. Urban areas in particular, are affected by air pollution, which mainly comes from industry and transportation activities. A number of previous studies have concluded that previous activities mentioned are the biggest
contributor and factor to the outdoor air pollution. Although several natural sources also contribute to some degree, such as volcano activities and forest fire, but still the anthropogenic sources that are counted as the biggest percentage to air pollution. The main concern especially for outdoor air pollution is its negative effects to human health [1,2,3,4](Barman et al., 2010; Shah et al., 2013; Sofianopoulou, Rushton, Diggle, & Pless-Mulloli, 2013; Stafoggia et al., 2013). Air pollutants that are inhaled could affect lungs and human respiratory systems, also taken up by the blood and pumped all-round the body (Meng,
JURNAL METEOROLOGI DAN GEOFISIKA VOL. 17 NO. 3 TAHUN 2016 : 149-156
150
Wang, Cao, Wong, & Kan, 2013; Murakami & Ono, 2006; Qiu et al., 2013). Therefore, air pollution should be given due attention by the concerned authority.
In 2012, a report from WHO confirmed that around 7 million people worldwide have become casualties due to their interaction with outdoor and indoor air pollution. This report suggested that the number of deaths are doubled from previous year report. It also have been reported in previous studies that the risk of outdoor pollution has increased the admitted patients suffered from heart disease and stroke. Regionally, low income countries, especially in South East Asia and West Pacific have 2.6 million death connected
with otudoor air pollution.(). Indonesia has suffered from increasing air pollution matter. The swift population growth has created increase demand of more transportation and industrial needs. The growth of industrial areas and vehicular transportation as reported by Indonesian Agency of Statistics from year to year shows a 1.58% increase of middle and
high industrial area () and a 14.74% increase from
vehicular transportation from the last 10 years ().
Medan, as one of metropolitan cities in Indonesia, also suffered from the problems caused by air pollution. The population growth has been increased year to year. This also created problem in transportation and industry as Central Bureau of Statistics pointed out in Medan, North Sumatera province, the increase has reached to 0.98 % for
middle and high industrial area () and 12.99% for
annual vehicular transportation (). This leads to
current problems of higher sources of pollutant in the air that have surpassed the threshold concentrations allowed by regulation.
Medan is located in North Sumatra province in Sumatera Island. Geographically, Medan lies
0 0 0between 2 27'00'' – 2 47'00” latitude and 98 35'00” – 098 44'00” longitude with elevation high range from
2.5 to 37.5m above sea level surface. The area 2consists of 265,10 km area and has 21 subdistricts,
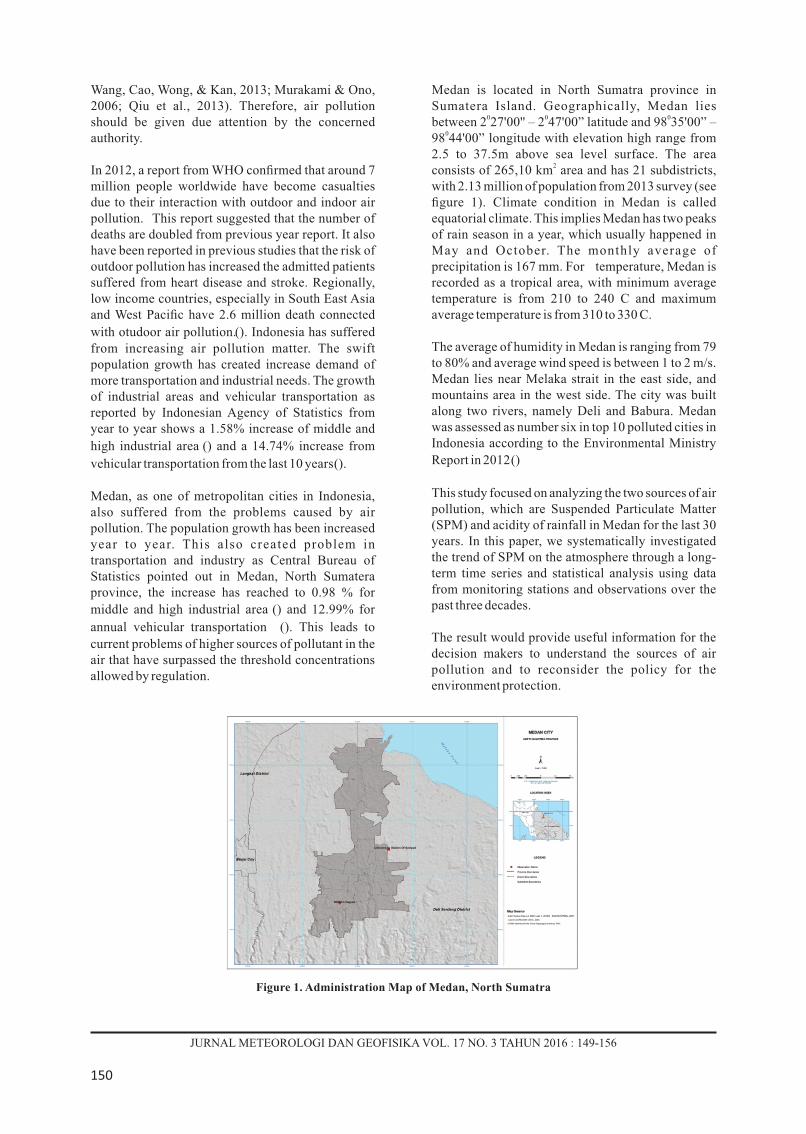
with 2.13 million of population from 2013 survey (see figure 1). Climate condition in Medan is called equatorial climate. This implies Medan has two peaks of rain season in a year, which usually happened in May and October. The monthly average of precipitation is 167 mm. For temperature, Medan is recorded as a tropical area, with minimum average temperature is from 210 to 240 C and maximum average temperature is from 310 to 330 C.
The average of humidity in Medan is ranging from 79 to 80% and average wind speed is between 1 to 2 m/s. Medan lies near Melaka strait in the east side, and mountains area in the west side. The city was built along two rivers, namely Deli and Babura. Medan was assessed as number six in top 10 polluted cities in Indonesia according to the Environmental Ministry
Report in 2012 ()
This study focused on analyzing the two sources of air pollution, which are Suspended Particulate Matter (SPM) and acidity of rainfall in Medan for the last 30 years. In this paper, we systematically investigated the trend of SPM on the atmosphere through a long-term time series and statistical analysis using data from monitoring stations and observations over the past three decades.
The result would provide useful information for the decision makers to understand the sources of air pollution and to reconsider the policy for the environment protection.
Figure 1. Administration Map of Medan, North Sumatra

ASSESSMENT OF AIR POLLUTION TREND IN MEDAN CITY Arief Wibowo Suryo, Hendri Irwandi.........................................
151
Air pollution in general. One of big sources of atmospheric air pollution is coming from aerosol emissions. Aerosol is a suspension of tiny airborne solid or liquid particles, sometimes visible, with a typical size between a few nanometers up to 100 micrometers that resided or suspended in the atmospheric for at least several hours until
considerable periods of time (). Atmospheric aerosol
comes from either natural or anthropogenic sources. Several main sources of atmospheric aerosol are anthropogenic NMVOCs (Non-Methane Volatile Organic Compounds), black carbon, POA (Primary Organic Aerosol), SO , NH and biomass burning 2 3
aerosols (). From global and regional anthropogenic
emissions report of aerosol, all Asian countries, including China and India, have contributed to the
-1yearly anthropogenic emissions as high as 94.8 Tgyr in average. This is counted almost 35% of global
aerosol emissions worldwide. ()
Aerosol has been classified by their size of condensation of gases created by the action of the
wind on the boundary layer of the earth's surface ().
Ultrafine aerosols (<0,01 µm), fine accumulation aerosols (0,01 – 1 µm), and coarse aerosol (>1 µm) are physical categories of the size distribution of particulates. Suspended Particle Matter (SPM) falls into the later category because its size is ranging from below 0,01 µm to 100 µm. SPM is considered all airborne sold and low vapor pressure liquid particles in the ambient atmosphere.
2. Methodology
Measuring SPM. We collected SPM samples using a high volume air sampler instrument (HVA ; Model TFIA 110-125v, Staplex). This instrument is specialized in sampling for all types of airborne particulates including enviromental pollutants (see figure 2) . The basic principle of operation is by drawn through a large volumes of air into a filter by a high-speed rotary motor. Then particulate matters in the air were collected by using specific type and size of filter paper, in this instance we use a glass fiber filter media. The size separated SPM samples were collected using above standard HVA. First the filter paper was weighed before putting it inside the motor. Then proper filter was inserted into appropriate filter holder of air sampler. Initial flow rate and sampling time were recorded. As we used TE-G653, 8" x 10" Glass Fiber Filters, then we applied the flow rate approximately between 15 to 20 cfm (cubic feet per minute). The sampling was conducted for the next 24 hours, usually from 08.00 a.m. to 08.00 a.m. the next day. After the sampling, loaded filters were stored for 24h in laboratory in an apparatus that has stabile specific temperature and relative humidity. Inside the
laboratory, the samples were then weighed for the amount of SPM collected.
Data Acquired (sampling location). The SPM data were collected from two monitoring stations in Medan city. First monitoring station is located in BBMKG region 1 that is geographically located in 3.540 N and longitude 98.640 E, with the elevation of 98.4 m. This monitoring station area was categorized as suburban area because it is a metropolitan area but outside central city of Medan. The population density
2in this area is 2210 people for every km according to 2013 population survey, as shown in figure 3.
Figure 2. HV Sampler
Figure 3. Distribution of population map in Medan City
JURNAL METEOROLOGI DAN GEOFISIKA VOL. 17 NO. 3 TAHUN 2016 : 149-156
152
The instrument is located 100 meters from highroad, where nearby is mostly some housing and paddy field. Meanwhile the other instrument located in Sampali climate station (3.6217 N, 98.7146 E, 25 m a.s.l.). Sampali climate station is considered as an urban area of Medan because the population density is very high at 14661 people for every km2 according to 2013 survey conducted by statistic agency of Medan City. This station is located only 25 meters from middle road connected with high road. The traffic usually heavy during the day, while nearby area populated with small industries and mixture fields of corn, bean and vegetables. In both locations, the measurement of SPM conducted once every six days for every 24h. This has been regulated by the main office of BMKG in Jakarta. The recorded data from Sampali station has been the longest from both monitoring stations. There have been monitoring in Sampali from 1983, while in BBMKG region I is only from 2011.
Trend Analysis. For this study we used trend analysis to learn about the progression of SPM over the years. Trend analysis is a method of looking at a certain time series data that provided in sequence over time, then analysis using assessment of the same variable over a significantly long period. The objective of this method is to detect some general pattern of a relationship between variables, and predict the future direction of this pattern. If the trend gives a straight line to the chart, it is called as a linier linear. Meanwhile if the trend gives a curved line, it is as
called nonlinear trend (). (See figure 4).
Equation :
(1)
�
Where: �Yt = variable data Y for certain t period,
a = constant value that was estimated by a trend
b = coefficients of slope rend model, which� is estimated by b.
e = deviation or residual, or error
Figure 4. Type of Trend Analysis
3. Result
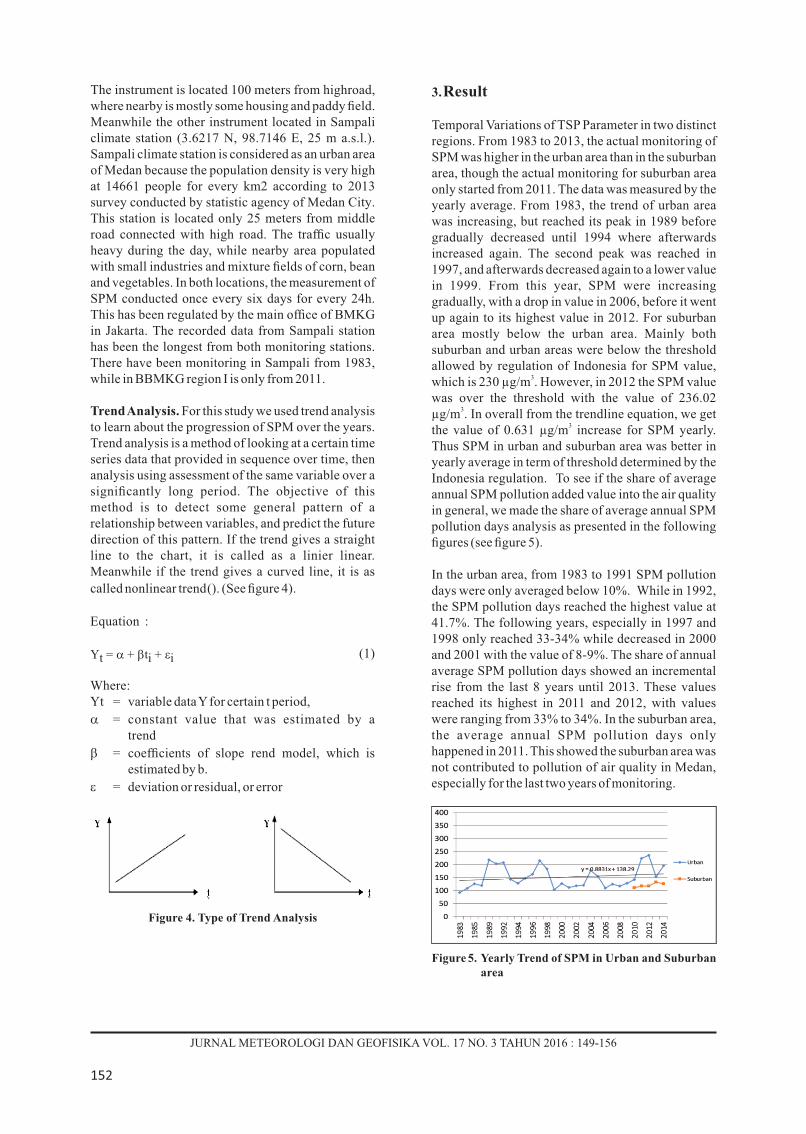
Temporal Variations of TSP Parameter in two distinct regions. From 1983 to 2013, the actual monitoring of SPM was higher in the urban area than in the suburban area, though the actual monitoring for suburban area only started from 2011. The data was measured by the yearly average. From 1983, the trend of urban area was increasing, but reached its peak in 1989 before gradually decreased until 1994 where afterwards increased again. The second peak was reached in 1997, and afterwards decreased again to a lower value in 1999. From this year, SPM were increasing gradually, with a drop in value in 2006, before it went up again to its highest value in 2012. For suburban area mostly below the urban area. Mainly both suburban and urban areas were below the threshold allowed by regulation of Indonesia for SPM value,
3which is 230 µg/m . However, in 2012 the SPM value was over the threshold with the value of 236.02
3µg/m . In overall from the trendline equation, we get 3the value of 0.631 µg/m increase for SPM yearly.
Thus SPM in urban and suburban area was better in yearly average in term of threshold determined by the Indonesia regulation. To see if the share of average annual SPM pollution added value into the air quality in general, we made the share of average annual SPM pollution days analysis as presented in the following figures (see figure 5).
In the urban area, from 1983 to 1991 SPM pollution days were only averaged below 10%. While in 1992, the SPM pollution days reached the highest value at 41.7%. The following years, especially in 1997 and 1998 only reached 33-34% while decreased in 2000 and 2001 with the value of 8-9%. The share of annual average SPM pollution days showed an incremental rise from the last 8 years until 2013. These values reached its highest in 2011 and 2012, with values were ranging from 33% to 34%. In the suburban area, the average annual SPM pollution days only happened in 2011. This showed the suburban area was not contributed to pollution of air quality in Medan, especially for the last two years of monitoring.
Figure 5. Yearly Trend of SPM in Urban and Suburban area
ASSESSMENT OF AIR POLLUTION TREND IN MEDAN CITY Arief Wibowo Suryo, Hendri Irwandi.........................................
153
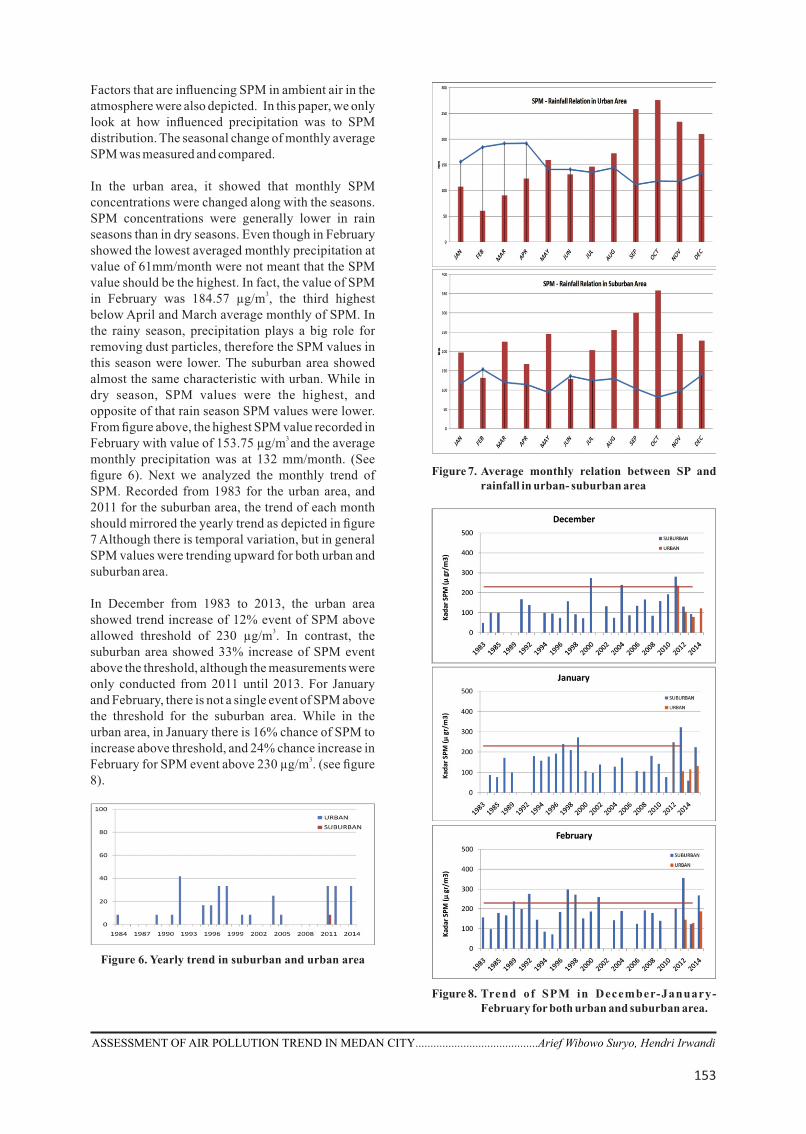
Factors that are influencing SPM in ambient air in the atmosphere were also depicted. In this paper, we only look at how influenced precipitation was to SPM distribution. The seasonal change of monthly average SPM was measured and compared.
In the urban area, it showed that monthly SPM concentrations were changed along with the seasons. SPM concentrations were generally lower in rain seasons than in dry seasons. Even though in February showed the lowest averaged monthly precipitation at value of 61mm/month were not meant that the SPM value should be the highest. In fact, the value of SPM
3in February was 184.57 µg/m , the third highest below April and March average monthly of SPM. In the rainy season, precipitation plays a big role for removing dust particles, therefore the SPM values in this season were lower. The suburban area showed almost the same characteristic with urban. While in dry season, SPM values were the highest, and opposite of that rain season SPM values were lower. From figure above, the highest SPM value recorded in
3 February with value of 153.75 µg/m and the average monthly precipitation was at 132 mm/month. (See figure 6). Next we analyzed the monthly trend of SPM. Recorded from 1983 for the urban area, and 2011 for the suburban area, the trend of each month should mirrored the yearly trend as depicted in figure 7 Although there is temporal variation, but in general SPM values were trending upward for both urban and suburban area.
In December from 1983 to 2013, the urban area showed trend increase of 12% event of SPM above
3allowed threshold of 230 µg/m . In contrast, the suburban area showed 33% increase of SPM event above the threshold, although the measurements were only conducted from 2011 until 2013. For January and February, there is not a single event of SPM above the threshold for the suburban area. While in the urban area, in January there is 16% chance of SPM to increase above threshold, and 24% chance increase in
3February for SPM event above 230 µg/m . (see figure 8).
Figure 6. Yearly trend in suburban and urban area
Figure 7. Average monthly relation between SP and rainfall in urban- suburban area
Figure 8. Trend of SPM in December-January-February for both urban and suburban area.

JURNAL METEOROLOGI DAN GEOFISIKA VOL. 17 NO. 3 TAHUN 2016 : 149-156
154
In MAM months, suburban have a 0% chance of SPM over the allowed threshold in all three months – March, April, May. While in the urban area, there is
3 23% increase of SPM chance to be over the 230 µg/mthreshold in March. For April, there is 26% chance for SPM to exceed the allowed threshold. But in May there is a decrease of SPM chance to exceed 230
3µg/m . These data are relevant to the rainfall condition in Medan. As Equatorial climate, in May Medan reached its peak for precipitation. With high precipitation, then the polluted air would be washed away. (See figure 9).
SPM in the urban area have a stable chance of 8% to 3exceed the allowed threshold of 230 µg/m in all three
months of June, July, and August. While in the suburban area, SPM concentrations have low chance of exceeding the threshold during these three months. (see figure 10).
Figure 9. Trend of SPM in March-April-May for both urban and suburban area
In September there is a small chance, only up to 1% of SPM in the urban area to surpass the allowed
3threshold of 230 µg/m . While there is zero chance of SPM in the urban area to exceed the threshold in October. But then in November, the value was increase to 4% chance of SPM to exceed the threshold. While for suburban area, there is zero chance for SPM to exceed the threshold for all three months, September, October and November. (see figure 11).
Figure 10. Trend of SPM in June – July - August for both urban and suburban area

ASSESSMENT OF AIR POLLUTION TREND IN MEDAN CITY Arief Wibowo Suryo, Hendri Irwandi.........................................
155
Figure 11. Trend of SPM in September – October - November for both urban and suburban area
4. Discussion and Conclusion
In this study, there were robust findings of the increasing trend of SPM concentration over the years in city of Medan. From 1983 to 2013 , average annual SPM concentration intensity in Urban area has increased by 6,3% and in suburban increased 66%, lthough there is temporal variation in urban area. The
variation may be affected by seasonal and RH level ()
that could affect the air pollution. Air quality seems to deteriote, it means that atmospheric environment still affected by airborne particulate.
From a statistical study for yearly SPM concentration in urban area, there were increase average SPM concentration in each month. Although mostly still below allowed threshold, except in 2012. In the monthly analysis, All months except June and july which seem stable, show increase trend in SPM concentration. This related to the Dry season that
happened in Medan City in those months. Overall from January until June, usually a dry season, there were higher precentage of SPM event exceeding allowed threshold compared with other months.In conclusion, SPM concentration still below allowed threshold for most months. But with increasing trend over 3 decades, the general air pollution in Medan could not be avoided in the future. More negative effects to the citizen of medan and its environment could be abundant. Therefore there is an urgent need to mitigate the negative effect of air pollution.
This study provides evidence that monthly SPM concentration has been increasing in term of exceeding allowed threshold. But our analysis has several limitations. First, average of time series as a proxy for the population to expose air pollution was raised number of issues because pol lutant measurements can differ between monitoring stations
(). As previous study has concluded, SPM source in
different location lead to uncertainties (). In this study,
the urban area show much variation than suburban area. This uncertainty is probably associated with estimation of source of pollutants difference in urban compare with suburban area. Another following limitations of the current study is the population way of life especially in using transportation within urban and suburban area has not been considered. The data acquired from Indonesian Statistic Bureau could not separate the specific use of transportation in urban and suburban area. The data only show the number of transportation means in Medan city as a whole. Therefore, the source of pollutant could not be concluded. The last one is Multi year data was not collected in suburban area. Because the monitoring in suburban area only happened in the last 3 years. So temporal variation in suburban area can not be deduced.
These limitations has to be addressed and hopefully the finding in this study may help policy makers to to determine the impact of air pollution and to plan and design ways to prevent negative effect of air pollutant in urban environment.
References
Barman, S., Kumar, N., Singh, R., Kisku, G., Khan, A., Kidwai, M., . . . Verma, A. (2010). Assessment of urban air pollution and it's probable heal th impact . Journal of Environmental Biology, 31(6).
Boucher, O., Randall, D., Artaxo, P., Bretherton, C., Feingold, G., Forster, P., . . . Lohmann, U. (2013). Clouds and aerosols Climate change 2013: the physical science basis. Contribution of Working Group I to the Fifth Assessment Report of the

JURNAL METEOROLOGI DAN GEOFISIKA VOL. 17 NO. 3 TAHUN 2016 : 149-156
156
Intergovernmental Panel on Climate Change (pp. 571-657): Cambridge University Press.
BPS. (2014a). Jumlah Industri Pengolahan Besar dan Sedang, Jawa dan Luar Jawa, 2001-2013. Retrieved 10-11-2014, from http://www.bps.go.id/tab_sub/view.php?kat=2&tabel=1&daftar=1&id_subyek=09¬ab=1
BPS. (2014b). Perkembangan Jumlah Kendaraan Bermotor Menurut Jenis tahun 1987-2013. Retrieved 10-11-2014, from http://www.bps.go.id/tab_sub/view.php?tabel=1&id_subyek=17¬ab=12
BPS.Sumut. (2013a). Jumlah Kendaraan Bermotor Yang Terdaftar Tahun 2012. Retrieved 10-11-2014, from http://sumut.bps.go.id/index.php?r=html/view&id=2486
BPS.Sumut. (2013b). Jumlah Perusahaan Industri Besar dan Sedang menurut Kabupaten / Kota Tahun 2012. Retrieved 10-11-2014, from http://sumut.bps.go.id/index.php?r=html/view&id=2451
Jacob, D. (1999). Introduction to atmospheric chemistry: Princeton University Press.
Jasarevic, T., Thomas, G., & Osseiran, N. 7 million premature deaths annually linked to air pollution. Retrieved 3-10-2014, from http://www.who.int/mediacentre/news/releases/2014/air-pollution/en/
KLH. (2013). Status Lingkungan Hidup Indonesia 2012.
Lutgens, F. K., & Tarbuck, E. J. (2014). Foundations of Earth Science (1st ed.). Boston: Pearson.
Meng, X., Wang, C., Cao, D., Wong, C.-M., & Kan, H. (2013). Short-term effect of ambient air pollution on COPD mortality in four Chinese cities. Atmospheric Environment, 77, 149-154.
Murakami, Y., & Ono, M. (2006). Myocardial infarction deaths after high level exposure to particulate matter. Journal of Epidemiology and Community Health, 60(3), 262-266. doi: 10.1136/jech.2005.038315
Qiu, H., Yu, I. T. S., Wang, X., Tian, L., Tse, L. A., & Wong, T. W. (2013). Season and humidity dependence of the effects of air pollution on COPD hospitalizations in Hong Kong. Atmospheric Environment, 76, 74-80.
Shah, A. S., Langrish, J. P., Nair, H., McAllister, D. A., Hunter, A. L., Donaldson, K., . . . Mills, N. L. (2013). Global association of air pollution and heart failure: a systematic review and meta-analysis. The Lancet, 382(9897), 1039-1048.
Shandilya, K. K., Khare, M., & Gupta, A. B. (2007). Suspended particulate matter distribution in rural-industrial Satna and in urban-industrial South Delhi. Environmental monitoring and assessment, 128(1-3), 431-445.
Sofianopoulou, E., Rushton, S. P., Diggle, P. J., & Pless-Mulloli, T. (2013). Association between respiratory prescribing, air pollution and deprivation, in primary health care. Journal of Public Health, 35(4), 502-509.
Stafoggia, M., Samoli, E., Alessandrini, E., Cadum, E., Ostro, B., Berti, G., . . . Grp, M.-P. S. (2013). Short-term Associations between Fine and Coarse Particulate Matter and Hospitalizations in Southern Europe: Results from the MED-PARTICLES Project. Environmental Health Perspectives, 121(9), 1026-1033. doi: 10.1289/ehp.1206151
Sudjana, N. (2005). Metode statistika. Bandung: Tarsito.