Bachelor Thesis - Happiness and Sustainability - Stefanie Fella 2013
54
Can Happiness and Sustainability be Reconciled? Affective Forecasting Errors in Human Decision Making von: Stefanie Fella Remigiusstrasse 14 50937 Köln Köln, 24.01.2013 Wirtschafts- und Sozialwissenschaftliche Fakultät der Universität zu Köln Bachelorarbeit im Fach Allgemeine Betriebswirtschaftslehre Themensteller: Prof. Dr. Bernd Irlenbusch Vorgelegt in der Bachelorprüfung im Studiengang Betriebswirtschaftslehre
-
Upload
stefanie-fella -
Category
Documents
-
view
258 -
download
0
Transcript of Bachelor Thesis - Happiness and Sustainability - Stefanie Fella 2013

Can Happiness and Sustainability be Reconciled?
Affective Forecasting Errors in Human Decision Making
von:
Stefanie Fella
Remigiusstrasse 14
50937 Köln
Köln, 24.01.2013
Wirtschafts- und Sozialwissenschaftliche Fakultät der Universität zu Köln
Bachelorarbeit im Fach Allgemeine Betriebswirtschaftslehre
Themensteller: Prof. Dr. Bernd Irlenbusch
Vorgelegt in der Bachelorprüfung im Studiengang Betriebswirtschaftslehre
I
Table of Contents
1 INTRODUCTION .............................................................................................. 1
2 THE GOAL: HAPPINESS ................................................................................ 2
2.1 What we Want ............................................................................................... 4 2.2 What we Like ................................................................................................ 5 2.3 Miswanting .................................................................................................... 6
3 DO WE ACHIEVE OUR GOAL? .................................................................... 7
3.1 Consumption and the Individual ................................................................... 8
3.2 Consumption and the Environment ............................................................... 9 3.3 A Vicious Circle .......................................................................................... 11
4 WHY WE FAIL: AFFECTIVE FORECASTING ERRORS ...................... 12
4.1 One Cause: Hedonic Adaptation ................................................................. 13 4.1.1 Diminishing Positive Emotions and Rising Aspirations ...................... 14 4.1.2 The Hedonic Treadmill ........................................................................ 16
4.1.3 Asymmetries in Hedonic Adaptation ................................................... 17 4.1.4 Explaining Asymmetries in Hedonic Adaptation ................................ 20
4.2 How Hedonic Adaptation Drives Affective Forecasting Errors ................. 22
5 A PATH TO HAPPINESS AND SUSTAINABILITY .................................. 24
6 CONCLUSION ................................................................................................. 29
7 REFERENCES ................................................................................................. 30
8 APPENDIX ....................................................................................................... 37

II
List of Figures, Tables, and Questionnaires
Figure 1: Different Notions of Utility .......................................................................... 6
Figure 2: Vicious Circle of Consumption, Happiness, and Sustainability ................. 11
Figure 3: Asymmetric Hedonic Adaptation and Systematic Utility Misprediction ... 23
Figure 4: Upward Spiral of Consumption, Happiness, and Sustainability ................ 28
Figure 5: Reported Happiness Over Time in the United States ................................. 41
Figure 6: Reported Life Satisfaction Over Time in West Germany .......................... 42
Figure 7: Trends in Ecological Footprint and Biocapacity per Person ...................... 44
Figure 8: Mean Self-Reported Health ........................................................................ 46
Figure 9: Mean Happiness of Currently Married and Unmarried Females ............... 47
Figure 10: Speed of Hedonic Adaptation to Material and Experiential Purchases .... 48
Figure 11: Hedonic Adaptation to Commuting and Labor Income ........................... 49
Figure 12: Forecasted and Experienced Positive Affect by Walking Route .............. 50
Table 1: Importance of Subjective Well-Being to College Students ......................... 37
Table 2: Mean Happiness Ratings by Lottery Winners and Accident Victims ......... 43
Table 3: Ownership of and Desires of Costly Consumer Goods ............................... 45
Questionnaire 1: The Subjective Happiness Scale ..................................................... 38
Questionnaire 2: The Satisfaction With Life Scale .................................................... 39
Questionnaire 3: The Positive and Negative Affect Schedule ................................... 40

III
List of Abbreviations
AIPO American Institute of Public Opinion
CO2 Carbon dioxide
ERB Ecologically or environmentally responsible behavior
Gha Global hectare
GSS General Social Survey
HAP Hedonic adaptation prevention
HPI Happy Planet Index
NEF New Economics Foundation
NORC National Opinion Research Center
PANAS Positive and Negative Affect Schedule
ppm Parts-per-million
SOEP Socio Economic Panel
SWB Subjective well-being
UNDP United Nations Development Program
WVS World Values Survey
WWF World Wide Fund for Nature
1
1 Introduction
Given free choice, there seems to be great consensus that human behavior is rooted
in the pursuit of happiness (Hsee/Hastie, 2006): What people buy, who people marry
as well as who and what people vote for altogether aims at creating “the good life”,
the life people would like to have (Easterlin, 2003). From the perspective of standard
economic theory there is no doubt that rational agents will arrive at maximizing their
happiness. Yet, the field of psychology, in particular happiness research, challenges
the rationality of human decision making. Thus, this paper inquires the central
question of whether people really know and choose what will ultimately make them
happy.
The investigation of this question starts with chapter 2, which introduces the concept
of happiness, how it can be measured, and whether it can actually be increased.
Further, it discusses different notions of utility and suggests happiness be a proxy for
experienced utility in order to test for utility maximization. Taking revealed
preferences theory as point of departure, chapter 3 examines how people choose to
pursue happiness. The disclosed belief that consumption leads to the good life is
challenged as people do not seem to get happier by consuming more. Instead, the
bigger picture shows that consumption harms the planet, trapping humankind in a
vicious circle of declining sustainability in the face of stagnant happiness. This state
can be explained with affective forecasting errors, when people fail to predict what
will really make them happy. Chapter 4 looks at hedonic adaptation as one source of
such errors and finds asymmetries which account for distorted choices:
Unanticipated stronger adaptation to consumption results in a systematic
overvaluation of the benefits to consume, which provides one explanation for the
common belief that happiness can be derived from consumption. Moreover, chapter
5 suggests that sustainable behavior is systematically undervalued because most
people are not aware of the intrinsic satisfactions such behavior can yield.
Finally, humankind could free itself from the vicious circle by realizing three things:
First, consumption does not necessarily increase happiness. Second, consumption
strains the planet. And third, happiness may be derived from engaging in sustainable
behavior. This could clear the way for an upward spiral leading to a happier and
more sustainable future.
2
2 The Goal: Happiness
“Happiness is the meaning and the purpose of life, the whole aim and end of human
existence.” This popular quote by Aristotle is reflected in the responses of 7,204
college students across 42 countries which show that they often think about
happiness and life satisfaction and place great importance on both (see Table 1 for an
excerpt). More than 60 percent rated happiness and life satisfaction at the top of the
importance scale and only 6 percent viewed money as more important than happiness
(Diener, 2000). It seems that most people want to be happy.1 But what is happiness?
According to sociologist Ruut Veenhoven (1984), happiness is “the degree to which
an individual judges the overall quality of his life-as-a-whole favorably. In other
words: how well he likes the life he leads.” (italics original). This evaluation of one’s
life includes affective as well as cognitive components: Frequent positive affect and
infrequent negative affect are associated with more happiness while the cognitive
side captures the conscious, subjective estimation of one’s satisfaction with life
(Diener, 1994). On the one hand, ‘happiness’ is often used as an equivalent to the
more scientific term ‘subjective well-being’ (SWB), which functions as an umbrella
term for pleasant affect, unpleasant affect, and life satisfaction (e.g., Lyubomirsky et
al., 2005; Nicolao et al., 2009). On the other hand, ‘happiness’ is often used
interchangeably with ‘life satisfaction’, which emphasizes the cognitive aspect of
happiness (e.g., Welsch, 2009). For convenience, the terms ‘happiness’, ‘SWB’ and
‘life satisfaction’ will be used as synonyms unless when referring to empirical
evidence.
Commonly, happiness is measured using large-scale surveys directly asking about
either happiness or life satisfaction. The General Social Survey (GSS) in the United
States uses a single-item question on a three-point verbal scale to measure happiness:
"Taken all together, how would you say things are these days – would you say that
you are very happy, pretty happy, or not too happy?" A multi-item measure for
happiness is Lyubomirsky’s (1999) four-item Sustainable Happiness Scale in which
people rank themselves on seven-point numerical scales. To identify people’s
1 It is important to acknowledge that the pursuit of happiness has its origin in the Western culture. For
example, it is anchored in the American Declaration of Independence as a right to all citizens
(Lyubomirsky et al., 2005). Yet, Table 1 shows that students from China, India, and Tanzania also
place great importance (above the midpoint) on happiness and life satisfaction. Moreover, Bhutan is a
typical non-Western country which endorses happiness as an official measure of national well-being.
Its Gross National Happiness index stands in contrast to the widely used Gross National Product (Ura
et al., 2012). Thus, this paper is based on the assumption that most people care about happiness.

3
satisfaction with life, the Eurobarometer surveys use a single-item measure on a four-
point verbal scale: "On the whole, are you very satisfied, fairly satisfied, not very
satisfied, or not at all satisfied with the life you lead?" Similarly, the World Values
Survey (WVS) asks: "All things considered, how satisfied are you with your life as a
whole these days?" Respondents choose from a ten-point numerical scale from “1 =
dissatisfied” to “10 = satisfied”. An equivalent multi-item approach to the cognitive
component of happiness is the Satisfaction With Life Scale, in which people answer
five items on seven-point numerical scales (Pavot/Diener, 1993). Finally, the
affective component of happiness can be measured using the 20-item Positive and
Negative Affect Schedule (PANAS, Watson et al., 1988) in which people rate how
much they feel different emotions on five-point numerical scales. Averaging scores
of life satisfaction and positive affect followed by subtracting negative affect
describes an accepted multifaceted approach to measuring happiness (e.g.,
Sheldon/Lyubomirsky, 2012).2
If everyone wants to be happy the crucial question is whether happiness can actually
be increased in the long run: If any attempts were “as futile as trying to become
taller“ (Lyubomirsky et al., 2005) the pursuit of happiness would be pointless. This
view is represented in the set-point theory of happiness according to which every
person has a genetically determined happiness level from which she can deviate in
the short term, but to which she will always return in the long run. However, an
integrative model suggests that the individual happiness set-point is only one of three
factors which affect long-term happiness. In particular, genetic dispositions are said
to account for about half of the variance in cross-sectional well-being which leaves
room to influence one’s happiness via two other determinants: Life circumstances
and intentional activity, with the first explaining averagely 10 percent and the latter
roughly 40 percent of variance (Lyubomirsky et al., 2005). This idea that, to a certain
extent, people are in control of their own happiness corresponds to another quote by
Aristotle: “Happiness depends upon ourselves.” Assuming that most people want to
be happy and that long-term happiness can be increased, the aim of this work is to
study whether people know how to increase their happiness. The next section will
introduce the economic view on this question.
2 See appendix for the complete Sustainable Happiness Scale, Satisfaction With Life Scale and
PANAS. The single-item questions were taken from Frey and Stutzer (2002). For more single- and
multi-item happiness measures as well as critics see Diener (1984; 1994).

4
2.1 What we Want
Intuitively, people want what they believe will make them happy. In this sense,
wanting refers to predictions of future liking (Gilbert/Wilson, 2001) and
encompasses two notions of estimated utility:
Predicted utility is defined as a decision-taker’s anticipation of the utility
experienced in a future outcome prior to a decision (Kahneman/Snell, 1990).
Economic textbooks typically speak of people’s preferences and it is assumed that
rational individuals know these.3 Consequently, in a decision-context, they rank all
possible alternatives in order of their familiar preferences and then choose the
alternative with the most preferred outcome (Gravelle/Rees, 2004). By introducing
utility as numerical description of preferences (Varian, 2010), one recognizes the
idea of utility maximization as the ultimate goal in the above assumptions
(Kahneman/Thaler, 2006): Choosing the most preferred available option equals
choosing the one that yields the highest utility. This outlines two important
assumptions about rational individuals: First, they are capable of accurately
predicting the utility they will experience in future outcomes. Second, they base their
choices on these predictions and ultimately maximize their utility.
As predicted utility and preferences are typically not directly observable, decision
utility is the more prominent term in modern economics: It reflects the “wantability”
(Kahneman/Thaler, 2006) of different choice options revealed at the time of decision
making. Thus, people’s preferences can be derived more objectively from observing
their actual choices which is the approach of revealed preferences theory. This
theory contrasts actually chosen options with others that could have been chosen, but
were not. Hence, for a rational, utility-maximizing individual the chosen option must
be the better one, thus revealed preferred to the latter (Varian, 2010). Moreover,
since rational agents always choose what is best for them, decision utility can be
inferred from their revealed preferences in observed choices and, at the same time, be
used to explain the choices made (Kahneman et al., 1997). Consequently, standard
economic theory does not question that people like what they wanted as this is part of
the definition of the rational, utility-maximizing individual.4
3 An additional assumption is the monotonicity of preferences, implying that more (of what is good) is
better (Varian, 2010). This assumption will be of relevance in section 3 and 4. 4 To highlight the inherent tautology: People want something because they will like it and people
(must) like it because they wanted it.

5
Finally, utility can be interpreted as “an indicator of a person’s overall well-being”
and “a numeric measure of a person’s happiness.” (Varian, 2010). Thus, rational
agents can be thought of as seeking decisions that maximize their personal happiness.
From an economic perspective, this confirms that happiness is the ultimate goal in
human behavior. Moreover, rational agents are assumed to accurately predict future
happiness and consequently choose what makes them happy.
2.2 What we Like
Yet, it would be interesting to examine whether what people want ex ante really is
what they like ex post, namely, if it actually makes them happier. This requires an
evaluation of the subjective, experienced hedonic quality after the decision has been
made, which is defined as experienced utility. There are two reasons why this classic
notion of utility diminished over history: On the one hand it did not seem possible to
objectively measure it, on the other it did not seem necessary since observable
decision utility already accounted for everything (Kahneman et al., 1997).
The concept of happiness relates closely to experienced utility: They share the
subjective nature, the resulting measurement issues and as a consequence, being
abandoned from modern economics (Varian, 2010). However, concerning happiness,
the issue of subjectivity has found acceptance in two senses: First, it is more and
more acknowledged that only the person herself can make final judgments about how
happy she is (Lyubomirsky et al., 2005). This idea is actually reflected in standard
economic theory, which grants rational individuals with the ability to know exactly
what makes them happy (Frey/Stutzer, 2002). Therefore, self-report measures such
as the ones listed above seem justified. Second, empirical evidence derived from
more objective variables, such as the happiness judgments of others and
physiological well-being indicators, strengthens the validity and reliability of self-
reports (Diener, 1994; Lyubomirsky et al., 2005). Thus, measures of subjective
happiness can serve as adequate empirical approximation to experienced utility,
which is supported by several economists (e.g., Frey/Stutzer, 2002; Welsch, 2009).
Finally, Bruno Frey, one of the recent advocates of integrating happiness research
into economics, suggests that reviving the historic notion of utility can enrich future
economic analysis in a very central aspect: Directly measuring the happiness derived
from choices allows a distinct evaluation of decision utility and experienced utility.
6
This enables testing the fundamental assumptions of standard economic theory such
as whether people’s own choices actually make them happy (Frey/Stutzer, 2002).
This idea of separately analyzing the optimality of human decisions is supported in
multiple works (Kahneman et al., 1997; Kahneman/Snell, 1990; Kahneman/Thaler,
2006; Stutzer/Frey, 2006; Welsch, 2009; Welsch/Kühling, 2010).
2.3 Miswanting
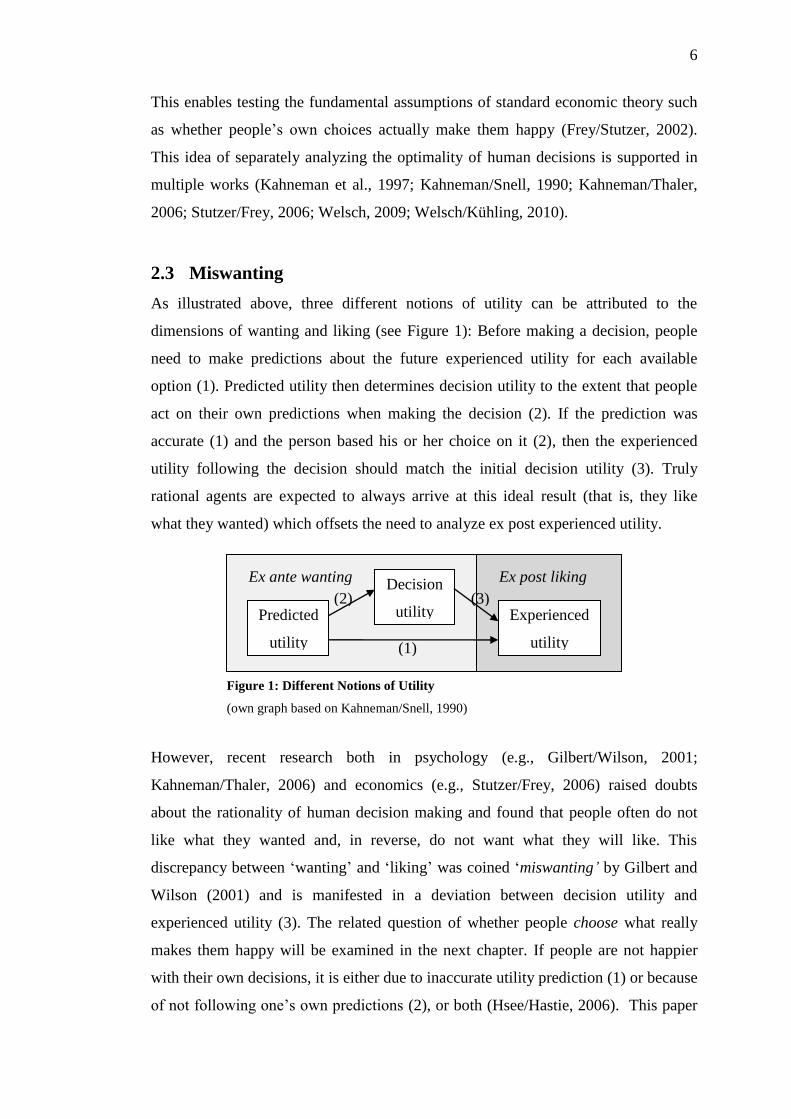
As illustrated above, three different notions of utility can be attributed to the
dimensions of wanting and liking (see Figure 1): Before making a decision, people
need to make predictions about the future experienced utility for each available
option (1). Predicted utility then determines decision utility to the extent that people
act on their own predictions when making the decision (2). If the prediction was
accurate (1) and the person based his or her choice on it (2), then the experienced
utility following the decision should match the initial decision utility (3). Truly
rational agents are expected to always arrive at this ideal result (that is, they like
what they wanted) which offsets the need to analyze ex post experienced utility.
However, recent research both in psychology (e.g., Gilbert/Wilson, 2001;
Kahneman/Thaler, 2006) and economics (e.g., Stutzer/Frey, 2006) raised doubts
about the rationality of human decision making and found that people often do not
like what they wanted and, in reverse, do not want what they will like. This
discrepancy between ‘wanting’ and ‘liking’ was coined ‘miswanting’ by Gilbert and
Wilson (2001) and is manifested in a deviation between decision utility and
experienced utility (3). The related question of whether people choose what really
makes them happy will be examined in the next chapter. If people are not happier
with their own decisions, it is either due to inaccurate utility prediction (1) or because
of not following one’s own predictions (2), or both (Hsee/Hastie, 2006). This paper
Figure 1: Different Notions of Utility
(own graph based on Kahneman/Snell, 1990)
Predicted
utility
Decision
utility Experienced
utility
Ex ante wanting Ex post liking
(1)
(2) (3)

7
will focus on the first reason referring to the question of whether people know (can
they predict) what will make them happy, which will be discussed in chapter 4.5
3 Do we Achieve our Goal?
This section investigates whether people are happy with their own choices.6 In other
words: Do they like what they wanted? Looking through the lenses of revealed
preferences theory, the world population discloses in a clear manner what it wants
and believes will increase its happiness:
Over a century, global consumption expenditure (private and public) has increased
sixteen-fold from $1.5 trillion in 1900 to $24 trillion in 1998. This is six times the
amount in 1950 and twice the amount in 1975, which describes an exponential trend.
On the individual level, per capita consumption has increased consistently in
industrial countries over the last quarter of the 20th
century, accounting for findings
such as American households needing twice the income to satisfy their consumption
aspirations in 1994 as compared to 1986 (UNDP, 1998). Accordingly, declining
household savings rates as well as surprisingly small shares of household
expenditures spent on food suggest that Americans spend more and more income on
consumption, specifically, of durable goods.7
Generally, the following global consumption patterns have been observed from 1950
until the end of the 20th
century: A doubling in the demand for wood, a tripling in the
consumption of water, grain, beef, and mutton, a four- to fivefold increase in marine
catch, a sixfold increase in paper used, and a tenfold increase in the amount of cars
driven (Fien et al., 2008; Gardner et al., 2004; Winter, 2004).
To summarize, human consumption of natural resources in the second half of the 20th
century has exceeded all prior human consumption (Fien et al., 2008). Which leaves
the crucial question: Has this made humankind any happier?
5 Chronologically, focusing on this reason makes sense because one first needs to make the prediction
before one can act on it. If failure already occurs in the first step, the second needs not to be closer
examined. 6 Therefore, parts of chapter 3 draw on a multitude of facts collected in different reports. Each fact
may stem from a different single source. Yet, for convenience, only the reports will be cited. 7 American households’ average savings rate of seven percent in 1983 halved in the 15 years that
followed (UNDP, 1998). In 1998, per capita household expenditures in the United States were
$21,515, however, only 13 percent of it was spent on food (Gardner et al., 2004).
8
3.1 Consumption and the Individual
In stark contrast to the explosion of consumption, self-reported happiness in the
United States has not increased over half a century (see Figure 5). Similarly, self-
reported life satisfaction in West Germany has been constant for almost 40 years (see
Figure 6). The stagnant happiness in two highly industrialized countries, which can
afford high consumption levels, suggests that people do not really like the
consumption they wanted – otherwise they should be happier. Of course, the United
States and West Germany are only illustrative examples.8
However, with happiness research being a young discipline and the first World
Happiness Report (Helliwell et al., 2012) only published in 2012, the availability of
longitudinal happiness data, especially for the entire world, is very limited.
Moreover, happiness related to consumption has been examined only scarcely.
Instead, research has focused on the relationship between happiness and income,
assuming that a higher income will raise happiness since people can consume more
(Frey/Stutzer, 2002). Yet, when asking 22 winners from the Illinois State Lottery,
who had won between $50,000 and $1,000,000 within the past 18 months, and 22
controls about their general happiness level, lottery winners did not rate themselves
significantly happier than controls (4.00 versus 3.82 on a scale from “0 = not at all
happy” to “5 = very much”, see Table 2). This widely cited study by Brickman and
colleagues (1978) is one among plenty that suggest only a weak relationship between
income and happiness over time (Frederick/Loewenstein, 1999; Frey/Stutzer, 2002).9
Hence, this particular relationship will not be further discussed here.
Instead, studying materialistic people who believe in acquisition as the pursuit of
happiness (Richins/Dawson, 1992) may provide more insight into the effects of
consumption on happiness: Numerous findings show a negative correlation between
materialism and life satisfaction, happiness, fun, as well as self-actualization and a
positive correlation between materialism and self-criticism, social anxiety, disorders,
and neuroticism (for an overview, see Burroughs/Rindfleisch, 2002).10
Since money
is needed in order to attain material wealth, materialists naturally place greater
importance on aspiring financial success than on other goals. This, too, is shown to
8 For similar life satisfaction trends in 15 more Western European countries, see Layard et al. (2010).
9 One needs to distinguish between the association of income and happiness at a given point in time
(which is found to be significant) versus over time (which is found to be weak; Frey/Stutzer, 2002). 10
By evaluating large-scale data (N = 23,623) from the World Values Survey, Welsch and Kühling
(2010) replicated the negative association of materialism with life satisfaction over 27 countries.

9
be associated with less self-actualization as well as more depression and anxiety
(Kasser/Ryan, 1993). Furthermore, financial success, physical attractiveness, and
social recognition belong to so called extrinsic goals.11
In this sense, materialists are
typically more extrinsically oriented which is also found to be negatively correlated
with well-being and positively correlated with distress (Kasser/Ryan, 1996). Lastly,
wanting more possessions seems particularly inherent to materialists and this craving
is associated with lower life satisfaction (Ian Norris/Larsen, 2011).
In summary, this broad body of evidence raises doubts on the idea that more
possessions and consumption will actually make people happier. In fact, focusing too
much on these means to happiness might be detrimental to individual well-being.
The paradox that the entire world chose to consume more but somehow did not get
happier by doing so implies that people do not know what really makes them happy.
This contradicts fundamental assumptions of standard economic theory that rational
agents know their own preferences and that more is always better. Furthermore, the
suggestion that “(e)conomics would not be a very interesting subject in a world
where everyone was satiated in their consumption of every good.” (Varian, 2010)
implies that the insatiability of consumers’ wants seems desirable from an economic
perspective. Hence, current media and advertising do their best to convince
consumers to want more: Global advertising expenditures increased ninefold since
1950 and reached about $446 billion in 2002 (Gardner et al., 2004), driving
humankind into more consumption and a little more, if any, happiness.
3.2 Consumption and the Environment
The human pursuit of happiness through consumption leaves its traces not only on
the well-being of the individual but also on the well-being of the planet:
The annual global energy demand needed to provide for the ever-increasing
consumption was more than 20 times higher at the end of the 20th
century than at its
beginning (Winter, 2004). Accordingly, the burning of fossil fuels has increased
around fivefold since the mid-20th
-century, contributing greatly to a fourfold increase
in annual carbon dioxide (CO2) emissions (UNDP, 1998). In 1950 the atmospheric
CO2 concentration was at 300 parts-per-million (ppm), in 2011 it was at 390.5 ppm
(WWF, 2012). These developments account much for the rise in average global
11
Extrinsic goals constitute means to different ends and depend on reward from others while intrinsic
goals directly satisfy basic psychological needs (Kasser/Ryan, 1996).

10
surface temperature of 0.8°C over the past century and of more than 0.5°C since
1950, a phenomenon widely known as global warming (Winter, 2004; WWF, 2012).
Around 80 percent of the planet’s initial forests have vanished, partly due to the need
for fuel provision (Winter, 2004). At the same time, 20 percent of CO2 emissions
occurred because of deforestation since trees typically bind CO2, establishing an
unfavorable interaction (WWF, 2012). Moreover, overgrazing and intensive farming
lead to the degradation of one sixth of the planet’s land area and per capita waste
production in industrial countries tripled in the last fifth of the 20th
century (UNDP,
1998). Since the mid-20th
-century, global water availability has dropped to less than
half, ocean acidity has increased by 30 percent and almost half of the fishing
resources are close to being exploited to their extinction (UNDP, 1998; WWF, 2012).
These findings can be summed up in a single index which reflects the overall health
of the planet: The Living Planet Index reports changes in biodiversity through
monitoring more than 9,000 populations of different species. Between 1970 and 2008
this index decreased by 28 percent which hints at a severe decline of the planet’s
habitability (WWF, 2012).
A different index mirrors what humankind demands from the planet in order to
realize their consumption levels: The Ecological Footprint calculates the amount of
land area needed to provide the renewable resources which people consume, the area
used for infrastructure, and the amount of forest area needed to absorb CO2
emissions. In 2012, the average global footprint was 2.7 global hectares (gha),
meaning that an individual needed 2.7 gha of land to realize his or her current
average consumption level (WWF, 2012).12
Of more interest, however, is the
maximum possible per capita consumption level the planet can actually offer within
environmental boundaries, that is the earth’s biocapacity adjusted by the world
population. In 1900 the planet’s biocapacity per person was 5 gha, in 1950 it was 3.6
gha and in 2008 only 1.8 gha (Rees/Wackernagel, 1994; WWF, 2012). Relating
current global Ecological Footprint to carrying capacity, humankind requires the
equivalent of 1.5 planets to realize its consumption levels.13
In other words, the
planet would need 1.5 years to regenerate humanity’s annual renewable resource use.
This clearly unsustainable relation of human demands exceeding the earth’s carrying
12
A global hectare represents the average biological productivity of various land types (WWF, 2012). 13
For comparison: If everyone was to live like the average US American did in 2008 (whose footprint
was at 7.2 gha) the equivalent of four planets would be needed (NEF, 2012; WWF, 2012).
11
capacity is termed ecological overshoot. Longitudinal data shows that this
unfavorable state was first entered in the 1970s and has only severed ever since (see
Figure 7). If humankind continues this trend, the equivalent of two planets will be
needed by 2030 and almost three by 2050 (WWF, 2012). Finally, materialists play an
important role as they engage less in buying used goods, repairing old things, and
riding bicycles, consequently leaving larger than average Ecological Footprints. In
general, materialism correlates negatively to a voluntarily simple lifestyle and to
contributing to ecological organizations, which emphasizes that materialists care less
for the environment (Richins/Dawson, 1992). Clearly, pursuing happiness through
consumption not only has personal costs but also worrying ecological costs (Kasser,
2006) as “our patterns of land use, resource consumption, and wastefulness are
damaging to the planet and, in the long run, incompatible with survival.” (De
Young, 1996).
3.3 A Vicious Circle
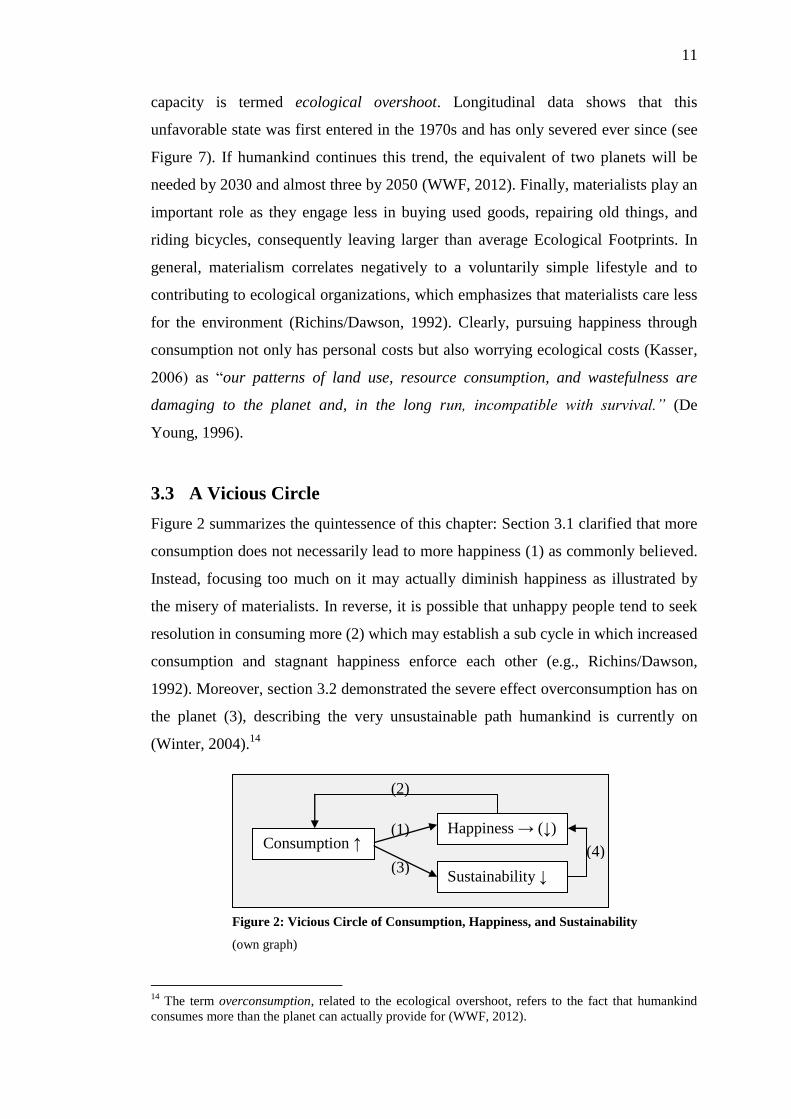
Figure 2 summarizes the quintessence of this chapter: Section 3.1 clarified that more
consumption does not necessarily lead to more happiness (1) as commonly believed.
Instead, focusing too much on it may actually diminish happiness as illustrated by
the misery of materialists. In reverse, it is possible that unhappy people tend to seek
resolution in consuming more (2) which may establish a sub cycle in which increased
consumption and stagnant happiness enforce each other (e.g., Richins/Dawson,
1992). Moreover, section 3.2 demonstrated the severe effect overconsumption has on
the planet (3), describing the very unsustainable path humankind is currently on
(Winter, 2004).14
14
The term overconsumption, related to the ecological overshoot, refers to the fact that humankind
consumes more than the planet can actually provide for (WWF, 2012).
Figure 2: Vicious Circle of Consumption, Happiness, and Sustainability
(own graph)
Consumption ↑ Happiness → (↓)
Sustainability ↓
(1)
(2)
(3) (4)

12
Lastly, it seems only logical that the declining habitability of the planet not only
applies to nonhuman species but to all that live on it. For example, global warming
accounts for an increased frequency of natural hazards and a sea level rise of 10-20
centimeters over the past century, endangering coastal regions (Gardner et al., 2004;
Winter, 2004). Moreover, happiness-related environmental valuation studies show
that human well-being is severely affected by climate, natural hazards, air and water
pollution, and airport noise (for a review, see Welsch/Kühling, 2009). Finally,
increasing demand for decreasing resources will create tensions among nations as,
for example, the number of people endangered by water deficit will almost quintuple
in the first quarter of the 21st century (Winter, 2004). In conclusion, it seems that
declining sustainability will ultimately diminish human happiness (4).
This completes the idea of a vicious circle in which consumption aimed at increasing
happiness not only fails to do so, but also damages the planet which additionally
adversely affects happiness. In this sense, consumption seems to be “neither the
ideal path to happiness nor the path to sustainability.” (O’Brien, 2008).
4 Why we Fail: Affective Forecasting Errors
Contradicting the assumptions of standard economic theory, the preceding chapter
implied that people do not always choose what makes them happier – with
detrimental effects not only for themselves but also for the environment. This failure
can be explained with utility misprediction (Frey/Stutzer, 2008), when the ex ante
predicted utility deviates from the ex post experienced utility (recall Figure 1). This
only recently evolved term in the economic field has an equivalent, older term in the
field of psychology: Affective forecasting error which refers to the deviation between
predicted and experienced emotional responses (Wilson/Gilbert, 2003).
In general, the process of affective forecasting describes people’s efforts to predict
their own future feelings following a decision. It was coined by Wilson and Gilbert
(2003) who recognized the importance this type of forecasting plays in pursuing
happiness by classifying the latter as affective state.15
Thus, utility prediction and
affective forecasting both aim at identifying what makes people happy, and utility
15
Forecasting may also concern the prediction of future events or behavior (Wilson/Gilbert, 2003).
13
misprediction and affective forecasting errors both hint at the fact that people often
fail to achieve happiness and instead have miswanted (Gilbert/Wilson, 2001).16
The broad body of research on affective forecasting (for overviews, see
Loewenstein/Schkade, 1999; Wilson/Gilbert, 2003) supports the notion that people
are only imperfect fortune tellers. The literature acknowledges that people are mostly
correct in predicting whether they will like or dislike something (valence) and that
prediction accuracy is higher if the emotional experience is immediate as well as
familiar (Kahneman/Snell, 1990; Kahneman/Thaler, 2006). However, the impact
bias is a well-established finding which states that people tend to exaggerate when
predicting the emotional impact of future events. For example, when asking 33
assistant professors to predict how happy they would be in the five years after
receiving tenure and 25 former assistant professors, who have received tenure within
the past five years, forecasters overestimated their future happiness (Gilbert et al.,
1998).17
Importantly, the impact bias consists of two aspects of emotional reactions:
Their intensity (how strong) and their duration (for how long; Wilson/Gilbert, 2003).
This paper examines the second aspect: Among numerous sources of affective
forecasting errors the process of hedonic adaptation describes a decrease in the
affective intensity of a change. Not anticipating this decline explains why people
tend to overestimate the durability of their emotions. The following sections will
look at hedonic adaptation processes as one cause of affective forecasting errors,
leading to the present state of overconsumption and environmental degradation
(Chancellor/Lyubomirsky, 2011; Frederick/Loewenstein, 1999; Frey/Stutzer, 2008;
Welsch/Kühling, 2010).18
4.1 One Cause: Hedonic Adaptation
In general, adaptation describes the declining effects of a stimulus which is constant
or repeated (Frederick/Loewenstein, 1999). Hedonic adaptation refers to stimuli that
induce affective responses associated with pleasure or pain. Among other types of
16
In the following, the term ‘utility misprediction’ from economics, ‘affective forecasting errors’ from
psychology and the more colloquial term ‘miswanting’ are used interchangeably. 17
This is a typical cross-sectional research design in which the predictions of one group (which is
about to face a certain event) are matched with the experiences reported by another group (which has
already experienced the event) to determine forecasting accuracy. Difficulties in matching as well as
the inaccuracy of retrospective reports may cause problems (Loewenstein/Schkade, 1999). 18
It would exceed the scope of this paper to examine every one of the existent sources of affective
forecasting errors. Therefore, the focus here will be on hedonic adaptation.

14
adaptation (e.g., perceptual or physiological), hedonic adaptation is of special interest
since the affective component influences how happy or unhappy a person feels.19
The
above identified stimulus of relevance here is consumption as a means to increase
happiness. Generally, affective intensity decreases over time: An unfavorable change
loses its negative, unpleasant effects and a favorable change its positive, pleasant
effects (Frederick/Loewenstein, 1999). The latter aspect is crucial to this paper since
the preceding chapter has shown that people fail to make themselves happier, that is,
to increase and maintain positive affect. Hedonic adaptation to pleasant changes
derived from consumption will be used to explain this failure.
4.1.1 Diminishing Positive Emotions and Rising Aspirations
The newly developed hedonic adaptation prevention (HAP) model by Sheldon and
Lyubomirsky (2012; also see Chancellor/Lyubomirsky, 2011) introduces two ways
in which the effects of a positive change on subjective well-being erode:
First, the positive emotions derived from a favorable event diminish over time as one
gets used to what was new. Here, hedonic adaptation seems to be driven by
perceptual adaptation: Taking up the example of lottery winners, at first, the gained
wealth enables new, exciting pleasures which could not have been afforded before.
After time passes, however, the new range of additional pleasures is perceived as
ordinary and the positive emotions derived from them fade. Brickman and colleagues
(1978) call this the process of habituation.
Second, even if positive emotions from a favorable change continue to occur,
growing aspirations decrease their positive effect on SWB. In this case, hedonic
adaptation seems to be stimulated more cognitively than sensory:20
Now that the
lottery winners have the means for a better life, they will likely expect to live in
larger houses and more luxury. If these expectations exceed realistic scenarios, this
path will actually lead to negative emotions and dissatisfaction despite the initial
positive change. Furthermore, rising aspirations limit the positive impact of future
favorable changes through setting a higher standard of what is needed just to
19
Think of someone who steps out of a dark movie theater into the bright daylight: The sunlight will
likely feel painful and the body naturally reacts with shutting one’s eyes, contracting pupils or turning
away from the sun. These physiological and behavioral reactions lead to perceptual adaptation to the
extent that the daylight now is perceived as less intense and therefore, less unpleasant. The outcome
describes hedonic adaptation which is often derived from other adaptation processes
(Frederick/Loewenstein, 1999). 20
This distinction of sensory and cognitive stimuli is proposed by Frederick and Loewenstein (1999).

15
maintain the original happiness level. This process of adopting a new reference point
against which future changes will be judged as satisfying or not is labeled
satisfaction treadmill by Kahneman (1999). Lastly, Brickman and colleagues (1978)
find evidence for the parallel working of a contrast effect that diminishes happiness:
The lottery winners rated usual everyday activities (e.g., talking to a friend, or buying
clothes) as significantly less pleasant as did controls (3.33 versus 3.82 on a scale
from 0 to 5, see Table 2). Understandably, mundane pleasures (such as having a nice
homemade Sunday brunch) will be perceived as minor and less enjoyable when
compared to the new range of available pleasures (such as having an all-you-can-eat
Sunday brunch in a five-star hotel). In this sense, the experienced upward shift in the
reference point of lottery winners blocks happiness increases in two ways:
Downgrading the ordinary pleasures and holding higher expectations regarding
future pleasures.21
This distinction between two underlying processes of hedonic adaptation is not new:
Frederick and Loewenstein (1999) introduced desensitization as a general decrease in
the affective intensity of a stimulus and shifting adaptation levels as decreasing
affective intensity due to an altered neutral stimulus level. The first seems similar to
declining (positive) emotions and the second to rising aspiration levels.22
Importantly, desensitization may lead to indifference towards stimulus changes while
shifting adaptation levels may result in enhanced sensitivity and eventually,
dissatisfaction (as described above). The latter is an unfavorable state which typically
motivates people to change it (Frederick/Loewenstein, 1999). This motivational
effect seems crucial to the topic of consumption because people may be more
inclined to buy new things if increased aspiration levels make them feel dissatisfied
with what they already have than if they were just indifferent to it. Especially in the
face of the current media focusing on creating new wants, it seems safe to assume
that overconsumption is mainly due to artificially created, higher aspirations.23
21
Notice how a change in the cognitive neutral point interacts with past and future sensory
evaluations, both leading to diminished happiness. 22
The major difference is that the HAP model refers only to positive changes whereas Frederick and
Loewenstein’s concepts consider any type of stimuli which may include negative changes. For a
comprehensive illustration of these processes consider figures 16.1 through 16.3 by Frederick and
Loewenstein (1999). 23
So far, rising aspirations were explained by comparing one’s present consumption levels to one’s
past consumption levels. A further explanation draws on social comparison where one compares one’s
own consumption levels to those of others. Social comparison is recognized as a major cause of
unhappiness (e.g., Brickman et al., 1971), but will not be further discussed here.

16
4.1.2 The Hedonic Treadmill
The preceding section has identified the decline of positive emotions and rise of
aspiration levels as drivers of hedonic adaptation which, over time, returns happiness
increases derived from consumption to baseline levels. Consequently, people
pursuing happiness through consumption are forced to consume more and more,
creating the present state of overconsumption without actually increasing happiness.
This infinite “cycle of acquisition and adaptation” (Chancellor/Lyubomirsky, 2011)
was termed hedonic treadmill by Brickman and Campbell (1971). An empirical
illustration of how this treadmill applies to the material consumption domain is
provided by Easterlin (2003) and focuses on rising aspirations:
Survey data from Roper Reports on American consumers in 1978 and 1994 included
information about their aspirations (wants) and respective attainment (haves).24
First,
participants were asked about what they wanted in life by identifying things which
they viewed as part of a good life from a list of 24 items. Among these, typical,
costly consumer goods included items like having a car, a home, a television set, a
swimming pool, and a vacation home. Next, participants stated which of the desired
items they had actually attained. Drawing on the life cycle approach, birth cohorts
were divided into an early, mid, and late life cycle to model the change of aspirations
and their attainment over an entire life cycle. Results show that over a lifetime,
people own more and more of their desired goods: Taking the mid life cycle as
example, people possessed averagely 2.5 out of 10 pricy consumer goods in the
beginning of this life cycle and 3.2 at its end (see Table 3).25 Technically, they are
better off and therefore, should be happier. However, people’s aspirations also rise:
The mean number of desired goods increased from 4.3 to 5.4 in the mid life cycle.
Notably, once initially desired material things are acquired, they elevate the reference
point of what constitutes a good life and people start to desire the initially undesired,
offsetting positive effects of material attainment on happiness.26
Crucially, the
increase in goods people already have is about as high as the increase in people’s
wants: Over the mid life cycle people owned on average 0.7 additional goods but
also wanted an additional 1.1. Over all three assessed life cycles people had on
24
The Roper Reports consist of large databases on US consumer trends, annually drawing information
from around 18,000 Americans aged 18 or older (GfK Custom Research North America, 01.01.2013). 25
The mid life cycle runs from ages between 30-44 years in 1978 to 45-59 years in 1994. 26
For example, common desires include a house and a car. Once these are fulfilled, people move on to
desire a swimming pool or a vacation home which at first were not as much regarded as part of the
good life.

17
average 0.8 more goods but also desired 1.0 more. This explains stagnant happiness
levels despite possessing more: People seem to completely adapt to their new
standard of living because aspiration levels increase about as much as the level of
progress made. Thus, hedonic adaptation to prior material attainment induces people
to want more which explains the current state of overconsumption and absent
happiness increases (Chancellor/Lyubomirsky, 2011; Sheldon/Lyubomirsky, 2012).
Brickman and Campbell (1971) already recognized the environmental problems
inherent to people’s futile attempts to overcome the hedonic treadmill by increasing
consumption. The authors acknowledged the impossibility of unlimited expansion of
production due to issues such as pollution and the finiteness of the planet’s natural
resources. Recalling chapter 3, the hedonic treadmill represents the costs of hedonic
adaptation not only to the individual but also to the environment
(Frederick/Loewenstein, 1999). Moreover, it seems that the hedonic treadmill may
take its place in the set-point theory, next to genetics, and challenge the initial
assumption that happiness can actually be altered in the long run (Brickman et al.,
1971; Lyubomirsky et al., 2005). Yet, this pessimistic view can be put into
perspective by a closer examination of the degree and speed of hedonic adaptation to
different domains in life.
4.1.3 Asymmetries in Hedonic Adaptation
A famous study most often cited to prove complete adaptation is the one mentioned
above (Brickman et al., 1978): One to eighteen months after the life changing win
lottery winners’ present mean happiness deviated insignificantly by + 0.18 from
controls (see Table 2). Furthermore, not only were lottery winners and controls
studied, but also 29 paralyzed accident victims who rated their present mean
happiness at 2.96 on a scale from 0 to 5. This counter intuitively high level of general
happiness (above the midpoint) is widely interpreted as evidence for strong
adaptation to devastating health events.
However, Frederick and Loewenstein (1999) suggest that hedonic adaptation applies
differently to specific life domains: Considering unfavorable experiences, people
adapt more to imprisonment and disabilities, but less to progressive, chronic diseases
or the loss of a loved one. For desirable experiences, people largely adapt to
increases in income but less to cosmetic surgery. With regards to noise (negative)
and food (positive), research suggests there is little to no adaptation and sometimes
18
even sensitization.27
Different researchers have tried to find a systematic
understanding for the domains to which hedonic adaptation occurs more or less:
Easterlin (2003) distinguished between pecuniary and non-pecuniary life domains
and examined the completeness of hedonic adaptation. The preceding section
presented his findings for the pecuniary domain, notably, that complete hedonic
adaptation occurs because people’s wants increase as much as their previous haves
have increased. For the non-pecuniary domain, Easterlin investigated the degree of
hedonic adaptation to health and marital status, again applying the life cycle
approach. This time, he used large scale, longitudinal data collected in the United
States GSS between 1972 and 2000, including samples up to 1,500 people per year.
By evaluating different birth cohorts in this 28-year span, again, an entire life cycle
was approximated. To examine health which naturally decreases with age, Easterlin
looked at self-reported health over an adult life span and suggested that the level of
self-reported health should be constant if complete adaptation applied to the decline.
However, the results show a clear and statistically significant downtrend in mean,
self-reported health throughout the life cycle which, indicates less than complete
adaptation to adverse health changes (see Figure 8).28
With regards to marriage,
people who are currently married constantly rate themselves as significantly happier
than those who are currently unmarried. This effect can be observed over the entire
adult life cycle (see Figure 9).29
Moreover, comparing different birth cohorts
indicates that happiness persists with marriage length: The cohort of 1951-1960
which has been married for an average of 10 years and the cohort of 1921-1930
which has been married for more than 35 years share similar mean happiness levels
between 2.0 and 2.1. Finally, within the unmarried, the widowed and divorced or
separated consistently report significantly less happiness over a life cycle than the
never married (Easterlin, 2003). Altogether, these results imply that adaptation both
to marriage as well as to its dissolution is incomplete. In general, hedonic adaptation
seems to be less complete in the non-pecuniary than pecuniary domain. Thus,
positive changes in the first may serve as lasting sources for happiness.
27
Sensitization describes an increase in affective intensity to a constant or repeated stimulus and thus,
constitutes the opposite process of hedonic adaptation (Frederick/Loewenstein, 1999). 28
See appendix for the specific question asked to elicit self-reported health. 29
Mean happiness within birth cohorts ranged from 1.9 to 2.2 for the married versus 1.6 to 1.8 for the
unmarried on a scale from “1 = not too happy” to “3 = very happy” (see chapter 2 for the exact
question used in the GSS).

19
More relevant to specific consumption choices, Nicolao and colleagues (2009)
investigated the speed of hedonic adaptation to material versus experiential
purchases: In a laboratory experiment, 355 students from the University of Texas at
Austin had to choose one of three available either material or experiential purchases.
Endowed with three lab dollars participants could buy, for example, pencils, a
keychain, or a little picture frame in the material purchase condition. In the
experiential, they could decide to purchase a video to watch, a song to listen to, or a
video game to play.30
After the purchases had been made, the students were asked to
rate their happiness with these at five different points in time: Directly after
consumption, seven minutes later, one day later, one week later, and two weeks
later.31
The first two ratings were conducted in the lab while the three latter ratings
were collected via Internet. As indicated by the significantly steeper slopes observed
in the material purchase condition (see part A of Figure 10), the findings of this
longitudinal experiment show that adaptation is more rapid to material than to
experiential purchases. This suggests that happiness can be pursued more effectively
by investing in intangible experiences rather than tangible possessions.
Finally, Frey and Stutzer (2008) provide further empirical evidence that the speed
and completeness of hedonic adaptation varies systematically across different goods
and activities. They categorize them as having relatively more extrinsic or intrinsic
attributes based on the different kinds of needs these goods satisfy: Extrinsic
attributes relate to desires for status, prestige, and fame whereas intrinsic attributes
satisfy inherent needs such as relatedness, competence, and autonomy. The authors
propose that hedonic adaptation occurs less to the consumption of intrinsic goods and
activities than to extrinsic ones. To test this hypothesis, they used longitudinal data
(from 1985 to 2003) of the German SOEP on self-reported life satisfaction, labor
income, and individual commuting time in a sample of full-time workers.32
Looking
at a period of three years, they find that adaptation to daily commuting is slower and
30
All options were actually priced at around $3.00 to ensure their comparability. 31
The following items were used to rate happiness on seven-point scales from “1 = not at all” to “4
= moderately” to “7 = very much”:
"When you think about this purchase, how happy does it make you?"
"How much does this purchase contribute to your happiness in life?"
"To what extent do you think the money spent on this purchase would have been better spent on
something else—some other type of purchase that would have made you happier?" 32
Life satisfaction was elicited with the item presented in the note on Figure 6. For the commuting
time, people were asked: “How long does it normally take you to go all the way from your home to
your place of work using the most direct route (one way only)?”

20
weaker than to a higher labor income (see Figure 11). Moreover, a slight
sensitization was associated with the time spent on commuting. Based on the idea
that longer commutes deprive people from satisfying intrinsic needs (such as
spending time with family and friends) and a higher income enabling the satisfaction
of more extrinsic desires (such as a higher standard of living), these results support
the notion that adaptation is likely to be stronger for extrinsic than intrinsic domains.
In conclusion, people would be better off if they resisted high salary work positions
which are assumed to involve long commutes and instead chose the averagely paid
job closer to home, consequently leaving more time to satisfy intrinsic needs.
Altogether, the findings above help explaining why purchasing and consuming more
seem to constitute a futile route to more happiness: As hedonic adaptation applies
more strongly to the pecuniary, material, and extrinsic domains, short term happiness
increases via consumption revert quickly and almost complete to baseline.
Consequently, materialists who typically concentrate on these domains are more
miserable than the average person who also considers the complementary domains:
The non-pecuniary, experiential, and intrinsic, which offer hope since hedonic
adaptation applies less rapidly and to a smaller extent to them.
4.1.4 Explaining Asymmetries in Hedonic Adaptation
After having reviewed various empirical evidence on asymmetries in hedonic
adaptation, this section provides a possible explanation for these findings. In
particular, Frederick and Loewenstein (1999) propose that evolutionary benefits
account for domain specific hedonic adaptation: Presumably, it makes sense not to
fully adapt to being hungry, thirsty, in pain, or sexually excited because these
hedonic states motivate people to meet survival relevant needs. Behaviors that satisfy
these, such as having food or sex, are said to be inherently or intrinsically pleasant.
That is, they are rewarding in themselves which works against hedonic adaptation.33
In this sense, the results of a cosmetic surgery may be viewed as directly satisfying
whereas a higher income or lottery win is typically used as means to other ends: It is
not rewarding in itself but needs to be spent on things which possibly are (such as
material possessions to gain status). In this sense, money can be viewed as rather
extrinsically satisfying which explains faster adaptation processes applying to it
33
Brickman and colleagues (1971) speak of “nonrelativistic elements”.

21
(Frey/Stutzer, 2008). This categorization of something being more intrinsically or
more extrinsically satisfying can be applied to the former distinction between
pecuniary and non-pecuniary life domains as well as between material and
experiential purchases:
In the pecuniary domain, Easterlin (2003) observed full adaptation to material
possessions as means to living the good life. The tendency of people wanting to have
more of them implies that what they already had was not inherently satisfying. Thus,
the pecuniary domain seems to constitute something more extrinsically satisfying.
Accordingly, the incomplete adaptation found for marriage (positive) and
deteriorating health (negative) in the non-pecuniary domain suggests this domain
holds strong intrinsic components: A happy marriage is likely to meet the intrinsic
need for relatedness and a declining health is very likely to forestall intrinsic needs
such as autonomy and competence (Frey/Stutzer, 2008). Moreover, the loss of a
loved one typically represents a loss in relatedness. Slow as well as incomplete
adaptation to this undesirable experience supports the link between the non-
pecuniary domain and intrinsic satisfaction. In the material versus experiential
domain, faster adaptation to material purchases suggests again that they are not
intrinsically rewarding. Instead, slower adaptation was observed for experiential
purchases which typically involve social interaction, fostering relatedness and
therefore, intrinsic satisfaction. Apart from relatedness, Nicolao and colleagues
(2009) propose that experiential purchases also meet other basic human needs.
In this sense, the pecuniary and material domains can be summed up in the
extrinsically satisfying domain (in short: extrinsic domain) and the non-pecuniary
and experiential domains in the intrinsically satisfying domain (intrinsic domain).
Overall, the evidence above is supportive of hedonic adaptation applying faster and
more completely to the extrinsic than the intrinsic domain. In other words, happiness
derived from the former does not last as long as happiness derived from the latter.
Thus, it seems more promising to pursue happiness through the intrinsic domain. But
why do people choose the less promising path to happiness by deciding to consume
more?

22
4.2 How Hedonic Adaptation Drives Affective Forecasting Errors
Affective forecasting serves to estimate the post decision experienced utility of given
options. Two challenges which people encounter hereby are that they need to
anticipate hedonic adaptation to generally occur over time and, in particular, the
speed and extent to which it will occur. Various sources (e.g., Stutzer/Frey, 2006)
and the vicious circle described in chapter 3 suggest that people either neglect
adaptation completely or anticipate it only insufficiently.
The first challenge is illustrated by an undergraduate study cited by Kahneman
(2000) in which 362 adults were asked to estimate the moods of different categories
of people, among them lottery winners and paraplegics. Half of the sample had to
assume that the life changing event had occurred one month ago, the other half was
told that the change had happened one year ago. Results showed almost equal
forecasts for the different time conditions: Paraplegics were expected to be about as
miserable and lottery winners to be about as happy after one month as well as after
one year had passed since the accident or the lottery win. These estimates clearly
ignore adaptation and this ignorance may be explained by the so called transition
rule: When making forecasts about the well-being effects of a state (being a lottery
winner) people typically focus on how the transition to that state (winning the lottery)
will feel like. Consequently, the duration of emotions evoked by the transition is
exaggerated and adaptation in the long run is neglected (Kahneman, 1999; 2000).
The same heuristic may apply to purchasing decisions when people focus on how
much happier acquiring a product will make them feel as opposed to possessing it.
Underestimating adaptation to future possessions results in an overvaluation of the
benefits of the acquisition at the time of decision making. In the end, actual
happiness (experienced utility) derived from the purchase will be lower than
expected (predicted utility). In this sense, affective forecasting errors materialize in a
different ex ante and ex post utility valuation of choice alternatives, which results in
non-utility maximizing outcomes (Frey/Stutzer, 2008; Stutzer/Frey, 2006;
Welsch/Kühling, 2010). Notably, learning from such experiences seems to be
problematic since predicted utility tends to be (falsely) remembered as being similar
to experienced utility (Loewenstein/Schkade, 1999; Wilson/Gilbert, 2003).
The second challenge of predicting the speed and degree of hedonic adaptation is
largely influenced by the domain-related asymmetries found in hedonic adaptation. It

23
is not surprising that they carry forward to equivalent asymmetries in the accuracy of
affective forecasts (see Figure 3): When people adapt faster to extrinsic domains
(e.g., material purchases) in t1 and t2, but do not predict this adaptation in t0, they are
likely to overvalue the utility derived from them. Similarly, when people fail to
acknowledge that adaptation to intrinsic domains (e.g., experiential purchases) in t1
and t2 is weaker, they undervalue goods and activities serving intrinsic needs when
making affective forecasts in t0. Consequently, people systematically over-consume
extrinsic goods and under-invest in intrinsic ones (Frey/Stutzer, 2008; Stutzer/Frey,
2006). Importantly, choices seem to be distorted towards reducing happiness since,
for example, experiential purchases lead to more reported happiness than material
purchases (Nicolao et al., 2009). Hence, even when people anticipate the occurrence
of hedonic adaptation, they do not always choose what maximizes their happiness
because of distorted forecasts: Their own predictions are biased towards choosing the
things to which they will adapt quickly (thus, receive less happiness) because this
adaptation is not foreseen. Accordingly, things to which they would actually adapt
more slowly (thus, receive more happiness) are undervalued and not chosen.
Notably, asymmetric hedonic adaptation accounts for systematic instead of just
random utility misprediction as some domains are more affected than others.
Furthermore, the extrinsic domain seems to be liable to larger affective forecasting
errors due to unanticipated stronger adaptation applying to it. Therefore, it seems
only logical that people placing more importance on the extrinsic domain (e.g.,
Figure 3: Asymmetric Hedonic Adaptation and Systematic Utility Misprediction
(own graph based on Frey/Stutzer, 2008; Welsch/Kühling, 2010)
= Undervaluation
Predicted Utility Experienced Utility ≠
Asymmetric
Hedonic
Adaptation
Extrinsic
Intrinsic Intrinsic
Extrinsic
Not Anticipated!
t0 t1 t2
= Overvaluation
Extrinsic
Pecuniary
Material
Systematic
Utility
Misprediction
Intrinsic
Non-pecuniary
Experiential

24
materialists) are likely to arrive at greater distorted choices (Frey/Stutzer, 2008;
Stutzer/Frey, 2006; Welsch/Kühling, 2010). Research by Sheldon and colleagues
(2010) supports that people holding a relatively more extrinsic as opposed to intrinsic
value orientation are prone to overvaluing extrinsic domains which may explain why
they are less happy. In summary, unpredicted asymmetries in hedonic adaptation
create an unhealthy imbalance in the valuation of goods, driving people to work and
consume more as their own happiness diminishes and the planet suffers.
5 A Path to Happiness and Sustainability
Some empirical evidence suggests that there are similar asymmetries in the valuation
of choices relevant to sustainability:
Taking up on the commuting study (Frey/Stutzer, 2008), the overvaluation of a
higher labor income due to unanticipated faster adaptation to it induces people to
commute longer than optimal. From an environmental perspective, more commuting
harms the planet since, for example, it contributes to more CO2 emissions through
the use of cars. In this sense, the distorted evaluation of the benefits of a higher
income involving longer commutes (opposed to a lower income demanding shorter
commutes) is both damaging individual happiness as well as the planet.
Regarding particular consumption choices, Welsch and Kühling (2010) suggest that
asymmetric hedonic adaptation accounts for a bias in deciding between
environmental-friendly and ordinary consumption. They attribute the first to the
intrinsic and the latter to the extrinsic domain. Thus, benefits derived from more
ordinary consumption tend to be overvalued ex ante as faster adaptation to it is
unforeseen. Consequently, consumption choices are biased towards choosing more
ordinary consumption and less of the undervalued environmental-friendly
consumption, yielding non-utility-maximizing choices. These ideas are formalized in
a theoretical model which illustrates a utility trade-off between the quantity of
(ordinary) consumption and the quality of (environmental-friendly) consumption,
given a budget constraint and the assumption that higher quality is more expensive.
In line with standard microeconomics, utility is maximized if the net marginal utility

25
from quality is zero.34
Using World Values Survey data on 23,623 individuals across
27 countries between 1994 and 1999, Welsch and Kühling empirically test their
hypothesis of less than individually optimal environmental-friendly consumption.
Self-reported life satisfaction was collected with the item introduced in chapter 2 and
environmental-friendly consumption consisted of three self-reported behaviors: The
usage of green products, recycling, and saving water.35
Results show a positive and
significant relationship between life satisfaction and each of the three pro-
environmental behaviors as well as their composite index, indicating that more
environmental-friendly consumption would make people happier.36
Hence, people
currently seem to consume less environmentally-friendly than optimal. Moreover,
Welsch and Kühling replicate the finding that materialists are prone to larger choice
distortions. This is important, because they constituted almost two thirds of the large
sample, implying that the majority of people choose to the disadvantage of
themselves and the environment because they underestimate the positive effects of
engaging in environmental-friendly consumption. Lastly, Welsch and Kühling show
that a higher general education and familiarity with pro-environmental consumption
can reduce choice distortions.
More empirical evidence for positive associations between sustainable behaviors and
happiness comes from several studies grounded in psychology:
Corral-Verdugo and colleagues (2011) asked 606 students in a middle-sized Mexican
city to report how much they engage in pro-ecological, frugal, altruistic, and
equitable behaviors as well as to rate their happiness. The four elicited behaviors are
regarded as sustainability-relevant in the environmental psychology literature and
were aggregated to form a higher order factor named “sustainable behavior”.
Findings show a positive and significant relationship between happiness and the
composite factor as well as three of the individual behaviors.
Similarly, Brown and Kasser (2005) collected happiness ratings and self-reports on
the frequency of ten ecologically responsible behaviors (ERBs) from 206 American
34
In other words, the additional utility derived from higher quality should equal the additional
disutility of quantity foregone. 35
In particular, the WVS asked: “Which, if any, of these things have you done in the last 12 months,
out of concern for the environment?
Have you chosen household products that you think are better for the environment?
Have you decided for environmental reasons to reuse or recycle something rather than throw it away?
Have you tried to reduce water consumption for environmental reasons?”
Answers were given on a scale from “0 = have not” to “1 = have done”. 36
The results are robust to controlling for nationality, demographics, and pro-environmental attitudes.

26
middle and high school students and find a significant, positive correlation between
happiness and ERB. Furthermore, they assessed extrinsic (via materialism) and
intrinsic values (via generosity) and replicated the results presented in chapter 3,
namely that extrinsic values are negatively associated with happiness and ERB. More
importantly, intrinsic values are positively associated with happiness and ERB and
explain the positive relation between happiness and ERB. These findings were
extended to an American adult sample consisting of 200 self-identified voluntary
simplifiers and 200 matched mainstream individuals, using different measures of
SWB and ERB. Results show that voluntary simplifiers are relatively more
intrinsically oriented, report more positive affect and life satisfaction, have smaller
Ecological Footprints, and spend more time on environmental behaviors. Notably,
the importance of intrinsic values to ERB may confirm that the latter belongs to the
intrinsic domain as suggested by Welsch and Kühling (2010).
There are several downsides to the above studies: The items for eliciting happiness
did not always precede the items for sustainable behavior (e.g., Welsch/Kühling,
2010) which may have influenced responses to the happiness item (Kahneman,
1999). Moreover, all studies relied on self-reported behavior which does not
necessarily indicate actual behavior. Lastly, correlations do not describe the direction
of causality: It is unclear whether happiness results from sustainable behavior or
whether it drives it, or possibly both (Corral-Verdugo et al., 2011). The next
experimental study conducted by Nisbet and Zelenski (2011) solves some of these
issues and revisits the topic of affective forecasting:
The aim was to examine how much happiness students derive from walking outdoors
in nearby nature (versus indoors) and how capable they are in forecasting these
effects. In a between-subjects design, 150 Carleton University students were
randomly assigned to be either a forecaster or an experiencer and to walk either an
outdoor route next to a canal or indoors using the campus tunnel system.37
First, all
participants received descriptions of their respective walking routes. Then,
forecasters should predict how they will feel after having walked outside or inside
before they departed. Next, everyone went on their walks and experiencers were
asked about their present feelings right after having returned. Affect was measured
37
Both routes took about 17 minutes to walk and were rated as equally familiar by an independent
sample (N = 198) to make sure that predictions would be made on comparable bases. Furthermore,
walks were done on days without rain at an average temperature of 10°C.

27
using a slightly modified PANAS (see Questionnaire 3). Results show that more
positive affect (3.26 versus 2.41) and less negative affect (1.34 versus 1.60) was
reported by experiencers who walked outside than by those who walked indoors.
More interestingly, outdoor forecasters predicted less positive affect (2.89 versus
3.26) and indoor forecasters more positive affect (2.56 versus 2.41, see Figure 12)
than experiencers actually reported. These findings were replicated with different
walking routes in a within-subject design (N = 80) where the same person is
forecaster and experiencer.38
Overall results indicate that when making predictions,
participants overestimate enjoyment from walking indoors and underestimate
enjoyment from walking outdoors, leading to an overvaluation of the indoor route.39
To the extent that people act on their predictions, they would have miswanted to their
own disadvantage since walking outside has proven to create more positive affect
and thus, more happiness. This research is important for sustainability because if
people accurately predicted the benefits of being in nature they, eventually, would
care more about its preservation, both raising their individual happiness and saving
the planet. Yet, people’s apparent inability to learn from the past is likely to
constitute an obstacle to this.
Finally, in terms of conservation psychologist Raymond de Young, happiness would
belong to intrinsic satisfactions, “the underappreciated intangible but positive
payoffs” (De Young, 1996) inherent to ERBs.40
This notion is supported by
altogether 13 studies conducted between 1983 and 1999 using questionnaires on
intrinsic satisfactions and ERBs such as recycling, source reduction, and water
conservation.41
Sample sizes ranged from 72 to 3,705 participants, among them not
only students but mostly adults across the United States, Canada, Taiwan, and
Norway (for overviews, see De Young, 1996; 2000). The results indicate that people
derive immediate, personal satisfaction from living a frugal lifestyle and participating
38
One problem inherent to within-subject designs is that the prediction itself may influence the
experience as attention is focused on it. The between-subject design resolves this issue. Yet, in this
research design prediction errors can only be approximated since forecaster and experiencer are not
the same person. For more information about research designs see Loewenstein and Schkade (1999). 39
Note that over- and undervaluation are not explicitly linked to hedonic adaptation in these studies.
However, one can imagine that walking through the ever same tunnels gets boring pretty quickly and
that walking outdoors provides more new stimuli which revive the experience every time. 40
The benefits of ERBs being “underappreciated” aligns with the general idea that ERBs are
systematically undervalued and thus, not chosen. 41
Source reduction refers to reusing things within the household in a do-it-yourself manner which
reduces the purchase of new goods. In contrast, recycling typically involves community services and
has no direct effect on household consumption (De Young, 1985-86).

28
in meaningful activities that make a difference in the long run, aspects central to
ERBs. Moreover, these elicited intrinsic satisfactions are positively associated with
self-reported ERBs, suggesting that these are intrinsically satisfying. This further
supports the idea that sustainable behaviors fall under the intrinsic domain, which has
shown to be the more promising path to lasting happiness. Lastly, more intrinsic
satisfaction is associated with more intrinsic motivation (De Young, 1985-86). This
supports the intuition that something intrinsically satisfying is very likely to also be
intrinsically motivating. Thus, happiness derived from acting sustainably could
establish a positive reinforcement for more sustainable behavior (Corral-Verdugo et
al., 2011), eventually leading to more happiness (as one engages in the intrinsically
satisfying behavior) and more sustainability.
The findings above might pave the way for an upward spiral which is summarized in
Figure 4: People could maintain or even reduce their consumption levels as they
engage in ERBs (such as recycling and reusing) and gain happiness from doing so
(1). At the same time, the happiness derived from ERBs is likely to motivate people
to engage in more ERBs (2). Needless to say, ERBs leading to reduced consumption
would enhance the sustainability of the planet (3) which in turn could make people
happier (4) since, for example, a higher air and water quality improves outdoor
experiences. Contradicting a pervasive view that sustainable behavior demands
sacrifice and restraint, which ultimately reduce happiness, this upward spiral
proposes that happiness and sustainability indeed can be reconciled (Brown/Kasser,
2005).
Figure 4: Upward Spiral of Consumption, Happiness, and Sustainability
(own graph based on Figure 2)
Consumption → ↓
(via ERBs)
Happiness ↑
Sustainability ↑
(1)
(2)
(3) (4)

29
6 Conclusion
Based on the assumptions that happiness is important and can be increased, this
paper started out with the question of whether people know and choose what will
make them happy. The rational, utility-maximizing individual assumed in standard
economic theory is expected to succeed in pursuing happiness. Yet, in the face of
decade-long, stagnant happiness levels, the revealed preference for consumption
might constitute an erroneous belief that “‘the goods life’ is the path to ‘the good
life’” (Kasser, 2006). This error could be explained with the apparent human
inability to predict how much happiness will actually be derived from consumption.
One cause of such affective forecasting errors is underestimating hedonic adaptation
to consumption, which results in an overestimation of the benefits to consume. Thus,
people believe they will receive more happiness from consuming than they actually
do. Since learning from this experience appears to be rather difficult, humankind
seems to be trapped in a futile pursuit of happiness. Eventually, this trap could
endanger the survival of life on earth as human consumption has detrimental effects
on the planet (De Young, 1996; Winter, 2004).
To escape from this trap, it seems crucial that people realize the far reaching impact
their daily consumption choices have, without actually increasing happiness
(O’Brien, 2008). Furthermore, recognizing that happiness and sustainability may be
complementary pursuits could foster a change in behavior: As proposed in the last
chapter, happiness might constitute both a positive consequence as well as an
antecedent of sustainable behavior (Corral-Verdugo et al., 2011). This reconciliation
of happiness and sustainability on the individual level can also be found on a macro-
level: The Happy Planet Index (HPI) assesses human well-being in relation to
ecological well-being on a country by country basis (NEF, 2012). In 2012, Costa
Rica ranked first, reporting more happiness and longer lives than the United States
did, while at the same time, presenting an Ecological Footprint almost three times
smaller than the United States’ (which ranked 105th
out of 151 countries in the HPI).
This illustrates on a global level that “good lives do not have to cost the Earth”
(NEF, 2012). In this sense, the goal driving human behavior may be extended from
happiness to sustainable happiness, which is “the pursuit of happiness that does not
exploit other people, the environment or future generations.” (O’Brien, 2008).

30
7 References
Brickman, P. and Campbell, D. T. (1971): Hedonic relativism and planning the good
society. In: Appley, M. H. (Ed.): Adaptation-level theory – A Symposium. New York:
Academic Press: 287–302.
Brickman, P., Coates, D. and Janoff-Bulman, R. (1978): Lottery winners and
accident victims: Is happiness relative? In: Journal of Personality and Social
Psychology 36: 917–927.
Brown, K. W. and Kasser, T. (2005): Are psychological and ecological well-being
compatible? The role of values, mindfulness, and lifestyle. In: Social Indicators
Research 74: 349–368.
Burroughs, J. E. and Rindfleisch, A. (2002): Materialism and well‐being: A
conflicting values perspective. In: Journal of Consumer Research 29: 348–370.
Chancellor, J. and Lyubomirsky, S. (2011): Happiness and thrift: When (spending)
less is (hedonically) more. In: Journal of Consumer Psychology 21: 131–138.
Corral-Verdugo, V., Mireles-Acosta, J., Tapia-Fonllem, C. and Fraijo-Sing, B.
(2011): Happiness as correlate of sustainable behavior: A study of pro-ecological,
frugal, equitable and altruistic actions that promote subjective well-being. In:
Human Ecology Review 18: 95–104.
De Young, R. (1985-86): Encouraging environmentally appropriate behavior: The
role of intrinsic motivation. In: Journal of Environmental Systems 15: 281–292.
De Young, R. (1996): Some psychological aspects of reduced consumption behavior:
The role of intrinsic satisfaction and competence motivation. In: Environment and
Behavior 28: 358–409.

31
De Young, R. (2000): Expanding and evaluating motives for environmentally
responsible behavior. In: Journal of Social Issues 56: 509–526.
Diener, E. (1984): Subjective well-being. In: Psychological Bulletin 95: 542–575.
Diener, E. (1994): Assessing subjective well-being: Progress and opportunities. In:
Social Indicators Research 31: 103–157.
Diener, E. (2000): Subjective well-being: The science of happiness and a proposal
for a national index. In: American Psychologist 55: 34–43.
Easterlin, R. A. (2003): Explaining happiness. In: Proceedings of the National
Academy of Sciences 100: 11176–11183.
Fien, J., Neil, C. and Bentley, M. (2008): Youth can lead the way to sustainable
consumption. In: Journal of Education for Sustainable Development 2: 51–60.
Frederick, S. and Loewenstein, G. (1999): Hedonic adaptation. In: Kahneman, D.,
Diener, E. and Schwarz, N. (Eds.): Well-being – The foundations of hedonic
psychology. New York: Russell Sage Foundation: 302–329.
Frey, B. S. and Stutzer, A. (2002): What can economists learn from happiness
research? In: Journal of Economic Literature 40: 402–435.
Frey, B. S. and Stutzer, A. (2008): Economic consequences of mispredicting utility.
Center of Business and Economics (WWZ) Working Paper No. 01/08, Basel.
Gardner, G., Assadourian, E. and Sarin, R. (2004): The state of consumption today.
In: Starke, L. (Ed.): State of the World 2004 – Special Focus: The Consumer Society.
New York: W. W. Norton & Company: 3–21.
GfK Custom Research North America: GfK Roper Reports® US. In:
http://www.gfkamerica.com/practice_areas/roper_consulting/roper_reports/index.en.
html as of 01.01.2013.

32
Gilbert, D. T., Pinel, E. C., Wilson, T. D., Blumberg, S. J. and Wheatley, T. P.
(1998): Immune neglect: A source of durability bias in affective forecasting. In:
Journal of Personality and Social Psychology 75: 617–638.
Gilbert, D. and Wilson, T. D. (2001): Miswanting – Some problems in the
forecasting of future affective states. In: Forgas, J. P. (Ed.): Feeling and thinking –
The role of affect in social cognition. Cambridge: Cambridge University Press: 178–
197.
Gravelle, H. and Rees, R. (2004): Microeconomics. Harlow: Prentice Hall Financial
Times.
Helliwell, J. F., Layard, R. and Sachs, J. (2012): World happiness report. New York:
The Earth Institute, Columbia University.
Hsee, C. K. and Hastie, R. (2006): Decision and experience: Why don't we choose
what makes us happy? In: Trends in Cognitive Sciences 10: 31–37.
Ian Norris, J. and Larsen, J. T. (2011): Wanting more than you have and its
consequences for well-being. In: Journal of Happiness Studies 12: 877–885.
Kahneman, D. (1999): Objective Happiness. In: Kahneman, D., Diener, E. and
Schwarz, N. (Eds.): Well-being – The foundations of hedonic psychology. New York:
Russell Sage Foundation: 3–25.
Kahneman, D. (2000): Evaluation by moments: Past and future. In: Kahneman, D.
and Tversky, A. (Eds.): Choices, values, and frames. New York: Russell Sage
Foundation: 693–708.
Kahneman, D. and Snell, J. (1990): Predicting utility. In: Hogarth, R. M. (Ed.):
Insights in decision making. Chicago: University of Chicago Press: 295–310.
Kahneman, D. and Thaler, R. H. (2006): Anomalies – Utility maximization and
experienced utility. In: Journal of Economic Perspectives 20: 221–234.

33
Kahneman, D., Wakker, P. P. and Sarin, R. (1997): Back to Bentham? Explorations
of experienced utility. In: The Quarterly Journal of Economics 112: 375–405.
Kasser, T. (2006): Materialism and its alternatives. In: Csikszentmihalyi, M. and
Csikszentmihalyi, I. S. (Eds.): A life worth living – Contributions to positive
psychology. Oxford: Oxford University Press: 200–214.
Kasser, T. and Ryan, R. M. (1993): A dark side of the American dream: Correlates
of financial success as a central life aspiration. In: Journal of Personality and Social
Psychology 65: 410–422.
Kasser, T. and Ryan, R. M. (1996): Further examining the American dream:
Differential correlates of intrinsic and extrinsic goals. In: Personality and Social
Psychology Bulletin 22: 280–287.
Layard, R., Mayraz, G. and Nickell, S. (2010): Does relative income matter? Are the
critics right? In: Diener, E., Helliwell, J. F. and Kahneman, D. (Eds.): International
differences in well-being. Oxford: Oxford University Press: 139–165.
Layard, R., Clark, A. and Senik, C. (2012): The causes of happiness and misery. In:
Helliwell, J. F., Layard, R. and Sachs, J. (Eds.): World happiness report. New York:
The Earth Institute, Columbia University: 58–89.
Loewenstein, G. and Schkade, D. (1999): Wouldn't it be nice? Predicting future
feelings. In: Kahneman, D., Diener, E. and Schwarz, N. (Eds.): Well-being – The
foundations of hedonic psychology. New York: Russell Sage Foundation: 85–105.
Lyubomirsky, S. and Lepper, H. S. (1999): A measure of subjective happiness:
Preliminary reliability and construct validation. In: Social Indicators Research 46:
137–155.
Lyubomirsky, S., Sheldon, K. M. and Schkade, D. (2005): Pursuing happiness: The
architecture of sustainable change. In: Review of General Psychology 9: 111–131.

34
New Economics Foundation (NEF) (2012): The happy planet index: 2012 report – A
global index of sustainable well-being. London: New Economics Foundation.
Nicolao, L., Irwin, J. R. and Goodman, J. K. (2009): Happiness for sale: Do
experiential purchases make consumers happier than material purchases? In:
Journal of Consumer Research 36: 188–198.
Nisbet, E. K. and Zelenski, J. M. (2011): Underestimating nearby nature: Affective
forecasting errors obscure the happy path to sustainability. In: Psychological
Science 22: 1101–1106.
O'Brien, C. (2008): Sustainable happiness: How happiness studies can contribute to
a more sustainable future. In: Canadian Psychology 49: 289–295.
Pavot, W. and Diener, E. (1993): Review of the satisfaction with life scale. In:
Psychological Assessment 5: 164–172.
Rees, W. E. and Wackernagel, M. (1994): Ecological footprints and appropriated
carrying capacity: Measuring the natural capital requirements of the human
economy. In: Jansson, A., Hammer, M., Folke, C. and Costanza, R. (Eds.): Investing
in natural capital – The ecological economics approach to sustainability.
Washington, D.C: Island Press: 362–390.
Richins, M. L. and Dawson, S. (1992): A consumer values orientation for
materialism and its measurement: Scale development and validation. In: Journal of
Consumer Research 19: 303–316.
Sheldon, K. M. and Lyubomirsky, S. (2012): The challenge of staying happier:
Testing the hedonic adaptation prevention model. In: Personality and Social
Psychology Bulletin 38: 670–680.
Sheldon, K. M., Gunz, A., Nichols, C. P. and Ferguson, Y. (2010): Extrinsic value
orientation and affective forecasting: Overestimating the rewards, underestimating
the costs. In: Journal of Personality 78: 149–178.
35
Socio Economic Panel (SOEP): About SOEP. In:
http://www.diw.de/en/diw_02.c.299771.en/about_soep.html as of 05.01.2013.
Stutzer, A. and Frey, B. S. (2006): What happiness research can tell us about self-
control problems and utility misprediction. IZA Discussion Papers No. 1952, Bonn.
United Nations Development Program (UNDP) (1998): Human development report
1998. New York: Oxford University Press.
Ura, K., Alkire, S. and Zangmo, T. (2012): Case study: Bhutan - Gross national
happiness and the GNH index. In: Helliwell, J. F., Layard, R. and Sachs, J. (Eds.):
World happiness report. New York: The Earth Institute, Columbia University: 108–
158.
Varian, H. R. (2010): Intermediate microeconomics – A modern approach. New
York: W. W. Norton & Company.
Veenhoven, R. (1984): Conditions of happiness. Dissertation. Erasmus University
Rotterdam, Rotterdam.
Watson, D., Clark, L. A. and Tellegen, A. (1988): Development and validation of
brief measures of positive and negative affect: The PANAS scales. In: Journal of
Personality and Social Psychology 54: 1063–1070.
Welsch, H. (2009): Implications of happiness research for environmental economics.
In: Ecological Economics 68: 2735–2742.
Welsch, H. and Kühling, J. (2009): Using happiness data for environmental
valuation: Issues and applications. In: Journal of Economic Surveys 23: 385–406.
Welsch, H. and Kühling, J. (2010): Pro-environmental behavior and rational
consumer choice: Evidence from surveys of life satisfaction. In: Journal of Economic
Psychology 31: 405–420.

36
Wilson, T. D. and Gilbert, D. T. (2003): Affective Forecasting. In: Advances in
Experimental Social Psychology 35: 345–411.
Winter, D. D. (2004): Shopping for sustainability: Psychological solutions to
overconsumption. In: Kasser, T. and Kanner, A. D. (Eds.): Psychology and consumer
culture – The struggle for a good life in a materialistic world. Washington, D.C:
American Psychological Association: 69–87.
World Wide Fund for Nature (WWF) (2012): Living planet report 2012 –
Biodiversity, biocapacity and better choices. Gland: World Wide Fund for Nature.

37
8 Appendix
Table 1: Importance of Subjective Well-Being to College Students
(Diener, 2000)

38
Questionnaire 1: The Subjective Happiness Scale
(Lyubomirsky/Lepper, 1999)
Instructions to participants: For each of the following statements and/or questions,
please circle the point on the scale that you feel is most appropriate in describing
you.
1. In general, I consider myself:
1 2 3 4 5 6 7
not a very
a very happy
happy person
person
2. Compared to most of my peers, I consider myself:
1 2 3 4 5 6 7
less more
happy happy
3. Some people are generally very happy. They enjoy life regardless of what is
going on, getting the most out of everything. To what extent does this
characterization describe you?
1 2 3 4 5 6 7
not at a great
all deal
4. Some people are generally not very happy. Although they are not depressed,
they never seem as happy as they might be. To what extend does this
characterization describe you?
1 2 3 4 5 6 7
not at a great
all deal

39
Questionnaire 2: The Satisfaction With Life Scale
(Pavot/Diener, 1993)
Below are five statements with which you may agree or disagree. Using the 1-7 scale
below, indicate your agreement with each item by placing the appropriate number on
the line preceding that item. Please be open and honest in your responding. The 7-
point scale is as follows:
1 = strongly disagree
2 = disagree
3 = slightly disagree
4 = neither agree nor disagree
5 = slightly agree
6 = agree
7 = strongly agree
__ 1. In most ways my life is close to my ideal.
__ 2. The conditions of my life are excellent.
__ 3. I am satisfied with my life.
__ 4. So far I have gotten the important things I want in life.
__ 5. If I could live my life over, I would change almost nothing.

40
Questionnaire 3: The Positive and Negative Affect Schedule
(Watson et al., 1988)
This scale consists of a number of words that describe different feelings and
emotions. Read each item and then mark the appropriate answer in the space next to
that word. Indicate to what extent [INSERT APPROPRIATE TIME
INSTRUCTIONS HERE]. Use the following scale to record your answers.
1 2 3 4 5
very slightly a little moderately quite a bit extremely
or not at all
_______interested _______irritable
_______distressed _______alert
_______excited _______ashamed
_______upset _______inspired
_______strong _______nervous
_______guilty _______determined
_______scared _______attentive
_______hostile _______jittery
_______enthusiastic _______active
_______proud _______afraid
We have used PANAS with the following time instructions:
Moment (you feel this way right now, that is, at the present moment)
Today (you have felt this way today)
Past few days (you have felt this way during the past few days)
Week (you have felt this way during the past week)
Past few weeks (you have felt this way during the past few weeks)
Year (you have felt this way during the past year)
General (you generally feel this way, that is, how you feel on the
average)

41
Figure 5: Reported Happiness Over Time in the United States
(Layard et al., 2010)
Annually, the American Institute of Public Opinion (AIPO) asks around 1,900
people: “In general, how happy would you say you are – very happy, fairly happy, or
not too happy?” Answers are scaled from “very happy = 10” to “not too happy = 0”
and all others are equally spaced in between. The National Opinion Research Center
(NORC) surveys about 1,400 people per year, using the same happiness question as
the General Social Survey (GSS, see chapter 2). The GSS’s average sample size each
year is 1,950.

42
Figure 6: Reported Life Satisfaction Over Time in West Germany
(Layard et al., 2012; based on Layard et al., 2010)
For the question used in the Eurobarometer surveys see chapter 2. The average
sample size includes 1,000 to 2,000 people per year. The German Socio Economic
Panel (SOEP) questions around 20,000 people annually (SOEP, 05.01.2013) and
ends each survey by asking: “In conclusion we would like to ask you about your
satisfaction with your life in general. Please answer according to the following
scale: 0 means completely dissatisfied and 10 means completely satisfied. How
satisfied are you with your life, all things considered?” (Layard et al., 2010). This
item relates closely to the one used by the World Values Survey (see chapter 2).

43
Table 2: Mean Happiness Ratings by Lottery Winners and Accident Victims
(Brickman et al., 1978; excerpt of table 1)

44
Figure 7: Trends in Ecological Footprint and Biocapacity per Person
(WWF, 2012)

45
Table 3: Ownership of and Desires of Costly Consumer Goods
(Easterlin, 2003)

46
Figure 8: Mean Self-Reported Health
(Easterlin, 2003)
Self-reported health was obtained by asking: “Would you say your own health, in
general, is excellent, good, fair, or poor?” Answers were scaled from “excellent =
4” to “poor = 1” to calculate the mean scores.

47
Figure 9: Mean Happiness of Currently Married and Unmarried Females
(Easterlin, 2003)
The pattern for males is similar.
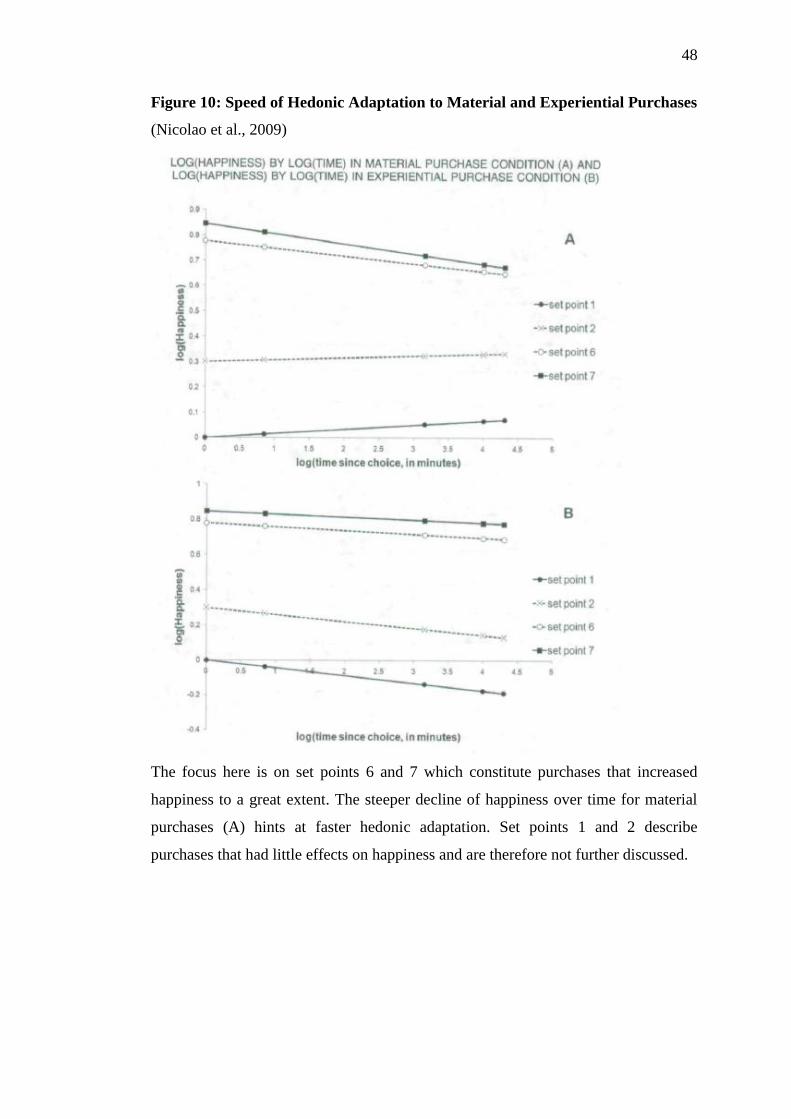
48
Figure 10: Speed of Hedonic Adaptation to Material and Experiential Purchases
(Nicolao et al., 2009)
The focus here is on set points 6 and 7 which constitute purchases that increased
happiness to a great extent. The steeper decline of happiness over time for material
purchases (A) hints at faster hedonic adaptation. Set points 1 and 2 describe
purchases that had little effects on happiness and are therefore not further discussed.
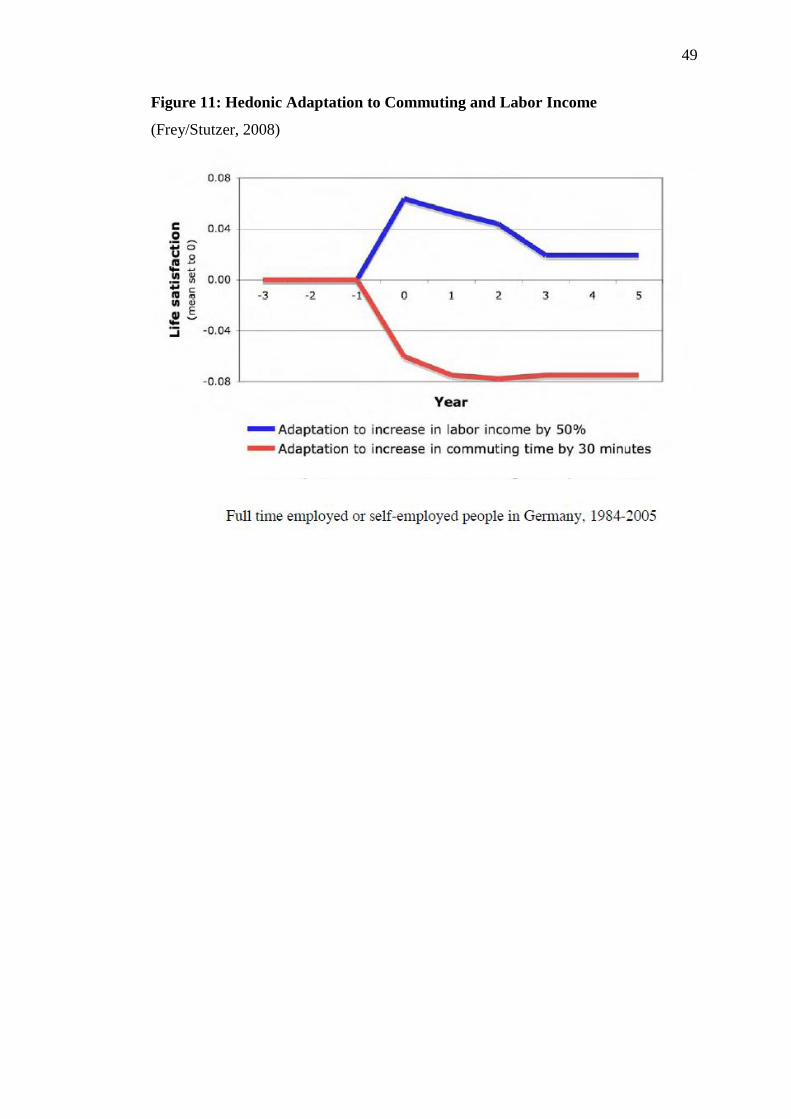
49
Figure 11: Hedonic Adaptation to Commuting and Labor Income
(Frey/Stutzer, 2008)

50
Figure 12: Forecasted and Experienced Positive Affect by Walking Route
(Nisbet/Zelenski, 2011)