
Daniel S. Hamermesheco.utexas.edu * We thank Jeannette Hommes, Ad van Iterson and Caroline Kortbeek...
40
econstor www.econstor.eu Der Open-Access-Publikationsserver der ZBW – Leibniz-Informationszentrum Wirtschaft The Open Access Publication Server of the ZBW – Leibniz Information Centre for Economics Standard-Nutzungsbedingungen: Die Dokumente auf EconStor dürfen zu eigenen wissenschaftlichen Zwecken und zum Privatgebrauch gespeichert und kopiert werden. Sie dürfen die Dokumente nicht für öffentliche oder kommerzielle Zwecke vervielfältigen, öffentlich ausstellen, öffentlich zugänglich machen, vertreiben oder anderweitig nutzen. Sofern die Verfasser die Dokumente unter Open-Content-Lizenzen (insbesondere CC-Lizenzen) zur Verfügung gestellt haben sollten, gelten abweichend von diesen Nutzungsbedingungen die in der dort genannten Lizenz gewährten Nutzungsrechte. Terms of use: Documents in EconStor may be saved and copied for your personal and scholarly purposes. You are not to copy documents for public or commercial purposes, to exhibit the documents publicly, to make them publicly available on the internet, or to distribute or otherwise use the documents in public. If the documents have been made available under an Open Content Licence (especially Creative Commons Licences), you may exercise further usage rights as specified in the indicated licence. zbw Leibniz-Informationszentrum Wirtschaft Leibniz Information Centre for Economics Feld, Jan; Salamanca, Nicolas; Hamermesh, Daniel S. Working Paper Endophilia or Exophobia: Beyond Discrimination IZA Discussion Paper, No. 7380 Provided in Cooperation with: Institute for the Study of Labor (IZA) Suggested Citation: Feld, Jan; Salamanca, Nicolas; Hamermesh, Daniel S. (2013) : Endophilia or Exophobia: Beyond Discrimination, IZA Discussion Paper, No. 7380 This Version is available at: http://hdl.handle.net/10419/80601
-
Upload
truongkhanh -
Category
Documents
-
view
216 -
download
0
Transcript of Daniel S. Hamermesheco.utexas.edu * We thank Jeannette Hommes, Ad van Iterson and Caroline Kortbeek...

econstor www.econstor.eu
Der Open-Access-Publikationsserver der ZBW – Leibniz-Informationszentrum WirtschaftThe Open Access Publication Server of the ZBW – Leibniz Information Centre for Economics
Standard-Nutzungsbedingungen:
Die Dokumente auf EconStor dürfen zu eigenen wissenschaftlichenZwecken und zum Privatgebrauch gespeichert und kopiert werden.
Sie dürfen die Dokumente nicht für öffentliche oder kommerzielleZwecke vervielfältigen, öffentlich ausstellen, öffentlich zugänglichmachen, vertreiben oder anderweitig nutzen.
Sofern die Verfasser die Dokumente unter Open-Content-Lizenzen(insbesondere CC-Lizenzen) zur Verfügung gestellt haben sollten,gelten abweichend von diesen Nutzungsbedingungen die in der dortgenannten Lizenz gewährten Nutzungsrechte.
Terms of use:
Documents in EconStor may be saved and copied for yourpersonal and scholarly purposes.
You are not to copy documents for public or commercialpurposes, to exhibit the documents publicly, to make thempublicly available on the internet, or to distribute or otherwiseuse the documents in public.
If the documents have been made available under an OpenContent Licence (especially Creative Commons Licences), youmay exercise further usage rights as specified in the indicatedlicence.
zbw Leibniz-Informationszentrum WirtschaftLeibniz Information Centre for Economics
Feld, Jan; Salamanca, Nicolas; Hamermesh, Daniel S.
Working Paper
Endophilia or Exophobia: Beyond Discrimination
IZA Discussion Paper, No. 7380
Provided in Cooperation with:Institute for the Study of Labor (IZA)
Suggested Citation: Feld, Jan; Salamanca, Nicolas; Hamermesh, Daniel S. (2013) : Endophiliaor Exophobia: Beyond Discrimination, IZA Discussion Paper, No. 7380
This Version is available at:http://hdl.handle.net/10419/80601
DI
SC
US
SI
ON
P
AP
ER
S
ER
IE
S
Forschungsinstitut zur Zukunft der ArbeitInstitute for the Study of Labor
Endophilia or Exophobia: Beyond Discrimination
IZA DP No. 7380
May 2013
Jan FeldNicolás SalamancaDaniel S. Hamermesh
Endophilia or Exophobia:
Beyond Discrimination
Jan Feld Maastricht University
Nicolás Salamanca
Maastricht University
Daniel S. Hamermesh University of Texas at Austin,
Royal Holloway University London, IZA and NBER
Discussion Paper No. 7380 May 2013
IZA
P.O. Box 7240 53072 Bonn
Germany
Phone: +49-228-3894-0 Fax: +49-228-3894-180
E-mail: [email protected]
Any opinions expressed here are those of the author(s) and not those of IZA. Research published in this series may include views on policy, but the institute itself takes no institutional policy positions. The IZA research network is committed to the IZA Guiding Principles of Research Integrity. The Institute for the Study of Labor (IZA) in Bonn is a local and virtual international research center and a place of communication between science, politics and business. IZA is an independent nonprofit organization supported by Deutsche Post Foundation. The center is associated with the University of Bonn and offers a stimulating research environment through its international network, workshops and conferences, data service, project support, research visits and doctoral program. IZA engages in (i) original and internationally competitive research in all fields of labor economics, (ii) development of policy concepts, and (iii) dissemination of research results and concepts to the interested public. IZA Discussion Papers often represent preliminary work and are circulated to encourage discussion. Citation of such a paper should account for its provisional character. A revised version may be available directly from the author.
IZA Discussion Paper No. 7380 May 2013
ABSTRACT
Endophilia or Exophobia: Beyond Discrimination* The immense literature on discrimination treats outcomes as relative: One group suffers compared to another. But does a difference arise because agents discriminate against others – are exophobic – or because they favor their own kind – are endophilic? This difference matters, as the relative importance of the types of discrimination and their inter-relation affect market outcomes. Using a field experiment in which graders at one university were randomly assigned students’ exams that did or did not contain the students’ names, on average we find favoritism but no discrimination by nationality, and neither favoritism nor discrimination by gender, findings that are robust to a wide variety of potential concerns. We observe heterogeneity in both discrimination and favoritism by nationality and by gender in the distributions of graders’ preferences. We show that a changing correlation between endophilia and exophobia can generate perverse predictions for observed market discrimination.
NON-TECHNICAL SUMMARY We speak of discrimination by a majority against a minority – by race, gender, ethnicity, religion, appearance, sexual preference and other distinctions; yet this is all relative to outcomes experienced by the majority. Whether there is discrimination against a group by those who “discriminate” or favoritism by them toward people like themselves can affect the relative wage and other outcomes that we observe in labor markets; and favoring preferences are distinguishable from discriminatory attitudes in many social surveys. In this study we create a field experiment using examination results in a Dutch university to examine the extent of endophilia – favoritism toward one’s own group, and exophobia – discrimination against other groups. We do this by having some exam papers written without student names, others with. We find that graders exhibit substantial endophilia by nationality, but no exophobia by nationality. There is neither endophilia nor exophobia by gender. Graders exhibit idiosyncratic extents of favoritism and discrimination, but we do find that more experienced graders and those who are worse teachers favor people like themselves the most. The methodology and results of this experiment suggest that the crucial distinction between favoritism and discrimination is operational – these two concepts are not opposite sides of the same coin; and their relative extents can be measured. JEL Classification: J71, I24, B40 Keywords: favoritism, discrimination, field experiment, wage differentials,
economics of education Corresponding author: Daniel S. Hamermesh Department of Economics University of Texas Austin, TX 78712-1173 USA E-mail: [email protected]
* We thank Jeannette Hommes, Ad van Iterson and Caroline Kortbeek for their assistance in making this experiment possible. George Borjas, Hannah Ebin, Matthew Embrey, Ilyana Kuziemko, Christopher Parsons, Joseph Price, Stephen Trejo, participants in seminars at a number of universities and institutes, and especially Leigh Linden provided very helpful comments. The Board of Examiners of the School of Business and Economics at Maastricht University formally approved this project.

1
Although we could not perceive our own in-groups excepting as they contrast to out-groups, still the in-groups are psychologically primary. Hostility toward out-groups helps strengthen our sense of belonging, but it is not required. [Allport, 1954]
I. Introduction
Economists have studied labor-market discrimination at least since Becker (1957). Differences in
labor-market and other outcomes by race, gender, ethnicity, religion, weight, height, appearance and other
characteristics have been examined in immense detail, over time and in many economies. The focus has,
however, been nearly exclusively on measuring differences in outcomes between groups, under the
assumption that the “majority” group’s outcome is the norm while the “minority” group is discriminated
against. But since the only concept that is measured is a difference, it could just as easily be that the
majority group is favored while the minority group’s outcome is the norm.
The possibility that we are measuring the extent of favoritism rather than discrimination has been
pointed out by Goldberg (1982) and by Cain (1986) in his survey; but beyond that the issue appears to
have been completely neglected, including by the more recent Handbook surveys of the literature on
discrimination (Altonji and Blank, 1999; Fryer, 2011). Once we recognize that favoritism need not be the
obverse of discrimination, the importance of studying preferences for favoritism/discrimination increases.
Although the distribution of discriminating agents’ tastes underlay Becker’s theory, in most empirical
research the demand side—the behavior of discriminatory agents—has not been studied explicitly. Only
recently has there been even a small upwelling of interest in examining their behavior and its impacts on
outcomes, typically considering how agents’ behavior toward those who match them along some
dimension differs from their behavior toward those who do not match them.1 Even most of these studies,
however, have looked only at averages, and none has combined the analysis of the distributions of
preferences.
1See Price and Wolfers (2010) and Parsons et al (2011) for evidence from professional sports; Dee (2005), Lavy (2008) and Hinnerich et al (2011) for examinations of education; Cardoso and Winter-Ebmer (2010) and Giuliano et al (2011) on wages and hiring; Baguës and Esteve-Volart (2010) on parliamentary elections; and Dillingham et al (1994), Donald and Hamermesh (2006) and Abrevaya and Hamermesh (2012) for studies of economists’ behavior.
2
To distinguish clearly the who and the how in discrimination, we introduce four terms:
Endophilia, endophobia, exophilia, and exophobia. The prefix endo refers to preferences towards people
like oneself, the prefix exo to people unlike oneself. The suffix philia refers to favoritism and phobia to
discrimination. Hence, endophilia denotes preferences for member of one’s own group, while exophobia
denotes preferences against members of other groups. One can also imagine, however, that some agents
prefer members of other groups—are exophilic, while other agents are endophobic—discriminate against
people like themselves.
Here we discuss the results of a field experiment that allows us to examine whether agents are
endophilic and/or exophobic, and to characterize the distributions of the tastes of the
discriminating/favoring agents. We do this by randomly revealing or concealing names on students’ final
exams, and thus randomly allowing or not allowing graders to infer the gender and nationality of the
students. The key to separating endophilia from exophobia is that, instead of only having two groups with
visible characteristics, we create two additional groups that have the same characteristics, except that they
are anonymous and are arguably neither discriminated against nor favored by any of the agents.2 These
groups provide two clear baselines against which we can measure endophilia/exophobia by the agents on
the demand side. Hence, we identify endophilia (exophobia) as the treatment of members of one’s own
group (of another group) with visible names compared to the treatment of members of one’s own group
(of another group) with concealed names. We focus specifically on endophilia/exophobia by nationality
and gender, but this method could be applied to any of the outcomes that have been studied in this
immense literature.
2The only experiments like ours were conducted in laboratories (Fershtman et al, 2005; Ahmed, 2007). The latter had artificially-designated in- and out-groups; the former dealt with nationalities but was based on statements by students on how they would behave in a trust game. While laboratory evidence is useful, as discussed by Levitt and List (2007) it suffers from a number of difficulties that can be addressed in field experiments.
3
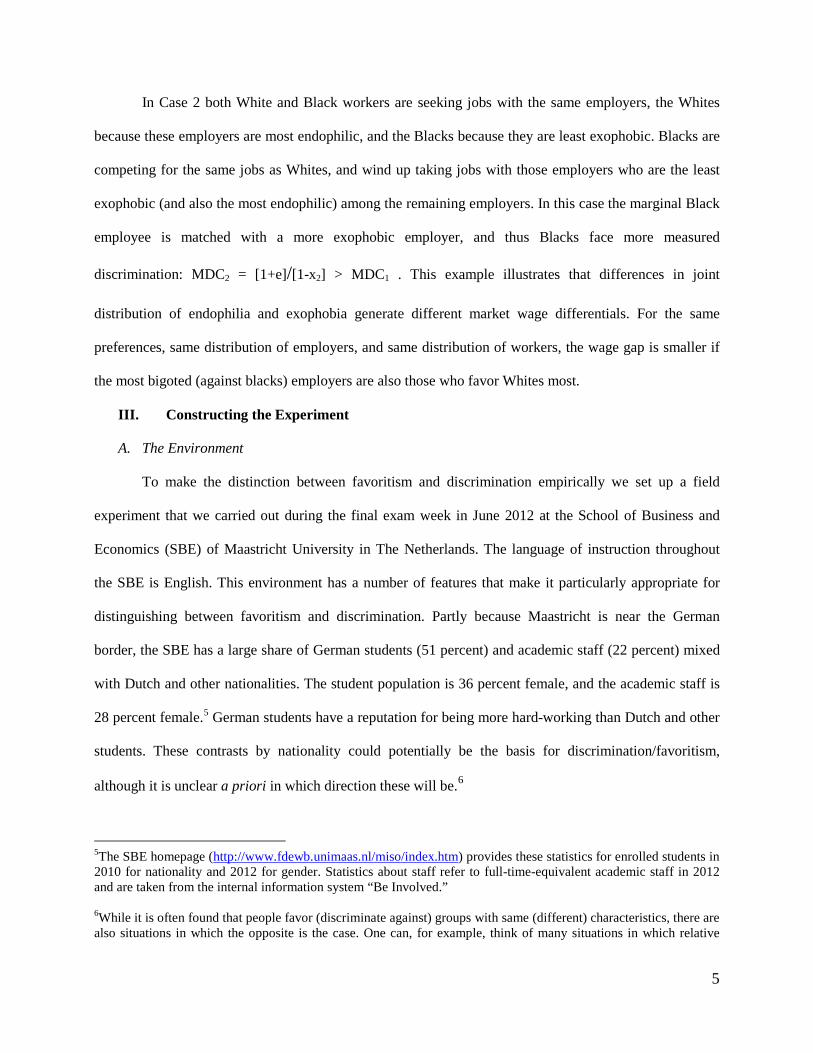
II. Empirical and Theoretical Motivation
The importance of the distinction between favoritism and discrimination can be seen in a variety
of ways. First, discrimination and favoritism can lead to different distributions of outcomes and to
differences in overall welfare. Consider, for example, a supervisor who distributes a bonus payment of
$300 among one Black, one White and one Hispanic worker. The norm is to give $100 to each worker, but
a favoring (discriminating) supervisor will give $10 more (less) to a certain worker. A supervisor who
favors the White worker will give her $10 extra, leaving $95 each for the Black and Hispanic workers (B
= $95, W = $110, H = $95). A supervisor who discriminates against the Black worker gives her $10 less,
leaving $105 each for the White and Hispanic workers (B = $90, W = $105, H = $105). In both cases the
difference in outcomes between the White and the Black worker is $15, but White-Hispanic relative
wages differ under each alternative. The importance of this difference is strengthened if we consider
convexity in utility and the likely differences in the initial situations of the workers. Under these
conditions it is straightforward to show that, for the same gap in outcomes, the sum of utility losses is
greater when the gap is generated by discrimination than when the gap is generated by favoritism.
Second, the concepts of endophilia and exophobia can be measured, albeit imperfectly, in the real-
world, and these measures show that they are not necessarily opposite. Beginning in 1996, and biennially
except in 2002, the U.S. General Social Survey has asked questions, “In general, how close do you feel to
Whites [Blacks]?” with answers on a nine-point scale ranging from 9 = very close to 1 = not close at all.
Table 1 describes these data, separating answers by Whites and Blacks, and pooling 1996-2000 as an early
period, 2004-2006 as a later period. (We exclude the 2008 and 2010 data because the campaign and
election of President Obama may have altered expressed preferences.) Several things stand out: 1)
Unsurprisingly, expressed closeness to one’s own group exceeds that to the other group; 2) While Whites’
closeness to other Whites changed little over this period, there was a very large increase in their expressed
closeness to Blacks; 3) There are only small changes in Blacks’ expressed closeness to either Whites or
Blacks; and 4) The correlation between expressed closeness to one’s own and the other is positive and
increases (significantly) between the two sub-periods. Implicitly, those who favor members of their own

4
group more disfavor members of the other group less, or, in our terminology, there is a negative relation
between endophilia and exophobia. Endophilia and exophobia are distinct concepts, not opposite sides of
the same coin, and are notions that correspond mutatis mutandis to items included in social surveys.
The distinction between favoritism and discrimination has important theoretical implications. As
Goldberg (1982) showed, if favoritism toward one’s own group drives observed, apparently
discriminatory differentials, these differentials can persist in a competitive market. Goldberg reached this
conclusion by assuming favoritism preferences instead of the discriminatory preferences of Becker (1957).
If, however, discrimination and favoritism are allowed to co-exist in this model, they will generate
different predictions about measured intergroup wage differentials depending on the relationship between
them. As an illustration, consider two polar cases: Case 1, the most endophilic employers are also the most
exophobic—the correlation between tastes for members of one’s own group and distastes for the other
group is ρ = +1; and Case 2, the most endophilic employers are also the least exophobic—the correlation
between tastes for members of one’s own group and distastes for the other group is ρ = -1.
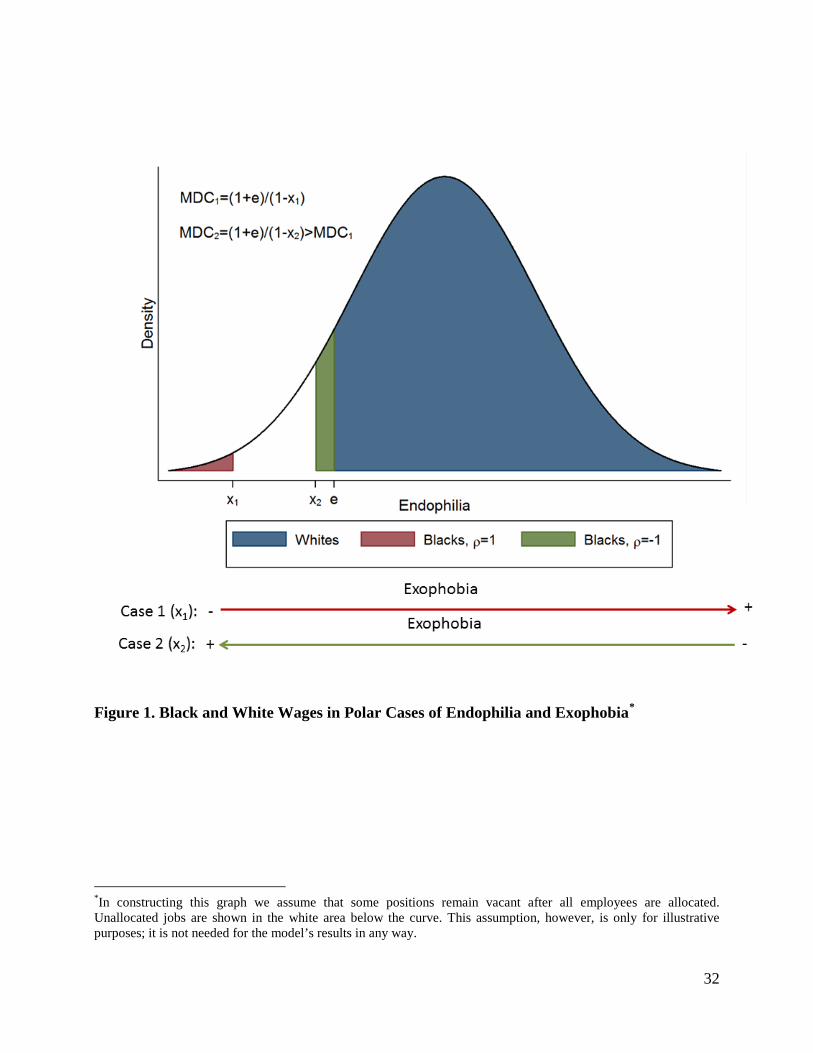
Assume, as Becker does in his model, that all employers are White, and assume too that the
distribution of endophilia is 𝑓(𝑒) and of exophobia is 𝑓(𝑥). Also assume a fixed labor force, some
fractions of which are White and Black. Further, assume for simplicity that White workers sort first into
firms.3 In Case 1 the marginal White worker will be employed at the least endophilic among those
employers who are sufficient in number to hire the White workers. Black workers will not seek jobs with
these employers, since they are also the most exophobic. Instead, they will fill up jobs at the least
exophobic employers (who happen also to be the least endophilic).4 The result, shown in Figure 1, is that
the observed market discrimination coefficient, the ratio of white to black wages, is MDC1 = [1+e]/[1-x1],
where we have indexed the white wage in the absence of favoritism or discrimination to equal 1.
3This assumption simplifies our argument but is not needed, since the core of the argument relies on the competition for positions between Whites and Blacks. 4See Charles and Guryan (2008) for a discussion of the empirical importance of the marginal discriminator.
5
In Case 2 both White and Black workers are seeking jobs with the same employers, the Whites
because these employers are most endophilic, and the Blacks because they are least exophobic. Blacks are
competing for the same jobs as Whites, and wind up taking jobs with those employers who are the least
exophobic (and also the most endophilic) among the remaining employers. In this case the marginal Black
employee is matched with a more exophobic employer, and thus Blacks face more measured
discrimination: MDC2 = [1+e]/[1-x2] > MDC1 . This example illustrates that differences in joint
distribution of endophilia and exophobia generate different market wage differentials. For the same
preferences, same distribution of employers, and same distribution of workers, the wage gap is smaller if
the most bigoted (against blacks) employers are also those who favor Whites most.
III. Constructing the Experiment
A. The Environment
To make the distinction between favoritism and discrimination empirically we set up a field
experiment that we carried out during the final exam week in June 2012 at the School of Business and
Economics (SBE) of Maastricht University in The Netherlands. The language of instruction throughout
the SBE is English. This environment has a number of features that make it particularly appropriate for
distinguishing between favoritism and discrimination. Partly because Maastricht is near the German
border, the SBE has a large share of German students (51 percent) and academic staff (22 percent) mixed
with Dutch and other nationalities. The student population is 36 percent female, and the academic staff is
28 percent female.5 German students have a reputation for being more hard-working than Dutch and other
students. These contrasts by nationality could potentially be the basis for discrimination/favoritism,
although it is unclear a priori in which direction these will be.6
5The SBE homepage (http://www.fdewb.unimaas.nl/miso/index.htm) provides these statistics for enrolled students in 2010 for nationality and 2012 for gender. Statistics about staff refer to full-time-equivalent academic staff in 2012 and are taken from the internal information system “Be Involved.”
6While it is often found that people favor (discriminate against) groups with same (different) characteristics, there are also situations in which the opposite is the case. One can, for example, think of many situations in which relative

6
The grading of final exams, which we examine here, is a good setting for distinguishing the
effects of tastes for discrimination from those of statistical discrimination, because graders do not gain
anything from favoring or disfavoring specific groups. Also, until the teaching period that we examine all
students were required to write their names on their exams, enabling the graders to identify the students’
gender and nationality.7 Finally, and most important, this experiment has real-world consequences: The
grades are important to students; also, much of the graders’ jobs revolves around their role in scoring
exams.
In the SBE written exams are given in ten sessions spread over a week, with many courses giving
their exams simultaneously. Students in all the courses assigned to each session take their exams together
in a large conference hall filled with desks that are arranged in blocks of 5 columns and 10 rows.8 To
prevent cheating each student’s desk is predetermined by the Exams Office (the organization responsible
for examination procedures). The desk assignment is based on student ID numbers, first by sorting them
from lowest to highest within each block, and then filling in sequentially within each column from left to
right.9 Figure 2 illustrates the arrangement of desks in each block.
outcomes suggest that males are exophilic or endophobic (e.g., Donald and Hamermesh, 2006, although that study cannot distinguish between these two types of behavior). 7The grader can infer the nationality and gender of the students when she sees the family name, even if she does not know the student, because Dutch and German names are quite distinct. To test this we asked 9 staff (5 German and 4 Dutch, of whom 5 were female) to guess the nationality and gender of 50 student names from our sample. We selected the student names block-randomly to reflect the nationality mixture in our sample (19 German, 17 Dutch and 14 other nationalities, of whom 16 were female). The staff correctly identified the German names in 64 percent, the Dutch names in 65 percent and the gender in 90 percent of the cases. 8Exams in courses with more than 50 students are written in the same session in multiple blocks. Exams in courses with fewer than 50 students are either kept in one block or are combined with the exams in other courses. There are a few blocks that have as many as 12 rows. 9Student IDs are assigned in ascending order based on the moment a prospective student contacts Studielink (the Dutch centralized system for university application; https://app.studielink.nl/front-office/). This means that earlier cohorts have lower-number IDs, and later cohorts and exchange students have higher-number IDs.

7
B. The Experiment and Data Collection
The students in each session arrive at the exam hall and locate their assigned block based on the
course they are taking. Within the block they then locate their assigned desk, which is marked with their
student ID number. Once the exam session starts students have three hours to complete their exams.
During that time one invigilator (not the same person as the exam grader) supervises each block. We
asked the invigilators to place yellow sheets on all desks in the first three rows of each block (see Figure
2), thus ensuring that the recipients were mixed by ID number, and thus more or less random by seniority
in the University. The sheets stated that the students on whose desk one was placed should not write their
name but only their ID number on the exam sheets.10 Because of the predetermined arrangement of desks
this meant that a random sample of students within each course—the “blind” group—was asked not to
write their names, so that the grader would only observe their ID numbers when grading. For the rest of
the students—the “visible” group—graders could observe both names and IDs, as in previous teaching
periods.
We collected additional information from several other sources. The Exams Office provided us
with the nationality and gender of the students, grades in previous courses, and the desk arrangement
during the exam. From the seating arrangement we could infer which students were asked not to write
their names (yellow sheets, rows 1-3) and which were allowed to do so. To check students’ compliance
with the experiment’s instructions, we manually went through all the exams and checked which students
wrote down their names and which students did not.11
At the SBE it is common practice to split the grading burden among various graders by letting
each one handle all the answers to a particular set of questions on the same exam. The course coordinators 10We blocked entire rows instead of scattered seats within each for simplicity. We treated rows instead of columns in order to capture students with a variety of high and low ID numbers within each course. The Exams Office informed the course coordinators—who were in charge of organizing the grading of the exams—before the examination period that a new examination procedure was being tested, so that some exams might only have ID numbers. They were asked to grade those exams as they usually would. 11This was done immediately after the exam, before the course coordinators received the exams to arrange the grading.
8
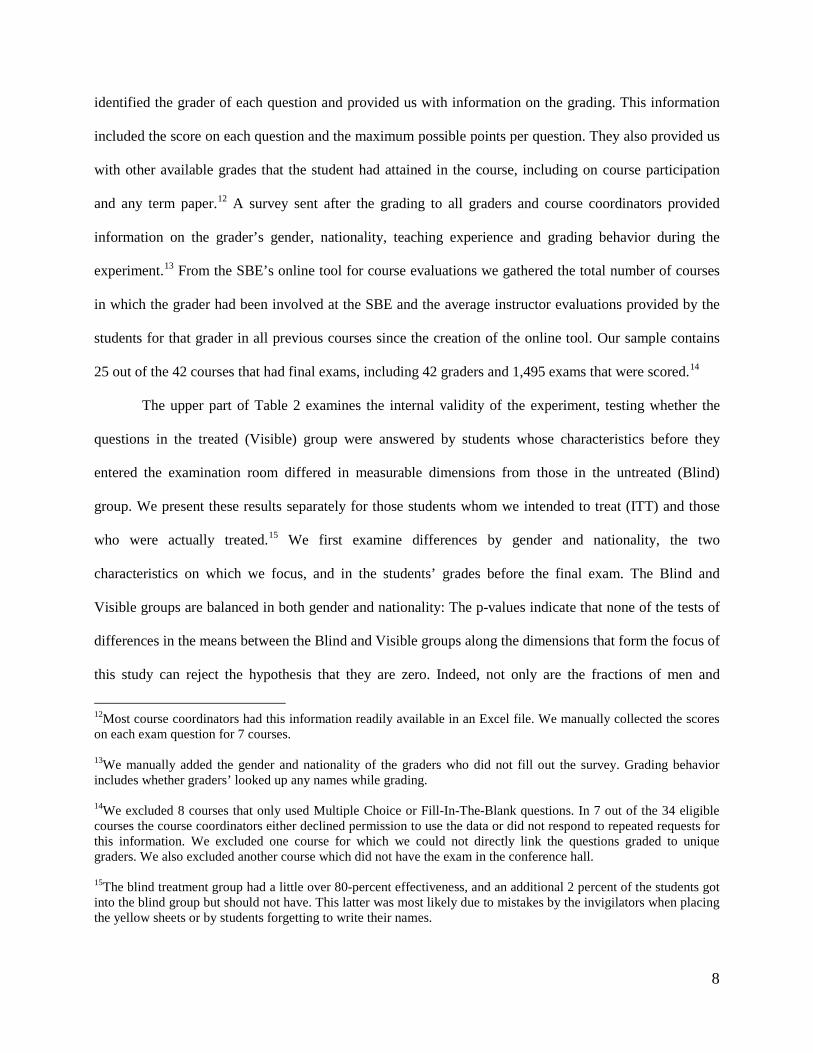
identified the grader of each question and provided us with information on the grading. This information
included the score on each question and the maximum possible points per question. They also provided us
with other available grades that the student had attained in the course, including on course participation
and any term paper.12 A survey sent after the grading to all graders and course coordinators provided
information on the grader’s gender, nationality, teaching experience and grading behavior during the
experiment.13 From the SBE’s online tool for course evaluations we gathered the total number of courses
in which the grader had been involved at the SBE and the average instructor evaluations provided by the
students for that grader in all previous courses since the creation of the online tool. Our sample contains
25 out of the 42 courses that had final exams, including 42 graders and 1,495 exams that were scored.14
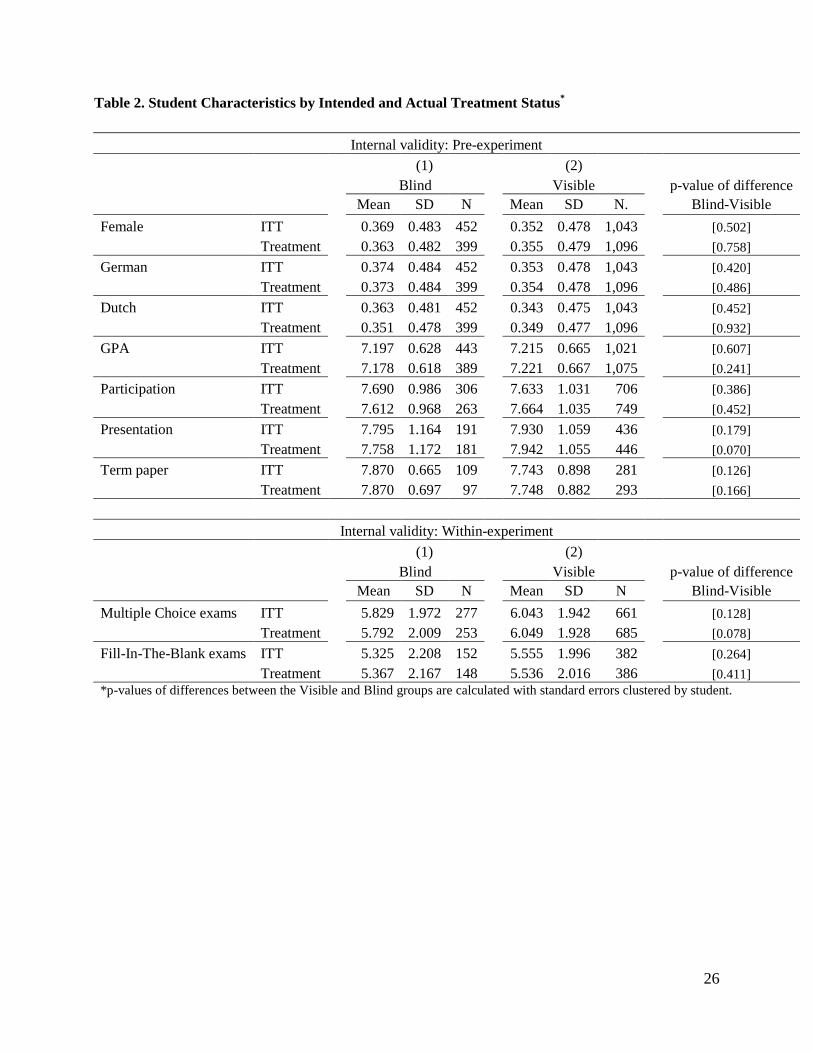
The upper part of Table 2 examines the internal validity of the experiment, testing whether the
questions in the treated (Visible) group were answered by students whose characteristics before they
entered the examination room differed in measurable dimensions from those in the untreated (Blind)
group. We present these results separately for those students whom we intended to treat (ITT) and those
who were actually treated.15 We first examine differences by gender and nationality, the two
characteristics on which we focus, and in the students’ grades before the final exam. The Blind and
Visible groups are balanced in both gender and nationality: The p-values indicate that none of the tests of
differences in the means between the Blind and Visible groups along the dimensions that form the focus of
this study can reject the hypothesis that they are zero. Indeed, not only are the fractions of men and
12Most course coordinators had this information readily available in an Excel file. We manually collected the scores on each exam question for 7 courses. 13We manually added the gender and nationality of the graders who did not fill out the survey. Grading behavior includes whether graders’ looked up any names while grading. 14We excluded 8 courses that only used Multiple Choice or Fill-In-The-Blank questions. In 7 out of the 34 eligible courses the course coordinators either declined permission to use the data or did not respond to repeated requests for this information. We excluded one course for which we could not directly link the questions graded to unique graders. We also excluded another course which did not have the exam in the conference hall. 15The blind treatment group had a little over 80-percent effectiveness, and an additional 2 percent of the students got into the blind group but should not have. This latter was most likely due to mistakes by the invigilators when placing the yellow sheets or by students forgetting to write their names.
9
women, Germans and Dutch, insignificantly different from each other; the absolute differences are never
greater than two in the second decimal place between the Blind and Visible groups.
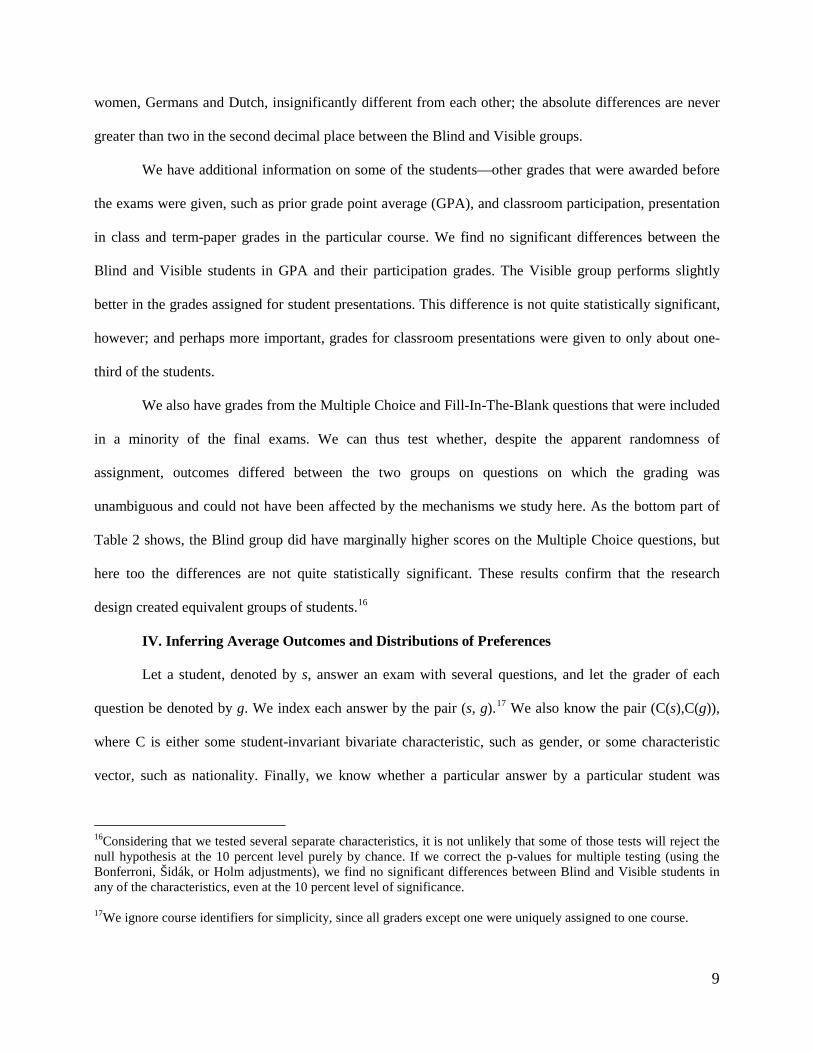
We have additional information on some of the students—other grades that were awarded before
the exams were given, such as prior grade point average (GPA), and classroom participation, presentation
in class and term-paper grades in the particular course. We find no significant differences between the
Blind and Visible students in GPA and their participation grades. The Visible group performs slightly
better in the grades assigned for student presentations. This difference is not quite statistically significant,
however; and perhaps more important, grades for classroom presentations were given to only about one-
third of the students.
We also have grades from the Multiple Choice and Fill-In-The-Blank questions that were included
in a minority of the final exams. We can thus test whether, despite the apparent randomness of
assignment, outcomes differed between the two groups on questions on which the grading was
unambiguous and could not have been affected by the mechanisms we study here. As the bottom part of
Table 2 shows, the Blind group did have marginally higher scores on the Multiple Choice questions, but
here too the differences are not quite statistically significant. These results confirm that the research
design created equivalent groups of students.16
IV. Inferring Average Outcomes and Distributions of Preferences
Let a student, denoted by s, answer an exam with several questions, and let the grader of each
question be denoted by g. We index each answer by the pair (s, g).17 We also know the pair (C(s),C(g)),
where C is either some student-invariant bivariate characteristic, such as gender, or some characteristic
vector, such as nationality. Finally, we know whether a particular answer by a particular student was
16Considering that we tested several separate characteristics, it is not unlikely that some of those tests will reject the null hypothesis at the 10 percent level purely by chance. If we correct the p-values for multiple testing (using the Bonferroni, Šidák, or Holm adjustments), we find no significant differences between Blind and Visible students in any of the characteristics, even at the 10 percent level of significance. 17We ignore course identifiers for simplicity, since all graders except one were uniquely assigned to one course.

10
graded blind or visible, so that each pair (C(s),C(g)) can be expanded to the triplet (C(s),C(g),v), where
v=1 if the grading is visible and 0 if not.18
Consider the score function S(C(s),C(g),v) for each exam question, where we are especially interested
in examining how S varies between cases when s and g match (i.e. share a common characteristic) and
when they do not, and how that variation is affected by v. Define the following indicators:
(1a) I1{(C(s),C(g), v)} = 1, if C(s)=C(g) and v=1, 0 if not;
(1b) I2{(C(s),C(g),v)} = 1, if C(s)=C(g) and v=0, 0 if not;
(1c) I3{(C(s),C(g),v)} = 1, if C(s)≠C(g) and v=1, 0 if not;
and
(1d) I4{(C(s),C(g),v)} = 1, if C(s) ≠C(g) and v=0, 0 if not.
The average score of all students is:
(2) T = θ1S*(I1) + θ2S*(I2) + θ3S*(I3) + [1- θ1- θ2 - θ3]S*(I4),
where the weights θi are the shares of answers graded under each regime, and the (*) denotes an average
over those answers.19 Because we created the neutral categories with blind grading, we can estimate the
average treatment effect on students for whom C(s) = C(g) (i.e., grader and student “match” on
characteristic C) as:
(3a) MM = [S*(I1) - S*(I2)];
and the treatment of students for whom C(i) ≠ C(g) (who do not “match” on C) as:
(3b) MN = [S*(I4) - S*(I3)].
If graders are endophilic and exophobic, MM, MN > 0. In Section V we present estimates of each of the
effects discussed here.
18Presumably all particular (s, g) combinations are either blind or visible (although we investigate the extent of blindness in the blind grading). 19While the same average would apply for a n-fold characteristic if we focus only on whether or not C(s)=C(g), we could analogously and generally calculate n2 average treatment effects, one for each of the n aspects of the characteristic compared to itself and each other aspect.
11
From Equation (2) we can also recover the average “total” effect of the characteristic C(s) for a
particular value, C(s) = C’. This is particularly important if we want to address the question of whether
disclosing certain information (such as gender or nationality) affects an outcome, given a distribution of
preferences and graders. Consider a variant of (2):
(4) TC = η1S*(I1|C(s)=C’) + η2S*(I2|C(s)=C’) + η3S*(I3|C(s)=C’) + [1- η1- η2 - η3]S*(I4|C(s)=C’),
where the weights η represent the shares of answers graded under each regime for all students with
characteristic C(s) = C’. The total treatment effect of a particular characteristic C’ being observable is the
weighted average of the treatments when C(g) = C’ and when C(g) ≠ C’. Thus:
(5) MC’ = (η1 + η2)[S*(I1|C(g)=C’) - S*(I2|C(g)=C’)] + (1- η1 - η2)[S*(I4|C(g)=C’) - S*(I3|C(g)=C’)].
Equation (5) shows that the average treatment effect of a characteristic will depend on two factors:
1) The degree of endophilia and exophobia (the two bracketed expressions in (5)); and 2) The share of
questions that are graded by graders with matching characteristics (η1 + η2) versus non-matching
characteristics (1- η1 - η2).
We can also observe the behavior of individual graders toward the student groups as defined by
C(s). Each grader scores answers written by many different students, some with characteristics that match
hers, others with characteristics that do not match, some of whom are Blind, others Visible. Then for a
grader g we can calculate her average treatment of students, Tg, in a manner analogous to the average
effect in (2) and obtain a distribution over all graders. More interesting for our purposes, we can estimate
each grader’s preferences for students who do and do not match their characteristics as:
(6a) mMg = S*g(I1)-S*g(I2) ;
and
(6b) mNg = S*g(I4)-S*g(I3) ,
where S*g(Ij), j=1,2,3,4, is the average over all students whose exams are scored by grader g under each
regime Ij. Using these grader-specific average treatments, we can then obtain the distributions of
endophilia and exophobia as f(mM) and h(mN), providing specific analogues to the distributions discussed
in Section II and presented in Figure 1. Thus, in addition to being able to distinguish the average extent of
12
favoritism toward one’s own group from the average extent of discrimination against other group(s), the
data allow us to obtain complete distributions of agents’ implicit preferences.
V. Empirical Strategy and Basic Results
To estimate the impacts of nationality and gender matches on the points that graders assigned to
students’ answers, and to infer the differences discussed above, we estimate the regression:
(7) S = β1MATCH*VISIBLE + β2MATCH*BLIND + β3NON-MATCH*VISIBLE
+ β4NON-MATCH*BLIND + γ’X + ε,
where here S is a unit normal deviate calculated for each exam question, and the other variable names are
self-explanatory.20 The matrix X includes nationality or gender indicators for both students and graders, ε
is a zero-mean error term and the regression is estimated without a constant. From this equation the
estimates of endophilia and exophobia are:
(8a) MM = S*(I1) - S*(I2) = β1 – β2
and:
(8b) MN = S*(I4) - S*(I3) = β4 – β3
Thus the estimates of (7) provide direct analogs to the concepts we seek to measure. Note that these
calculations mean that endophilia (exophobia) is indicated by a positive MM (MN).
One special benefit that we obtain from our setting is that we can be sure that the implied
preferences on matching are driven by taste-based discrimination and not by other common confounding
factors like unobserved heterogeneity. In our experimental setting we are comparing arguably identical
groups whose only difference—because the treatment was random—is that the graders observed the
names of some but not of other students. The experiment allows us explicitly to compare Visible to Blind
German students. This means that anything specifically German, such as writing style in English or
particular calligraphic patterns, washes out in this comparison. This framework also makes it easy to
20The distribution of the standardized question scores is roughly normal and slightly negatively skewed, but it is the same for all four groups defined by VISIBLE, BLIND, MATCH, and NON-MATCH.
13
expand Equation (7) to include interactions with some of the graders’ measurable characteristics and thus
to examine how MM and MN vary with them. We deal with these extensions in Section VI.
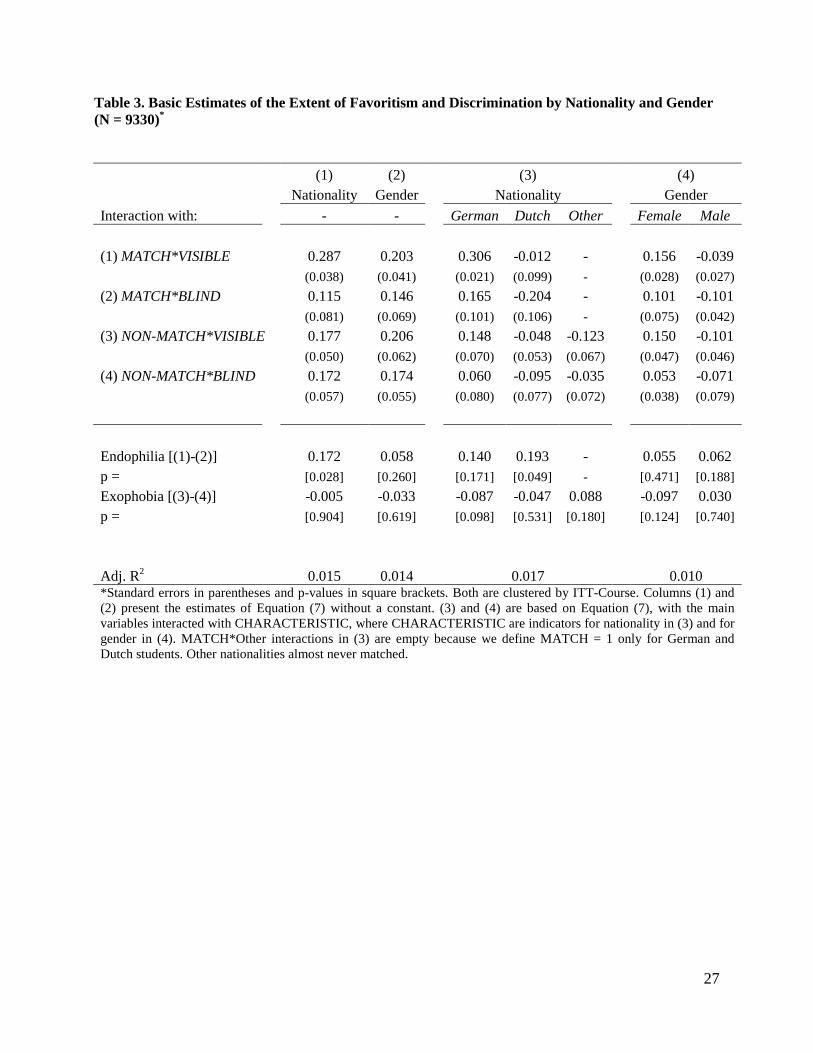
The first two columns of Table 3 present the estimated β and their standard errors for the basic
equations describing matches/non-matches along the criteria of nationality and gender. Since the
experimental design randomized by blocks of students within each course, we cluster the standard errors
at the Intention-To-Treat and course (ITT-course) level, allowing for two clusters per course. We focus
throughout on the estimates of MM and MN and their statistical significance.
It is clear that there is substantial endophilia by nationality in the grading. A student who matches
the grader’s nationality receives a score that is 0.17 standard deviations higher when her name is visible
than when it is not. This addition to a matched student’s grade is statistically significant at conventional
levels. This effect is also economically important: Given that all the scores have been unit-normalized, it
is equivalent to moving from the median score to the 57th percentile of the distribution of scores. The size
is similar to that of the effect of large differences in teacher quality on students’ test scores that was found
by Rivkin et al (2005). While favoritism by nationality exists in grading, there is no apparent exophobia
by nationality: The estimated impact of being visible when not matching by nationality is small and
positive.
The results of estimating the regression examining gender matching are shown in Column (2) of
Table 3. Although the point estimate suggests the existence of endophilia, we cannot reject the hypothesis
that it is zero.21 For non-matches there is exophilia, but here too the impact is statistically insignificant and
also minute. On average grading seems gender-neutral in all dimensions.22
21The small effects for gender could be a result of the graders being able to identify students’ gender by the students’ handwriting. We tested this by asking two raters (one of whom is an author but was not a grader) to guess the gender on the basis of the handwriting in a subsample of the actual exams. The gender guess was correct in 65 percent of the cases. This exceeds the 50-percent that could be obtained by throwing darts (although it equals what one would find using the student population average by gender). It may imply a small downward bias in these estimates. 22The results are also essentially the same when we include additional controls for seat number (see Figure 1) and the student’s prior GPA.
14
Going behind the information in Columns (1) and (2), we can ask whether, for examples,
endophilia by nationality is the same for Dutch and German graders, and whether the absence of
endophilia or exophobia exists for both male and female graders. We do this by expanding Equation (7) to
include interactions of student nationality or gender with MATCH*VISIBLE, MATCH*BLIND, NON-
MATCH*VISIBLE, and NON-MATCH*BLIND. Columns (3) of Table 3 show the estimates of this
expanded specification by nationality. A comparison of the results suggests that endophilia by nationality
arises more from the behavior of Dutch than of German graders, although the difference between the two
point estimates is not statistically significant.
Columns (4) of Table 3 show estimates of expanding Equation (7) by gender. The results look
very much like those in Column (2): Neither male nor female graders exhibit significant endophilia or
exophobia, and for both men and women the absolute impacts are tiny. Again, there is no sign of either
statistically significant or important differences in behavior depending on the match or non-match of the
grader’s and student’s gender.
VI. Robustness and Extensions
A. Treatment Failures
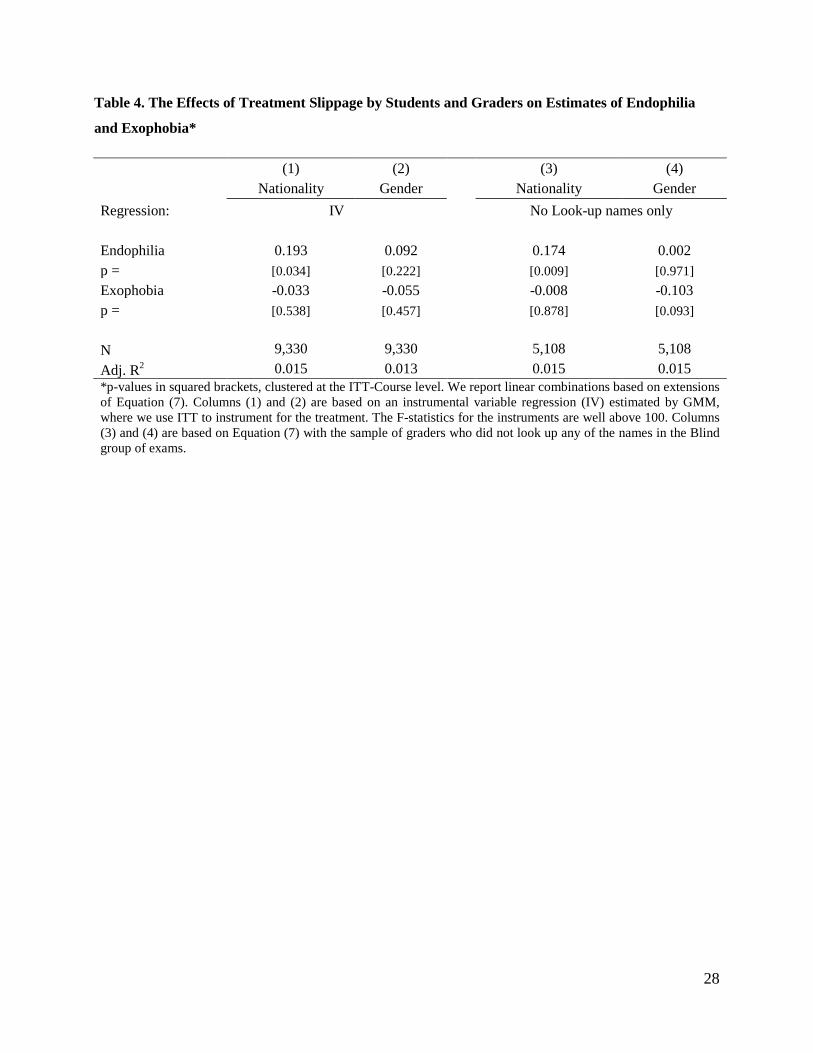
In interpreting these main results it is important to note that there are two potential sources of
slippage in our treatment: Some students did not comply with the experimental instructions and wrote
their name; and some graders may have looked up at least some of the students’ names.23 To account for
the first source of slippage we re-estimated the models described in the first two columns of Table 3 using
intention to treat (ITT) as an instrument for VISIBLE. As Table 4 shows, the results are qualitatively
identical to the ones in Table 3.
To account for the second source of slippage—that the grader may have been able to identify the
characteristic of the Blind group—in the post-grading survey we asked graders whether they looked up
23Evidence on the magnitude of the first type of slippage can be seen in Table 2 in the differences between ITT and Treatment.

15
any names on the exams that only contained ID numbers. Six of the thirty-three graders who responded to
the survey acknowledged having done this. When we re-estimated (7) including only those graders who
did not look up names, the estimated endophilia by nationality is the same, but even more significant
statistically than for the entire sample. There is no significant exophobia/philia by gender among those
graders who did not look up names. The results of both slippages suggest that, if anything, our results
understate the true extent of favoritism by nationality.
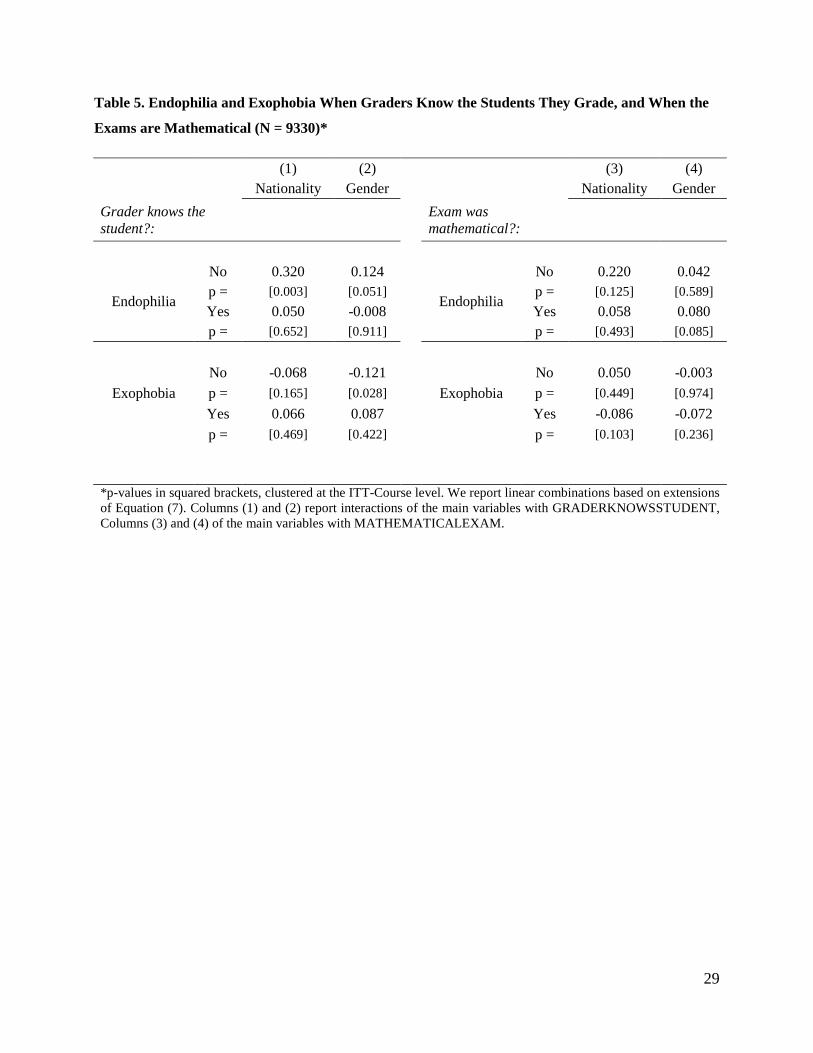
B. Distinguishing by Prior Grader-Student Contact and Exam Type
The graders and exams differ along several dimensions on which we have information and which
might affect their ability or interest in favoring/discriminating for or against students. We first look at
whether the graders knew the students they graded, and thus whether endophilia/exophobia is present
towards anonymous and familiar students alike. We have no specific hypothesis on this possibility. On the
one hand, it could be that prejudices are overridden by personal experience with the students. If so,
discriminatory preferences should be stronger toward unknown students. On the other hand, it might not
be the characteristic per se that the graders pay attention to, but something that graders only get to observe
on students they interact with and who match their characteristics. In this case discriminatory preferences
should be stronger toward and against students whom the grader knows.
We construct an indicator of whether the grader may know a student based on whether the grader
also taught him or her. Most of the teaching at the SBE is done in small groups of 10 to 15 students for
about 10 sessions in each 7-week block, so teachers have a fair chance to get to know their students. Some
graders taught none of the students they graded, others taught all of the students they graded. By this
measure the median grader knew 47 percent of the students graded (although obviously in most cases the
grader could not identify individual students in the Blind group).
The first two columns of Table 5 present re-estimates of Equation (7), expanded to include
interactions of the Know indicator with the four Match/Visible variables. The results show that endophilia
by nationality is only present when graders did not know the students. This effect is twice as large as the
mean effect in the baseline model. There is no evidence of exophobia by nationality regardless of whether
16
the grader knew the student or not. There is some, marginally significant evidence of endophilia and
exophilia by gender, but again only when the grader did not know the student.
The exams at the SBE differ in the extent to which they have mathematical questions. Answers on
the more mathematical exams are arguably less ambiguous, so that favoritism/discrimination on them
might be more difficult. To separate the more from the less mathematical exams we asked three raters
(from the SBE’s pool of potential graders) to rate the exams as mathematical or not. Two of the three
agreed in their categorizations of all the exams, while the third agreed with the other two in 80 percent of
the cases. We thus created an indicator for Mathematical when at least two of the three raters designated
an exam as such, which occurred in 9 out of 25 exams.
The third and fourth columns of Table 5 present estimates of Equation (7), expanded to include
interactions of the Mathematical indicator with the main variables. The point estimates suggest that
endophilia by nationality is stronger for less mathematical exams. The point estimate for endophilia by
gender is marginally significant for the more mathematical exams. This latter result is surprising, as one
might expect that Blind exams might be less likely to be assignable to gender based on handwriting styles
if the exam is more mathematical. None of the other results in the two columns is statistically significant.
C. The Impact of Graders’ Rational Expectations
So far we have implicitly assumed that the graders are indifferent toward “blind” exams and treat
these groups as a neutral baseline against which we measure endophilia and exophobia. When grading
Blind exams, the grader might not be oblivious to the distribution of students’ characteristics and might
form rational expectations of the characteristics of the students who wrote those exams. As an extreme
example, a grader who knows that all her students match her nationality will a fortiori know the
nationality of any student in the Blind group.
Let Zg be the share of students in the course that match grader g on the characteristic of interest,
and let e and x be the grader’s latent endophilic and exophobic preferences. Under rational expectations
we can rewrite Equation (7) as:
(7’) S = e⋅MATCH*VISIBLE + x⋅NON-MATCH*VISIBLE +[e⋅Zg+x⋅(1-Zg)] + γ2’X + ε,

17
where, from the grader’s perspective, the students can either visibly match him, visibly non-match him, or
be in the Blind group. Equation (7’) specifies that the grader will treat the students in the Blind group as
the weighted average of how he would have treated students who matched him or not.
To determine whether assuming rational expectations about the Blind group’s students can alter
our results, we estimate (7’) by non-linear least squares. The results confirm our main findings: We again
find endophilia by nationality, although of slightly lesser but still statistically significant magnitude--
0.117, p=0.031. We find no endophilia by gender and no exophobia by either gender or nationality. We
can thus conclude that our main findings do not depend on whether graders are grading with rational
expectations about their students’ gender or nationality.
D. Distinguishing by Graders’ Other Characteristics
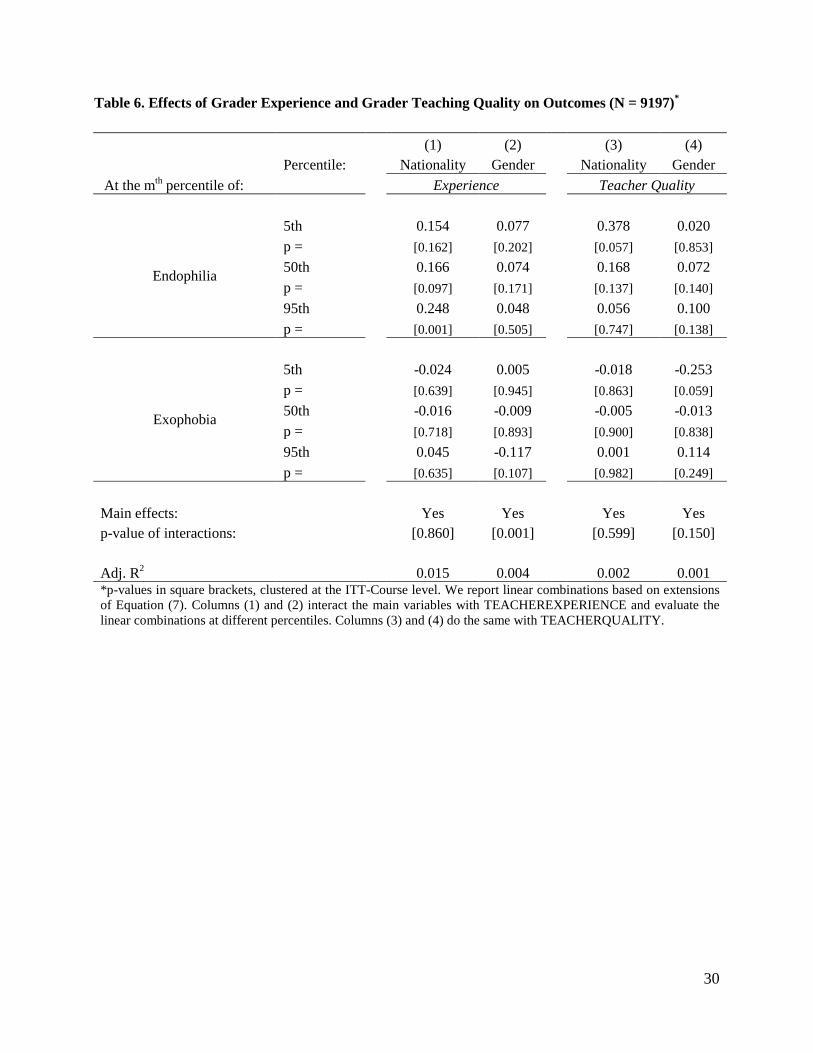
We also examine whether discrimination or favoritism varies with grader experience and grader
quality. We measure grader experience at this University as the number of separate courses taught or
tutored during the grader’s tenure. We have no hypotheses about how university-specific experience might
mitigate or exacerbate endophilia/exophobia. On the one hand, the set of more experienced graders may
exclude those whose behavior was so egregiously unfair that the University did not renew their contracts.
On the other hand, more experienced graders may be secure in their positions and feel able to indulge their
preferences for students who match their characteristics and/or against those who do not.
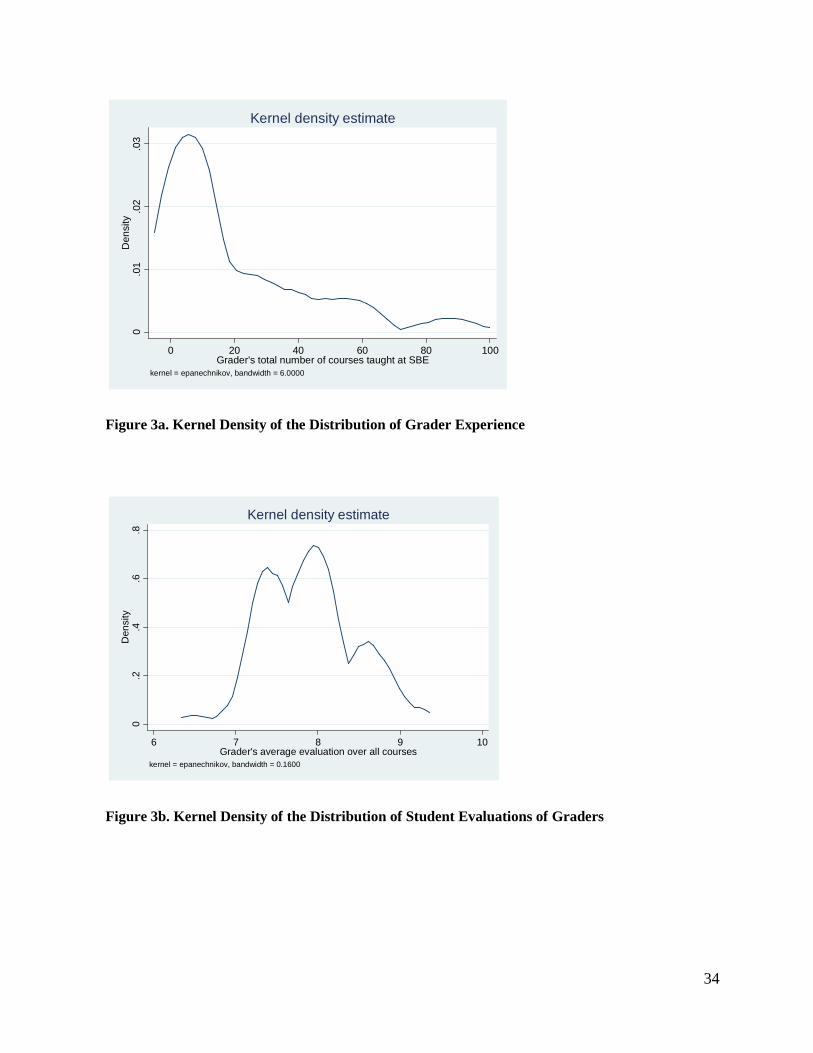
The total number of courses taught/tutored at the University since the online data became
available (including the courses we are using here) ranges from 1 to 94; the 5th, 50th and 95th percentiles,
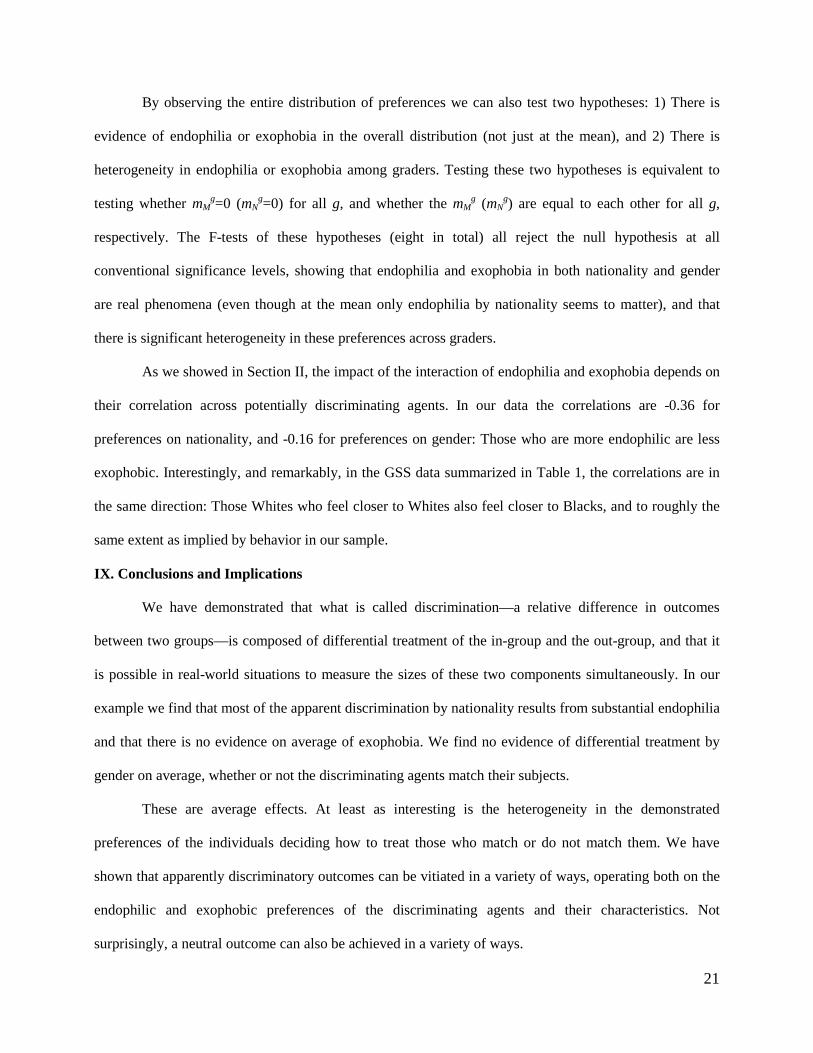
for which we present estimation results, are 1, 8 and 59 courses.24 Figure 3a presents the kernel density of
courses taught by grader, which demonstrates the distribution’s very long right tail. The first and second
columns of Table 6 present re-estimates of Equation (7), expanded to include interactions of grader
experience with the four match/visible variables.
2459 and 94 might seem outlandishly large; but at this University there are 6 teaching blocks in each academic year, so it is not difficult to accumulate 50 or more courses of experience.

18
While the point estimate of the extent of endophilia by nationality is almost identical at the
median value of grader experience to the estimate in Table 3, it is not quite significantly nonzero. Rather,
the significant average endophilia shown in Table 3 results disproportionately from the behavior of the
more experienced graders. By inference, they feel less inhibited about indulging their preferences for
students who match their nationality. Inexperienced graders, perhaps because they feel themselves to be
under greater scrutiny, show no significant endophilia (although the point estimate of their behavior is 60
percent of that of highly experienced graders). As with the basic estimates, there is no evidence of
exophobia by nationality at any level of grader experience. The results by gender remain the same: Just
as at the sample means, so too at various levels of grader experience the parameter estimates show no sign
of any significant endophilia or exophobia.
We measure grader quality as the average of all the evaluations that the instructor received from
students during her career at the University. Evaluations are given on a ten-point scale. In our sample the
averages range from 6.5 to 9.2, with the 5th percentile being 7.1, the median being 8.0, and the 95th
percentile equaling 8.8. As Figure 3b shows, while the distribution of average evaluations is not perfectly
symmetric, it is not far from that.
We interact the grader’s average instructional evaluation with all the variables in Equation (7) and
present the results in Columns (3) and (4) of Table 6. Our finding of endophilia by nationality at the mean
demonstrated in Table 3 arose from behavior that varies sharply with the regard in which graders have
been held by students. Those graders/instructors who have been rated highest by students show no
significant endophilia, and the point estimate of this effect is small. An instructor whose teaching has been
rated at the median of this measure behaves much like the mean instructor—significantly and substantially
favoring those who match her nationality, unsurprisingly given the symmetry in the distribution of
teaching evaluations. The worst-rated instructors, however, favor those students who match their
nationality much more strongly than does the median or average instructor. Implicitly a poorly rated
instructor raises the score of the median student who matches her nationality from the mean to the 61st
percentile of the distribution of scores. There is no evidence of exophobia by nationality. As with all the

19
other results, there is no evidence of endophilia or exophobia by gender, regardless of how badly or well
the grader’s teaching is rated by students. In sum, worse teachers behave differently from better ones,
favoring students of their own nationality.
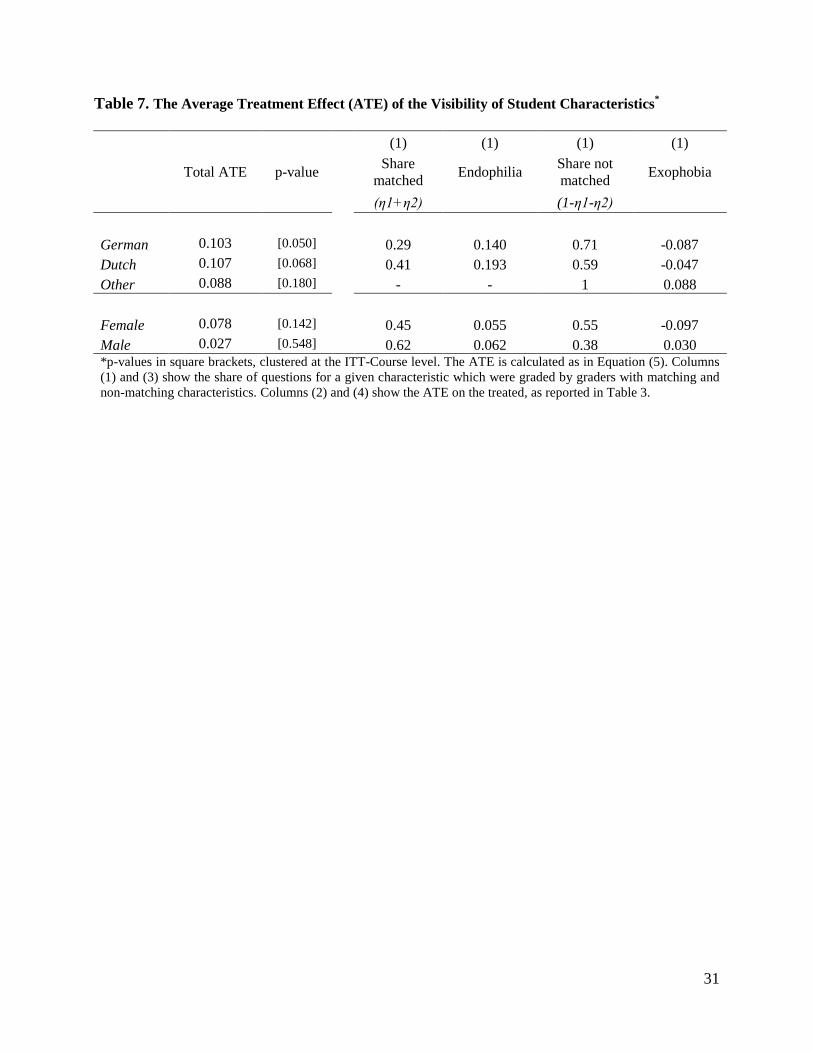
VII. The Average Treatment Effect of Visibility of a Student Characteristic
To evaluate whether the visibility of names differentially favors or disadvantages certain groups
of students, and also to see how these students would be affected by the introduction of anonymous
grading, we calculate the average treatment effect (ATE) of each characteristic’s visibility. Recall from
Equation (5) that the ATE can be calculated as the difference between endophilia and exophobia, each
weighted by the share of questions that was graded by graders with matching and non-matching
characteristics. Table 6 shows the ATE of being seen as German, Dutch, or any other nationality, and of
being seen as female or male. The point estimates for German and Dutch students are similar in size and
(marginally) significantly positive, which shows that German and Dutch students both benefit from visible
grading. The point estimates further suggest that other nationalities are disadvantaged by it, although the
ATE is not statistically significant. Even if they are not suffering from an absolute disadvantage, however,
the notion that other nationalities are disadvantaged becomes straightforward for situations in which they
compete with German and Dutch students. An example is the allocation of student exchange positions at
popular universities abroad, which is done based on relative grades. The difference between Germans and
others is significant (p=0.004) as is the difference between Dutch and others (p= 0.025). Consistent with
our previous results, the point estimates for females and males are positive but smaller in size.
Columns (1) to (4) of Table 6 decompose the ATE by showing endophilia and exophobia
(Columns (2) and (4)) and the share of students with the given characteristic that was graded under each
regime (Columns (1) and (3)). (The estimated effects of endophilia and exophobia are taken from Table
3.) The ATE for German and Dutch students is small because of the relatively small shares of questions
that are graded by graders of the same nationality. This outcome results from the heterogeneous mix of
nationalities of the graders. It is easy to simulate the sizes of these effects for a situation in which a large
share of the students in either category were matched to the graders. Notice also that the mix of graders is
20
not always the most important determinant of the ATE: The difference between the effects when matched
and not matched for females is rather small, so that the ATE will be small regardless of the gender mix of
graders.
VIII. Heterogeneity in the Distribution of Preferences
The results thus far describe either average responses over all graders of endophilia or exophobia
by nationality or gender, or examine how this behavior differs in relation to a few of the graders’ specific
characteristics. In this section we first consider the shapes of the entire distributions of graders’
preferences and then calculate their correlation.
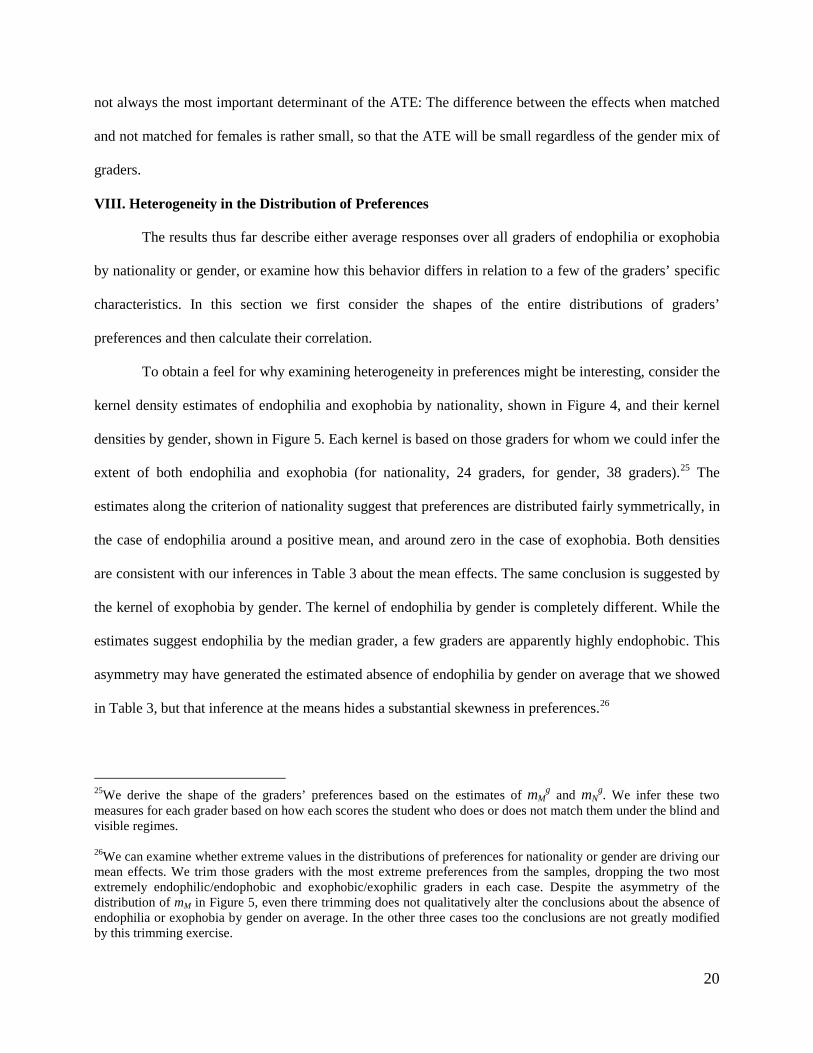
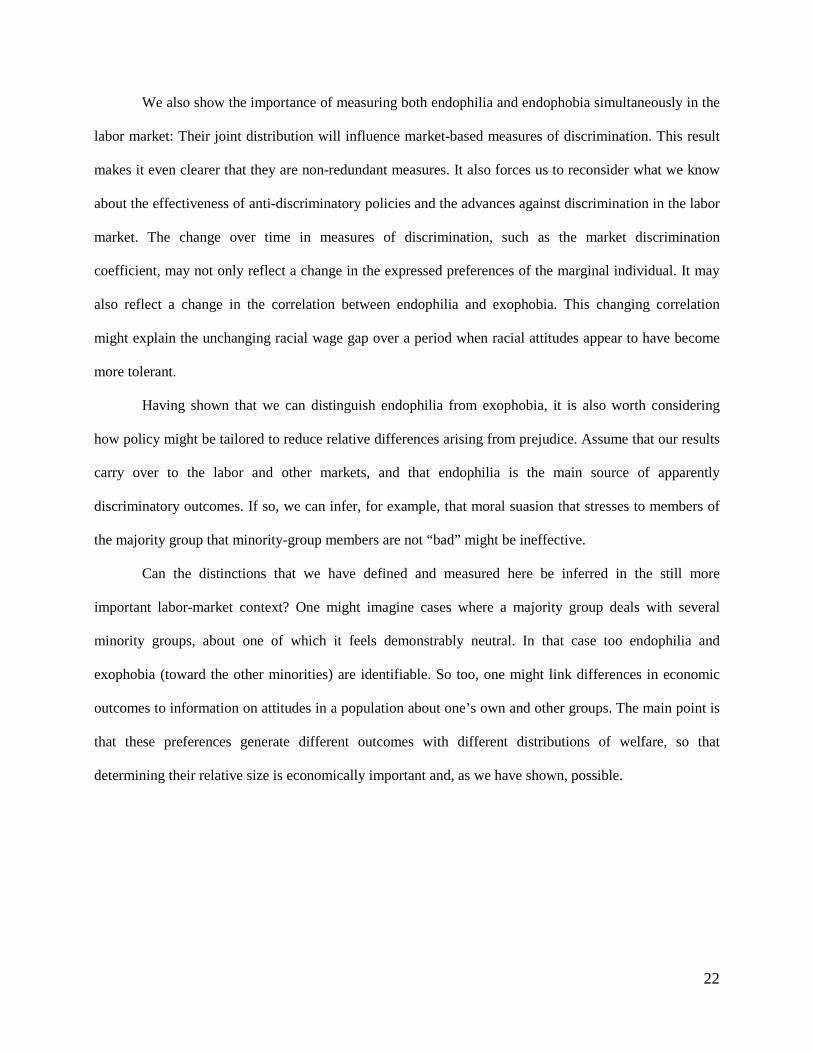
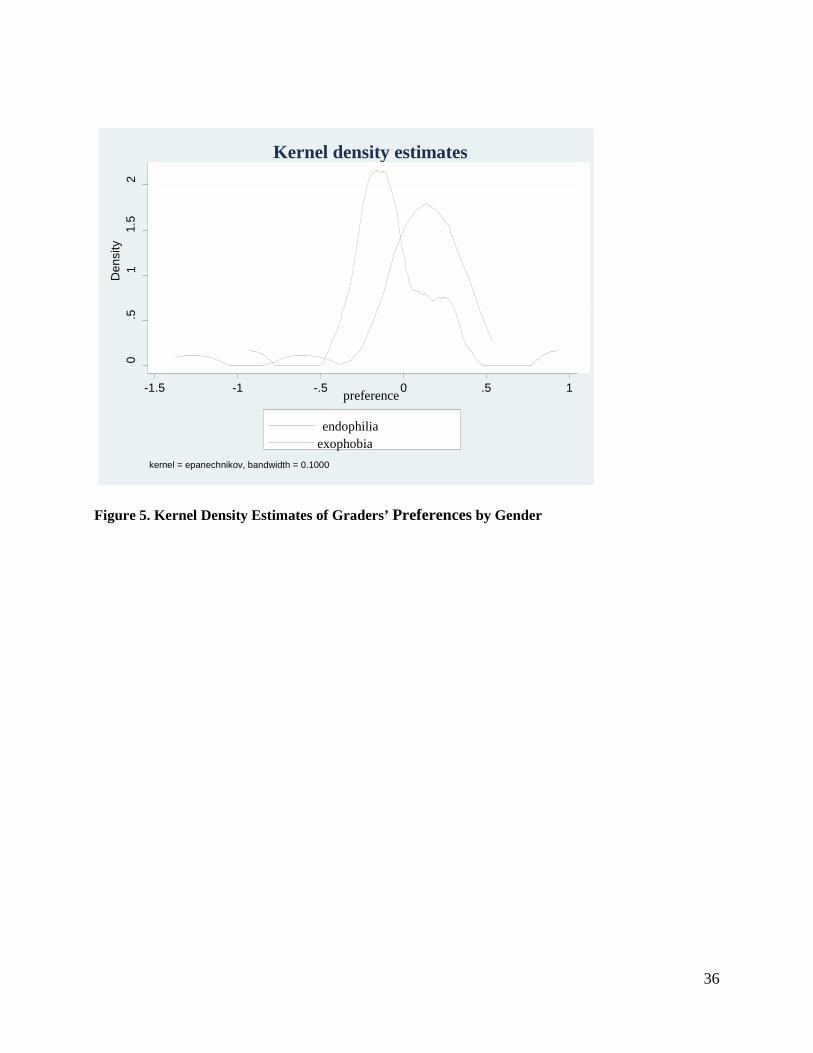
To obtain a feel for why examining heterogeneity in preferences might be interesting, consider the
kernel density estimates of endophilia and exophobia by nationality, shown in Figure 4, and their kernel
densities by gender, shown in Figure 5. Each kernel is based on those graders for whom we could infer the
extent of both endophilia and exophobia (for nationality, 24 graders, for gender, 38 graders).25 The
estimates along the criterion of nationality suggest that preferences are distributed fairly symmetrically, in
the case of endophilia around a positive mean, and around zero in the case of exophobia. Both densities
are consistent with our inferences in Table 3 about the mean effects. The same conclusion is suggested by
the kernel of exophobia by gender. The kernel of endophilia by gender is completely different. While the
estimates suggest endophilia by the median grader, a few graders are apparently highly endophobic. This
asymmetry may have generated the estimated absence of endophilia by gender on average that we showed
in Table 3, but that inference at the means hides a substantial skewness in preferences.26
25We derive the shape of the graders’ preferences based on the estimates of mM
g and mNg. We infer these two
measures for each grader based on how each scores the student who does or does not match them under the blind and visible regimes. 26We can examine whether extreme values in the distributions of preferences for nationality or gender are driving our mean effects. We trim those graders with the most extreme preferences from the samples, dropping the two most extremely endophilic/endophobic and exophobic/exophilic graders in each case. Despite the asymmetry of the distribution of mM in Figure 5, even there trimming does not qualitatively alter the conclusions about the absence of endophilia or exophobia by gender on average. In the other three cases too the conclusions are not greatly modified by this trimming exercise.
21
By observing the entire distribution of preferences we can also test two hypotheses: 1) There is
evidence of endophilia or exophobia in the overall distribution (not just at the mean), and 2) There is
heterogeneity in endophilia or exophobia among graders. Testing these two hypotheses is equivalent to
testing whether mMg=0 (mN
g=0) for all g, and whether the mMg (mN
g) are equal to each other for all g,
respectively. The F-tests of these hypotheses (eight in total) all reject the null hypothesis at all
conventional significance levels, showing that endophilia and exophobia in both nationality and gender
are real phenomena (even though at the mean only endophilia by nationality seems to matter), and that
there is significant heterogeneity in these preferences across graders.
As we showed in Section II, the impact of the interaction of endophilia and exophobia depends on
their correlation across potentially discriminating agents. In our data the correlations are -0.36 for
preferences on nationality, and -0.16 for preferences on gender: Those who are more endophilic are less
exophobic. Interestingly, and remarkably, in the GSS data summarized in Table 1, the correlations are in
the same direction: Those Whites who feel closer to Whites also feel closer to Blacks, and to roughly the
same extent as implied by behavior in our sample.
IX. Conclusions and Implications
We have demonstrated that what is called discrimination—a relative difference in outcomes
between two groups—is composed of differential treatment of the in-group and the out-group, and that it
is possible in real-world situations to measure the sizes of these two components simultaneously. In our
example we find that most of the apparent discrimination by nationality results from substantial endophilia
and that there is no evidence on average of exophobia. We find no evidence of differential treatment by
gender on average, whether or not the discriminating agents match their subjects.
These are average effects. At least as interesting is the heterogeneity in the demonstrated
preferences of the individuals deciding how to treat those who match or do not match them. We have
shown that apparently discriminatory outcomes can be vitiated in a variety of ways, operating both on the
endophilic and exophobic preferences of the discriminating agents and their characteristics. Not
surprisingly, a neutral outcome can also be achieved in a variety of ways.
22
We also show the importance of measuring both endophilia and endophobia simultaneously in the
labor market: Their joint distribution will influence market-based measures of discrimination. This result
makes it even clearer that they are non-redundant measures. It also forces us to reconsider what we know
about the effectiveness of anti-discriminatory policies and the advances against discrimination in the labor
market. The change over time in measures of discrimination, such as the market discrimination
coefficient, may not only reflect a change in the expressed preferences of the marginal individual. It may
also reflect a change in the correlation between endophilia and exophobia. This changing correlation
might explain the unchanging racial wage gap over a period when racial attitudes appear to have become
more tolerant.
Having shown that we can distinguish endophilia from exophobia, it is also worth considering
how policy might be tailored to reduce relative differences arising from prejudice. Assume that our results
carry over to the labor and other markets, and that endophilia is the main source of apparently
discriminatory outcomes. If so, we can infer, for example, that moral suasion that stresses to members of
the majority group that minority-group members are not “bad” might be ineffective.
Can the distinctions that we have defined and measured here be inferred in the still more
important labor-market context? One might imagine cases where a majority group deals with several
minority groups, about one of which it feels demonstrably neutral. In that case too endophilia and
exophobia (toward the other minorities) are identifiable. So too, one might link differences in economic
outcomes to information on attitudes in a population about one’s own and other groups. The main point is
that these preferences generate different outcomes with different distributions of welfare, so that
determining their relative size is economically important and, as we have shown, possible.

23
References
Ali M. Ahmed, “Group Identity, Social Distance and Intergroup Bias,” Journal of Economic Psychology, 28 (2007): 324-37.
Gordon Allport, The Nature of Prejudice. Cambridge, MA: Addison-Wesley, 1954. Joseph Altonji and Rebecca Blank, “Race and Gender in the Labor Market,” in Orley Ashenfelter and
David Card, eds., Handbook of Labor Economics, Vol 3C. Amsterdam: North-Holland, 1999, pp. 3143-3259.
Jason Abrevaya and Daniel Hamermesh, “Charity and Favoritism in the Field: Are Female Economists
Nicer (to Each Other)?” Review of Economics and Statistics, 94 (Feb. 2012): 202-7. Manuel Baguës and Berta Esteve-Volart, “Can Gender Parity Break the Glass Ceiling? Evidence from a
Repeated Randomized Experiment,” Review of Economic Studies, 77 (Oct. 2010): 1301-28. Gary Becker, The Economics of Discrimination. Chicago: University of Chicago Press, 1957. Rebecca Blank, “The Effects of Double-Blind versus Single-Blind Refereeing: Experimental Evidence
from the American Economic Review,” American Economic Review, 81 (Dec. 1991): 1041-67. Glen Cain, “The Economic Analysis of Labor Market Discrimination: A Survey,” in Orley Ashenfelter
and Richard Layard, eds., Handbook of Labor Economics, Vol. 2. Amsterdam: North-Holland, 1986, pp. 693-785.
Ana Rute Cardoso and Rudolf Winter-Ebmer, “Female-Led Firms and Gender Wage Policies,” Industrial
and Labor Relations Review, 64 (Oct. 2010): 143-63. Kerwin Charles and Jonathan Guryan, “Prejudice and Wages: An Empirical Assessment of Becker’s The
Economics of Discrimination,” Journal of Political Economy, 116 (Oct. 2008): 773-809. Thomas Dee, “A Teacher Like Me: Does Race, Ethnicity or Gender Matter?” American Economic
Association, Papers and Proceedings, 95 (May 2005): 158-65. Alan Dillingham, Marianne Ferber and Daniel Hamermesh, “Gender Discrimination by Gender: Voting in
a Professional Society,” Industrial and Labor Relations Review, 47 (July 1994): 622-33. Stephen Donald and Daniel Hamermesh, “What Is Discrimination? Gender in the American Economic
Association, 1935-2004,” American Economic Review, 96 (Sept. 2006): 1283-92. Jan Feld and Nicolás Salamanca, “Grading Expectations,” Unpublished paper, SBE, Maastricht
University, 2013. Chaim Fershtman, Uri Gneezy and Frank Verboven, “Discrimination and Nepotism: The Efficiency of the
Anonymity Rule,” Journal of Legal Studies, 34 (June 2005): 371-96. Roland Fryer, “Racial Inequality in the 21st Century: The Declining Significance of Discrimination,” in
Orley Ashenfelter and David Card, eds., Handbook of Labor Economics, Vol. 4B. Amsterdam: Elsevier, pp. 855-971.

24
Laura Giuliano, David Levine and Jonathan Leonard, “Racial Bias in the Manager-Employee Relationship: An Analysis of Quits, Dismissals and Promotions at a Large Retail Firm,” Journal of Human Resources, 46 (Winter 2011): 26-52.
Matthew Goldberg, “Discrimination, Nepotism and Long-Run Wage Differentials,” Quarterly Journal of
Economics, 97 (May 1982): 307-19. Claudia Goldin and Cecilia Rouse, “Orchestrating Impartiality: The Impact of “Blind” Auditions on
Female Musicians,” American Economic Review, 90 (Sept. 2000): 715-41. Björn Tyrefors Hinnerich, Erik Höglin and Magnus Johannesson, “Are Boys Discriminated in Swedish
High Schools?” Economics of Education Review, 30 (Aug. 2011): 682-90. Victor Lavy, “Do Gender Stereotypes Reduce Girls’ or Boys’ Human Capital Outcomes? Evidence from a
Natural Experiment” Journal of Public Economics, 92 (Oct. 2008): 2083-105. Steven Levitt and John List, “What Do Laboratory Experiments Measuring Social Preferences Reveal
About the Real World?” Journal of Economic Perspectives, 21 (Spring 2007): 153-74. Christopher Parsons, Johan Sulaeman, Michael Yates and Daniel Hamermesh, “Strike Three:
Discrimination, Incentives and Evaluation,” American Economic Review, 101 (June 2011): 1410-35.
Joseph Price and Justin Wolfers, “Racial Discrimination among NBA Referees,” Quarterly Journal of
Economics, 125 (Nov. 2010): 1859-87. Steven Rivkin, Eric Hanushek and John Kain, “Teachers, Schools and Academic Achievement,”
Econometrica, 73 (March 2005): 417-58.

25
Table 1. Endophilia and Exophobia in the U.S. General Social Survey, 1996-2006, 9-point scale*
Time period: 1996-2000 2004-2006 WHITES Feel Close to Whites 7.06 6.966 (0.031) (0.038)
Feel Close to Blacks 5.121 5.494 (0.032) (0.039)
N 3,550 2,174 ρ 0.146 0.226 BLACKS Feel Close to Whites 5.799 5.945 (0.084) (0.106)
Feel Close to Blacks 7.547 7.685 (0.079) (0.093)
N 651 387 ρ 0.242 0.318 *In general, how close do you feel to …? 9 = very close; 1 = not close at all. Standard errors of means in parentheses.
26
Table 2. Student Characteristics by Intended and Actual Treatment Status*
Internal validity: Pre-experiment (1) (2) Blind Visible p-value of difference Mean SD N Mean SD N. Blind-Visible Female ITT 0.369 0.483 452 0.352 0.478 1,043 [0.502] Treatment 0.363 0.482 399 0.355 0.479 1,096 [0.758] German ITT 0.374 0.484 452 0.353 0.478 1,043 [0.420] Treatment 0.373 0.484 399 0.354 0.478 1,096 [0.486] Dutch ITT 0.363 0.481 452 0.343 0.475 1,043 [0.452] Treatment 0.351 0.478 399 0.349 0.477 1,096 [0.932] GPA ITT 7.197 0.628 443 7.215 0.665 1,021 [0.607] Treatment 7.178 0.618 389 7.221 0.667 1,075 [0.241] Participation ITT 7.690 0.986 306 7.633 1.031 706 [0.386] Treatment 7.612 0.968 263 7.664 1.035 749 [0.452] Presentation ITT 7.795 1.164 191 7.930 1.059 436 [0.179] Treatment 7.758 1.172 181 7.942 1.055 446 [0.070] Term paper ITT 7.870 0.665 109 7.743 0.898 281 [0.126] Treatment 7.870 0.697 97 7.748 0.882 293 [0.166]
Internal validity: Within-experiment (1) (2) Blind Visible p-value of difference Mean SD N Mean SD N Blind-Visible Multiple Choice exams ITT 5.829 1.972 277 6.043 1.942 661 [0.128] Treatment 5.792 2.009 253 6.049 1.928 685 [0.078] Fill-In-The-Blank exams ITT 5.325 2.208 152 5.555 1.996 382 [0.264] Treatment 5.367 2.167 148 5.536 2.016 386 [0.411] *p-values of differences between the Visible and Blind groups are calculated with standard errors clustered by student.
27
Table 3. Basic Estimates of the Extent of Favoritism and Discrimination by Nationality and Gender (N = 9330)* (1) (2) (3) (4) Nationality Gender Nationality Gender Interaction with: - - German Dutch Other Female Male (1) MATCH*VISIBLE 0.287 0.203 0.306 -0.012 - 0.156 -0.039 (0.038) (0.041) (0.021) (0.099) - (0.028) (0.027) (2) MATCH*BLIND 0.115 0.146 0.165 -0.204 - 0.101 -0.101 (0.081) (0.069) (0.101) (0.106) - (0.075) (0.042) (3) NON-MATCH*VISIBLE 0.177 0.206 0.148 -0.048 -0.123 0.150 -0.101 (0.050) (0.062) (0.070) (0.053) (0.067) (0.047) (0.046) (4) NON-MATCH*BLIND 0.172 0.174 0.060 -0.095 -0.035 0.053 -0.071 (0.057) (0.055) (0.080) (0.077) (0.072) (0.038) (0.079) Endophilia [(1)-(2)] 0.172 0.058 0.140 0.193 - 0.055 0.062 p = [0.028] [0.260] [0.171] [0.049] - [0.471] [0.188] Exophobia [(3)-(4)] -0.005 -0.033 -0.087 -0.047 0.088 -0.097 0.030 p = [0.904] [0.619] [0.098] [0.531] [0.180] [0.124] [0.740] Adj. R2 0.015 0.014 0.017 0.010 *Standard errors in parentheses and p-values in square brackets. Both are clustered by ITT-Course. Columns (1) and (2) present the estimates of Equation (7) without a constant. (3) and (4) are based on Equation (7), with the main variables interacted with CHARACTERISTIC, where CHARACTERISTIC are indicators for nationality in (3) and for gender in (4). MATCH*Other interactions in (3) are empty because we define MATCH = 1 only for German and Dutch students. Other nationalities almost never matched.
28
Table 4. The Effects of Treatment Slippage by Students and Graders on Estimates of Endophilia
and Exophobia*
(1) (2) (3) (4) Nationality Gender Nationality Gender Regression: IV No Look-up names only Endophilia 0.193 0.092 0.174 0.002 p = [0.034] [0.222] [0.009] [0.971] Exophobia -0.033 -0.055 -0.008 -0.103 p = [0.538] [0.457] [0.878] [0.093] N 9,330 9,330 5,108 5,108 Adj. R2 0.015 0.013 0.015 0.015 *p-values in squared brackets, clustered at the ITT-Course level. We report linear combinations based on extensions of Equation (7). Columns (1) and (2) are based on an instrumental variable regression (IV) estimated by GMM, where we use ITT to instrument for the treatment. The F-statistics for the instruments are well above 100. Columns (3) and (4) are based on Equation (7) with the sample of graders who did not look up any of the names in the Blind group of exams.
29
Table 5. Endophilia and Exophobia When Graders Know the Students They Grade, and When the
Exams are Mathematical (N = 9330)*
(1) (2) (3) (4) Nationality Gender Nationality Gender Grader knows the student?: Exam was
mathematical?:
Endophilia
No 0.320 0.124
Endophilia
No 0.220 0.042 p = [0.003] [0.051] p = [0.125] [0.589] Yes 0.050 -0.008 Yes 0.058 0.080 p = [0.652] [0.911] p = [0.493] [0.085]
Exophobia
Exophobia
No -0.068 -0.121 No 0.050 -0.003 p = [0.165] [0.028] p = [0.449] [0.974] Yes 0.066 0.087 Yes -0.086 -0.072 p = [0.469] [0.422] p = [0.103] [0.236]
*p-values in squared brackets, clustered at the ITT-Course level. We report linear combinations based on extensions of Equation (7). Columns (1) and (2) report interactions of the main variables with GRADERKNOWSSTUDENT, Columns (3) and (4) of the main variables with MATHEMATICALEXAM.
30
Table 6. Effects of Grader Experience and Grader Teaching Quality on Outcomes (N = 9197)*
(1) (2) (3) (4) Percentile: Nationality Gender Nationality Gender At the mth percentile of: Experience Teacher Quality
Endophilia
5th 0.154 0.077 0.378 0.020 p = [0.162] [0.202] [0.057] [0.853] 50th 0.166 0.074 0.168 0.072 p = [0.097] [0.171] [0.137] [0.140] 95th 0.248 0.048 0.056 0.100 p = [0.001] [0.505] [0.747] [0.138]
Exophobia
5th -0.024 0.005 -0.018 -0.253 p = [0.639] [0.945] [0.863] [0.059] 50th -0.016 -0.009 -0.005 -0.013 p = [0.718] [0.893] [0.900] [0.838] 95th 0.045 -0.117 0.001 0.114 p = [0.635] [0.107] [0.982] [0.249]
Main effects: Yes Yes Yes Yes p-value of interactions: [0.860] [0.001] [0.599] [0.150] Adj. R2 0.015 0.004 0.002 0.001 *p-values in square brackets, clustered at the ITT-Course level. We report linear combinations based on extensions of Equation (7). Columns (1) and (2) interact the main variables with TEACHEREXPERIENCE and evaluate the linear combinations at different percentiles. Columns (3) and (4) do the same with TEACHERQUALITY.
31
Table 7. The Average Treatment Effect (ATE) of the Visibility of Student Characteristics*
Total ATE p-value
(1) (1) (1) (1)
Share
matched Endophilia Share not matched Exophobia
(η1+η2) (1-η1-η2) German 0.103 [0.050] 0.29 0.140 0.71 -0.087 Dutch 0.107 [0.068] 0.41 0.193 0.59 -0.047 Other 0.088 [0.180] - - 1 0.088 Female 0.078 [0.142] 0.45 0.055 0.55 -0.097 Male 0.027 [0.548] 0.62 0.062 0.38 0.030 *p-values in square brackets, clustered at the ITT-Course level. The ATE is calculated as in Equation (5). Columns (1) and (3) show the share of questions for a given characteristic which were graded by graders with matching and non-matching characteristics. Columns (2) and (4) show the ATE on the treated, as reported in Table 3.
32
Figure 1. Black and White Wages in Polar Cases of Endophilia and Exophobia*
*In constructing this graph we assume that some positions remain vacant after all employees are allocated. Unallocated jobs are shown in the white area below the curve. This assumption, however, is only for illustrative purposes; it is not needed for the model’s results in any way.

33
Figure 2: Seating Arrangement for the Experiment*
*One square represents one desk. Students were seated in order of their ID numbers. Each number indicates the order of student ID numbers in each block. The student with the lowest ID number sat in desk 1, the one with the highest ID in desk 50. Rows 1-3 had yellow sheets on the desks with instructions not to write their name, thus creating the Blind group. Rows 4-10 had no extra sheets. In these rows students were expected to write their name to create the Visible group.
34
Figure 3a. Kernel Density of the Distribution of Grader Experience
Figure 3b. Kernel Density of the Distribution of Student Evaluations of Graders
0.0
1.0
2.0
3D
ensi
ty
0 20 40 60 80 100Grader's total number of courses taught at SBE
kernel = epanechnikov, bandwidth = 6.0000
Kernel density estimate0
.2.4
.6.8
Den
sity
6 7 8 9 10Grader's average evaluation over all courses
kernel = epanechnikov, bandwidth = 0.1600
Kernel density estimate

35
Figure 4. Kernel Density Estimates of Graders’ Preferences by Nationality
0 .5
1
1.5
2 D
ensi
ty
-.5 0 .5 1 1.5 preference
endophilia exophobia
kernel = epanechnikov, bandwidth = 0.1000
Kernel density estimates
36
Figure 5. Kernel Density Estimates of Graders’ Preferences by Gender
0 .5
1
1.5
2 D
ensi
ty
-1.5 -1 -.5 0 .5 1 preference
endophilia exophobia
kernel = epanechnikov, bandwidth = 0.1000
Kernel density estimates