Dynamik und Kinematik der Lokomotion von Formica polyctena
88
FRIEDRICH – SCHILLER – UNIVERSITÄT JENA Fakultät für Sozial- und Verhaltenswissenschaften Institut für Sportwissenschaft Dynamik und Kinematik der Lokomotion von Formica polyctena Dissertation zur Erlangung des akademischen Grades doctor philosophiae (Dr. phil.) vorgelegt dem Rat der Fakultät für Sozial- und Verhaltenswissenschaften der Friedrich-Schiller-Universität Jena von Dipl.-Sportwiss. Lars Reinhardt geboren am 21. August 1979 in Jena
Transcript of Dynamik und Kinematik der Lokomotion von Formica polyctena
FRIEDRICH – SCHILLER – UNIVERSITÄT JENA
Fakultät für Sozial- und Verhaltenswissenschaften
Institut für Sportwissenschaft
Dynamik und Kinematik der
Lokomotion von Formica polyctena
Dissertation
zur Erlangung des akademischen Grades
doctor philosophiae (Dr. phil.)
vorgelegt dem Rat der Fakultät für Sozial- und Verhaltenswissenschaften der
Friedrich-Schiller-Universität Jena
von Dipl.-Sportwiss. Lars Reinhardt
geboren am 21. August 1979 in Jena
Gutachter
Prof. Dr. Reinhard Blickhan
Friedrich-Schiller-Universität Jena
Institut für Sportwissenschaft / Bewegungswissenschaft
Prof. Dr. Tobias Siebert
Universität Stuttgart
Institut für Sport- und Bewegungswissenschaft / Trainingswissenschaft
Prof. Dr. Tobias Seidl
Westfälische Hochschule (Bocholt)
Fachbereich Maschinenbau / Bionik und Sensorik
Tag der mündlichen Prüfung: 20. Oktober 2014
Vorwort
Die vorliegende Dissertation entstand in den Jahren 2006 bis 2014 am Lehrstuhl für
Bewegungswissenschaft, des Instituts für Sportwissenschaft der Friedrich-Schiller-Univer-
sität Jena und schließt kumulativ Vorarbeiten und Teilergebnisse ein.
Im Einzelnen wurden ihre Aufgabenstellung und Realisierung insbesondere durch die
Volkswagenstiftung (2002-2008, „3-D spatial orientation of a small brain navigator“,
[I/78 578]) und die Deutsche Forschungsgemeinschaft (2009-2014, „Verteilung der Boden-
reaktionskräfte bei Ameisen“, [BL 236/20-1/2]) gefördert.
Diese Arbeit liefert einen Beitrag zum Verständnis der terrestrischen Lokomotion von
Insekten, welche unter drastisch anderen Bedingungen erfolgt als bei größeren Tieren. So ist
zum einen die Anzahl und Ausrichtung der Beine verschieden und zum anderen ist die Gra-
vitation nicht mehr die dominante Größe, im Verhältnis zu anderen, die Bewegung beein-
flussenden Kräften. Dementsprechend waren Abweichungen in den kinematischen und dy-
namischen Mustern zu erwarten.
Da dynamische Messreihen für diese Größenordnung noch nicht vorlagen, mussten
messtechnische Voraussetzungen völlig neu geschaffen werden. Vor diesem Hintergrund
gelang es im Rahmen dieser Arbeit, eine Miniaturkraftmessplattform zu konstruieren, mit
der die 3D-Bodenreaktionskräfte eines einzelnen Insektenbeins zuverlässig registriert wer-
den können. Die Kraftmessplatte wurde gemeinsam mit einer Hochgeschwindigkeitskamera
in umfangreichen Studien zur Lokomotion von Waldameisen bei unterschiedlichen Anstie-
gen eingesetzt. Die gekoppelte Information von Dynamik und Kinematik generierte ein aus-
sagekräftiges Bild über die Bewegungsstrategien von Ameisen. Dabei entstand ein in dieser
Form weltweit einzigartiger Datensatz.
Die gewonnenen Erkenntnisse liefern wichtige Grundlagen zur Beurteilung der Me-
chanik, der Sinnesphysiologie und der Motorik. Des Weiteren lassen sich beispielsweise in
der Bionik und Robotik konkrete Anwendungen realisieren. Dazu zählen etwa extrem ge-
ländegängige Trage- und Transporthilfen, die den sicheren Gang auf sechs Beinen imitieren.
Zusammenfassung
Für jegliche Form der pedalen Fortbewegung stellen Bodenreaktionskräfte ein charak-
teristisches Merkmal dar. Daher gehört ihre Erfassung zu den wesentlichen Bestandteilen
einer umfassenden biomechanischen Analyse der Lokomotion. Während die Forschung auf
diesem Gebiet für größere Arten schon weit vorangeschritten ist, sind Studien an kleinen
Tieren ausgesprochen rar. Vor allem aus messtechnischen Gründen konzentrierten sich
frühere Untersuchungen, ausschließlich auf Tiere, mit einem Körpergewicht von mehr als
einem Gramm. Infolgedessen wurden für Insekten – die artenreichste Tierklasse überhaupt
– bisher nur relativ schwere Spezies, wie Schaben und Stabheuschrecken, als Versuchstiere
herangezogen. Genau wie Schaben, sind auch die meisten Ameisen ausgesprochen schnelle
und wendige Läufer mit ähnlicher Kinematik. Allerdings sind Ameisen, deren typisches
Körpergewicht zwischen 5 und 30 mg beträgt, etwa zwei bis drei Größenordnungen leichter
als Schaben. Bei derart kleinen Tieren ist die Gravitationskraft höchstwahrscheinlich nicht
mehr die dominante Größe, im Vergleich zu anderen, bewegungsbeeinflussenden Kräften,
wie Luftwiderstand, Substrathaftung oder Gelenkreibung. Daher sollte im Rahmen der vor-
liegenden Dissertation untersucht werden, welche kinematischen und dynamischen Muster
sich bei der Ameisenlokomotion identifizieren lassen und wie sich diese im Vergleich zu
größeren Arten darstellen.
Grundvoraussetzung für das Gelingen des Projektes war die Entwicklung eines mini-
aturisierten Messplatzes zur Erfassung der dreidimensionalen Bodenreaktionskräfte der Ein-
zelbeine kleiner Insekten, bei gleichzeitiger Aufzeichnung der Kinematik mit möglichst ho-
her Orts- und Zeitauflösung (Hochgeschwindigkeitskameras). Im Rahmen dieser Arbeit ist
es gelungen eine neuartige Ultraminiaturkraftmessplattform mit einem Auflösungsvermö-
gen im Mikronewton-Bereich zu entwickeln und gemeinsam mit einer Hochgeschwindig-
keits-Videokamera in einen weltweit einzigartigen Messplatz zu integrieren. Der Kraftsen-
sor wurde stereolithographisch gefertigt und mit Halbleiterdehnungsmessstreifen bestückt.
Wir ermittelten einen hochlinearen Zusammenhang zwischen applizierter Kraft und Mess-
signal im Eichbereich von ±1300 μN. Der gleiche Zusammenhang bestand auch in vereinzelt
durchgeführten Belastungsproben mit Gewichten von bis zu 4 mN, was den relativ großen
Messbereich und die Robustheit unseres Prototyps belegt. Die Empfindlichkeit lag über
50 V N−1 in allen drei Richtungen, was die Auflösung von Kräften bis etwa 10 μN gestattet.
Zusammenfassung iii
Da bereits kinematische Daten der gleichen Gattung publiziert sind und es sich bei
dieser Art um einen ausgesprochen variablen Läufer und Kletterer handelt, haben wir die
Waldameisenart Formica polyctena als Studientier gewählt. Für das Verständnis der ebenen
Lokomotion bestimmten wir das Schrittmuster, die dreidimensionale Kinematik der Haupt-
körpersegmente und des Körperschwerpunkts, sowie die Bodenreaktionskräfte von Einzel-
beinen während des Schrittzyklus. Unsere Ergebnisse zeigen, dass Waldameisen dieselbe
Gangdynamik über einen weiten Geschwindigkeitsbereich benutzten, ohne das alternie-
rende, tripodale Schrittmuster aufzulösen. Mit wachsenden Laufgeschwindigkeiten kam es
zu einer proportionalen Zunahme der Schrittlänge und Schrittfrequenz. Die Energetik des
Körperschwerpunkts indizierte einen federnden Gang, da kinetische und potentielle Energie
nahezu in Phase verliefen. Darüber hinaus wurde ein hohes Maß an Nachgiebigkeit in den
Vorderbeinen festgestellt, weil sich die effektive Beinlänge während der Kontaktphase fast
halbierte. Gerade diese Nachgiebigkeit führt zu geringen vertikalen Oszillationen des Kör-
perschwerpunktes und ermöglicht die Aufrechterhaltung des Bodenkontaktes auch bei hö-
heren Geschwindigkeiten. Federnde Gangarten, ohne Flugphasen, scheinen eine weit ver-
breitete Strategie bei kleinen, schnell laufenden Lebewesen zu sein und können hinlänglich
gut über das bipedale Masse-Feder-Modell beschrieben werden. Diese Form der Lokomo-
tion wird auch als „Grounded Running“ bezeichnet und scheint, gemäß unseren Ergebnissen,
auch für Ameisen die bevorzugte Fortbewegungsstrategie, zumindest bei ebener Lokomo-
tion zu sein.
Da sich Waldameisen stets in einer verhältnismäßig stark strukturierten Umgebung
fortbewegen müssen, stellt das Klettern für sie eine übliche Herausforderung dar. Allerdings
sind die Strategien, mit denen diese schnellen Läufer unterschiedliche Substratsteigungen
bewältigen, bisher weitgehend unbekannt. Um diesen Sachverhalt näher zu beleuchten, un-
tersuchten wir auch die aufwärtsgerichtete Lokomotion von F. polyctena bei Steigungen
zwischen 0° und 90°. Unsere Ergebnisse bestätigen frühere Studien, die ergaben, dass For-
mica keine steigungsabhängigen Anpassungen der Kinematik und des Schrittmusters durch-
führt. Selbst bei größeren Substratwinkeln lässt sich die Kinematik nicht von der ebenen
Lokomotion unterscheiden, sondern erscheint weiterhin dynamisch. Allerdings gab es im
Vergleich zur Ebene erwartungsgemäß gravierende Änderungen in den Kraftmustern der
Beine. Dies gilt insbesondere für die Vorderbeine, welche beim Klettern Kräfte mit ausge-
prägter anterior-posteriorer und lateraler Komponente generierten. Zusätzlich waren die
Normalkräfte dieser Beine bei größeren Anstiegen (> 45°) negativ und damit im Vergleich
Zusammenfassung iv
zu den Hinterbeinen entgegengesetzt gerichtet. Folglich zogen sich die Tiere mit den Vor-
derbeinen vorwärts und drückten sich mit den Hinterbeinen vom Substrat ab. Der Beitrag
zum Vortrieb war bei den Hinterbeinen, im Vergleich zur Lokomotion in der Ebene, gering
ausgeprägt. Die Messungen zum vertikalen Klettern bei Schaben lieferten ähnliche Ergeb-
nisse bezüglich der Beinkräfte und lassen darauf schließen, dass beide Insektenarten eine
ähnliche Strategie bei der Bewältigung von Anstiegen verfolgen.
Inhaltsverzeichnis
Vorwort ................................................................................................................... i
Zusammenfassung ............................................................................................... ii
Abbildungsverzeichnis ...................................................................................... vii
Tabellenverzeichnis .......................................................................................... viii
1 Einleitung ................................................................................................. 1
1.1 Biomechanik der Ameisenlokomotion ................................................................... 1
1.1.1 Grundlegendes zur Lokomotion ............................................................................. 1
1.1.2 Lokomotion bei Insekten ........................................................................................ 3
1.1.3 Die Orientierung von Ameisen ............................................................................... 4
1.1.4 Substrathaftung ....................................................................................................... 7
1.1.5 Muskuläre Koordination ......................................................................................... 8
1.2 Bodenreaktionskraftmessung bei Ameisen ........................................................... 10
1.2.1 Stand der Technik ................................................................................................. 10
1.2.2 Die Fragilität der Mikrosystemtechnik ................................................................. 11
1.2.3 Über die Auslegung von Kraftsensoren – Balkentheorie ..................................... 12
1.2.4 Konsequenzen für den Sensorbau ......................................................................... 14
1.3 Hauptaspekte der Arbeit ....................................................................................... 15
2 Übersicht zu den Artikeln ..................................................................... 16
2.1 Reinhardt & Blickhan, 2014 ................................................................................. 16
2.2 Reinhardt et al., 2009 ............................................................................................ 17
2.3 Reinhardt & Blickhan, 2014 ................................................................................. 18
3 Artikel I (Ultra-miniature force plate) ................................................... 19
4 Artikel II (Dynamics and kinematics of ant locomotion) .................... 20
5 Artikel III (Level locomotion in wood ants) ......................................... 21
6 Poster I (Climbing strategies in ants) .................................................. 22
6.1 Introduction ........................................................................................................... 23
6.2 Materials and Methods .......................................................................................... 23
6.3 Results ................................................................................................................... 23
6.4 Discussion ............................................................................................................. 24
6.5 References ............................................................................................................. 25
7 Abschlussdiskussion ........................................................................... 26
7.1 Bodenreaktionskraftmessung bei Ameisen ........................................................... 26
vi
7.1.1 Metalllegierungen ................................................................................................. 26
7.1.2 Polymere ............................................................................................................... 27
7.1.3 Schwachstellen des Prototypen ............................................................................. 29
7.2 Biomechanik der Ameisenlokomotion ................................................................. 31
7.2.1 Schrittmuster und Gangartwechsel ....................................................................... 31
7.2.2 Lokomotion und Duftspuren ................................................................................. 32
7.2.3 Kinematische und dynamische Muster ................................................................. 33
7.2.4 Energetische Kosten der Lokomotion ................................................................... 35
7.2.5 Grounded Running bei Ameisen ........................................................................... 37
7.2.6 Steigungsdynamik und Gravizeption .................................................................... 38
Literaturverzeichnis ........................................................................................... 40
Danksagung ........................................................................................................ 47
Erklärung............................................................................................................. 48
Lebenslauf .......................................................................................................... 49
Veröffentlichungen ............................................................................................. 50
Abbildungsverzeichnis
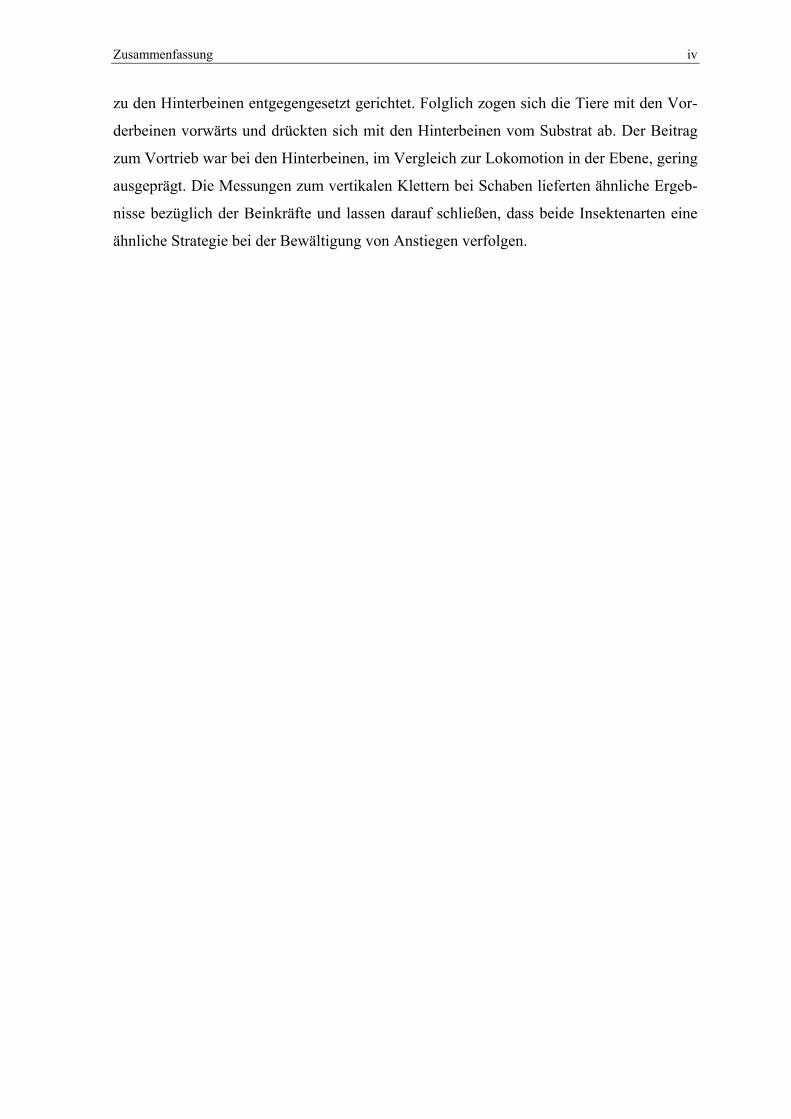
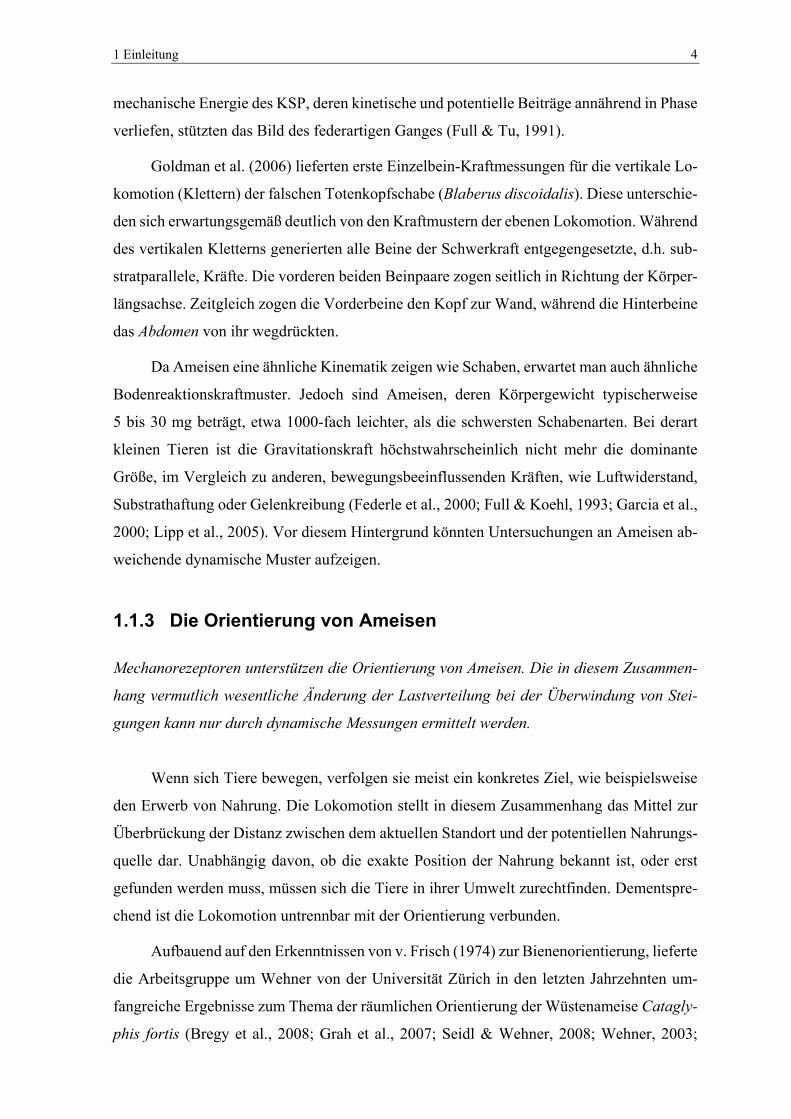
Abb. 1.1: Grundlegende biomechanische Modelle der pedalen terrestrischen Lokomotion
(aus Dickinson et al., 2000). ............................................................................... 2
Abb. 1.2: Route einer einzelnen Wüstenameise (Cataglyphis fortis) bei der Futtersuche.
Nach der Nahrungsaufnahme erfolgt der Rückweg (grüne Linie) zum Nest auf
direktem Weg (Abbildung verändert nach Müller & Wehner, 1988). ............... 5
Abb. 1.3: Propriorezeptive Borstenfelder bei Formica polyctena nach Markl (1974). ...... 6
Abb. 1.4: Kopfüberhängende Ameise mit Zusatzlast (Endlein, 2007). .............................. 7
Abb. 6.1: Single leg ground reaction forces (normalized to body weight, FG) of Formica
polyctena at slopes of 0°(A), 45°(B) and 90°(C). Force vectors at the time of
mid-stance are presented as red arrows in the sagittal plane (cp. Table 1). The
centre of mass is located close to the petiole and is marked by a red dot. ....... 24
Abb. 7.1: Ashby-Diagramm: E-Modul der Werkstoffe in Abhängigkeit von ihrer Dichte
mit Hilfslinien für gleiche Materialeffizienz für Druck-/Zugstab, Biegebalken
und Druckbiegung einer Platte. Markiert sind Stahl (grün) und Messing (blau),
als typische Materialen für den Sensorbau, sowie PVC (rot), als potentieller
Werkstoff für eine Ultraminiaturkraftmessplattform für den Einsatz im Bereich
der Insektenbiomechanik. Abbildung verändert nach Degischer und Lüftl
(2012). ............................................................................................................... 27
Abb. 7.2: Einfluss des Materials auf die Dehnung eines einseitig eingespannten
Biegebalkens mit einer Last am freien Ende. Die Abmessungen des Balkens
betragen in allen Fällen 30 x 10 x 1 mm (L/B/H) und die eingeleitete Kraft
(F = 0.1 N) wirkt immer entlang der z-Achse. Zum Vergleich sind Balken aus
den Materialen Stahl (A), Messing (B) und Accura 60® (C) dargestellt.
Letzteres wird verwendet, um dreidimensionale Modelle stereolithographisch
aufzubauen und besitzt PVC-ähnliche Eigenschaften. Die Dehnungen wurden
softwaregestützt (SolidWorks 2010, Waltham, MA, USA) unter Verwendung
der Finite-Elemente-Methode berechnet. ......................................................... 28
Abb. 7.3: Beschaffenheit des Waldbodens. ...................................................................... 35
Tabellenverzeichnis
Tab. 6.1: Average (mean ± s.d.) running speeds (v) and ground contact times (tc), plus
the mean ground reaction forces at mid-stance in anterio-posterior (Fx), lateral
(Fy) and in the vertical (Fz) direction. Forces are normalized to body weight
(FG) and the legs of the left side. ...................................................................... 25
Tab. 7.1: Eigenschaften des Balkens bei Verwendung verschiedener Materialen.
Eigenfrequenz, Auslenkung am Balkenende und Dehnung wurden mit FEM
berechnet. .......................................................................................................... 29
1 Einleitung
1.1 Biomechanik der Ameisenlokomotion
1.1.1 Grundlegendes zur Lokomotion
Die Fortbewegung an Land erfolgt überwiegend auf Beinen. Einfache biomechanische Mo-
delle dienen zur Beschreibung und helfen grundlegende lokomotorische Mechanismen zu
identifizieren.
Als Lokomotion wird in der Biologie im Allgemeinen die aktive Fortbewegung eines
Individuums im Raum bezeichnet. Sie zählt zu den elementaren Merkmalen des Lebens und
spielt u. a. eine entscheidende Rolle bei der Futtersuche, der Paarung, der Flucht vor Angrei-
fern und dem Erschließen neuer Lebensräume. Im Laufe der Evolution hat sich eine Vielzahl
unterschiedlicher Arten der aquatischen, aerialen und terrestrischen Lokomotion entwickelt.
So stellen das Schwimmen und Fliegen die Hauptlokomotionsformen im Wasser bzw. in der
Luft dar. Gehen, Laufen, Hüpfen, Klettern, Hangeln und Kriechen bilden die häufigsten
Fortbewegungsarten an Land.
Bei der terrestrischen Lokomotion kommen meist muskelgetriebene Beine zum Ein-
satz, deren Wechselwirkung mit dem Boden zu einer gerichteten Bewegung führt. Bei Spin-
nen erfolgt die Beinflexion ebenfalls muskulär, allerdings ersetzt teilweise ein einzigartiger
hydraulischer Mechanismus die Extensoren (Parry & Brown, 1959). Die Extremitäten von
Schlangen sind fast vollkommen zurückgebildet, wodurch das Spektrum möglicher Fortbe-
wegungsarten stark limitiert ist und sich im Wesentlichen auf das typische Schlängeln be-
schränkt (Gray, 1946). Ähnliches gilt für Schnecken, welche ihre Fußsohlen in wellenför-
mige Bewegungen versetzen (Lissmann, 1945).
Üblicherweise werden für die Beschreibung und Einordnung der terrestrischen Loko-
motion einfache biomechanische Modelle herangezogen, welche neben kinematischen Pa-
rametern, auf der Mechanik des Körperschwerpunktes (KSP) und den Bodenreaktionskräf-
ten fußen. Mit diesen Modellen lassen sich verschiedene Gangarten identifizieren, welche
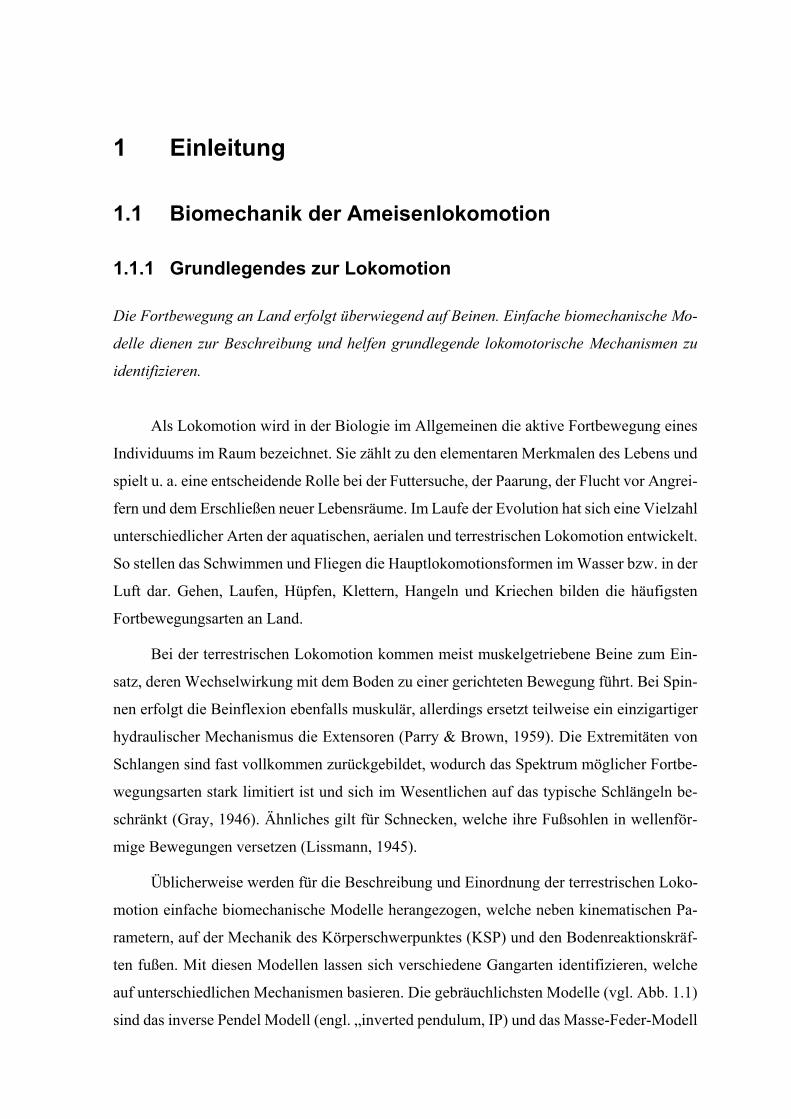
auf unterschiedlichen Mechanismen basieren. Die gebräuchlichsten Modelle (vgl. Abb. 1.1)
sind das inverse Pendel Modell (engl. „inverted pendulum, IP) und das Masse-Feder-Modell
1 Einleitung 2
(engl. „spring-loaded inverted pendulum“, SLIP). Beim menschlichen Gehen wird ein in-
verser Pendelmechanismus genutzt, welcher den effektiven Austausch zwischen potentieller
und kinetischer Energie ermöglicht (Alexander, 1991; Cavagna et al., 1976). Für schnellere
Gangarten, wie Laufen (bzw. Rennen), Traben, Galoppieren oder Hüpfen, wird ein Feder-
mechanismus genutzt, der auf der Speicherung und Rückgewinnung elastischer Energie in
Sehnen, Bändern und Muskeln beruht (Alexander, 1991; Blickhan, 1989; McMahon &
Cheng, 1990). Die kinetische und potentielle Energie des KSP verlaufen beim SLIP in- und
beim IP gegenphasig (Blickhan & Full, 1993; Cavagna et al., 1977). Als Maßzahlen für den
Phasenversatz bzw. die Übereinstimmung im Kurvenverlauf beider Energieformen, und da-
mit als mechanisches Unterscheidungskriterium zwischen Gehen und Rennen, dienen die
%Recovery und die %Congruity (Ahn et al., 2004; Cavagna et al., 1976).
Abb. 1.1: Grundlegende biomechanische Modelle der pedalen terrestrischen Lokomotion (aus Dickinson et al., 2000).
Die Erweiterung des SLIP-Modells zu einem zweibeinigen Masse-Feder-Modell
(engl. „bipedal spring-loaded inverted pendulum“, BSLIP) ermöglicht, durch Variation der
Federsteifigkeit, sowohl die Modellierung des zweiteleskopbeinigen Gehens, als auch des
Rennens (Geyer et al., 2006). Mit diesem Modell können Doppelstützphasen abgebildet wer-
den, welche typischerweise bei Gangarten ohne Flugphasen, wie Gehen oder „Grounded-
Running“, auftreten (Rubenson et al., 2004).
1 Einleitung 3
1.1.2 Lokomotion bei Insekten
Insekten nutzen größtenteils ein tripodales Schrittmuster. Die Kraftmuster und die globale
Dynamik können bei Ameisen durchaus von Mustern abweichen, die bisher an größeren
Spezies gewonnen wurden.
Innerhalb der Insekten existieren extrem schnelle und wendige Arten, die ihre Loko-
motion hervorragend an unterschiedliche Gegebenheiten anpassen können. Die Bewältigung
verschiedener Anstiege gelingt ihnen ebenso mühelos, wie das Überwinden von Unebenhei-
ten oder sehr glatten Untergründen (Duch & Pflüger, 1995; Federle et al., 2002; Full & Tu,
1991; Gladun & Gorb, 2007; Goldman et al., 2006; Graham & Cruse, 1981; Larsen et al.,
1995; Pelletier & Caissie, 2001; Seidl & Wehner, 2008; Sponberg & Full, 2008; Weihmann
& Blickhan, 2009). Wie Experimente an der Wüstenameise Cataglyphis fortis und der ame-
rikanischen Großschabe Periplaneta americana gezeigt haben, erreichen sie Geschwindig-
keiten von bis zu 50 Körperlängen pro Sekunde (Full & Tu, 1991; Seidl & Wehner, 2008;
Weihmann & Blickhan, 2009).
Einen ersten Hinweis auf die grundlegenden lokomotorischen Prinzipien liefern die
Schrittmuster. An einer Vielzahl von Insektenarten wurde bereits gezeigt, dass das alternie-
rende, tripodale Schrittmuster, ohne Flugphasen, über einen weiten Geschwindigkeitsbe-
reich aufrechterhalten wird (Delcomyn, 1971; Full et al., 1991; Full & Tu, 1991; Goldman
et al., 2006; Hughes, 1952; Seidl & Wehner, 2008; Weihmann & Blickhan, 2009; Zollikofer,
1994c). Nur vereinzelt und bei sehr schnellen Läufen ging Periplaneta americana zum
quadru- bzw. bipedalen Schrittmuster über (Full & Tu, 1991). Die konsequente Einhaltung
des Tripod-Ganges sowie die abgespreizte Beinhaltung ermöglicht es den Insekten jederzeit
schnelle Richtungswechsel durchzuführen und gewährleistet eine hohe statische Stabilität
(Ting et al., 1994).
Systematische Messungen der Bodenreaktionskräfte konzentrierten sich, vor allem aus
messtechnischen Gründen, ausschließlich auf wesentlich größere Tiere als Ameisen (Kör-
pergewicht > 1 g). So wurden Schaben (Full et al., 1991; Full & Tu, 1990; Full et al., 1995)
und Stabheuschrecken (Cruse, 1976) als Versuchsobjekte für sechsbeinige Arthropoden her-
angezogen. Die Bodenreaktionskraftverläufe der schnellen Lokomotion konnten sowohl in
der Sagittal- (Blickhan & Full, 1993), als auch in der Horizontalebene (Schmitt & Holmes,
2000; Seipel et al., 2004) über reduzierte Masse-Feder-Modelle erklärt werden. Auch die
1 Einleitung 4
mechanische Energie des KSP, deren kinetische und potentielle Beiträge annährend in Phase
verliefen, stützten das Bild des federartigen Ganges (Full & Tu, 1991).
Goldman et al. (2006) lieferten erste Einzelbein-Kraftmessungen für die vertikale Lo-
komotion (Klettern) der falschen Totenkopfschabe (Blaberus discoidalis). Diese unterschie-
den sich erwartungsgemäß deutlich von den Kraftmustern der ebenen Lokomotion. Während
des vertikalen Kletterns generierten alle Beine der Schwerkraft entgegengesetzte, d.h. sub-
stratparallele, Kräfte. Die vorderen beiden Beinpaare zogen seitlich in Richtung der Körper-
längsachse. Zeitgleich zogen die Vorderbeine den Kopf zur Wand, während die Hinterbeine
das Abdomen von ihr wegdrückten.
Da Ameisen eine ähnliche Kinematik zeigen wie Schaben, erwartet man auch ähnliche
Bodenreaktionskraftmuster. Jedoch sind Ameisen, deren Körpergewicht typischerweise
5 bis 30 mg beträgt, etwa 1000-fach leichter, als die schwersten Schabenarten. Bei derart
kleinen Tieren ist die Gravitationskraft höchstwahrscheinlich nicht mehr die dominante
Größe, im Vergleich zu anderen, bewegungsbeeinflussenden Kräften, wie Luftwiderstand,
Substrathaftung oder Gelenkreibung (Federle et al., 2000; Full & Koehl, 1993; Garcia et al.,
2000; Lipp et al., 2005). Vor diesem Hintergrund könnten Untersuchungen an Ameisen ab-
weichende dynamische Muster aufzeigen.
1.1.3 Die Orientierung von Ameisen
Mechanorezeptoren unterstützen die Orientierung von Ameisen. Die in diesem Zusammen-
hang vermutlich wesentliche Änderung der Lastverteilung bei der Überwindung von Stei-
gungen kann nur durch dynamische Messungen ermittelt werden.
Wenn sich Tiere bewegen, verfolgen sie meist ein konkretes Ziel, wie beispielsweise
den Erwerb von Nahrung. Die Lokomotion stellt in diesem Zusammenhang das Mittel zur
Überbrückung der Distanz zwischen dem aktuellen Standort und der potentiellen Nahrungs-
quelle dar. Unabhängig davon, ob die exakte Position der Nahrung bekannt ist, oder erst
gefunden werden muss, müssen sich die Tiere in ihrer Umwelt zurechtfinden. Dementspre-
chend ist die Lokomotion untrennbar mit der Orientierung verbunden.
Aufbauend auf den Erkenntnissen von v. Frisch (1974) zur Bienenorientierung, lieferte
die Arbeitsgruppe um Wehner von der Universität Zürich in den letzten Jahrzehnten um-
fangreiche Ergebnisse zum Thema der räumlichen Orientierung der Wüstenameise Catagly-
phis fortis (Bregy et al., 2008; Grah et al., 2007; Seidl & Wehner, 2008; Wehner, 2003;
1 Einleitung 5
Wittlinger et al., 2007a; Wittlinger et al., 2007b; Wohlgemuth et al., 2002; Wolf & Wehner,
2005). Die besondere Leistung der Tiere besteht darin, dass sie sich in ihrer – zumindest aus
Menschensicht – ausgesprochen strukturarmen Umwelt problemlos orientieren können. Die
Tiere entfernen sich bei der Nahrungssuche teilweise über hundert Meter vom Nest und lau-
fen anschließend fast geradlinig zum Ausgangspunkt zurück. Und das auch dann, wenn sie
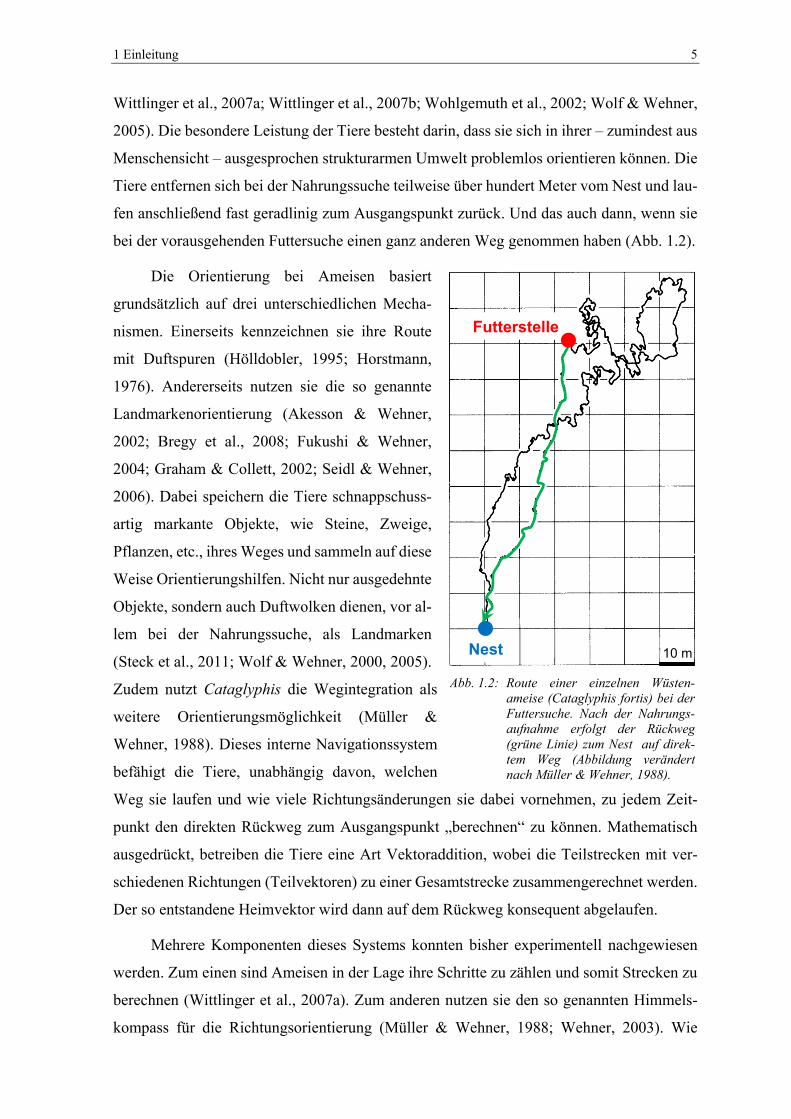
bei der vorausgehenden Futtersuche einen ganz anderen Weg genommen haben (Abb. 1.2).
Die Orientierung bei Ameisen basiert
grundsätzlich auf drei unterschiedlichen Mecha-
nismen. Einerseits kennzeichnen sie ihre Route
mit Duftspuren (Hölldobler, 1995; Horstmann,
1976). Andererseits nutzen sie die so genannte
Landmarkenorientierung (Akesson & Wehner,
2002; Bregy et al., 2008; Fukushi & Wehner,
2004; Graham & Collett, 2002; Seidl & Wehner,
2006). Dabei speichern die Tiere schnappschuss-
artig markante Objekte, wie Steine, Zweige,
Pflanzen, etc., ihres Weges und sammeln auf diese
Weise Orientierungshilfen. Nicht nur ausgedehnte
Objekte, sondern auch Duftwolken dienen, vor al-
lem bei der Nahrungssuche, als Landmarken
(Steck et al., 2011; Wolf & Wehner, 2000, 2005).
Zudem nutzt Cataglyphis die Wegintegration als
weitere Orientierungsmöglichkeit (Müller &
Wehner, 1988). Dieses interne Navigationssystem
befähigt die Tiere, unabhängig davon, welchen
Weg sie laufen und wie viele Richtungsänderungen sie dabei vornehmen, zu jedem Zeit-
punkt den direkten Rückweg zum Ausgangspunkt „berechnen“ zu können. Mathematisch
ausgedrückt, betreiben die Tiere eine Art Vektoraddition, wobei die Teilstrecken mit ver-
schiedenen Richtungen (Teilvektoren) zu einer Gesamtstrecke zusammengerechnet werden.
Der so entstandene Heimvektor wird dann auf dem Rückweg konsequent abgelaufen.
Mehrere Komponenten dieses Systems konnten bisher experimentell nachgewiesen
werden. Zum einen sind Ameisen in der Lage ihre Schritte zu zählen und somit Strecken zu
berechnen (Wittlinger et al., 2007a). Zum anderen nutzen sie den so genannten Himmels-
kompass für die Richtungsorientierung (Müller & Wehner, 1988; Wehner, 2003). Wie
Abb. 1.2: Route einer einzelnen Wüsten-ameise (Cataglyphis fortis) bei der Futtersuche. Nach der Nahrungs-aufnahme erfolgt der Rückweg (grüne Linie) zum Nest auf direk-tem Weg (Abbildung verändert nach Müller & Wehner, 1988).
Nest
Futterstelle
10 m
1 Einleitung 6
Wohlgemuth et al. (2002) bei Cataglyphis fortis erstmals nachgewiesen haben, funktioniert
die Wegintegration nicht nur in der Ebene, sondern auch bei dreidimensionalen Wegstre-
cken. Folglich rekonstruieren Ameisen die horizontale Projektion der tatsächlich zurückge-
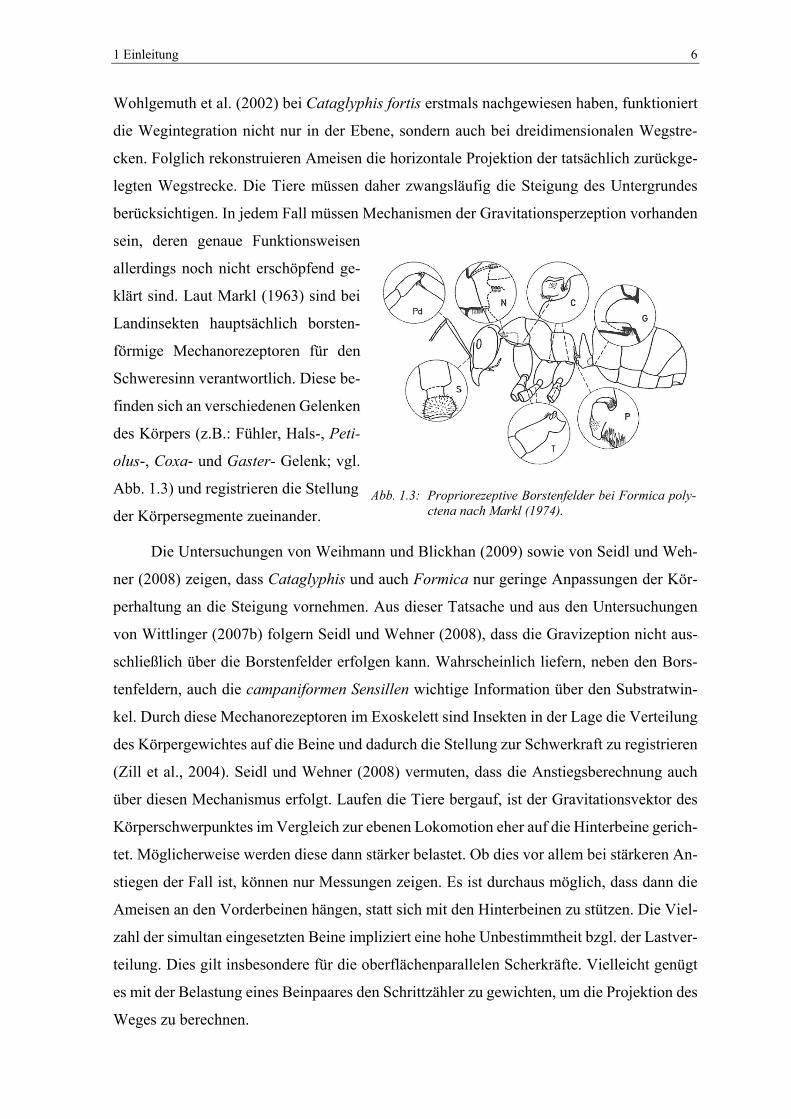
legten Wegstrecke. Die Tiere müssen daher zwangsläufig die Steigung des Untergrundes
berücksichtigen. In jedem Fall müssen Mechanismen der Gravitationsperzeption vorhanden
sein, deren genaue Funktionsweisen
allerdings noch nicht erschöpfend ge-
klärt sind. Laut Markl (1963) sind bei
Landinsekten hauptsächlich borsten-
förmige Mechanorezeptoren für den
Schweresinn verantwortlich. Diese be-
finden sich an verschiedenen Gelenken
des Körpers (z.B.: Fühler, Hals-, Peti-
olus-, Coxa- und Gaster- Gelenk; vgl.
Abb. 1.3) und registrieren die Stellung
der Körpersegmente zueinander.
Die Untersuchungen von Weihmann und Blickhan (2009) sowie von Seidl und Weh-
ner (2008) zeigen, dass Cataglyphis und auch Formica nur geringe Anpassungen der Kör-
perhaltung an die Steigung vornehmen. Aus dieser Tatsache und aus den Untersuchungen
von Wittlinger (2007b) folgern Seidl und Wehner (2008), dass die Gravizeption nicht aus-
schließlich über die Borstenfelder erfolgen kann. Wahrscheinlich liefern, neben den Bors-
tenfeldern, auch die campaniformen Sensillen wichtige Information über den Substratwin-
kel. Durch diese Mechanorezeptoren im Exoskelett sind Insekten in der Lage die Verteilung
des Körpergewichtes auf die Beine und dadurch die Stellung zur Schwerkraft zu registrieren
(Zill et al., 2004). Seidl und Wehner (2008) vermuten, dass die Anstiegsberechnung auch
über diesen Mechanismus erfolgt. Laufen die Tiere bergauf, ist der Gravitationsvektor des
Körperschwerpunktes im Vergleich zur ebenen Lokomotion eher auf die Hinterbeine gerich-
tet. Möglicherweise werden diese dann stärker belastet. Ob dies vor allem bei stärkeren An-
stiegen der Fall ist, können nur Messungen zeigen. Es ist durchaus möglich, dass dann die
Ameisen an den Vorderbeinen hängen, statt sich mit den Hinterbeinen zu stützen. Die Viel-
zahl der simultan eingesetzten Beine impliziert eine hohe Unbestimmtheit bzgl. der Lastver-
teilung. Dies gilt insbesondere für die oberflächenparallelen Scherkräfte. Vielleicht genügt
es mit der Belastung eines Beinpaares den Schrittzähler zu gewichten, um die Projektion des
Weges zu berechnen.
Abb. 1.3: Propriorezeptive Borstenfelder bei Formica poly-ctena nach Markl (1974).
1 Einleitung 7
1.1.4 Substrathaftung
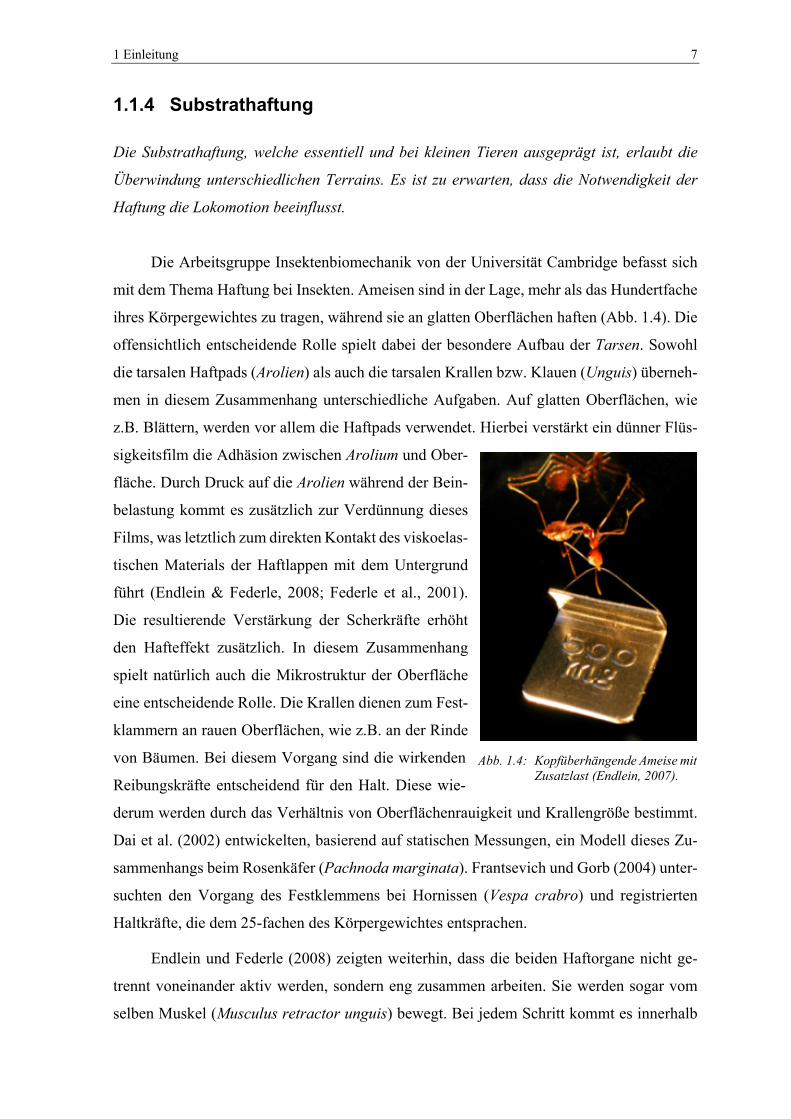
Die Substrathaftung, welche essentiell und bei kleinen Tieren ausgeprägt ist, erlaubt die
Überwindung unterschiedlichen Terrains. Es ist zu erwarten, dass die Notwendigkeit der
Haftung die Lokomotion beeinflusst.
Die Arbeitsgruppe Insektenbiomechanik von der Universität Cambridge befasst sich
mit dem Thema Haftung bei Insekten. Ameisen sind in der Lage, mehr als das Hundertfache
ihres Körpergewichtes zu tragen, während sie an glatten Oberflächen haften (Abb. 1.4). Die
offensichtlich entscheidende Rolle spielt dabei der besondere Aufbau der Tarsen. Sowohl
die tarsalen Haftpads (Arolien) als auch die tarsalen Krallen bzw. Klauen (Unguis) überneh-
men in diesem Zusammenhang unterschiedliche Aufgaben. Auf glatten Oberflächen, wie
z.B. Blättern, werden vor allem die Haftpads verwendet. Hierbei verstärkt ein dünner Flüs-
sigkeitsfilm die Adhäsion zwischen Arolium und Ober-
fläche. Durch Druck auf die Arolien während der Bein-
belastung kommt es zusätzlich zur Verdünnung dieses
Films, was letztlich zum direkten Kontakt des viskoelas-
tischen Materials der Haftlappen mit dem Untergrund
führt (Endlein & Federle, 2008; Federle et al., 2001).
Die resultierende Verstärkung der Scherkräfte erhöht
den Hafteffekt zusätzlich. In diesem Zusammenhang
spielt natürlich auch die Mikrostruktur der Oberfläche
eine entscheidende Rolle. Die Krallen dienen zum Fest-
klammern an rauen Oberflächen, wie z.B. an der Rinde
von Bäumen. Bei diesem Vorgang sind die wirkenden
Reibungskräfte entscheidend für den Halt. Diese wie-
derum werden durch das Verhältnis von Oberflächenrauigkeit und Krallengröße bestimmt.
Dai et al. (2002) entwickelten, basierend auf statischen Messungen, ein Modell dieses Zu-
sammenhangs beim Rosenkäfer (Pachnoda marginata). Frantsevich und Gorb (2004) unter-
suchten den Vorgang des Festklemmens bei Hornissen (Vespa crabro) und registrierten
Haltkräfte, die dem 25-fachen des Körpergewichtes entsprachen.
Endlein und Federle (2008) zeigten weiterhin, dass die beiden Haftorgane nicht ge-
trennt voneinander aktiv werden, sondern eng zusammen arbeiten. Sie werden sogar vom
selben Muskel (Musculus retractor unguis) bewegt. Bei jedem Schritt kommt es innerhalb
Abb. 1.4: Kopfüberhängende Ameise mitZusatzlast (Endlein, 2007).
1 Einleitung 8
eines Bruchteils einer Sekunde immer wieder zum selben Ablauf. Zunächst versucht das
Tier mit den Krallen Halt zu finden. Ist die Oberfläche zu glatt, rutschen diese ab, schwingen
nach unten durch und das Arolium wird entfaltet. Eine spezielle Drüse pumpt die Haftflüs-
sigkeit in die Haftpads, die dann zwischen den Krallen hervorragen. Der entstandene Flüs-
sigkeitsfilm bewirkt den Hafteffekt. Zu Beginn der sich anschließenden Schwungphase wird
das Arolium durch Abrollen vom Substrat gelöst ohne negative Bodenreaktionskräfte zu ge-
nerieren.
Schon seit längerem ist bekannt, dass die Tarsen von Schaben nicht nur mit einem,
sondern mit mehreren Hafteinrichtungen ausgestattet sind (Roth & Willis, 1952). Einerseits
sind an den proximalen Tarsomeren (Fußgliedern) die tarsalen Euplantulaen zu finden und
andererseits an der distalen Tarsus-Spitze das bereits angesprochene pretarsale Arolium.
Beide übernehmen gegensätzliche Funktionen. Die Euplantulaen sorgen für die Haftung
wenn die Beine vom Körper tangential nach vorn Druck ausüben sollen, hingegen erzeugen
die Arolien Kontakt beim tangentialen Zug nach hinten (Clemente & Federle, 2008).
Die Ausrichtung der Beine (vorn/hinten) und die Bewegungsrichtung (aufwärts/ab-
wärts) beeinflussen somit den Gebrauch der tarsalen Haftpads. Während der geradlinigen,
aufwärtsgerichteten Lokomotion beispielsweise, tragen die Vorderbeine durch Zug und die
Hinterbeine durch Druck zum Vortrieb bei. Dementsprechend werden vorn die Arolien und
hinten die Euplantulaen eingesetzt. Beim Abwärtslauf würde genau der entgegengesetzte
Fall eintreten. Insgesamt ist also die Ausprägung der Haftorgane entscheidend für das Spekt-
rum der möglichen Kraftübertragungen am Beinende. Es ist damit zu rechnen, dass der Auf-
bau des Kontaktkraftvektors durch die Haftorgane bestimmt wird. Die bereits angedeutete
hohe Unbestimmtheit der Kraftverteilung zwischen den Beinen wird sehr wahrscheinlich
durch die Haftmechanismen eingeschränkt (Günther & Weihmann, 2011, 2012). Dies aber,
je nach Anpassung, in unterschiedlicher Weise von Spezies zu Spezies.
1.1.5 Muskuläre Koordination
Aus der starren Kinematik zeichnet sich die Notwendigkeit einer komplexen, stark anstiegs-
abhängigen muskulären Koordination ab, deren Gesetzmäßigkeiten durch die Erfassung der
Lastverteilung eingegrenzt werden können.
Abgesehen von basal bestehenden Voraussetzungen – natürlich müssen die Beine der
Tiere netto das Körpergewicht tragen und Kippmomente ausbalancieren – können darüber
1 Einleitung 9
hinaus bestehende Gemeinsamkeiten helfen, die Kontrollstrategien innerhalb dieses Systems
mit ausgesprochen kleinem Hirn zu verstehen. Hierbei ist zu beachten, dass die unterschied-
liche Belastung der Beine, bei fast gleichbleibender Kinematik zu einer radikalen Änderung
der Anregungsmuster der Muskulatur führen muss. Ein Bein mit dem sich das Tier einen
Hang hoch zieht, muss wahrscheinlich hangabwärts bremsen. Zum einen ist die Aktivität
von Flexoren und zum anderen von Extensoren erforderlich. Die Erfassung der Reaktions-
kräfte ist somit die Voraussetzung zum Verständnis der flexiblen Leistungen des zentralen
Nervensystems (nicht nur) von Ameisen. Dies gilt umso mehr, als unsere eigenen Untersu-
chungen belegen, dass die an Schaben gewonnenen Muster sich nicht ohne weiteres auf
Ameisen übertragen lassen und speziell auch die geringe Größe durchaus deutliche Abwei-
chungen wahrscheinlich machen. Vielleicht lassen sich allgemeingültige, sensomotorische
Bauprinzipien und Verschaltungsstrukturen aufzeigen. Die auf bestimmte Bewegungsvor-
gaben gerichteten Koordinationsmuster könnten unter Berücksichtigung einfacher, lastab-
hängiger Rückkopplungen (basierend auf Mechanorezeptoren) erzeugt werden.
1 Einleitung 10
1.2 Bodenreaktionskraftmessung bei Ameisen
1.2.1 Stand der Technik
Verfügbare Sensoren sind für die Messung der Bodenreaktionskräfte von Ameisen nicht ge-
eignet, woraus sich die Notwendigkeit neuer Ansätze ergibt.
Für jegliche Form der pedalen Lokomotion sind die Bodenreaktionskräfte ein charak-
teristisches Merkmal und ein möglicher Zugang zur Berechnung innerer Kräfte. Deshalb ist
deren Erfassung fester Bestandteil einer umfassenden biomechanischen Analyse. Abhängig
von Kraftbereich und Versuchsobjekt steht eine Reihe von Messverfahren zur Verfügung.
Sie beruhen überwiegend auf dem Prinzip, wonach sich eine Struktur durch das Wirken einer
äußeren Kraft verformt – dieser Vorgang ist allein mikroskopisch sichtbar. Die Verformung
wird durch Sensoren erfasst, wobei in den meisten Fällen ein linearer Zusammenhang zwi-
schen Sensorsignal und eingeleiteter Kraft existiert. Im Auflösungsbereich von 1 mN bis
30 kN sind Messplatten zur Erfassung aller drei Kraftkomponenten (3D) kommerziell ver-
fügbar. Deren empfindlichste Vertreter sind geeignet, dreidimensionale Bodenreaktions-
kräfte von Kleinsäugern zu registrieren (Zumwalt et al., 2006). Aus unterschiedlichen Über-
legungen heraus, wurden inzwischen viele Kraftmessplatten, die in Studien an kleinen Tie-
ren eingesetzt werden, eigenständig konstruiert. Dementsprechend wurden in den letzten
Jahrzehnten Prototypen von Miniaturkraftmessplattformen für nur zwei Raumrichtungen
(2D) entwickelt, die ausreichend empfindlich waren, Bodenreaktionskräfte von Tieren zu
erfassen, deren Körpergewicht nur wenige Gramm beträgt (Drechsler & Federle, 2006; Full
& Tu, 1990; Heglund, 1981; Lin & Trimmer, 2012; Wood et al., 2009). Für diese wurde
immer wieder das Design von Heglund (1981) verwendet und an verschiedene Anwendungs-
bereiche angepasst. Neben andersgelagerten Überlegungen, führte die Modifizierung dieses
Designs zu den ersten 3D Kraftmessplatten im Millinewtonbereich (Autumn et al., 2006;
Blickhan & Barth, 1985; Dai et al., 2011; Full et al., 1991; Katz & Gosline, 1993). Wie
bereits erwähnt, wurden die ersten dreidimensionalen Bodenreaktionskraftmessungen
schnell laufender Insekten an Schaben durchgeführt (Full et al., 1991). Ihr durchschnittliches
Körpergewicht betrug etwa 2 g, womit die Messungen am unteren Rand des Auflösungsver-
mögens der verwendeten Kraftmessplatte erfolgten.
1 Einleitung 11
1.2.2 Die Fragilität der Mikrosystemtechnik
Insekten können in Relation zum eigenen Körpergewicht verhältnismäßig große Kräfte er-
zeugen, was die Verwendung ultrasensitiver Mikrosysteme verhindert und einen wichtigen
Aspekt bei der Materialauswahl eines alternativen Sensors darstellt.
Für die Erfassung der Dynamik noch leichterer Insekten, wie beispielsweise Ameisen
oder Käfer, sind die im vorherigen Abschnitt beschriebenen Sensoren nicht geeignet. In die-
sem Bereich könnten ultrasensitive Mikrosysteme (engl. „micro electro mechanical sys-
tems“, MEMS) ein geeignetes Mittel sein. Jedenfalls wurde deren prinzipielle Eignung für
die Insektenbiomechanik bereits demonstriert (Bartsch et al., 2007; Kan et al., 2013;
Muntwyler et al., 2010). Das Hauptproblem dieser Geräte besteht in ihrer Fragilität und der
resultierenden Enge des Messbereichs. Muntwyler et al. (2010) determinierten diesen mit
±200 μN für ihren Sensor. Im Grunde ist dieser Messbereich ideal für größere Ameisenarten,
wie Formica oder Cataglyphis, deren Körpergewicht meist zwischen 10 und 30 mg liegt.
Problematisch ist nur, dass gerade diese Tiere problemlos Kräfte erzeugen können, die ihr
eigenes Körpergewicht deutlich überschreiten. Cataglyphis fortis beispielsweise ist in der
Lage, Gewichte von 40 mg (0,39 mN) zwischen den Mandibeln zu tragen (Zollikofer,
1994b). Wie eigene Untersuchungen an Schaben zeigen, ist davon auszugehen, dass die
Beißkräfte noch viel höher sein können. Bei Periplaneta americana ermittelten wir maxi-
male Beißkräfte von etwa 500 mN, was etwa dem 50-fachen des Körpergewichtes der un-
tersuchten Tiere entspricht (Weihmann et al., in prep.). Wenn Ameisen ähnliche Beißkräfte
generieren können – was sehr wahrscheinlich ist – lägen diese Werte bei etwa 10 mN. Selbst
bei genauster Einpassung eines MEMS-Sensors in die Lauffläche, würden die Tiere diesen
sicherlich immer noch als Unregelmäßigkeit im Substrat erkennen und eventuell mit ihren
Tarsen oder Mandibeln bearbeiten. Würden sie dabei nur ansatzweise die prognostizierten
Maximalkräfte erreichen, käme es mit Sicherheit zur Beschädigung des Sensors. Eine Kraft-
messplattform für dieses Anwendungsfeld muss dementsprechend zwei, auf den ersten Blick
konträre, Anforderungen erfüllen. Sie muss zum einen hochempfindlich und zum anderen
relativ robust sein. Die Auswahl eines Materials, welches beiden Anforderungen gerecht
wird, ist daher ein Kernaspekt der Vorüberlegungen des Sensordesign.
1 Einleitung 12
1.2.3 Über die Auslegung von Kraftsensoren – Balkentheorie
Die Zusammenhänge der Balkentheorie determinieren das Sensordesign.
Wie im vorangegangenen Abschnitt dargestellt, beruhen die meisten Kraftsensoren auf
der Messung von Verformungen aufgrund einer äußeren Kraft. Häufig bestehen diese Sen-
soren aus Konstruktionen dreidimensional angeordneter Biegebalken, welche mit Deh-
nungsmessstreifen (DMS) bestückt sind. Idealerweise ist die Geometrie derart, dass jedes
Biegeelement auf nur eine Kraftkomponente (Fx, Fy oder Fz) reagiert. In diesem Fall gibt es
kein Übersprechen eines Messkanals auf einen anderen. Dementsprechend genügt für eindi-
mensionale Kraftsensoren ein einzelner Biegebalken. Aus der Balkentheorie ergeben sich
Zusammenhänge, die nicht nur für diesen Fall gelten, sondern auch auf mehrdimensionale
Sensoren übertragbar sind. Daher wird im Folgenden der einseitig eingespannte Biegebalken
herangezogen, um den Einfluss der Geometrie und des Materials auf die Eigenschaften des
Sensors darzustellen.
Wirkt eine vertikale Kraft F, am freien Ende eines horizontal eingespannten Balkens,
kommt es zu einer Auslenkung z in Richtung der Kraft (vgl. Abb. 7.2). Dabei wird der Bal-
ken an der Oberseite gedehnt und gleichermaßen an der Unterseite gestaucht. Die Dehnung
bzw. Stauchung ist nahe der Einspannung am größten und nimmt zum freien Ende hin ab.
Um das größtmögliche Messsignal zu erhalten würde man einen DMS folglich dicht an der
Einspannung applizieren. Im elastischen Teil der Biegung gilt das Hookesche Gesetz, nach
dem sich die elastische Verformung proportional zur wirkenden Belastung verhält. Die ent-
sprechende Proportionalitätskonstante wird auch als Elastizitätsmodul (E-Modul, E) be-
zeichnet und stellt eine wichtige Materialkonstante dar. Je größer der E-Modul, umso biege-
steifer ist das Material und umso geringer ist die Verformung bei gleicher Last. Übertragen
auf das Beispiel des Kragbalkens führt eine Erhöhung des E-Moduls zu einer geringeren
Auslenkung bzw. Oberflächendehnung.
Unter Kenntnis von E und den Abmessungen des Balkens (Länge l, Breite b und Höhe
h), lässt sich die Auslenkung am Balkenende z, bei Wirkung einer Kraft F (statische Balken-
biegung) mit Formel (1.1) berechnen (Grote & Feldhusen, 2011).
∙ ³
3 ∙ ∙1.1
1 Einleitung 13
Wobei das axiale Flächenträgheitsmoment (I) eines Balkens mit rechteckigem Querschnitt
folgendermaßen definiert ist:
112
∙ ³ ∙ 1.2
Durch Einsetzten von (1.2) in (1.1) ergibt sich:
4 ∙ ∙ ³∙ ∙ ³
1.3
Da die Auslenkung proportional zur wirkenden Kraft ist, repräsentiert der Biegebalken eine
Feder, deren Steifigkeit k durch die Proportionalität beider Größen bestimmt ist.
1.4
Durch Umstellen von (1.4) kann die Federsteifigkeit auch direkt über die Balkendimensio-
nen und den E-Modul berechnet werden.
∙ ∙ ³4 ∙ ³
1.5
Weiterhin lässt sich die dynamische Balkenbiegung als harmonischer Oszillator beschrei-
ben, dessen Eigenfrequenz f, mit Kenntnis der Steifigkeit und der effektiven Masse berech-
net werden können. Die effektive Masse ist das Produkt der Balkenmasse m und des Träg-
heitsmomentenfaktors, welcher bei rechtwinkligen Biegebalken 0,24 beträgt (Chen et al.,
1995).
1
2 ∙ 0,24 ∙1.6
Das Produkt von Materialdichte ρ und Volumen, welches bei einem Quader dem Produkt
seiner Abmessungen entspricht, ergibt dessen Masse. Ersetzt man dies mit m in Gleichung
(1.6) und ergänzt weiterhin die Steifigkeit gemäß Formel (1.5), erhält man f in Abhängigkeit
von den Materialeigenschaften (E, ρ) und den Balkendimensionen (l, b, h). Nach Kürzen der
Gleichung zeigt sich, dass die Breite b keinen Einfluss auf die Eigenfrequenz hat.
12 ∙
∙ ∙ ³4 ∙ ³
0,24 ∙ ∙ ∙ ∙1
2 ∙∙
0,96 ∙ ∙
1.7
1 Einleitung 14
1.2.4 Konsequenzen für den Sensorbau
Die Materialauswahl ist von entscheidender Bedeutung für die späteren Eigenschaften des
Sensors.
Eigenfrequenz, Steifigkeit und Dehnung sind wichtige Kenngrößen jedes Sensors und
müssen an den zu erwartenden Messbereich angepasst werden. Für alle Sensoren, die bei
dynamischen Messungen eingesetzt werden, ist die Eigenfrequenz von großer Bedeutung.
Generell gilt, dass der nutzbare Frequenzbereich umso größer wird, je höher die Eigenfre-
quenz des Aufnehmersystems ist (Giesecke, 2007). Zuverlässige Messergebnisse sind erst
bei Signalen zu erwartet, die unterhalb eines Drittels der Eigenfrequenz liegen. Aus Formel
(1.6) ergibt sich, dass ein Balken möglichst steif und leicht sein muss, um eine hohe Eigen-
frequenz zu haben. Aus dieser Sicht und gemäß (1.7) ist es somit sinnvoll, Materialien mit
großem E-Modul und geringer Dichte zu verwenden. Andererseits muss sichergestellt wer-
den, dass es im anvisierten Kraftbereich zu optimalen Dehnungen (durch Ausnutzen des
vollständigen Dehnungsbereiches des DMS) an den Applikationsstellen der DMS kommt,
ohne deren Elastizitätsgrenzen zu überschreiten. Die Auslenkung am Balkenende, also dem
Ort der Krafteinleitung, sollte bestenfalls mikroskopisch gering sein.
Bereits an dieser Stelle wird deutlich, dass die Materialauswahl von entscheidender
Bedeutung für den Sensorbau ist. Sie ist sogar die einzige Möglichkeit ein Dilemma zu um-
gehen, welches beim Vergleich von Formel (1.3) und (1.5) deutlich wird. Es äußert sich
darin, dass Steifigkeit und Verformung umgekehrt proportional zueinander sind. Besonders
die Länge l und Höhe h des Balkens, sind dahingehend äußerst empfindliche Stellgrößen, da
diese mit der dritten Potenz in die Berechnungen eingehen und sich konträr beeinflussen.
1 Einleitung 15
1.3 Hauptaspekte der Arbeit
Aus der Einleitung ergibt sich eine Reihe von Fragen, die im Rahmen der vorliegenden
Dissertation beantwortet werden sollen. Diese lassen sich in zwei übergeordnete Themen-
komplexe einordnen. Der erste Komplex ist methodisch orientiert und befasst sich mit der
Entwicklung eines Sensors zur Messung der Bodenreaktionskräfte kleinerer Insektenarten
(vorrangig Ameisen). Dieses Thema steht im Mittelpunkt des Artikels in Kapitel 3. Der
zweite Themenbereich untersucht verschiedene Fragen zur Biomechanik der Ameisenloko-
motion und wird in den Kapiteln 4-6 behandelt. Während die Kapitel 4 und 5 jeweils einem
Forschungsartikel zur ebenen Lokomotion entsprechen, sind die Ergebnisse aus Kapitel 6
noch nicht in Artikelform publiziert. Sie wurden allerdings als Poster auf der Jahrestagung
der Society for Experimental Biology im Juli 2013 präsentiert. Inhalt dieses Kapitels ist die
Dynamik von Formica polyctena bei unterschiedlichen Anstiegen.
Themenkomplex I (Bodenreaktionskraftmessung bei Ameisen)
(1) Welches Material eignet sich für den Bau einer Miniaturkraftmessplattform für den
Einsatz im Bereich der Insektenbiomechanik?
(2) Welches Design ermöglicht die unabhängige Erfassung dreidimensionaler Bodenre-
aktionskräfte im Mikronewtonbereich?
(3) Welches Fertigungsverfahren eignet sich für das gewählte Material und ermöglicht
die exakte Umsetzung der Konstruktion?
Themenkomplex II (Biomechanik der Ameisenlokomotion)
(1) Was verändern die Tiere mit wachsender Geschwindigkeit, bzw. gibt es einen Gang-
artwechsel bei Ameisen?
(2) Finden sich bei Ameisen dieselben kinematischen und dynamischen Muster wie bei
größeren Insektenarten (v. a. Schaben)?
(3) Welche biomechanischen Modelle können zur Beschreibung der Ameisenlokomo-
tion herangezogen werden?
(4) Wie energieeffizient ist die Lokomotion von Ameisen?
(5) Wie ändert sich die Beinbelastung bei der Bewältigung von Anstiegen und können
diese Information für die Gravizeption genutzt werden?
(6) Mit welcher Strategie bewältigen Waldameisen senkrechte Anstiege?
2 Übersicht zu den Artikeln
2.1 Reinhardt & Blickhan, 2014
Reinhardt, L., & Blickhan, R. (2014). Ultra-miniature force plate for meas-
uring triaxial forces in the micronewton range. J. Exp. Biol., 217(5),
704-710.
Inhalt
In diesem Artikel beschreiben wir das Design, die Herstellung und die Eichung einer
weiterentwickelten Ultraminiatur-Kraftmessplattform im Mikronewton-Bereich. Zudem
weisen wir die Funktionstüchtigkeit des Sensors anhand von Einzelmessungen an einer
Ameise und einer kleinen Metallkugel nach. Das Messgerät wurde stereolithographisch aus
PVC-ähnlichem Material hergestellt und mit Halbleiter-Dehnungsmesstreifen bestückt. Mit
einer Empfindlichkeit von 50 V N-1 ist die Auflösung dreidimensionaler Kräfte von 10 µN
möglich.
Arbeitsanteile gemäß Autorenvereinbarung
Lars Reinhardt
Entwicklung und Bau der Kraftmessplatte, Durchführung der Eichmessungen, Aus-
wertung der Daten, Erstellung des Manuskriptes
Reinhard Blickhan
Konzeptionelle Unterstützung, Überarbeitung des Manuskriptes
2 Übersicht zu den Artikeln 17
2.2 Reinhardt et al., 2009
Reinhardt, L., Weihmann, T., & Blickhan, R. (2009). Dynamics and kin-
ematics of ant locomotion: do wood ants climb on level surfaces?
J. Exp. Biol., 212(15), 2426-2435.
Inhalt
Aufgrund technischer Defizite im Bereich der Kraftmessung ist die Biomechanik der
Lokomotion kleinerer Tiere nur wenig erforscht. Die bisher vorhandenen Technologien li-
mitierten die Forschung auf Lebewesen mit einem Körpergewicht von über einem Gramm.
In dieser Publikation präsentieren wir erstmals gemessene Bodenreaktionskräfte von Wald-
ameisen mit einem durchschnittlichen Gewicht von etwa 10 mg. Hierzu kam eine selbstkon-
struierte Miniaturkaftmessplattform zum Einsatz, deren prinzipielles Design und Funktions-
prinzip beschrieben wird. Als Hauptergebnis wurde ermittelt, dass sich die Kraftverläufe
deutlich von denen schwererer Insekten unterscheiden. Die untersuchten Ameisen zeigten
ein ähnliches Muster wie kletternde Schaben.
Arbeitsanteile gemäß Autorenvereinbarung
Lars Reinhardt
Entwicklung der Methode, Durchführung der Messungen, Auswertung der Daten,
Erstellung des Manuskriptes
Tom Weihmann
Unterstützung bei der Erstellung des Manuskriptes
Reinhard Blickhan
Konzeptionelle Unterstützung, Überarbeitung des Manuskriptes
2 Übersicht zu den Artikeln 18
2.3 Reinhardt & Blickhan, 2014
Reinhardt, L., & Blickhan, R. (2014). Level locomotion in wood ants:
evidence for grounded running. J. Exp. Biol., 217(13), 2358-2370.
Inhalt
Zum besseren Verständnis der lokomotorischen Strategien kleiner Insekten unter-
suchten wir die schnelle, geradlinige Lokomotion der einheimischen Ameisenart Formica
polyctena in der Ebene. Im vorliegenden Manuskript präsentieren wir die dreidimensionale
Kinematik des Körperschwerpunktes sowie die Bodenreaktionskräfte der Einzelbeine. Un-
sere Ergebnisse zeigen, dass die Tiere dieselbe Gangart über einen weiten Geschwindig-
keitsbereich verwendeten. Die Lokomotion ist federnd, es existieren keine Flugphasen und
der Körperschwerpunkt zeigt relativ geringe vertikale Oszillationen. Die Gesamtheit dieser
Befunde deutet in Richtung „Grounded-Running“, welches bereits für andere kleine Tiere
nachgewiesen wurde.
Arbeitsanteile gemäß Autorenvereinbarung
Lars Reinhardt
Entwicklung der Methode, Durchführung der Messungen, Auswertung der Daten,
Erstellung des Manuskriptes
Reinhard Blickhan
Konzeptionelle Unterstützung, Überarbeitung des Manuskriptes
3 Artikel I (Ultra-miniature force plate)
Ultra-miniature force plate for measuring
triaxial forces in the micro newton range
Reinhardt, L.1, Blickhan, R.1
The Journal of Experimental Biology, 217(5), 704-710, 2014
Akzeptiert: 7. November 2013
1 Friedrich-Schiller-Universität Jena
Institut für Sportwissenschaft
LS Bewegungswissenschaft
Seidelstr. 20
07749 Jena, Deutschland
Korrespondierender Autor
Lars Reinhardt
Email: [email protected]
Tel.: +49 3641 9 45706
© The Company of Biologists, 2014
The
Jour
nal o
f Exp
erim
enta
l Bio
logy
704
© 2014. Published by The Company of Biologists Ltd | The Journal of Experimental Biology (2014) 217, 704-710 doi:10.1242/jeb.094177
ABSTRACTMeasuring the ground reaction forces of a single leg is indispensableto understanding the dynamics of legged locomotion. Because of thetechnical state of the art, investigations are limited to animals with abody mass above 1 g. Here we present the design, fabrication,calibration and performance of a novel ultra-miniature force platformat the micronewton level. The sensor was built using thestereolithography technology and is equipped with semiconductorstrain gauges. We found a highly linear signal response in thecalibrated force range to ±1300 μN. Individual tests revealed that ourforce plate still shows a linear response at forces as great as 4 mN,confirming a large measuring range and particular robustness. Thesensitivity was above 50 V N−1 in all directions, which makes itpossible to resolve forces of 10 μN. We demonstrated the suitabilityof the device on the basis of a typical ground reaction forcemeasurement of an ant, Formica polyctena.
KEY WORDS: 3D reaction force, Miniature force plate, Triaxial forcemeasurement, Insect biomechanics, Small animal
INTRODUCTIONGround reaction forces represent the ‘footprint’ of the dynamics oflegged locomotion. Depending on the force range and the object ofinvestigation, a number of measurement techniques are available(Table 1). Each of these is based on deformations of measuringinstruments when a force is applied. Accordingly, in most cases,cantilevers equipped with strain gauges or piezo elements are used assensing units. In the range from 1 mN up to 30 kN, three-dimensional(3D) force plates are commercially available from differentmanufacturers. However, for a variety of reasons, many force sensorsused in biomechanical studies on small animals are custom-made.Over the last few decades, several researchers have developed two-dimensional miniature force plates for species weighing only a fewgrams (Heglund, 1981; Full and Tu, 1990; Drechsler and Federle,2006; Wood et al., 2009; Lin and Trimmer, 2012). Versions of theHeglund (Heglund, 1981) force plate design were most often used todesign measuring instruments for animals of different size.Furthermore, it was possible to build 3D force plates via theadvancement of this design (Full et al., 1991; Katz and Gosline, 1993;Autumn et al., 2006; Dai et al., 2011). Another approach consistingof bronze springs with attached strain gauges led to a force platewithin the same sensitivity range (Blickhan and Barth, 1985).Unfortunately, none of these devices are suitable to resolve 3D forcesat the micronewton level. They are therefore not able to capture thedynamics of small insects, for example, in the size range of an ant.
METHODS & TECHNIQUES
Science of Motion, Friedrich-Schiller-University Jena, Seidelstr. 20, 07749 Jena,Germany
*Author for correspondence ([email protected])
Received 18 July 2013; Accepted 7 November 2013
In this area, ultrasensitive, silicon-based microelectromechanicalsystems (MEMS) devices seem to be the method of choice. Variousprototypes and their principal usability in the field of insectbiomechanics have already been demonstrated (Bartsch et al., 2007;Muntwyler et al., 2010; Kan et al., 2013). However, a majorproblem with these sensors is their high fragility and the associatedsmall measuring range. Muntwyler and colleagues reported a forcerange for their device from ±20 to ±200 μN (Muntwyler et al.,2010). Ants are able to generate forces up to a multiple of their ownweight with their mandibles. Measurements have been publishedshowing that ants of the species Cataglyphis fortis could easily carryloads of 40 mg (Zollikofer, 1994). It is to be expected that theseanimals may generate much higher forces with their mandibles andlegs, which would damage the MEMS devices.
In a first attempt, we have succeeded in building a 3D miniatureforce plate based on PVC springs as well as measuring groundreaction forces in ants (Reinhardt et al., 2009). This sensorcombined an adequate sensitivity and robustness for our task.However, this design variant, consisting of a horizontal bar cross-connected with two orthogonally oriented bars, caused undesirablecrosstalk effects. In this paper, we present a detailed description ofa further development of our first prototype with significantly lowercrosstalk between the channels.
RESULTSStatic calibrationMean sensor outputs versus loading force are plotted in Fig. 1 andthe corresponding values are shown in Table 2. There is a highlinearity between output voltage and applied force in all directionsof the sensor. Coefficients of determination (r2) of the linearregressions were found to be nearly 1.0 for all piezoresistors. Basedon these results, we determined the sensitivity matrix K−1:
Calculating the inverse of K−1 provides the characteristic matrixK:
Inserting K in Eqn 13 (see Materials and methods) results in thefollowing matrix equation:
=⎛
⎝
⎜⎜
⎞
⎠
⎟⎟ μK
–0.0978 0.0295 –0.0007–0.0057 –0.1976 –0.00400.0010 –0.0013 –0.0510
mv / N . (1)–1
=⎛
⎝
⎜⎜
⎞
⎠
⎟⎟ μK
–10.13 –1.51 0.270.30 –5.02 0.39–0.28 0.13 –19.60
N / mv . (2)
⎛
⎝
⎜⎜⎜
⎞
⎠
⎟⎟⎟=
⎛
⎝
⎜⎜
⎞
⎠
⎟⎟
⎛
⎝
⎜⎜⎜
⎞
⎠
⎟⎟⎟
FF
F
UU
U
–10.13 –1.51 0.270.30 –5.02 0.39–0.28 0.13 –19.60
. (3)x
y
z
x
y
z
Ultra-miniature force plate for measuring triaxial forces in themicronewton rangeLars Reinhardt* and Reinhard Blickhan
The
Jour
nal o
f Exp
erim
enta
l Bio
logy
705
METHODS & TECHNIQUES The Journal of Experimental Biology (2014) doi:10.1242/jeb.094177
For the piezoresistors of the three directions (x, y and z), wedetermined the following regressions:
Matrix K and Fig. 1 confirm the predictions of the finite elementanalysis concerning the decoupling (crosstalk <2%) of the z-direction from the other two directions. Similarly, there is crosstalkbelow 6% in the x-direction when forces act along the y-axis.Surprisingly, we found crosstalk between Fx and Fy (see Fig. 1A).With respect to the calibrated forces, this effect is in the range of15%. This behaviour can be corrected, because a highly significantrelationship was determined through linear regression:
Dependence on site of force applicationThe z-component is largely independent (<5%) of the site (±2 mm) offorce application (see Fig. 3D). As predicted by modelling, thevertically oriented bending beams changed their signals at off-centrevertical loads (Fig. 2D). Here Sx only responds to shifts of the point of
= = =F U U r N( ) –10.13 , 0.997, 40 , (4)x x x2
= = =F U U r N( ) –5.02 , 0.999, 40 , (5)y y y2
= = =F U U r N( ) –19.60 , 0.997, 25 . (6)z z z2
= = =F F F r N( ) –0.1491 , 0.988, 40 . (7)y x x2
force application in the x-direction and Sy only to changes in the y-direction. In each direction, a significant (r2>0.937) relationshipbetween position and signal of the corresponding sensor exists. This isdirectly proportional to the signal of the vertical force sensor (Sz). Withknowledge of Sz and the x- and y-coordinates of the point of forceapplication, this effect could be corrected with the following equations:
One example of a static calibration experiment including forcecalculation under application of all corrective calculations is shownin Fig. 2.
Dynamic calibrationThe dynamic calibration led to similar results as in the staticexperiments (Fig. 3). Because the calibration events had an averageduration of 57.2±8.6 ms, which is approximately equal to the contacttime of an ant leg during running (see Fig. 6), these trials verify theapplicability of the sensor in the field of insect biomechanics.Through the software-supported identification of the site of forceapplication, accuracy and spatial resolution was clearly higher thanin the static experiments. Accordingly, quantity and quality of thedata set and thus reliability of the results were much higher.
= = =S S x S x r N( , ) (–0.3790 – 0.0371), 0.987, 45 , (8)x z z2
= + = =S S y S y r N( , ) (–0.2453 0.0568), 0.937, 45 . (9)y z z2
–1 0 1–200
0
200
Sig
nal (
mV
)
x-direction
–1 0 1–200
0
200
Force (mN)
y-direction
–1.5 –0.5 0.5–200
0
200z-directionA B C
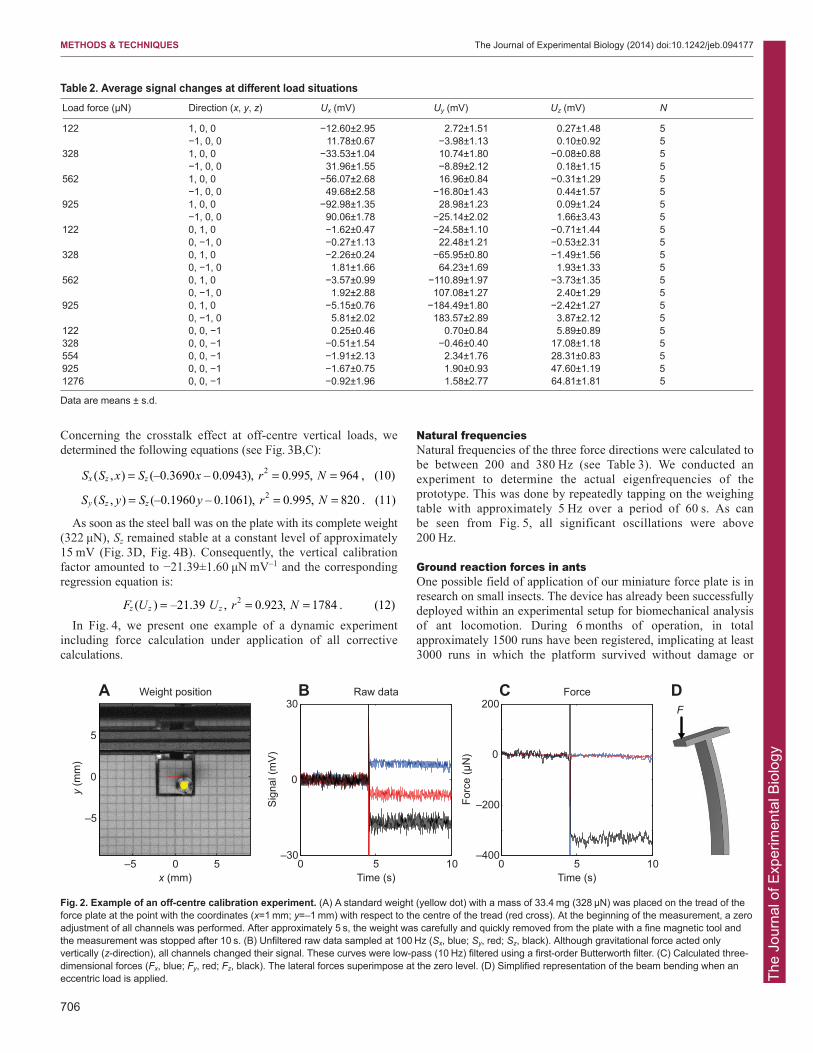
Fig. 1. Three-dimensional calibration of the force plate using standard weights between 12 and 130 mg (0.12–1.28 mN). The coloured points representthe signal changes of the strain gauges with respect to the applied load force. In each plot, the same colour scheme is used: Sx, blue; Sy, red; Sz, black. Foreach direction, regression lines are shown (see Eqns 4–6). As standard deviations are smaller than the marker size, no error bars are plotted (see Table 2).
Table 1. Prior measurement techniques
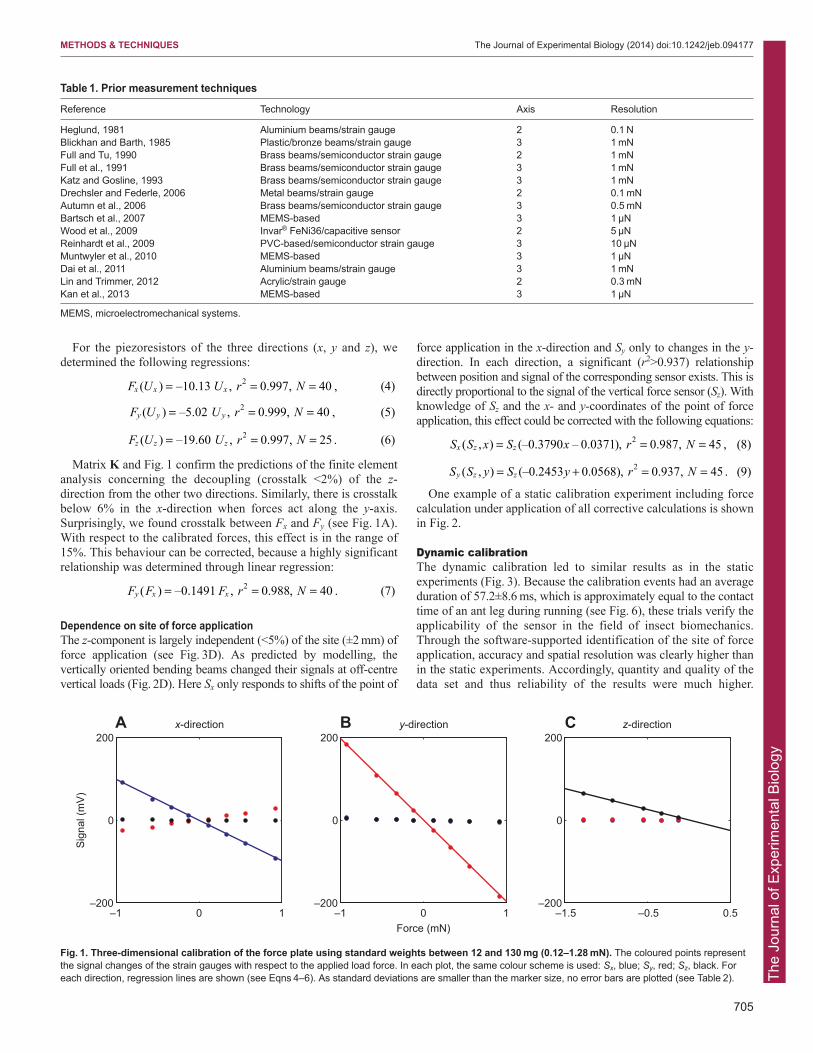
Reference Technology Axis Resolution
Heglund, 1981 Aluminium beams/strain gauge 2 0.1 NBlickhan and Barth, 1985 Plastic/bronze beams/strain gauge 3 1 mNFull and Tu, 1990 Brass beams/semiconductor strain gauge 2 1 mNFull et al., 1991 Brass beams/semiconductor strain gauge 3 1 mNKatz and Gosline, 1993 Brass beams/semiconductor strain gauge 3 1 mNDrechsler and Federle, 2006 Metal beams/strain gauge 2 0.1 mNAutumn et al., 2006 Brass beams/semiconductor strain gauge 3 0.5 mNBartsch et al., 2007 MEMS-based 3 1 µNWood et al., 2009 Invar® FeNi36/capacitive sensor 2 5 µNReinhardt et al., 2009 PVC-based/semiconductor strain gauge 3 10 µNMuntwyler et al., 2010 MEMS-based 3 1 µNDai et al., 2011 Aluminium beams/strain gauge 3 1 mNLin and Trimmer, 2012 Acrylic/strain gauge 2 0.3 mNKan et al., 2013 MEMS-based 3 1 µN
MEMS, microelectromechanical systems.
The
Jour
nal o
f Exp
erim
enta
l Bio
logy
706
METHODS & TECHNIQUES The Journal of Experimental Biology (2014) doi:10.1242/jeb.094177
Concerning the crosstalk effect at off-centre vertical loads, wedetermined the following equations (see Fig. 3B,C):
As soon as the steel ball was on the plate with its complete weight(322 μN), Sz remained stable at a constant level of approximately15 mV (Fig. 3D, Fig. 4B). Consequently, the vertical calibrationfactor amounted to −21.39±1.60 μN mV–1 and the correspondingregression equation is:
In Fig. 4, we present one example of a dynamic experimentincluding force calculation under application of all correctivecalculations.
= = =S S x S x r N( , ) (–0.3690 – 0.0943), 0.995, 964 , (10)x z z2
= = =S S y S y r N( , ) (–0.1960 – 0.1061), 0.995, 820 . (11)y z z2
= = =F U U r N( ) –21.39 , 0.923, 1784 . (12)z z z2
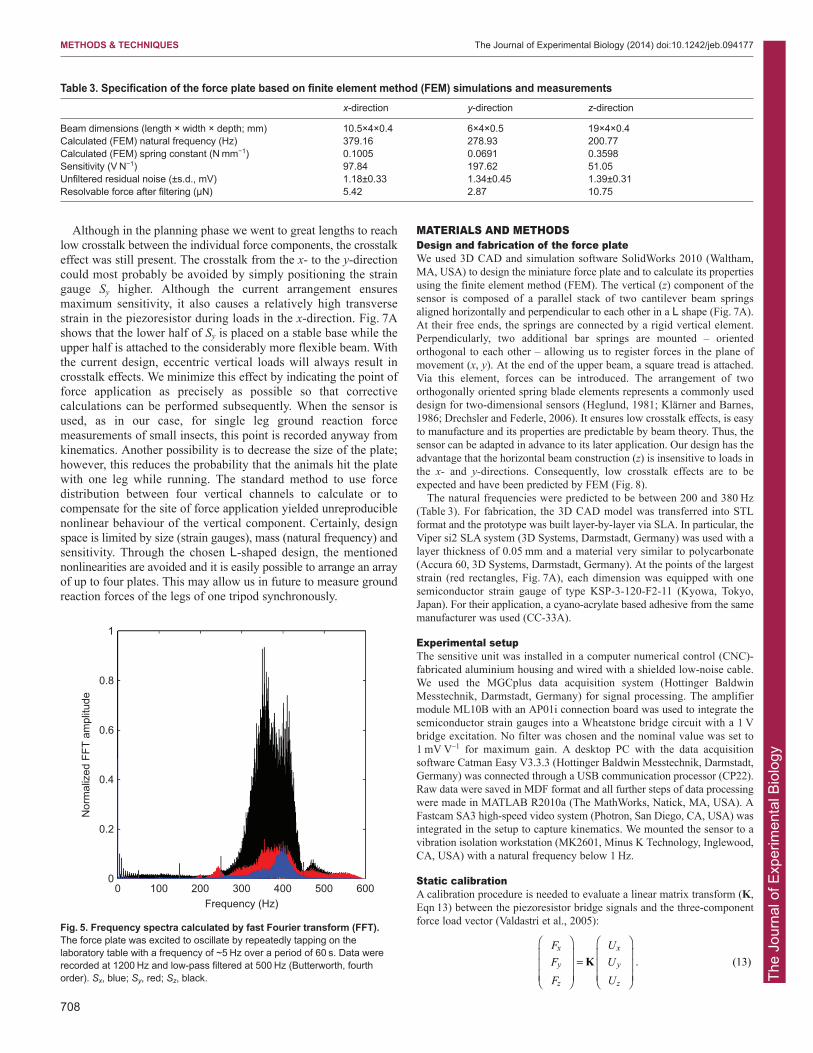
Natural frequenciesNatural frequencies of the three force directions were calculated tobe between 200 and 380 Hz (see Table 3). We conducted anexperiment to determine the actual eigenfrequencies of theprototype. This was done by repeatedly tapping on the weighingtable with approximately 5 Hz over a period of 60 s. As can be seen from Fig. 5, all significant oscillations were above 200 Hz.
Ground reaction forces in antsOne possible field of application of our miniature force plate is inresearch on small insects. The device has already been successfullydeployed within an experimental setup for biomechanical analysisof ant locomotion. During 6 months of operation, in totalapproximately 1500 runs have been registered, implicating at least3000 runs in which the platform survived without damage or
Table 2. Average signal changes at different load situationsLoad force (µN) Direction (x, y, z) Ux (mV) Uy (mV) Uz (mV) N
122 1, 0, 0 −12.60±2.95 2.72±1.51 0.27±1.48 5−1, 0, 0 11.78±0.67 −3.98±1.13 0.10±0.92 5
328 1, 0, 0 −33.53±1.04 10.74±1.80 −0.08±0.88 5−1, 0, 0 31.96±1.55 −8.89±2.12 0.18±1.15 5
562 1, 0, 0 −56.07±2.68 16.96±0.84 −0.31±1.29 5−1, 0, 0 49.68±2.58 −16.80±1.43 0.44±1.57 5
925 1, 0, 0 −92.98±1.35 28.98±1.23 0.09±1.24 5−1, 0, 0 90.06±1.78 −25.14±2.02 1.66±3.43 5
122 0, 1, 0 −1.62±0.47 −24.58±1.10 −0.71±1.44 50, −1, 0 −0.27±1.13 22.48±1.21 −0.53±2.31 5
328 0, 1, 0 −2.26±0.24 −65.95±0.80 −1.49±1.56 50, −1, 0 1.81±1.66 64.23±1.69 1.93±1.33 5
562 0, 1, 0 −3.57±0.99 −110.89±1.97 −3.73±1.35 50, −1, 0 1.92±2.88 107.08±1.27 2.40±1.29 5
925 0, 1, 0 −5.15±0.76 −184.49±1.80 −2.42±1.27 50, −1, 0 5.81±2.02 183.57±2.89 3.87±2.12 5
122 0, 0, −1 0.25±0.46 0.70±0.84 5.89±0.89 5328 0, 0, −1 −0.51±1.54 −0.46±0.40 17.08±1.18 5554 0, 0, −1 −1.91±2.13 2.34±1.76 28.31±0.83 5925 0, 0, −1 −1.67±0.75 1.90±0.93 47.60±1.19 51276 0, 0, −1 −0.92±1.96 1.58±2.77 64.81±1.81 5
Data are means ± s.d.
Weight position
x (mm)
y (m
m)
–5 0 5
5
0
–5
0 5 10–30
0
30Raw data
Time (s)
Sig
nal (
mV
)
0 5 10–400
–200
0
200Force
Time (s)
Forc
e (μ
N)
A B C DF
Fig. 2. Example of an off-centre calibration experiment. (A) A standard weight (yellow dot) with a mass of 33.4 mg (328 μN) was placed on the tread of theforce plate at the point with the coordinates (x=1 mm; y=–1 mm) with respect to the centre of the tread (red cross). At the beginning of the measurement, a zeroadjustment of all channels was performed. After approximately 5 s, the weight was carefully and quickly removed from the plate with a fine magnetic tool andthe measurement was stopped after 10 s. (B) Unfiltered raw data sampled at 100 Hz (Sx, blue; Sy, red; Sz, black). Although gravitational force acted onlyvertically (z-direction), all channels changed their signal. These curves were low-pass (10 Hz) filtered using a first-order Butterworth filter. (C) Calculated three-dimensional forces (Fx, blue; Fy, red; Fz, black). The lateral forces superimpose at the zero level. (D) Simplified representation of the beam bending when aneccentric load is applied.
The
Jour
nal o
f Exp
erim
enta
l Bio
logy
707
METHODS & TECHNIQUES The Journal of Experimental Biology (2014) doi:10.1242/jeb.094177
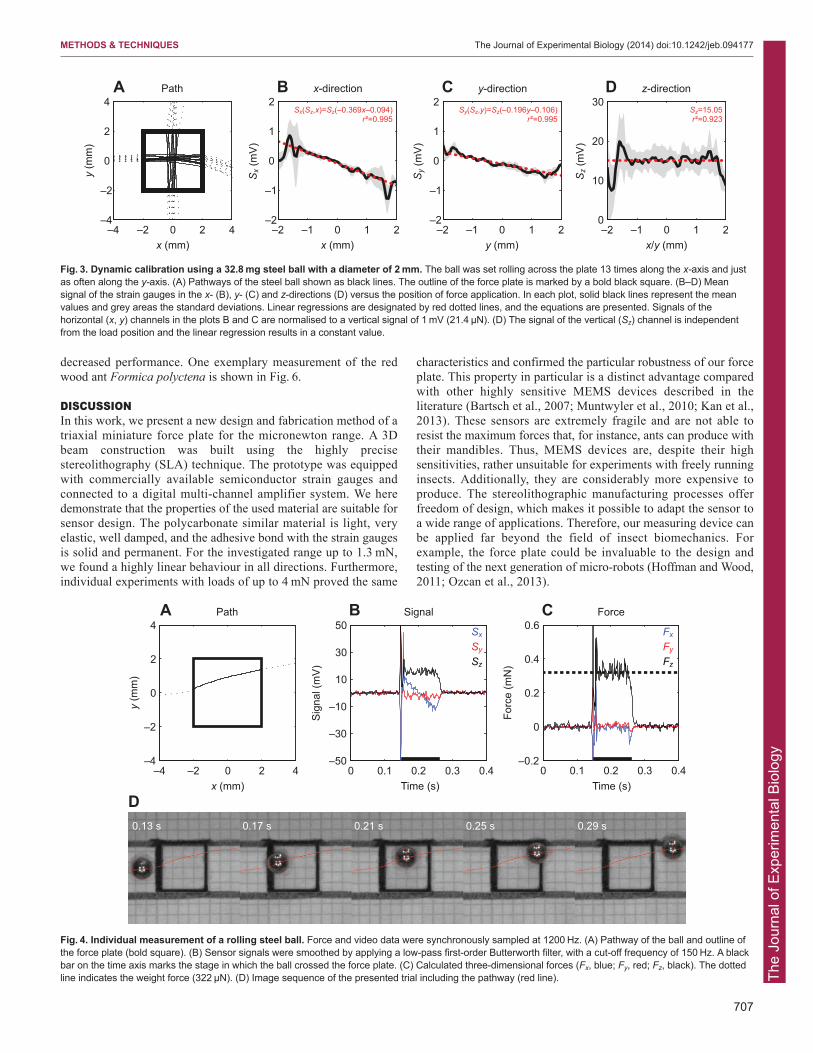
decreased performance. One exemplary measurement of the redwood ant Formica polyctena is shown in Fig. 6.
DISCUSSIONIn this work, we present a new design and fabrication method of atriaxial miniature force plate for the micronewton range. A 3Dbeam construction was built using the highly precisestereolithography (SLA) technique. The prototype was equippedwith commercially available semiconductor strain gauges andconnected to a digital multi-channel amplifier system. We heredemonstrate that the properties of the used material are suitable forsensor design. The polycarbonate similar material is light, veryelastic, well damped, and the adhesive bond with the strain gaugesis solid and permanent. For the investigated range up to 1.3 mN,we found a highly linear behaviour in all directions. Furthermore,individual experiments with loads of up to 4 mN proved the same
characteristics and confirmed the particular robustness of our forceplate. This property in particular is a distinct advantage comparedwith other highly sensitive MEMS devices described in theliterature (Bartsch et al., 2007; Muntwyler et al., 2010; Kan et al.,2013). These sensors are extremely fragile and are not able toresist the maximum forces that, for instance, ants can produce withtheir mandibles. Thus, MEMS devices are, despite their highsensitivities, rather unsuitable for experiments with freely runninginsects. Additionally, they are considerably more expensive toproduce. The stereolithographic manufacturing processes offerfreedom of design, which makes it possible to adapt the sensor toa wide range of applications. Therefore, our measuring device canbe applied far beyond the field of insect biomechanics. Forexample, the force plate could be invaluable to the design andtesting of the next generation of micro-robots (Hoffman and Wood,2011; Ozcan et al., 2013).
–4 –2 0 2 4–4
–2
0
2
4
x (mm)
y (m
m)
Path
x (mm)S
x (m
V)
x-direction
–2 –1 0 1 2–2
–1
0
1
2
y (mm)
Sy (
mV
)
y-direction
–2 –1 0 1 2–2
–1
0
1
2
x/y (mm)
Sz (
mV
)
z-direction
–2 –1 0 1 20
10
20
30Sx(Sz,x)=Sz(–0.369x–0.094)
r²=0.995Sy(Sz,y)=Sz(–0.196y–0.106)
r²=0.995Sz=15.05r²=0.923
A B C D
Fig. 3. Dynamic calibration using a 32.8 mg steel ball with a diameter of 2 mm. The ball was set rolling across the plate 13 times along the x-axis and justas often along the y-axis. (A) Pathways of the steel ball shown as black lines. The outline of the force plate is marked by a bold black square. (B–D) Meansignal of the strain gauges in the x- (B), y- (C) and z-directions (D) versus the position of force application. In each plot, solid black lines represent the meanvalues and grey areas the standard deviations. Linear regressions are designated by red dotted lines, and the equations are presented. Signals of thehorizontal (x, y) channels in the plots B and C are normalised to a vertical signal of 1 mV (21.4 μN). (D) The signal of the vertical (Sz) channel is independentfrom the load position and the linear regression results in a constant value.
–4 –2 0 2 4–4
–2
0
2
4
x (mm)
y (m
m)
Path
0 0.1 0.2 0.3 0.4–50
–30
–10
10
30
50
Time (s)
Sig
nal (
mV
)
Signal
0 0.1 0.2 0.3 0.4–0.2
0
0.2
0.4
0.6
Time (s)
Forc
e (m
N)
ForceA
D
B C
0.13 s 0.17 s 0.21 s 0.25 s 0.29 s
Sx
Sy
Sz
Fx
Fy
Fz
Fig. 4. Individual measurement of a rolling steel ball. Force and video data were synchronously sampled at 1200 Hz. (A) Pathway of the ball and outline ofthe force plate (bold square). (B) Sensor signals were smoothed by applying a low-pass first-order Butterworth filter, with a cut-off frequency of 150 Hz. A blackbar on the time axis marks the stage in which the ball crossed the force plate. (C) Calculated three-dimensional forces (Fx, blue; Fy, red; Fz, black). The dottedline indicates the weight force (322 μN). (D) Image sequence of the presented trial including the pathway (red line).
The
Jour
nal o
f Exp
erim
enta
l Bio
logy
708
METHODS & TECHNIQUES The Journal of Experimental Biology (2014) doi:10.1242/jeb.094177
Although in the planning phase we went to great lengths to reachlow crosstalk between the individual force components, the crosstalkeffect was still present. The crosstalk from the x- to the y-directioncould most probably be avoided by simply positioning the straingauge Sy higher. Although the current arrangement ensuresmaximum sensitivity, it also causes a relatively high transversestrain in the piezoresistor during loads in the x-direction. Fig. 7Ashows that the lower half of Sy is placed on a stable base while theupper half is attached to the considerably more flexible beam. Withthe current design, eccentric vertical loads will always result incrosstalk effects. We minimize this effect by indicating the point offorce application as precisely as possible so that correctivecalculations can be performed subsequently. When the sensor isused, as in our case, for single leg ground reaction forcemeasurements of small insects, this point is recorded anyway fromkinematics. Another possibility is to decrease the size of the plate;however, this reduces the probability that the animals hit the platewith one leg while running. The standard method to use forcedistribution between four vertical channels to calculate or tocompensate for the site of force application yielded unreproduciblenonlinear behaviour of the vertical component. Certainly, designspace is limited by size (strain gauges), mass (natural frequency) andsensitivity. Through the chosen L-shaped design, the mentionednonlinearities are avoided and it is easily possible to arrange an arrayof up to four plates. This may allow us in future to measure groundreaction forces of the legs of one tripod synchronously.
MATERIALS AND METHODSDesign and fabrication of the force plateWe used 3D CAD and simulation software SolidWorks 2010 (Waltham,MA, USA) to design the miniature force plate and to calculate its propertiesusing the finite element method (FEM). The vertical (z) component of thesensor is composed of a parallel stack of two cantilever beam springsaligned horizontally and perpendicular to each other in a L shape (Fig. 7A).At their free ends, the springs are connected by a rigid vertical element.Perpendicularly, two additional bar springs are mounted – orientedorthogonal to each other – allowing us to register forces in the plane ofmovement (x, y). At the end of the upper beam, a square tread is attached.Via this element, forces can be introduced. The arrangement of twoorthogonally oriented spring blade elements represents a commonly useddesign for two-dimensional sensors (Heglund, 1981; Klärner and Barnes,1986; Drechsler and Federle, 2006). It ensures low crosstalk effects, is easyto manufacture and its properties are predictable by beam theory. Thus, thesensor can be adapted in advance to its later application. Our design has theadvantage that the horizontal beam construction (z) is insensitive to loads inthe x- and y-directions. Consequently, low crosstalk effects are to beexpected and have been predicted by FEM (Fig. 8).
The natural frequencies were predicted to be between 200 and 380 Hz(Table 3). For fabrication, the 3D CAD model was transferred into STLformat and the prototype was built layer-by-layer via SLA. In particular, theViper si2 SLA system (3D Systems, Darmstadt, Germany) was used with alayer thickness of 0.05 mm and a material very similar to polycarbonate(Accura 60, 3D Systems, Darmstadt, Germany). At the points of the largeststrain (red rectangles, Fig. 7A), each dimension was equipped with onesemiconductor strain gauge of type KSP-3-120-F2-11 (Kyowa, Tokyo,Japan). For their application, a cyano-acrylate based adhesive from the samemanufacturer was used (CC-33A).
Experimental setupThe sensitive unit was installed in a computer numerical control (CNC)-fabricated aluminium housing and wired with a shielded low-noise cable.We used the MGCplus data acquisition system (Hottinger BaldwinMesstechnik, Darmstadt, Germany) for signal processing. The amplifiermodule ML10B with an AP01i connection board was used to integrate thesemiconductor strain gauges into a Wheatstone bridge circuit with a 1 Vbridge excitation. No filter was chosen and the nominal value was set to1 mV V–1 for maximum gain. A desktop PC with the data acquisitionsoftware Catman Easy V3.3.3 (Hottinger Baldwin Messtechnik, Darmstadt,Germany) was connected through a USB communication processor (CP22).Raw data were saved in MDF format and all further steps of data processingwere made in MATLAB R2010a (The MathWorks, Natick, MA, USA). AFastcam SA3 high-speed video system (Photron, San Diego, CA, USA) wasintegrated in the setup to capture kinematics. We mounted the sensor to avibration isolation workstation (MK2601, Minus K Technology, Inglewood,CA, USA) with a natural frequency below 1 Hz.
Static calibrationA calibration procedure is needed to evaluate a linear matrix transform (K,Eqn 13) between the piezoresistor bridge signals and the three-componentforce load vector (Valdastri et al., 2005):
FF
F
UU
U
K . (13)x
y
z
x
y
z
⎛
⎝
⎜⎜⎜
⎞
⎠
⎟⎟⎟=
⎛
⎝
⎜⎜⎜
⎞
⎠
⎟⎟⎟
Table 3. Specification of the force plate based on finite element method (FEM) simulations and measurementsx-direction y-direction z-direction
Beam dimensions (length × width × depth; mm) 10.5×4×0.4 6×4×0.5 19×4×0.4Calculated (FEM) natural frequency (Hz) 379.16 278.93 200.77Calculated (FEM) spring constant (N mm−1) 0.1005 0.0691 0.3598Sensitivity (V N−1) 97.84 197.62 51.05Unfiltered residual noise (±s.d., mV) 1.18±0.33 1.34±0.45 1.39±0.31Resolvable force after filtering (µN) 5.42 2.87 10.75
0 100 200 300 400 500 6000
0.2
0.4
0.6
0.8
1
Frequency (Hz)
Nor
mal
ized
FFT
am
plitu
de
Fig. 5. Frequency spectra calculated by fast Fourier transform (FFT).The force plate was excited to oscillate by repeatedly tapping on thelaboratory table with a frequency of ~5 Hz over a period of 60 s. Data wererecorded at 1200 Hz and low-pass filtered at 500 Hz (Butterworth, fourthorder). Sx, blue; Sy, red; Sz, black.
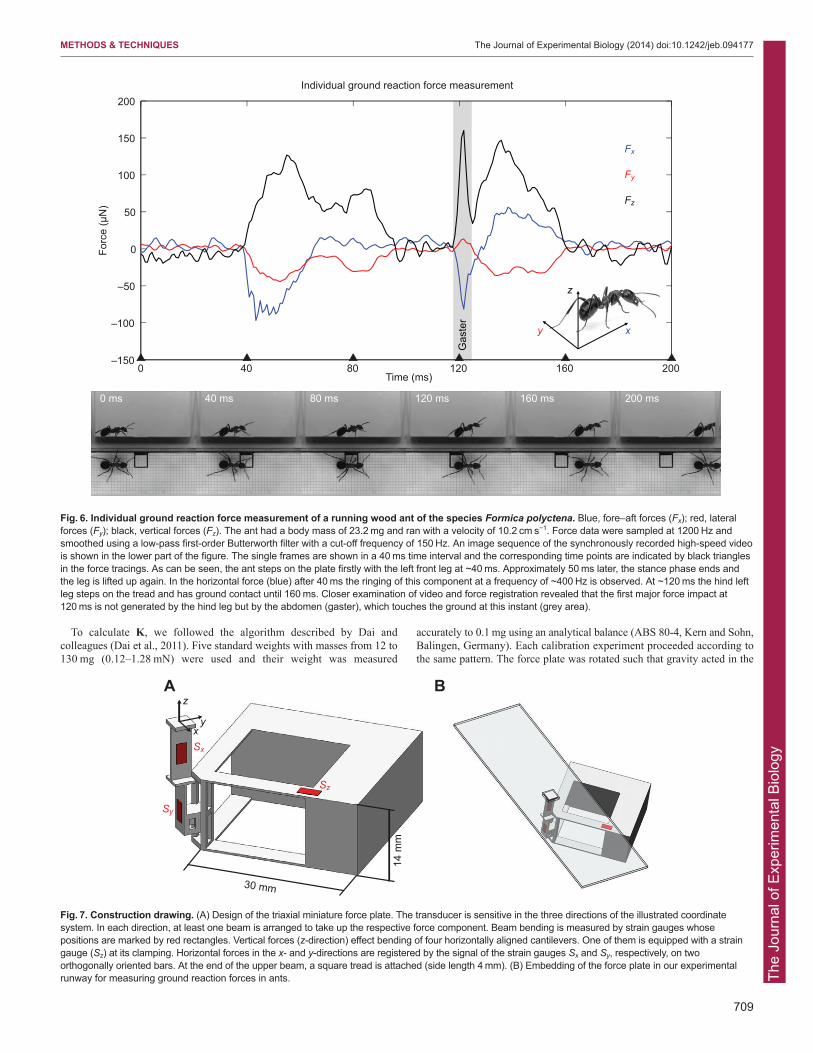
The
Jour
nal o
f Exp
erim
enta
l Bio
logy
709
METHODS & TECHNIQUES The Journal of Experimental Biology (2014) doi:10.1242/jeb.094177
To calculate K, we followed the algorithm described by Dai andcolleagues (Dai et al., 2011). Five standard weights with masses from 12 to130 mg (0.12–1.28 mN) were used and their weight was measured
accurately to 0.1 mg using an analytical balance (ABS 80-4, Kern and Sohn,Balingen, Germany). Each calibration experiment proceeded according tothe same pattern. The force plate was rotated such that gravity acted in the
0 ms 40 ms 80 ms 120 ms 160 ms 200 ms
Time (ms)
Forc
e (μ
N)
Individual ground reaction force measurement
0 40 80 120 160 200–150
–100
–50
0
50
100
150
200
xy
z
Fx
Fy
Fz
Gas
ter
Fig. 6. Individual ground reaction force measurement of a running wood ant of the species Formica polyctena. Blue, fore–aft forces (Fx); red, lateralforces (Fy); black, vertical forces (Fz). The ant had a body mass of 23.2 mg and ran with a velocity of 10.2 cm s−1. Force data were sampled at 1200 Hz andsmoothed using a low-pass first-order Butterworth filter with a cut-off frequency of 150 Hz. An image sequence of the synchronously recorded high-speed videois shown in the lower part of the figure. The single frames are shown in a 40 ms time interval and the corresponding time points are indicated by black trianglesin the force tracings. As can be seen, the ant steps on the plate firstly with the left front leg at ~40 ms. Approximately 50 ms later, the stance phase ends andthe leg is lifted up again. In the horizontal force (blue) after 40 ms the ringing of this component at a frequency of ~400 Hz is observed. At ~120 ms the hind leftleg steps on the tread and has ground contact until 160 ms. Closer examination of video and force registration revealed that the first major force impact at120 ms is not generated by the hind leg but by the abdomen (gaster), which touches the ground at this instant (grey area).
A B
14 m
m
30 mm
Sz
Sx
Sy
x
z
y
Fig. 7. Construction drawing. (A) Design of the triaxial miniature force plate. The transducer is sensitive in the three directions of the illustrated coordinatesystem. In each direction, at least one beam is arranged to take up the respective force component. Beam bending is measured by strain gauges whosepositions are marked by red rectangles. Vertical forces (z-direction) effect bending of four horizontally aligned cantilevers. One of them is equipped with a straingauge (Sz) at its clamping. Horizontal forces in the x- and y-directions are registered by the signal of the strain gauges Sx and Sy, respectively, on twoorthogonally oriented bars. At the end of the upper beam, a square tread is attached (side length 4 mm). (B) Embedding of the force plate in our experimentalrunway for measuring ground reaction forces in ants.
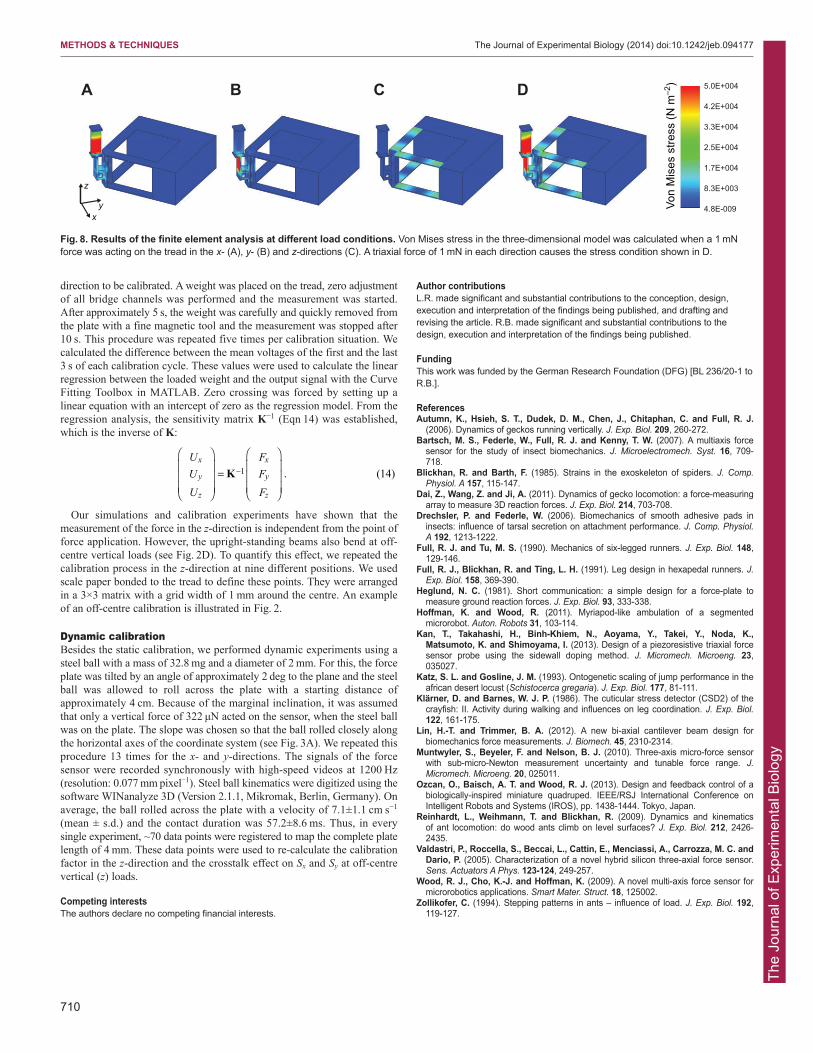
The
Jour
nal o
f Exp
erim
enta
l Bio
logy
710
METHODS & TECHNIQUES The Journal of Experimental Biology (2014) doi:10.1242/jeb.094177
direction to be calibrated. A weight was placed on the tread, zero adjustmentof all bridge channels was performed and the measurement was started.After approximately 5 s, the weight was carefully and quickly removed fromthe plate with a fine magnetic tool and the measurement was stopped after10 s. This procedure was repeated five times per calibration situation. Wecalculated the difference between the mean voltages of the first and the last3 s of each calibration cycle. These values were used to calculate the linearregression between the loaded weight and the output signal with the CurveFitting Toolbox in MATLAB. Zero crossing was forced by setting up alinear equation with an intercept of zero as the regression model. From theregression analysis, the sensitivity matrix K−1 (Eqn 14) was established,which is the inverse of K:
Our simulations and calibration experiments have shown that themeasurement of the force in the z-direction is independent from the point offorce application. However, the upright-standing beams also bend at off-centre vertical loads (see Fig. 2D). To quantify this effect, we repeated thecalibration process in the z-direction at nine different positions. We usedscale paper bonded to the tread to define these points. They were arrangedin a 3×3 matrix with a grid width of 1 mm around the centre. An exampleof an off-centre calibration is illustrated in Fig. 2.
Dynamic calibrationBesides the static calibration, we performed dynamic experiments using asteel ball with a mass of 32.8 mg and a diameter of 2 mm. For this, the forceplate was tilted by an angle of approximately 2 deg to the plane and the steelball was allowed to roll across the plate with a starting distance ofapproximately 4 cm. Because of the marginal inclination, it was assumedthat only a vertical force of 322 μN acted on the sensor, when the steel ballwas on the plate. The slope was chosen so that the ball rolled closely alongthe horizontal axes of the coordinate system (see Fig. 3A). We repeated thisprocedure 13 times for the x- and y-directions. The signals of the forcesensor were recorded synchronously with high-speed videos at 1200 Hz(resolution: 0.077 mm pixel−1). Steel ball kinematics were digitized using thesoftware WINanalyze 3D (Version 2.1.1, Mikromak, Berlin, Germany). Onaverage, the ball rolled across the plate with a velocity of 7.1±1.1 cm s−1
(mean ± s.d.) and the contact duration was 57.2±8.6 ms. Thus, in everysingle experiment, ~70 data points were registered to map the complete platelength of 4 mm. These data points were used to re-calculate the calibrationfactor in the z-direction and the crosstalk effect on Sx and Sy at off-centrevertical (z) loads.
Competing interestsThe authors declare no competing financial interests.
UU
U
FF
F
K . (14)x
y
z
x
y
z
–1
⎛
⎝
⎜⎜⎜
⎞
⎠
⎟⎟⎟=
⎛
⎝
⎜⎜⎜
⎞
⎠
⎟⎟⎟
Author contributionsL.R. made significant and substantial contributions to the conception, design,execution and interpretation of the findings being published, and drafting andrevising the article. R.B. made significant and substantial contributions to thedesign, execution and interpretation of the findings being published.
FundingThis work was funded by the German Research Foundation (DFG) [BL 236/20-1 toR.B.].
ReferencesAutumn, K., Hsieh, S. T., Dudek, D. M., Chen, J., Chitaphan, C. and Full, R. J.
(2006). Dynamics of geckos running vertically. J. Exp. Biol. 209, 260-272. Bartsch, M. S., Federle, W., Full, R. J. and Kenny, T. W. (2007). A multiaxis force
sensor for the study of insect biomechanics. J. Microelectromech. Syst. 16, 709-718.
Blickhan, R. and Barth, F. (1985). Strains in the exoskeleton of spiders. J. Comp.Physiol. A 157, 115-147.
Dai, Z., Wang, Z. and Ji, A. (2011). Dynamics of gecko locomotion: a force-measuringarray to measure 3D reaction forces. J. Exp. Biol. 214, 703-708.
Drechsler, P. and Federle, W. (2006). Biomechanics of smooth adhesive pads ininsects: influence of tarsal secretion on attachment performance. J. Comp. Physiol.A 192, 1213-1222.
Full, R. J. and Tu, M. S. (1990). Mechanics of six-legged runners. J. Exp. Biol. 148,129-146.
Full, R. J., Blickhan, R. and Ting, L. H. (1991). Leg design in hexapedal runners. J.Exp. Biol. 158, 369-390.
Heglund, N. C. (1981). Short communication: a simple design for a force-plate tomeasure ground reaction forces. J. Exp. Biol. 93, 333-338.
Hoffman, K. and Wood, R. (2011). Myriapod-like ambulation of a segmentedmicrorobot. Auton. Robots 31, 103-114.
Kan, T., Takahashi, H., Binh-Khiem, N., Aoyama, Y., Takei, Y., Noda, K.,Matsumoto, K. and Shimoyama, I. (2013). Design of a piezoresistive triaxial forcesensor probe using the sidewall doping method. J. Micromech. Microeng. 23,035027.
Katz, S. L. and Gosline, J. M. (1993). Ontogenetic scaling of jump performance in theafrican desert locust (Schistocerca gregaria). J. Exp. Biol. 177, 81-111.
Klärner, D. and Barnes, W. J. P. (1986). The cuticular stress detector (CSD2) of thecrayfish: II. Activity during walking and influences on leg coordination. J. Exp. Biol.122, 161-175.
Lin, H.-T. and Trimmer, B. A. (2012). A new bi-axial cantilever beam design forbiomechanics force measurements. J. Biomech. 45, 2310-2314.
Muntwyler, S., Beyeler, F. and Nelson, B. J. (2010). Three-axis micro-force sensorwith sub-micro-Newton measurement uncertainty and tunable force range. J.Micromech. Microeng. 20, 025011.
Ozcan, O., Baisch, A. T. and Wood, R. J. (2013). Design and feedback control of abiologically-inspired miniature quadruped. IEEE/RSJ International Conference onIntelligent Robots and Systems (IROS), pp. 1438-1444. Tokyo, Japan.
Reinhardt, L., Weihmann, T. and Blickhan, R. (2009). Dynamics and kinematics of ant locomotion: do wood ants climb on level surfaces? J. Exp. Biol. 212, 2426-2435.
Valdastri, P., Roccella, S., Beccai, L., Cattin, E., Menciassi, A., Carrozza, M. C. andDario, P. (2005). Characterization of a novel hybrid silicon three-axial force sensor.Sens. Actuators A Phys. 123-124, 249-257.
Wood, R. J., Cho, K.-J. and Hoffman, K. (2009). A novel multi-axis force sensor formicrorobotics applications. Smart Mater. Struct. 18, 125002.
Zollikofer, C. (1994). Stepping patterns in ants – influence of load. J. Exp. Biol. 192,119-127.
Von
Mis
es s
tress
(N m
–2) 5.0E+004
4.2E+004
3.3E+004
2.5E+004
1.7E+004
8.3E+003
4.8E-009
A B C D
x
z
y
Fig. 8. Results of the finite element analysis at different load conditions. Von Mises stress in the three-dimensional model was calculated when a 1 mNforce was acting on the tread in the x- (A), y- (B) and z-directions (C). A triaxial force of 1 mN in each direction causes the stress condition shown in D.
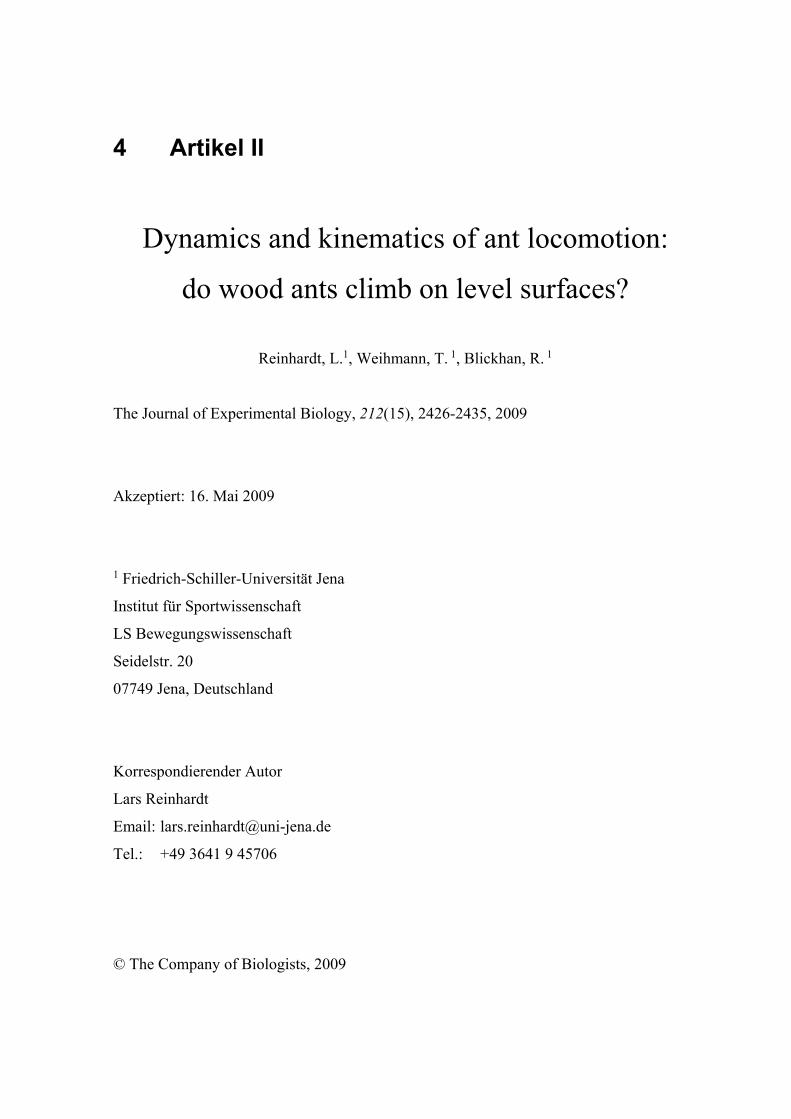
4 Artikel II (Dynamics and kinematics of ant locomotion)
Dynamics and kinematics of ant locomotion:
do wood ants climb on level surfaces?
Reinhardt, L.1, Weihmann, T. 1, Blickhan, R. 1
The Journal of Experimental Biology, 212(15), 2426-2435, 2009
Akzeptiert: 16. Mai 2009
1 Friedrich-Schiller-Universität Jena
Institut für Sportwissenschaft
LS Bewegungswissenschaft
Seidelstr. 20
07749 Jena, Deutschland
Korrespondierender Autor
Lars Reinhardt
Email: [email protected]
Tel.: +49 3641 9 45706
© The Company of Biologists, 2009
2426
INTRODUCTIONThe kinematics of ant locomotion seems to be fairly similar to thoseobserved in other insects, which suggests similarities in the patternsof ground reaction forces. However, ants are much smaller than theinsects investigated so far and gravity may no longer be thedominant factor when compared with other forces such as drag andthose involved in securing a foothold (Federle et al., 2000; Full andKöhl, 1992). In the light of this, the similarity of locomotoryprinciples among insects is more surprising than it may at firstappear. Probing this for a notedly small sized class of leggedlocomotion may reveal rather different dynamical patterns.
Comparatively slow walking insects such as stick insects (Grahamand Cruse, 1981), leaf beetles (Pelletier and Caissie, 2001) andlocusts (Burns, 1973; Duch and Pflüger, 1995) display an alternatingtripodal gait. This is also true of cockroaches at higher runningspeeds (Delcomyn, 1971). To distinguish between the two categoriesSeidl and Wehner (Seidl and Wehner, 2008) describe two basicforms of insect locomotion. The first mode, largely relying onsensory feedback, is well known from the slow moving stick insectCarausius morosus (Cruse, 1979). The second type, known fromfaster moving cockroaches, is characterized as a dynamically stablebouncing gait (Full and Tu, 1990; Full and Koditschek, 1999).Several studies substantiate the notion that locomotion in arthropodsfollows the same rules as those observed for a wide range ofterrestrial vertebrates. In eight-, six-, four- and two-legged animalsranging in size from cockroaches to humans, the force patterns werefound to be consistent with a simple spring loaded invertedpendulum (SLIP) model. This model describes the generalmechanics of the centre of mass (COM) during dynamically similartypes of locomotion such as running, hopping or trotting, in thesagittal plane (Blickhan and Full, 1993). Schmitt et al. (Schmitt etal., 2002) developed an analogue model for the horizontal plane –the so called lateral leg-spring (LLS) model. This has been validatedwith experimental data from the cockroach Blaberus discoidalis
(Full and Tu, 1990). Both models are based on a typical time coursefor the resulting ground reaction forces. During a complete strideat slow running speed a sinusoidal pattern is expected, oscillatingwith the stride period around the net load in both a vertical (bodyweight) and a lateral direction. At higher speeds of locomotion theanimals only remain in contact with the surface for a fraction of thenatural period of the system. A sinusoidal trajectory with a negative(braking) momentum at the beginning and a positive (accelerating)one at the end is expected in the fore–aft force (Blickhan and Full,1993; Schmitt et al., 2002).
As mentioned above, cockroaches use an alternating tripodal gaitwhen running or trotting (mean speed: 35cms–1). In fact, the sumof the ground reaction force components from the threesynchronously acting legs (total force) complies with the conditionsof the SLIP and the LLS. All active legs generate rather similar,outwardly directed, forces during one tripod. Consequently, thecentre of mass is pushed to the side, where only the middle legsupports the animal. Similar to the lateral force component, thevertical one also describes a roughly parabolic curve progressionfor each leg. Consequently and in agreement with the SLIP model,the time course of the total force component in this direction is alsounimodal. In the direction of motion the negative horizontal forceof the front leg is approximately cancelled out by the positivecontribution of the hind leg. Only the sinusoidal course of the middleleg remains to constitute the fore–aft component of the whole system(Blickhan and Full, 1993). During running then, the total forceequates to the expected sinusoidal pattern. Kinematic analysis ofant locomotion reveals similarities to cockroaches. According toZollikofer (Zollikofer, 1994) Formica ants trot with comparablevelocities and the same gait pattern (tripod). Formica pratensis forexample moves with about 9 body lengths s–1 (Weihmann andBlickhan, 2009). This is exactly the average relative speed reachedby Blaberus discoidalis in the experiments described by Full andTu (Full and Tu, 1990). Although similarities in terms of running
The Journal of Experimental Biology 212, 2426-2435Published by The Company of Biologists 2009doi:10.1242/jeb.026880
Dynamics and kinematics of ant locomotion: do wood ants climb on level surfaces?
Lars Reinhardt*, Tom Weihmann and Reinhard BlickhanFreidrich-Schiller-University, Seidelstr. 20, Jena, Germany
*Author for correspondence (e-mail: [email protected])
Accepted 16 May 2009
SUMMARYThe biomechanics of running in small animals have remained poorly characterized because of the difficulty of recording three-dimensional ground reaction forces. Available techniques limit investigations to animals with a body mass above 1g. Here wepresent, for the first time, single-leg ground reaction forces of ants (body mass 10mg), measured with a custom-built miniatureforce plate. We investigated forces and high-speed kinematics for straight level runs (average speed: 8.4cms–1) of Formicapolyctena workers. The major finding was that the time course of ground reaction forces strongly differed from previousobservations of larger insects. Maximum vertical force was reached during the first third of the tripod contact phase. During thisperiod the body was decelerated predominantly by the front legs. Subsequently, the front legs pulled and accelerated the body.This ‘climbing’ type of stride may be useful on the bumpy and unstable substrates that the animals face in their natural habitats,and may therefore also occur on level ground. Propulsive forces were generated predominantly by the front and hind legs.Dragging of the gaster on the substrate resulted in a breaking momentum, which was compensated by the legs. Futureinvestigations will reveal, whether the identified pattern is due to specialization.
Key words: Formica polyctena, arthropods, ground reaction force, locomotion.
THE JOURNAL OF EXPERIMENTAL BIOLOGY
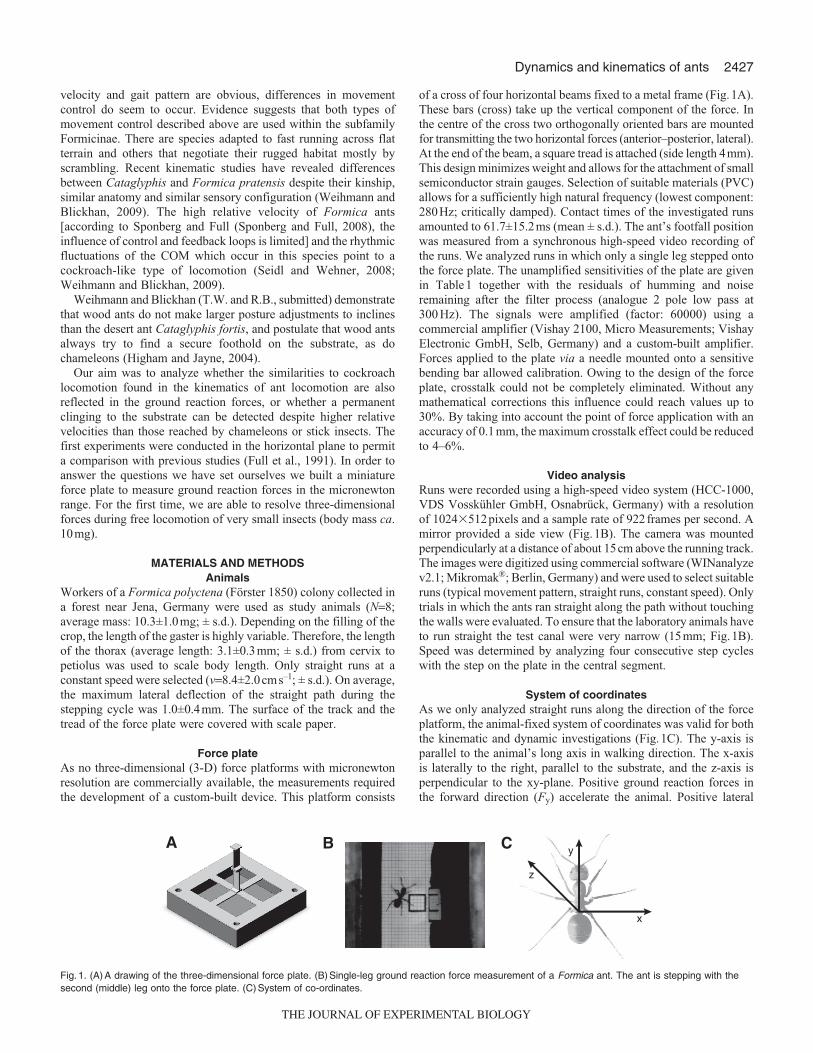
2427Dynamics and kinematics of ants
velocity and gait pattern are obvious, differences in movementcontrol do seem to occur. Evidence suggests that both types ofmovement control described above are used within the subfamilyFormicinae. There are species adapted to fast running across flatterrain and others that negotiate their rugged habitat mostly byscrambling. Recent kinematic studies have revealed differencesbetween Cataglyphis and Formica pratensis despite their kinship,similar anatomy and similar sensory configuration (Weihmann andBlickhan, 2009). The high relative velocity of Formica ants[according to Sponberg and Full (Sponberg and Full, 2008), theinfluence of control and feedback loops is limited] and the rhythmicfluctuations of the COM which occur in this species point to acockroach-like type of locomotion (Seidl and Wehner, 2008;Weihmann and Blickhan, 2009).
Weihmann and Blickhan (T.W. and R.B., submitted) demonstratethat wood ants do not make larger posture adjustments to inclinesthan the desert ant Cataglyphis fortis, and postulate that wood antsalways try to find a secure foothold on the substrate, as dochameleons (Higham and Jayne, 2004).
Our aim was to analyze whether the similarities to cockroachlocomotion found in the kinematics of ant locomotion are alsoreflected in the ground reaction forces, or whether a permanentclinging to the substrate can be detected despite higher relativevelocities than those reached by chameleons or stick insects. Thefirst experiments were conducted in the horizontal plane to permita comparison with previous studies (Full et al., 1991). In order toanswer the questions we have set ourselves we built a miniatureforce plate to measure ground reaction forces in the micronewtonrange. For the first time, we are able to resolve three-dimensionalforces during free locomotion of very small insects (body mass ca.10mg).
MATERIALS AND METHODSAnimals
Workers of a Formica polyctena (Förster 1850) colony collected ina forest near Jena, Germany were used as study animals (N=8;average mass: 10.3±1.0mg; ± s.d.). Depending on the filling of thecrop, the length of the gaster is highly variable. Therefore, the lengthof the thorax (average length: 3.1±0.3mm; ± s.d.) from cervix topetiolus was used to scale body length. Only straight runs at aconstant speed were selected (v=8.4±2.0cms–1; ± s.d.). On average,the maximum lateral deflection of the straight path during thestepping cycle was 1.0±0.4mm. The surface of the track and thetread of the force plate were covered with scale paper.
Force plateAs no three-dimensional (3-D) force platforms with micronewtonresolution are commercially available, the measurements requiredthe development of a custom-built device. This platform consists
of a cross of four horizontal beams fixed to a metal frame (Fig.1A).These bars (cross) take up the vertical component of the force. Inthe centre of the cross two orthogonally oriented bars are mountedfor transmitting the two horizontal forces (anterior–posterior, lateral).At the end of the beam, a square tread is attached (side length 4mm).This design minimizes weight and allows for the attachment of smallsemiconductor strain gauges. Selection of suitable materials (PVC)allows for a sufficiently high natural frequency (lowest component:280Hz; critically damped). Contact times of the investigated runsamounted to 61.7±15.2ms (mean ± s.d.). The ant’s footfall positionwas measured from a synchronous high-speed video recording ofthe runs. We analyzed runs in which only a single leg stepped ontothe force plate. The unamplified sensitivities of the plate are givenin Table1 together with the residuals of humming and noiseremaining after the filter process (analogue 2 pole low pass at300 Hz). The signals were amplified (factor: 60000) using acommercial amplifier (Vishay 2100, Micro Measurements; VishayElectronic GmbH, Selb, Germany) and a custom-built amplifier.Forces applied to the plate via a needle mounted onto a sensitivebending bar allowed calibration. Owing to the design of the forceplate, crosstalk could not be completely eliminated. Without anymathematical corrections this influence could reach values up to30%. By taking into account the point of force application with anaccuracy of 0.1mm, the maximum crosstalk effect could be reducedto 4–6%.
Video analysisRuns were recorded using a high-speed video system (HCC-1000,VDS Vosskühler GmbH, Osnabrück, Germany) with a resolutionof 1024�512pixels and a sample rate of 922frames per second. Amirror provided a side view (Fig.1B). The camera was mountedperpendicularly at a distance of about 15cm above the running track.The images were digitized using commercial software (WINanalyzev2.1; Mikromak®; Berlin, Germany) and were used to select suitableruns (typical movement pattern, straight runs, constant speed). Onlytrials in which the ants ran straight along the path without touchingthe walls were evaluated. To ensure that the laboratory animals haveto run straight the test canal were very narrow (15mm; Fig.1B).Speed was determined by analyzing four consecutive step cycleswith the step on the plate in the central segment.
System of coordinatesAs we only analyzed straight runs along the direction of the forceplatform, the animal-fixed system of coordinates was valid for boththe kinematic and dynamic investigations (Fig.1C). The y-axis isparallel to the animal’s long axis in walking direction. The x-axisis laterally to the right, parallel to the substrate, and the z-axis isperpendicular to the xy-plane. Positive ground reaction forces inthe forward direction (Fy) accelerate the animal. Positive lateral
x
z
yA B C
Fig. 1. (A) A drawing of the three-dimensional force plate. (B) Single-leg ground reaction force measurement of a Formica ant. The ant is stepping with thesecond (middle) leg onto the force plate. (C) System of co-ordinates.
THE JOURNAL OF EXPERIMENTAL BIOLOGY
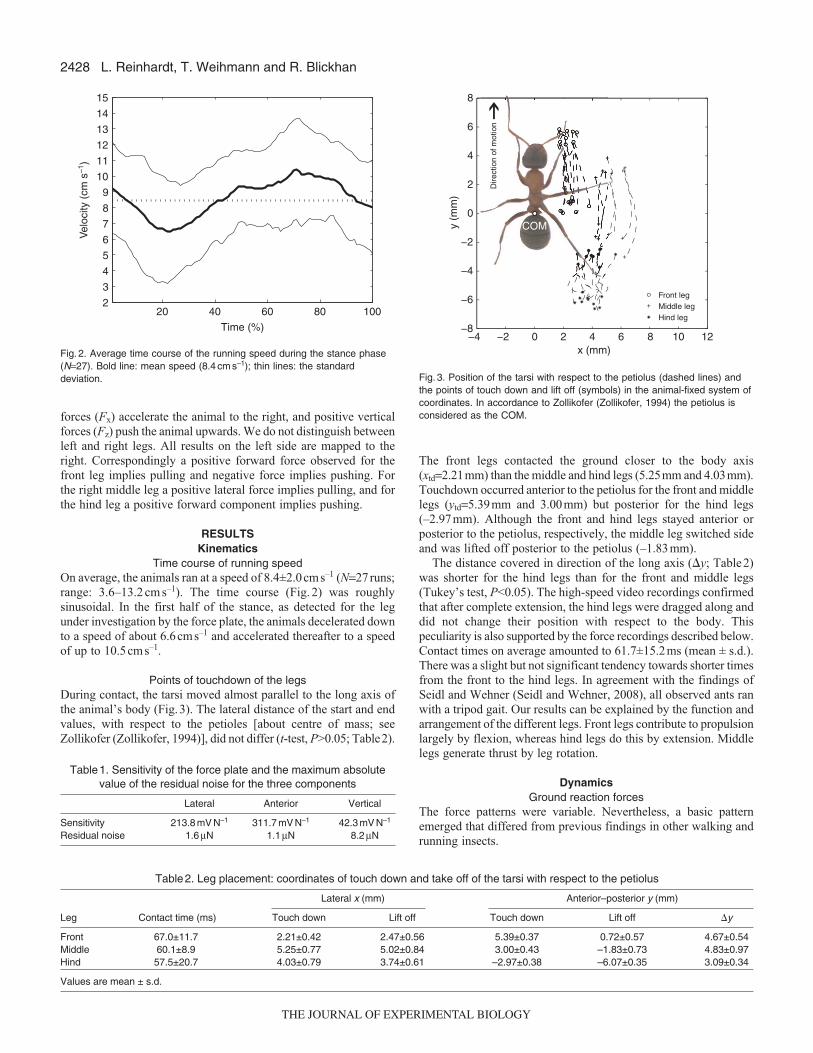
2428
forces (Fx) accelerate the animal to the right, and positive verticalforces (Fz) push the animal upwards. We do not distinguish betweenleft and right legs. All results on the left side are mapped to theright. Correspondingly a positive forward force observed for thefront leg implies pulling and negative force implies pushing. Forthe right middle leg a positive lateral force implies pulling, and forthe hind leg a positive forward component implies pushing.
RESULTSKinematics
Time course of running speedOn average, the animals ran at a speed of 8.4±2.0cms–1 (N=27runs;range: 3.6–13.2 cm s–1). The time course (Fig. 2) was roughlysinusoidal. In the first half of the stance, as detected for the legunder investigation by the force plate, the animals decelerated downto a speed of about 6.6cms–1 and accelerated thereafter to a speedof up to 10.5cms–1.
Points of touchdown of the legsDuring contact, the tarsi moved almost parallel to the long axis ofthe animal’s body (Fig.3). The lateral distance of the start and endvalues, with respect to the petioles [about centre of mass; seeZollikofer (Zollikofer, 1994)], did not differ (t-test, P>0.05; Table2).
L. Reinhardt, T. Weihmann and R. Blickhan
The front legs contacted the ground closer to the body axis(xtd=2.21mm) than the middle and hind legs (5.25mm and 4.03mm).Touchdown occurred anterior to the petiolus for the front and middlelegs (ytd=5.39mm and 3.00mm) but posterior for the hind legs(–2.97mm). Although the front and hind legs stayed anterior orposterior to the petiolus, respectively, the middle leg switched sideand was lifted off posterior to the petiolus (–1.83mm).
The distance covered in direction of the long axis (�y; Table2)was shorter for the hind legs than for the front and middle legs(Tukey’s test, P<0.05). The high-speed video recordings confirmedthat after complete extension, the hind legs were dragged along anddid not change their position with respect to the body. Thispeculiarity is also supported by the force recordings described below.Contact times on average amounted to 61.7±15.2ms (mean ± s.d.).There was a slight but not significant tendency towards shorter timesfrom the front to the hind legs. In agreement with the findings ofSeidl and Wehner (Seidl and Wehner, 2008), all observed ants ranwith a tripod gait. Our results can be explained by the function andarrangement of the different legs. Front legs contribute to propulsionlargely by flexion, whereas hind legs do this by extension. Middlelegs generate thrust by leg rotation.
DynamicsGround reaction forces
The force patterns were variable. Nevertheless, a basic patternemerged that differed from previous findings in other walking andrunning insects.
20 40 60 80 1002
3
4
5
6
7
8
9
10
11
12
13
14
15
Time (%)
Vel
ocity
(cm
s–1
)
Fig. 2. Average time course of the running speed during the stance phase(N=27). Bold line: mean speed (8.4 cm s–1); thin lines: the standarddeviation.
−4 −2 0 2 4 6 8 10 12−8
−6
−4
−2
0
2
4
6
8
x (mm)
y (m
m)
Front legMiddle legHind leg
Dire
ctio
n of
mot
ion
COM
Fig. 3. Position of the tarsi with respect to the petiolus (dashed lines) andthe points of touch down and lift off (symbols) in the animal-fixed system ofcoordinates. In accordance to Zollikofer (Zollikofer, 1994) the petiolus isconsidered as the COM.
Table1. Sensitivity of the force plate and the maximum absolutevalue of the residual noise for the three components
Lateral Anterior Vertical
Sensitivity 213.8 mV N–1 311.7 mV N–1 42.3 mV N–1
Residual noise 1.6μN 1.1μN 8.2μN
Table2. Leg placement: coordinates of touch down and take off of the tarsi with respect to the petiolus
Lateral x (mm) Anterior–posterior y (mm)
Leg Contact time (ms) Touch down Lift off Touch down Lift off �y
Front 67.0±11.7 2.21±0.42 2.47±0.56 5.39±0.37 0.72±0.57 4.67±0.54Middle 60.1±8.9 5.25±0.77 5.02±0.84 3.00±0.43 –1.83±0.73 4.83±0.97Hind 57.5±20.7 4.03±0.79 3.74±0.61 –2.97±0.38 –6.07±0.35 3.09±0.34
Values are mean ± s.d.
THE JOURNAL OF EXPERIMENTAL BIOLOGY
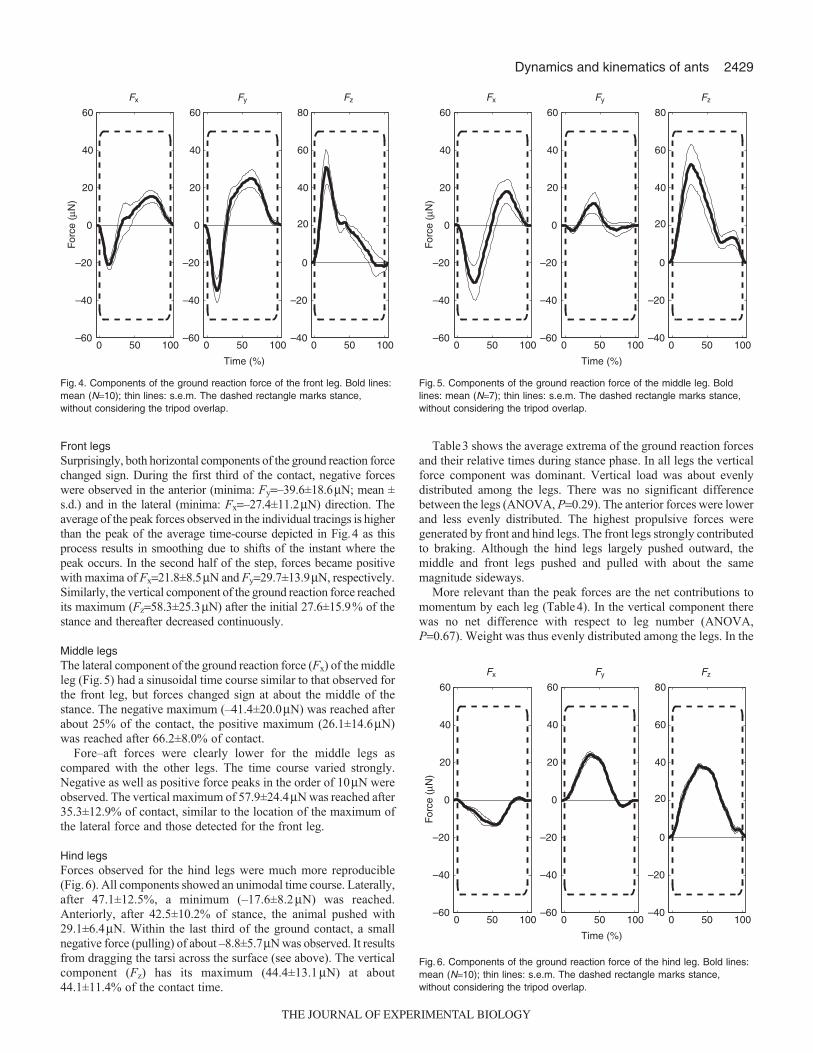
2429Dynamics and kinematics of ants
Front legsSurprisingly, both horizontal components of the ground reaction forcechanged sign. During the first third of the contact, negative forceswere observed in the anterior (minima: Fy=–39.6±18.6μN; mean ±s.d.) and in the lateral (minima: Fx=–27.4±11.2μN) direction. Theaverage of the peak forces observed in the individual tracings is higherthan the peak of the average time-course depicted in Fig.4 as thisprocess results in smoothing due to shifts of the instant where thepeak occurs. In the second half of the step, forces became positivewith maxima of Fx=21.8±8.5μN and Fy=29.7±13.9μN, respectively.Similarly, the vertical component of the ground reaction force reachedits maximum (Fz=58.3±25.3μN) after the initial 27.6±15.9% of thestance and thereafter decreased continuously.
Middle legsThe lateral component of the ground reaction force (Fx) of the middleleg (Fig.5) had a sinusoidal time course similar to that observed forthe front leg, but forces changed sign at about the middle of thestance. The negative maximum (–41.4±20.0μN) was reached afterabout 25% of the contact, the positive maximum (26.1±14.6μN)was reached after 66.2±8.0% of contact.
Fore–aft forces were clearly lower for the middle legs ascompared with the other legs. The time course varied strongly.Negative as well as positive force peaks in the order of 10μN wereobserved. The vertical maximum of 57.9±24.4μN was reached after35.3±12.9% of contact, similar to the location of the maximum ofthe lateral force and those detected for the front leg.
Hind legsForces observed for the hind legs were much more reproducible(Fig.6). All components showed an unimodal time course. Laterally,after 47.1±12.5%, a minimum (–17.6±8.2μN) was reached.Anteriorly, after 42.5±10.2% of stance, the animal pushed with29.1±6.4μN. Within the last third of the ground contact, a smallnegative force (pulling) of about –8.8±5.7μN was observed. It resultsfrom dragging the tarsi across the surface (see above). The verticalcomponent (Fz) has its maximum (44.4±13.1μN) at about44.1±11.4% of the contact time.
Table3 shows the average extrema of the ground reaction forcesand their relative times during stance phase. In all legs the verticalforce component was dominant. Vertical load was about evenlydistributed among the legs. There was no significant differencebetween the legs (ANOVA, P=0.29). The anterior forces were lowerand less evenly distributed. The highest propulsive forces weregenerated by front and hind legs. The front legs strongly contributedto braking. Although the hind legs largely pushed outward, themiddle and front legs pushed and pulled with about the samemagnitude sideways.
More relevant than the peak forces are the net contributions tomomentum by each leg (Table4). In the vertical component therewas no net difference with respect to leg number (ANOVA,P=0.67). Weight was thus evenly distributed among the legs. In the
0 50 100–60
–40
–20
0
20
40
60
–60
–40
–20
0
20
40
60
–40
–20
0
40
20
60
80
Fx Fy Fz
For
ce (
µN)
0 50 100
Time (%)
0 50 100
Fig. 4. Components of the ground reaction force of the front leg. Bold lines:mean (N=10); thin lines: s.e.m. The dashed rectangle marks stance,without considering the tripod overlap.
0 50 100–60
–40
–20
0
20
40
60
–60
–40
–20
0
20
40
60
–40
–20
0
40
20
60
80
Fx Fy Fz
For
ce (
µN)
0 50 100
Time (%)
0 50 100
Fig. 5. Components of the ground reaction force of the middle leg. Boldlines: mean (N=7); thin lines: s.e.m. The dashed rectangle marks stance,without considering the tripod overlap.
0 50 100–60
–40
–20
0
20
40
60
–60
–40
–20
0
20
40
60
–40
–20
0
40
20
60
80
Fx Fy Fz
For
ce (
µN)
0 50 100
Time (%)
0 50 100
Fig. 6. Components of the ground reaction force of the hind leg. Bold lines:mean (N=10); thin lines: s.e.m. The dashed rectangle marks stance,without considering the tripod overlap.
THE JOURNAL OF EXPERIMENTAL BIOLOGY
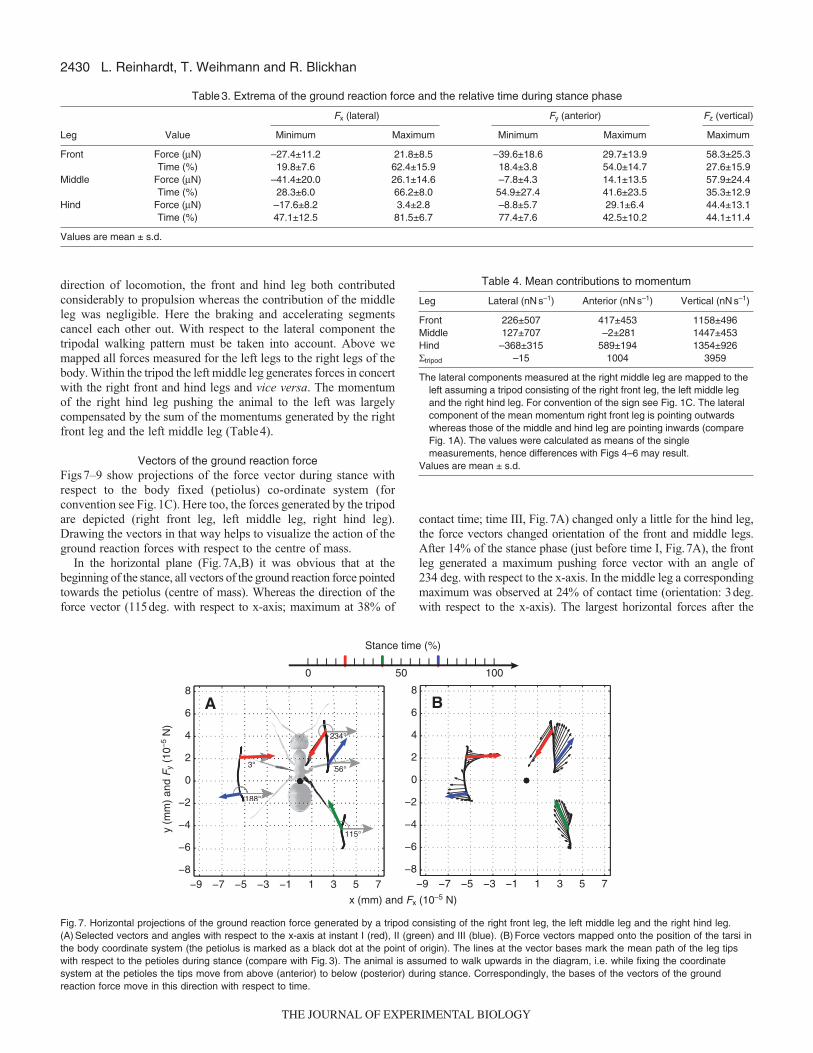
2430
direction of locomotion, the front and hind leg both contributedconsiderably to propulsion whereas the contribution of the middleleg was negligible. Here the braking and accelerating segmentscancel each other out. With respect to the lateral component thetripodal walking pattern must be taken into account. Above wemapped all forces measured for the left legs to the right legs of thebody. Within the tripod the left middle leg generates forces in concertwith the right front and hind legs and vice versa. The momentumof the right hind leg pushing the animal to the left was largelycompensated by the sum of the momentums generated by the rightfront leg and the left middle leg (Table4).
Vectors of the ground reaction forceFigs7–9 show projections of the force vector during stance withrespect to the body fixed (petiolus) co-ordinate system (forconvention see Fig.1C). Here too, the forces generated by the tripodare depicted (right front leg, left middle leg, right hind leg).Drawing the vectors in that way helps to visualize the action of theground reaction forces with respect to the centre of mass.
In the horizontal plane (Fig.7A,B) it was obvious that at thebeginning of the stance, all vectors of the ground reaction force pointedtowards the petiolus (centre of mass). Whereas the direction of theforce vector (115deg. with respect to x-axis; maximum at 38% of
L. Reinhardt, T. Weihmann and R. Blickhan
contact time; time III, Fig.7A) changed only a little for the hind leg,the force vectors changed orientation of the front and middle legs.After 14% of the stance phase (just before time I, Fig.7A), the frontleg generated a maximum pushing force vector with an angle of234·deg. with respect to the x-axis. In the middle leg a correspondingmaximum was observed at 24% of contact time (orientation: 3deg.with respect to the x-axis). The largest horizontal forces after the
Table 4. Mean contributions to momentum
Leg Lateral (nN s–1) Anterior (nN s–1) Vertical (nN s–1)
Front 226±507 417±453 1158±496Middle 127±707 –2±281 1447±453Hind –368±315 589±194 1354±926Σtripod –15 1004 3959
The lateral components measured at the right middle leg are mapped to theleft assuming a tripod consisting of the right front leg, the left middle legand the right hind leg. For convention of the sign see Fig. 1C. The lateralcomponent of the mean momentum right front leg is pointing outwardswhereas those of the middle and hind leg are pointing inwards (compareFig. 1A). The values were calculated as means of the singlemeasurements, hence differences with Figs 4–6 may result.
Values are mean ± s.d.
Table3. Extrema of the ground reaction force and the relative time during stance phase
Fx (lateral) Fy (anterior) Fz (vertical)
Leg Value Minimum Maximum Minimum Maximum Maximum
Front Force (μN) –27.4±11.2 21.8±8.5 –39.6±18.6 29.7±13.9 58.3±25.3Time (%) 19.8±7.6 62.4±15.9 18.4±3.8 54.0±14.7 27.6±15.9
Middle Force (μN) –41.4±20.0 26.1±14.6 –7.8±4.3 14.1±13.5 57.9±24.4Time (%) 28.3±6.0 66.2±8.0 54.9±27.4 41.6±23.5 35.3±12.9
Hind Force (μN) –17.6±8.2 3.4±2.8 –8.8±5.7 29.1±6.4 44.4±13.1Time (%) 47.1±12.5 81.5±6.7 77.4±7.6 42.5±10.2 44.1±11.4
Values are mean ± s.d.
−9 −7 −5 −3 −1 1 3 5 7−8
−6
−4
−2
0
2
4
6
8
x (mm) and Fx (10–5 N)
y (m
m)
and
Fy
(10–5
N)
188°
115°
188°
234°
56°3°
A
−9 −7 −5 −3 −1 1 3 5 7−8
−6
−4
−2
0
2
4
6
8B
0 50 100
Stance time (%)
Fig. 7. Horizontal projections of the ground reaction force generated by a tripod consisting of the right front leg, the left middle leg and the right hind leg.(A) Selected vectors and angles with respect to the x-axis at instant I (red), II (green) and III (blue). (B) Force vectors mapped onto the position of the tarsi inthe body coordinate system (the petiolus is marked as a black dot at the point of origin). The lines at the vector bases mark the mean path of the leg tipswith respect to the petioles during stance (compare with Fig. 3). The animal is assumed to walk upwards in the diagram, i.e. while fixing the coordinatesystem at the petioles the tips move from above (anterior) to below (posterior) during stance. Correspondingly, the bases of the vectors of the groundreaction force move in this direction with respect to time.
THE JOURNAL OF EXPERIMENTAL BIOLOGY
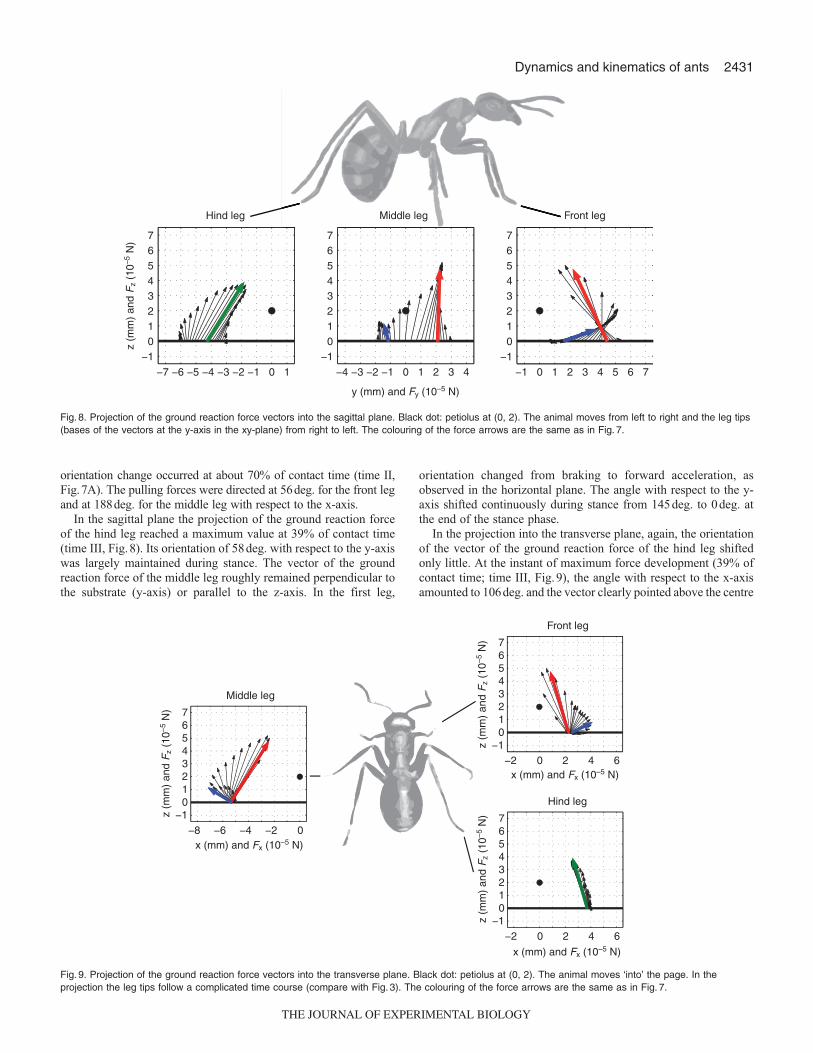
2431Dynamics and kinematics of ants
orientation change occurred at about 70% of contact time (time II,Fig.7A). The pulling forces were directed at 56deg. for the front legand at 188deg. for the middle leg with respect to the x-axis.
In the sagittal plane the projection of the ground reaction forceof the hind leg reached a maximum value at 39% of contact time(time III, Fig.8). Its orientation of 58deg. with respect to the y-axiswas largely maintained during stance. The vector of the groundreaction force of the middle leg roughly remained perpendicular tothe substrate (y-axis) or parallel to the z-axis. In the first leg,
orientation changed from braking to forward acceleration, asobserved in the horizontal plane. The angle with respect to the y-axis shifted continuously during stance from 145deg. to 0deg. atthe end of the stance phase.
In the projection into the transverse plane, again, the orientationof the vector of the ground reaction force of the hind leg shiftedonly little. At the instant of maximum force development (39% ofcontact time; time III, Fig.9), the angle with respect to the x-axisamounted to 106deg. and the vector clearly pointed above the centre
−1 0 1 2 3 4 5 6 7
−101234567
Front leg
−4 −3 −2 −1 0 1 2 3 4
−101234567
Middle leg
−7 −6 −5 −4 −3 −2 −1 0 1
−101234567
Hind leg
y (mm) and Fy (10–5 N)
z (m
m)
and
Fz
(10–5
N)
FMiddle leg
Fig. 8. Projection of the ground reaction force vectors into the sagittal plane. Black dot: petiolus at (0, 2). The animal moves from left to right and the leg tips(bases of the vectors at the y-axis in the xy-plane) from right to left. The colouring of the force arrows are the same as in Fig. 7.
−2 0 2 4 6−1
01234567
Front leg
−8 −6 −4 −2 0−1
01234567
−2 0 2 4 6−1
01234567
Hind leg
Middle leg
x (mm) and Fx (10–5 N)
z (m
m)
and
Fz
(10–5
N)z
(mm
) an
d F
z (1
0–5 N
)
z (m
m)
and
Fz
(10–5
N)
x (mm) and Fx (10–5 N)
x (mm) and Fx (10–5 N)
Fig. 9. Projection of the ground reaction force vectors into the transverse plane. Black dot: petiolus at (0, 2). The animal moves ‘into’ the page. In theprojection the leg tips follow a complicated time course (compare with Fig. 3). The colouring of the force arrows are the same as in Fig. 7.
THE JOURNAL OF EXPERIMENTAL BIOLOGY
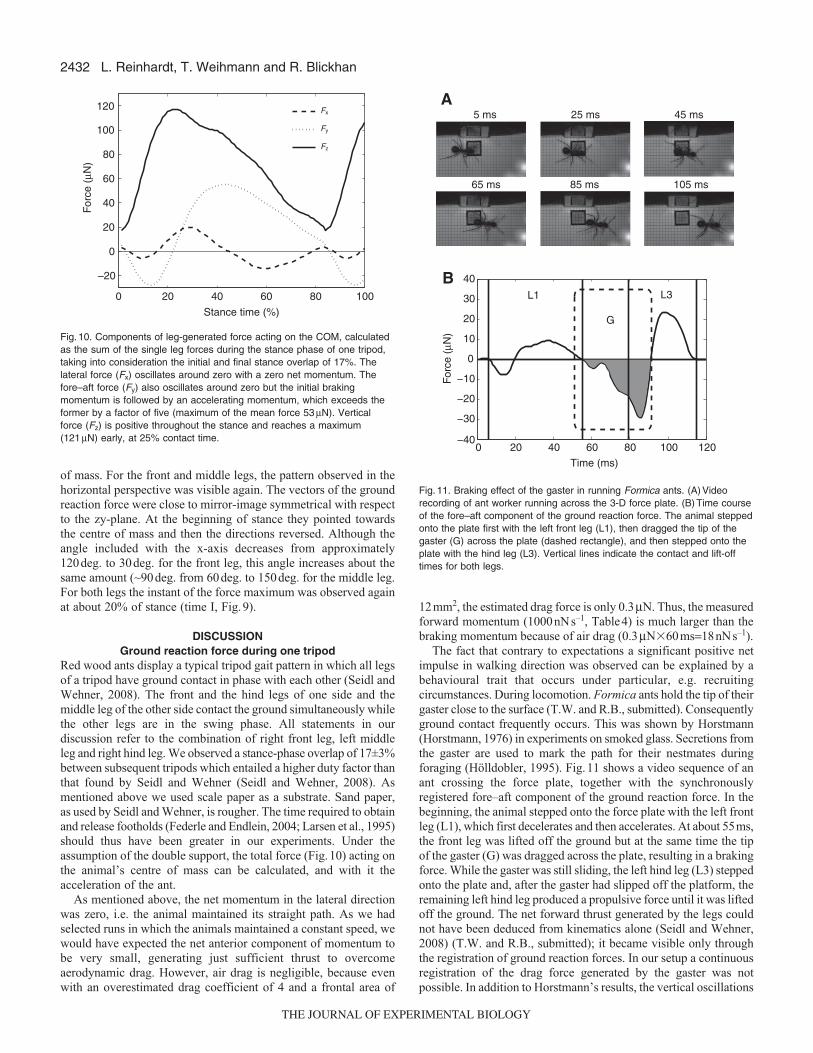
2432
of mass. For the front and middle legs, the pattern observed in thehorizontal perspective was visible again. The vectors of the groundreaction force were close to mirror-image symmetrical with respectto the zy-plane. At the beginning of stance they pointed towardsthe centre of mass and then the directions reversed. Although theangle included with the x-axis decreases from approximately120deg. to 30deg. for the front leg, this angle increases about thesame amount (~90deg. from 60deg. to 150deg. for the middle leg.For both legs the instant of the force maximum was observed againat about 20% of stance (time I, Fig.9).
DISCUSSIONGround reaction force during one tripod
Red wood ants display a typical tripod gait pattern in which all legsof a tripod have ground contact in phase with each other (Seidl andWehner, 2008). The front and the hind legs of one side and themiddle leg of the other side contact the ground simultaneously whilethe other legs are in the swing phase. All statements in ourdiscussion refer to the combination of right front leg, left middleleg and right hind leg. We observed a stance-phase overlap of 17±3%between subsequent tripods which entailed a higher duty factor thanthat found by Seidl and Wehner (Seidl and Wehner, 2008). Asmentioned above we used scale paper as a substrate. Sand paper,as used by Seidl and Wehner, is rougher. The time required to obtainand release footholds (Federle and Endlein, 2004; Larsen et al., 1995)should thus have been greater in our experiments. Under theassumption of the double support, the total force (Fig.10) acting onthe animal’s centre of mass can be calculated, and with it theacceleration of the ant.
As mentioned above, the net momentum in the lateral directionwas zero, i.e. the animal maintained its straight path. As we hadselected runs in which the animals maintained a constant speed, wewould have expected the net anterior component of momentum tobe very small, generating just sufficient thrust to overcomeaerodynamic drag. However, air drag is negligible, because evenwith an overestimated drag coefficient of 4 and a frontal area of
L. Reinhardt, T. Weihmann and R. Blickhan
12mm2, the estimated drag force is only 0.3μN. Thus, the measuredforward momentum (1000nNs–1, Table4) is much larger than thebraking momentum because of air drag (0.3μN�60ms=18nNs–1).
The fact that contrary to expectations a significant positive netimpulse in walking direction was observed can be explained by abehavioural trait that occurs under particular, e.g. recruitingcircumstances. During locomotion. Formica ants hold the tip of theirgaster close to the surface (T.W. and R.B., submitted). Consequentlyground contact frequently occurs. This was shown by Horstmann(Horstmann, 1976) in experiments on smoked glass. Secretions fromthe gaster are used to mark the path for their nestmates duringforaging (Hölldobler, 1995). Fig.11 shows a video sequence of anant crossing the force plate, together with the synchronouslyregistered fore–aft component of the ground reaction force. In thebeginning, the animal stepped onto the force plate with the left frontleg (L1), which first decelerates and then accelerates. At about 55ms,the front leg was lifted off the ground but at the same time the tipof the gaster (G) was dragged across the plate, resulting in a brakingforce. While the gaster was still sliding, the left hind leg (L3) steppedonto the plate and, after the gaster had slipped off the platform, theremaining left hind leg produced a propulsive force until it was liftedoff the ground. The net forward thrust generated by the legs couldnot have been deduced from kinematics alone (Seidl and Wehner,2008) (T.W. and R.B., submitted); it became visible only throughthe registration of ground reaction forces. In our setup a continuousregistration of the drag force generated by the gaster was notpossible. In addition to Horstmann’s results, the vertical oscillations
0 20 40 60 80 100
–20
0
20
40
60
80
100
120
Stance time (%)
For
ce (
µN)
Fx
Fy
Fz
Fig. 10. Components of leg-generated force acting on the COM, calculatedas the sum of the single leg forces during the stance phase of one tripod,taking into consideration the initial and final stance overlap of 17%. Thelateral force (Fx) oscillates around zero with a zero net momentum. Thefore–aft force (Fy) also oscillates around zero but the initial brakingmomentum is followed by an accelerating momentum, which exceeds theformer by a factor of five (maximum of the mean force 53μN). Verticalforce (Fz) is positive throughout the stance and reaches a maximum(121μN) early, at 25% contact time.
0 20 40 60 80 100 120−40
−30
−20
−10
0
10
20
30
40
Time (ms)
L1
G
L3B
5 ms 25 ms 45 ms
65 ms 85 ms 105 ms
A
For
ce (
µN)
Fig. 11. Braking effect of the gaster in running Formica ants. (A) Videorecording of ant worker running across the 3-D force plate. (B) Time courseof the fore–aft component of the ground reaction force. The animal steppedonto the plate first with the left front leg (L1), then dragged the tip of thegaster (G) across the plate (dashed rectangle), and then stepped onto theplate with the hind leg (L3). Vertical lines indicate the contact and lift-offtimes for both legs.
THE JOURNAL OF EXPERIMENTAL BIOLOGY
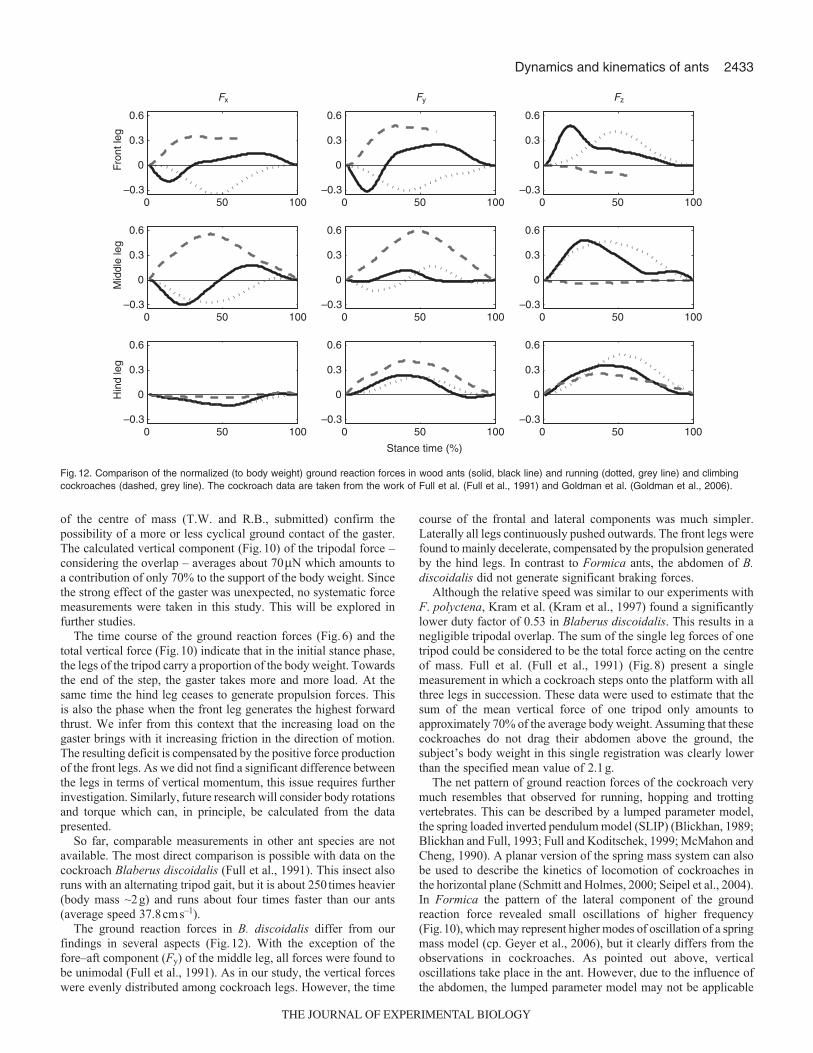
2433Dynamics and kinematics of ants
of the centre of mass (T.W. and R.B., submitted) confirm thepossibility of a more or less cyclical ground contact of the gaster.The calculated vertical component (Fig.10) of the tripodal force –considering the overlap – averages about 70μN which amounts toa contribution of only 70% to the support of the body weight. Sincethe strong effect of the gaster was unexpected, no systematic forcemeasurements were taken in this study. This will be explored infurther studies.
The time course of the ground reaction forces (Fig.6) and thetotal vertical force (Fig.10) indicate that in the initial stance phase,the legs of the tripod carry a proportion of the body weight. Towardsthe end of the step, the gaster takes more and more load. At thesame time the hind leg ceases to generate propulsion forces. Thisis also the phase when the front leg generates the highest forwardthrust. We infer from this context that the increasing load on thegaster brings with it increasing friction in the direction of motion.The resulting deficit is compensated by the positive force productionof the front legs. As we did not find a significant difference betweenthe legs in terms of vertical momentum, this issue requires furtherinvestigation. Similarly, future research will consider body rotationsand torque which can, in principle, be calculated from the datapresented.
So far, comparable measurements in other ant species are notavailable. The most direct comparison is possible with data on thecockroach Blaberus discoidalis (Full et al., 1991). This insect alsoruns with an alternating tripod gait, but it is about 250 times heavier(body mass ~2g) and runs about four times faster than our ants(average speed 37.8cms–1).
The ground reaction forces in B. discoidalis differ from ourfindings in several aspects (Fig.12). With the exception of thefore–aft component (Fy) of the middle leg, all forces were found tobe unimodal (Full et al., 1991). As in our study, the vertical forceswere evenly distributed among cockroach legs. However, the time
course of the frontal and lateral components was much simpler.Laterally all legs continuously pushed outwards. The front legs werefound to mainly decelerate, compensated by the propulsion generatedby the hind legs. In contrast to Formica ants, the abdomen of B.discoidalis did not generate significant braking forces.
Although the relative speed was similar to our experiments withF. polyctena, Kram et al. (Kram et al., 1997) found a significantlylower duty factor of 0.53 in Blaberus discoidalis. This results in anegligible tripodal overlap. The sum of the single leg forces of onetripod could be considered to be the total force acting on the centreof mass. Full et al. (Full et al., 1991) (Fig.8) present a singlemeasurement in which a cockroach steps onto the platform with allthree legs in succession. These data were used to estimate that thesum of the mean vertical force of one tripod only amounts toapproximately 70% of the average body weight. Assuming that thesecockroaches do not drag their abdomen above the ground, thesubject’s body weight in this single registration was clearly lowerthan the specified mean value of 2.1g.
The net pattern of ground reaction forces of the cockroach verymuch resembles that observed for running, hopping and trottingvertebrates. This can be described by a lumped parameter model,the spring loaded inverted pendulum model (SLIP) (Blickhan, 1989;Blickhan and Full, 1993; Full and Koditschek, 1999; McMahon andCheng, 1990). A planar version of the spring mass system can alsobe used to describe the kinetics of locomotion of cockroaches inthe horizontal plane (Schmitt and Holmes, 2000; Seipel et al., 2004).In Formica the pattern of the lateral component of the groundreaction force revealed small oscillations of higher frequency(Fig.10), which may represent higher modes of oscillation of a springmass model (cp. Geyer et al., 2006), but it clearly differs from theobservations in cockroaches. As pointed out above, verticaloscillations take place in the ant. However, due to the influence ofthe abdomen, the lumped parameter model may not be applicable
0 50 100–0.3
0
0.3
0.6
Fx
Fron
t leg
0 50 100
Fy
0 50 100
Fz
0 50 100–0.3
0
0.3
0.6
Mid
dle
leg
0 50 100 0 50 100
0 50 100–0.3
0
0.3
0.6
–0.3
0
0.3
0.6
–0.3
0
0.3
0.6
–0.3
0
0.3
0.6
–0.3
0
0.3
0.6
–0.3
0
0.3
0.6
–0.3
0
0.3
0.6
Hin
d le
g
0 50 100
Stance time (%)
0 50 100
Fig. 12. Comparison of the normalized (to body weight) ground reaction forces in wood ants (solid, black line) and running (dotted, grey line) and climbingcockroaches (dashed, grey line). The cockroach data are taken from the work of Full et al. (Full et al., 1991) and Goldman et al. (Goldman et al., 2006).
THE JOURNAL OF EXPERIMENTAL BIOLOGY
2434
to our present data. The kinetics of many gaits is not sufficientlydescribed by the spring mass system (Blickhan and Full, 1993).Examples are creeping, galloping and climbing. Formica pratensisseems to adapt its kinematics only slightly when walking acrossdifferent slopes (T.W. and R.B., submitted). Wood ants adapted tostructurally complex substrates (e.g. forest floor, vegetation) mayalways tend to cling to their substrate, in agreement with ourmeasurements. After a short period of deceleration, the ants pulledinward with both front and middle legs. This allows secureattachment to the substrate with the aid of adhesive pads or claws(Federle et al., 2001; Frantsevich and Gorb, 2004). On smoothsurfaces, ants stick with their pretarsal arolium (Federle et al., 2001).In Formica these pads are well developed (Gladun and Gorb, 2007).They unfold on smooth substrates when the leg is pulling proximally.The thin fluid film between arolium and substrate can compensatefor small-scale surface roughness and ensures an intimate contactbetween the viscoelastic cuticle of the arolium and the substrate(Drechsler and Federle, 2006). Adhesive pads can achieve very highfriction forces (Federle and Endlein, 2004; Federle et al., 2002).
Goldman et al. (Goldman et al., 2006) published single-leg forcemeasurements for vertically climbing Blaberus discoidalis. Asexpected, the force patterns differed from those observed duringlocomotion on level ground (compare Fig. 12), whereas thekinematics did not. In contrast to level running, all legs generatedexclusively positive forces in the fore–aft direction to overcomegravity. Additionally, the two forelegs pulled laterally towards themidline to cling to the substrate. While the front legs pulled thehead towards the wall, the hind legs pushed the abdomen away fromit. Our results for the later stance phase of ants running on levelground show similarities to these force patterns, which are mainlyindicated by the positive Fx values of the front and middle legs andthe positive Fy value of the front leg. Although differences areobservable in the initial stance phase and in the absolute values, thequalitative similarities to cockroach climbing forces are greater thanto those reaction forces generated during level running (for acomparison, see above). We assume that the dominating factor inthe similar vertical force patterns is the direction of the gravityvector, which also affects the other force components.
The activity of the hind legs seems to be independent of slopesand other influences. On upward slopes it always pushes againstthe substrate, generates propulsion and determinates the clearance.The only difference between hind leg activity in level and verticallocomotion in cockroaches is that the extrema of Fy and Fz areinterchanged because of weight bearing caused by the directionalchange of the gravity vector.
Pelletier and Caissie (Pelletier and Caissie, 2001) providedevidence that pulling a load during horizontal locomotion influencesthe speed of operation in a similar way to the angle of the gravityvector during running on slopes. We therefore suppose that the ant’sgaster serves a similar role in the fore–aft direction as gravity doesduring climbing.
As pointed out by Seidl and Wehner (Seidl and Wehner, 2008),insects display two basic forms of locomotion: (i) slow locomotionlargely relying on sensory feedback, as in the stick insect Carausiusmorosus (Cruse, 1976), and (ii) dynamically stable bouncing gaits,as in cockroaches (Full and Tu, 1990). Based on kinematicobservations, Seidl and Wehner assumed the latter for ants. Thismay well be valid for the desert ant Cataglyphis. Formica polyctenaseems to bounce too, but the general dynamics are more complicatedand no longer described sufficiently by a simple spring mass model.To what extent this gait is controlled by sensory feedback is notknown and requires further investigation. Formica employs a much
L. Reinhardt, T. Weihmann and R. Blickhan
higher cycle frequency (5Hz at 9cms–1) than Carausius morosus(~2Hz) (Wendler, 1964), but neuromuscular signal transmission inthe ant may be facilitated by short legs. However, the mean speedreached by the ants in our investigation was 12body lengthss–1
higher than that observed for the cockroach (9body lengthss–1) inthe force analysis (Full and Tu, 1990; Ting et al., 1994) but lowerthan the peak values observed for a cockroach running on two legs(Full and Tu, 1991). Compared with the stick insect, the wood antmay be adapted to fast locomotion on a variable and unstablesubstrate. This may be because of the relatively more muscular coxaeof the ants, which enable them to generate the necessary propulsionforces.
The mechanical (non-neuronal) feedback available in spring-likemusculo–skeletal systems (Blickhan et al., 2007; Daley andBiewener, 2006; Daley et al., 2007; Grimmer et al., 2008; Seyfarthet al., 2002; Sponberg and Full, 2008) provides further stability andpermits the unloading of the neuronal control system during planarlocomotion across rough terrain. Other environments may requiredifferent measures to achieve a similar goal. Sponberg and Full(Sponberg and Full, 2008) proved the existence of self-stabilisingmechanisms that are independent of classical spring mass models(SLIP, LLS) in insects. For example, no adaptations in legkinematics or muscle activation could be detected. It is probable,therefore, that certain habitat-specific mechanisms lead to a dynamicstabilization of the locomotive system, as defined by Grimmer etal. (Grimmer et al., 2008). The spiny legs of spiders and cockroaches,for example, help to transfer forces and energy on a ‘gap-filled’terrain with rather sparse footholds (Spagna et al., 2007) and enablethe animals to uphold their motion pattern. It remains to be shownin future studies whether the strategy of initial pushing with thefront legs offers an advantage for the species investigated withinan environment where slopes, solidity and roughness may differconsiderably from step to step.
The locomotion of ants is also relevant in the context oforientation. Excellent and extensive information about antorientation has been gathered by Wehner and his co-workers.Experiments with Cataglyphis fortis proved the existence of aninternal navigation system (Wittlinger et al., 2007; Müller andWehner, 1988; Seidl and Wehner, 2008; Sommer and Wehner,2004). This so-called path integrator performs some kind of vectoranalysis. Wohlgemuth et al. (Wohlgemuth et al., 2002) demonstratedthat this mechanism is used on flat surfaces and works just as wellfor three-dimensional paths. However, Grah et al. (Grah et al., 2007)concluded that Cataglyphis essentially represents its environmentin a simplified, two-dimensional fashion. Therefore, the ants mustbe able to monitor and recalculate the influence of slopes. Here, theanimals may make use of graviception. Primarily the hair fieldmechanoreceptors at nearly all joints of the insects provide thisinformation (Markl, 1974) and their stimulation depends on changesin segment angles. Similar information is provided by chordotonalorgans. In addition the campaniform sensilla are used in this contextas they detect strains in the exoskeleton of the legs and may beimportant for slope detection. These sensors are affected by anddepend on changing load distribution among the legs (Ehmer andGronenberg, 1997; Weidner, 1982).
This study provides the first ever information about force patternsduring planar locomotion in wood ants. Contrary to expectationsformed on the basis of other arthropod studies, the dynamics do notreflect the pure spring-like mechanisms suggested by the rhythmicoscillating type of COM kinematics. Although gravity presses theanimal onto its support during level locomotion, the ground reactionforces have significant similarities to those involved in climbing
THE JOURNAL OF EXPERIMENTAL BIOLOGY
2435Dynamics and kinematics of ants
and less to those at work in cockroaches running on a horizontalsurface. There is evidence that the locomotion of wood ants is infact a ‘climbing’ style characterized by a permanent clinging to thesubstrate. Even though the ant’s force patterns resemble those ofboth horizontal and vertical cockroach locomotion, we have toanswer the question posed in the title with ‘yes’. Wood antsobviously climb on level surfaces. Similarities to horizontalcockroach locomotion, particularly remarkable in the verticalcomponent of the ground reaction force, are probably causedpredominantly by the formative direction of the gravity vector. Ourresults could be the starting point for future comparisons undervariable loading and sloped regimes.
We thank Walter Federle for brushing up our English and for thorough and criticalproofreading. This work has been supported by the Volkswagenstiftung as a partof the research project ‘3-D spatial orientation of a small-brain navigator’ (GrantNo.: I/78 578 to R.B.).
REFERENCESBlickhan, R. (1989). The spring-mass model for running and hopping. J. Biomech. 22,
1217-1227.Blickhan, R. and Full, R. J. (1993). Similarity in multilegged locomotion: bouncing like
a monopode. J. Comp. Physiol. A 173, 509-517.Blickhan, R., Seyfarth, A., Geyer, H., Grimmer, S., Wagner, H. and Günther, M.
(2007). Intelligence by mechanics. Philos. Transact. A Math. Phys. Eng. Sci. 365,199-220.
Burns, M. D. (1973). The control of walking in Orthoptera. I. Leg movements in normalwalking. J. Exp. Biol. 58, 45-58.
Cruse, H. (1976). The function of the legs in the free walking stick insect, Carausiusmorosus. J. Comp. Physiol. A 112, 235-262.
Cruse, H. (1979). A new model describing the coordination pattern of the leg of awalking stick insect. Biol. Cybern. 32, 107-113.
Daley, M. A. and Biewener, A. A. (2006). Running over rough terrain reveals limbcontrol for intrinsic stability. Proc. Natl. Acad. Sci. USA 103, 15681-15686.
Daley, M. A., Felix, G. and Biewener, A. A. (2007). Running stability is enhanced bya proximo–distal gradient in joint neuromechanical control. J. Exp. Biol. 210, 383-394.
Delcomyn, F. (1971). The locomotion of the cockroach Periplaneta americana. J. Exp.Biol. 54, 443-452.
Drechsler, P. and Federle, W. (2006). Biomechanics of smooth adhesive pads ininsects: influence of tarsal secretion on attachment performance. J. Comp. Physiol.A 192, 1213-1222.
Duch, C. and Pflüger, H. J. (1995). Motor patterns for horizontal and upside downwalking and vertical climbing in the locust. J. Exp. Biol. 198, 1963-1976.
Ehmer, B. and Gronenberg, W. (1997). Proprioceptors and fast antennal reflexes inthe ant Odontomachus (Formicidae, Ponerinae). Cell Tissue Res. 290, 153-165.
Federle, W. and Endlein, T. (2004). Locomotion and adhesion: dynamic control ofadhesive surface contact in ants. Arthropod Struct. Dev. 33, 67-75.
Federle, W., Rohrseitz, K. and Hölldobler, B. (2000). Attachment forces of antsmeasured with a centrifuge: better ‘wax-runners’ have a poorer attachment to asmooth surface. J. Exp. Biol. 203, 505-512.
Federle, W., Brainerd, E. L., McMahon, T. A. and Hölldobler, B. (2001).Biomechanics of the movable pretarsal adhesive organ in ants and bees. Proc. Natl.Acad. Sci. USA 98, 6215-6220.
Federle, W. M., R., Curtis, A. S. G. and Full, R. J. (2002). An integrative study ofinsect adhesion: mechanics and wet adhesion of pretarsal pads in Ants. Integr.Comp. Biol. 42, 1100-1106.
Frantsevich, L. and Gorb, S. (2004). Structure and mechanics of the tarsal chain inthe hornet, Vespa crabro (Hymenoptera: Vespidae): implications on the attachmentmechanism. Arthropod Struct. Dev. 33, 77-89.
Full, R. J. and Koditschek, D. E. (1999). Templates and anchors: neuromechanicalhypotheses of legged locomotion on land. J. Exp. Biol. 202, 3325-3332.
Full, R. J. and Köhl, M. A. R. (1992). Drag and lift on running insects. J. Exp. Biol.176, 89-101.
Full, R. J. and Tu, M. S. (1990). Mechanics of six-legged runners. J. Exp. Biol. 148,129-146.
Full, R. J., Blickhan, R. and Ting, L. H. (1991). Leg design in hexapedal runners. J.Exp. Biol. 158, 369-390.
Geyer, H., Seyfarth, A. and Blickhan, R. (2006). Compliant leg behaviour explainsbasic dynamics of walking and running. Proc. Biol. Sci. 273, 2861-2867.
Gladun, D. and Gorb, S. (2007). Insect walking techniques on thin stems. ArthropodPlant Interact. 1, 77-91.
Goldman, D. I., Chen, T. S., Dudek, D. M. and Full, R. J. (2006). Dynamics of rapidvertical climbing in cockroaches reveals a template. J. Exp. Biol. 209, 2990-3000.
Grah, G., Wehner, R. and Ronacher, B. (2007). Desert ants do not acquire and usea three-dimensional global vector. Front. Zool. 4, 12.
Graham, D. and Cruse, H. (1981). Coordinated walking of stick insects on amercurysurface. J. Exp. Biol. 92, 229-241.
Grimmer, S., Ernst, M., Günther, M. and Blickhan, R. (2008). Running on unevenground: leg adjustment to vertical steps and self-stability. J. Exp. Biol. 211, 2989-3000.
Higham, T. E. and Jayne, B. C. (2004). Locomotion of lizards on inclines andperches: hindlimb kinematics of an arboreal specialist and a terrestrial generalist. J.Exp. Biol. 207, 233-248.
Hölldobler, B. (1995). The chemistry of social regulation: multicomponent signals inant societies. Proc. Natl. Acad. Sci. USA 92, 19-22.
Horstmann, K. (1976). Über die Duftspur-Orientierung bei Waldameisen (Formicapolyctena Förster). Insectes Soc. 23, 227-242.
Kram, R., Wong, B. and Full, R. J. (1997). Three-dimensional kinematics and limbkinetic energy of running cockroaches. J. Exp. Biol. 200, 1919-1929.
Larsen, G. S., Frazier, S. F., Fish, S. E. and Zill, S. N. (1995). Effects of loadinversion in cockroach walking. J. Comp. Physiol. A 176, 229-238.
Markl, H. (1974). The perception of gravity and of angular acceleration ininvertebrates. In Handbook of Sensory Physiology, Volume 6: Vestibular System.Berlin: Kornhuber.
McMahon, T. A. and Cheng, G. C. (1990). The mechanics of running: how doesstiffness couple with speed? J. Biomech. 23 Suppl. 1, 65-78.
Müller, M. and Wehner, R. (1988). Path integration in desert ants, Cataglyphis fortis.Proc. Natl. Acad. Sci. USA 85, 5287-5290.
Pelletier, Y. and Caissie, R. (2001). Behavioural and physical reactions of theColorado potato beetle, Leptinotarsa decemlineata (Say) (Coleoptera:Chrysomelidae) walking on a slanted surface. Biol. Cybern. 84, 269-277.
Schmitt, J. and Holmes, P. (2000). Mechanical models for insect locomotion:dynamics and stability in the horizontal plane. I. Theory. Biol. Cybern. 83, 501-515.
Schmitt, J., Garcia, M., Razo, R. C., Holmes, P. and Full, R. J. (2002). Dynamicsand stability of legged locomotion in the horizontal plane: a test case using insects.Biol. Cybern. 86, 343-353.
Seidl, T. and Wehner, R. (2008). Walking on inclines: how do desert ants monitorslope and step length? Front. Zool. 5, 8.
Seipel, J. E., Holmes, P. J. and Full, R. J. (2004). Dynamics and stability of insectlocomotion: a hexapedal model for horizontal plane motions. Biol. Cybern. 91, 76-90.
Seyfarth, A., Geyer, H., Günther, M. and Blickhan, R. (2002). A movement criterionfor running. J. Biomech. 35, 649-655.
Sommer, S. and Wehner, R. (2004). The ant’s estimation of distance travelled:experiments with desert ants, Cataglyphis fortis. J. Comp. Physiol. A 190, 1-6.
Spagna, J. C., Goldman, D. I., Lin, P. C., Koditschek, D. E. and Full, R. J. (2007).Distributed mechanical feedback in arthropods and robots simplifies control of rapidrunning on challenging terrain. Bioinspir. Biomim. 2, 9-18.
Sponberg, S. and Full, R. J. (2008). Neuromechanical response of musculo-skeletalstructures in cockroaches during rapid running on rough terrain. J. Exp. Biol. 211,433-446.
Ting, L. H., Blickhan, R. and Full, R. J. (1994). Dynamic and static stability inhexapedal runners. J. Exp. Biol. 197, 251-269.
Weidner, H. (1982). Morphologie, anatomie und histologie. In Handbuch der Zoologie,Bd. 4, Arthropoda. 2. Hälfte: Insecta. 1. Teil: Allgemeines; 11. Berlin: W. de Gruyter.
Wendler, G. (1964). Laufen und Stehen der Stabheuschrecke Carausius morosus:Sinnesborstenfelder in den Beingelenken als Glieder von Regelkreisen. Z. Vgl.Physiol. 48, 198-250.
Wittlinger, M., Wehner, R. and Wolf, H. (2007). The desert ant odometer: a strideintegrator that accounts for stride length and walking speed. J. Exp. Biol. 210, 198-207.
Wohlgemuth, S., Ronacher, B. and Wehner, R. (2002). Distance estimation in thethird dimension in desert ants. J. Comp. Physiol. A 188, 273-281.
Zollikofer, C. (1994). Stepping patterns in ants: influence of body morphology. J. Exp.Biol. 192, 107-118.
THE JOURNAL OF EXPERIMENTAL BIOLOGY
5 Artikel III (Level locomotion in wood ants)
Level locomotion in wood ants:
evidence for grounded running
Reinhardt, L.1, Blickhan, R.1
The Journal of Experimental Biology, 217(13), 2358-2370, 2014
Akzeptiert: 30. März 2014
1 Friedrich-Schiller-Universität Jena
Institut für Sportwissenschaft
LS Bewegungswissenschaft
Seidelstr. 20
07749 Jena, Deutschland
Korrespondierender Autor
Lars Reinhardt
Email: [email protected]
Tel.: +49 3641 9 45706
© The Company of Biologists, 2014
2358
© 2014. Published by The Company of Biologists Ltd | The Journal of Experimental Biology (2014) 217, 2358-2370 doi:10.1242/jeb.098426
ABSTRACTIn order to better understand the strategies of locomotion in smallinsects, we have studied continuous level locomotion of the wood antspecies Formica polyctena. We determined the three-dimensionalcentre of mass kinematics during the gait cycle and recorded theground reaction forces of single legs utilising a self-developed testsite. Our findings show that the animals used the same gait dynamicsacross a wide speed range without dissolving the tripodal stridepattern. To achieve higher velocities, the ants proportionally increasedstride length and stepping frequency. The centre of mass energeticsindicated a bouncing gait, in which horizontal kinetic and gravitationalpotential energy fluctuated in close phase. We determined a highdegree of compliance especially in the front legs, as the effective leglength was nearly halved during the contact phase. This leads to onlysmall vertical oscillations of the body, which are important inmaintaining ground contact. Bouncing gaits without aerial phasesseem to be a common strategy in small runners and can besufficiently described by the bipedal spring-loaded inverted pendulummodel. Thus, with our results, we provide evidence that wood antsperform ‘grounded running’.
KEY WORDS: Formica polyctena, Arthropod, Ground reactionforce, Insect biomechanics, Ant locomotion, Grounded running
INTRODUCTIONAmong insects, extremely fast and agile species exist that can easilyadapt their locomotor performance to a variety of substrates andinclines (Graham and Cruse, 1981; Full and Tu, 1991; Duch andPflüger, 1995; Larsen et al., 1995; Pelletier and Caissie, 2001;Goldman et al., 2006; Gladun and Gorb, 2007; Seidl and Wehner,2008; Sponberg and Full, 2008; Weihmann and Blickhan, 2009). Forexample, experiments on the desert ant Cataglyphis fortis revealedrunning speeds of up to 50 body lengths per second on level ground(Seidl and Wehner, 2008; Weihmann and Blickhan, 2009). Similarrelative velocities were also measured in the cockroach speciesPeriplaneta americana (Full and Tu, 1991).
From a biomechanical point of view, questions regardingprinciples of locomotion or commonly used type of gait arise. It iswell known that insects maintain the alternating tripodal gait patternwithout aerial phases over wide ranges of speeds and slopes(Hughes, 1952; Delcomyn, 1971; Full et al., 1991; Full and Tu,1991; Zollikofer, 1994; Goldman et al., 2006; Seidl and Wehner,2008; Weihmann and Blickhan, 2009). Only at their highest speedsand in individual cases does P. americana change to quadrupedaland bipedal running (Full and Tu, 1991).
The faster locomotion of cockroaches was characterised as abouncing gait, in which horizontal kinetic and gravitational potential
RESEARCH ARTICLE
Science of Motion, Friedrich-Schiller-University Jena, Seidelstr. 20, 07749 Jena,Germany.
*Author for correspondence ([email protected])
Received 14 October 2013; Accepted 30 March 2014
energy of the centre of mass (CoM) change in phase (Full and Tu,1990). This pattern of energy fluctuations is typical for running,trotting or hopping in various animals and can be described bysimple spring-loaded inverted pendulum (SLIP) models (Blickhanand Full, 1993). In addition, SLIP-accordant ground reaction forcepatterns were determined in cockroaches. While the SLIP model isvalid for the sagittal plane, an analogous model for the horizontalplane – the lateral leg-spring (LLS) model – has already beendeveloped and validated with cockroaches (Schmitt et al., 2002).The SLIP model consists of a point mass on top of a compliantspring, which is compressed during the first half of stance anddecompressed in the second half. Hence, the CoM reaches itsminimum height during midstance and at the same time has thelowest speed. This is different from the situation in the invertedpendulum (IP) model, which is used as a standard model for awalking gait (Cavagna et al., 1976). In this model, through vaultingover a stiff supporting leg, a cyclic exchange from kinetic topotential energy and vice versa is achieved and the CoM describesa circular path with the highest point and the lowest velocity atmidstance. In reality, stiff legs rarely occur and CoM dynamics isbetter described by a bipedal spring-loaded inverted pendulum(BSLIP) (Geyer et al., 2006) both for walking and for bouncing gaitswith double support phases. This model has been adapted toexperimental data of different gaits in humans, horses, quails andcockroaches (Geyer et al., 2006; Srinivasan and Ruina, 2006;Srinivasan and Holmes, 2008; Lipfert et al., 2012; Andrada et al.,2013b; Andrada et al., 2013a). Despite leg compliance, the lift of theCoM at midstance remains the criterion for a walking gait whereaslowering the CoM indicates a bouncing gait. In both gaits, inertiacontributes to energy conversion and recovery. Mechanical energycan be stored and released as elastic energy through spring elementsor kinetic and potential energy can be transformed into each otherby a pendular exchange (Cavagna et al., 1964; Cavagna et al., 1976;Heglund et al., 1982).
To distinguish between bouncing and vaulting mechanics, twomeasures can be considered: (i) the percentage of energy recoveryand (ii) the percentage of congruity (Cavagna et al., 1976; Ahn etal., 2004). Congruity conveys the similarity between the curveprogressions of kinetic and potential energy (Ahn et al., 2004). Thus,a congruity of 100% is the result when the two curves have anidentical trend throughout the whole gait cycle. Correspondingly,congruity amounts to 0% in the case of the IP and 100% in the SLIPmodel. The percentage of recovery expresses the magnitude ofenergy exchanged between potential and kinetic energy by thependular mechanism (Cavagna et al., 1976). The two energy formsare out of phase in the IP and consequently the percentage of energyrecovery approaches 100%. This value, however, cannot be reachedbecause of losses in the collision (Ruina et al., 2005). Whilerunning, there is no exchange between these energies in the SLIP,and energy recovery amounts to 0% in this conservative model.Depending on the stiffness of the legs and style, the BSLIP modelrecovery can assume all values between 0% and 100% (ignoringcollision loss). The recovery values measured for the cockroach
Level locomotion in wood ants: evidence for grounded runningLars Reinhardt* and Reinhard Blickhan
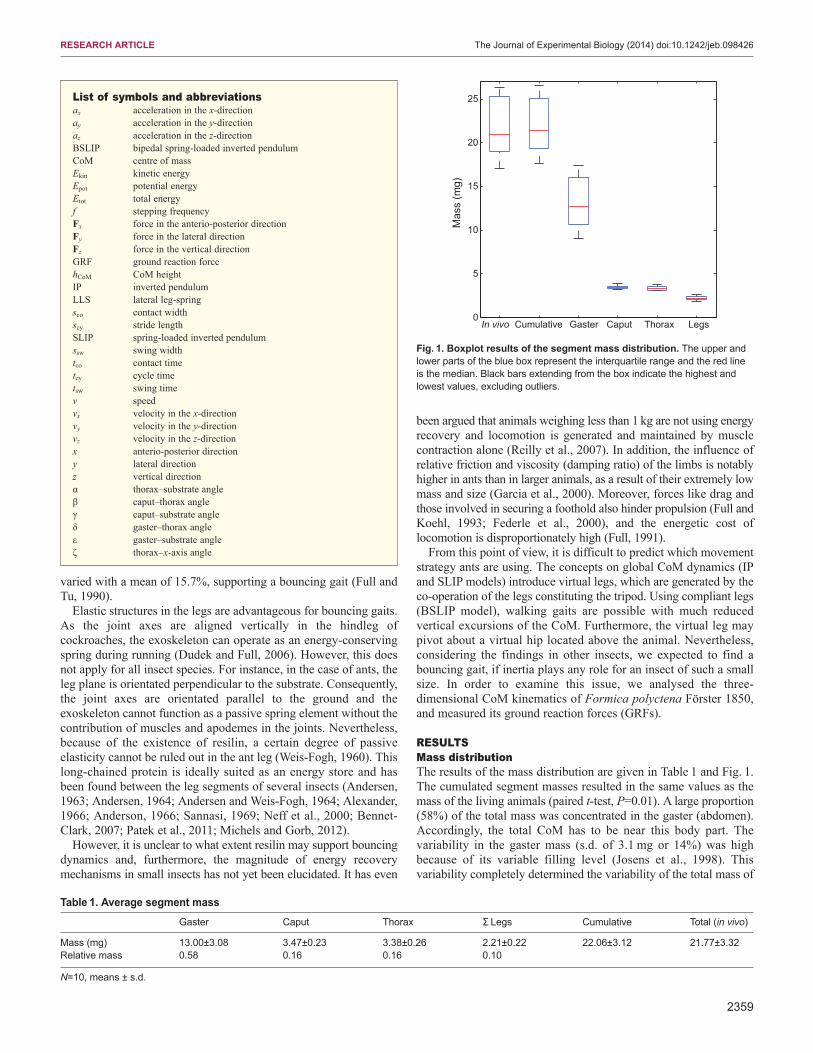
2359
RESEARCH ARTICLE The Journal of Experimental Biology (2014) doi:10.1242/jeb.098426
varied with a mean of 15.7%, supporting a bouncing gait (Full andTu, 1990).
Elastic structures in the legs are advantageous for bouncing gaits.As the joint axes are aligned vertically in the hindleg ofcockroaches, the exoskeleton can operate as an energy-conservingspring during running (Dudek and Full, 2006). However, this doesnot apply for all insect species. For instance, in the case of ants, theleg plane is orientated perpendicular to the substrate. Consequently,the joint axes are orientated parallel to the ground and theexoskeleton cannot function as a passive spring element without thecontribution of muscles and apodemes in the joints. Nevertheless,because of the existence of resilin, a certain degree of passiveelasticity cannot be ruled out in the ant leg (Weis-Fogh, 1960). Thislong-chained protein is ideally suited as an energy store and hasbeen found between the leg segments of several insects (Andersen,1963; Andersen, 1964; Andersen and Weis-Fogh, 1964; Alexander,1966; Anderson, 1966; Sannasi, 1969; Neff et al., 2000; Bennet-Clark, 2007; Patek et al., 2011; Michels and Gorb, 2012).
However, it is unclear to what extent resilin may support bouncingdynamics and, furthermore, the magnitude of energy recoverymechanisms in small insects has not yet been elucidated. It has even
been argued that animals weighing less than 1 kg are not using energyrecovery and locomotion is generated and maintained by musclecontraction alone (Reilly et al., 2007). In addition, the influence ofrelative friction and viscosity (damping ratio) of the limbs is notablyhigher in ants than in larger animals, as a result of their extremely lowmass and size (Garcia et al., 2000). Moreover, forces like drag andthose involved in securing a foothold also hinder propulsion (Full andKoehl, 1993; Federle et al., 2000), and the energetic cost oflocomotion is disproportionately high (Full, 1991).
From this point of view, it is difficult to predict which movementstrategy ants are using. The concepts on global CoM dynamics (IPand SLIP models) introduce virtual legs, which are generated by theco-operation of the legs constituting the tripod. Using compliant legs(BSLIP model), walking gaits are possible with much reducedvertical excursions of the CoM. Furthermore, the virtual leg maypivot about a virtual hip located above the animal. Nevertheless,considering the findings in other insects, we expected to find abouncing gait, if inertia plays any role for an insect of such a smallsize. In order to examine this issue, we analysed the three-dimensional CoM kinematics of Formica polyctena Förster 1850,and measured its ground reaction forces (GRFs).
RESULTSMass distributionThe results of the mass distribution are given in Table 1 and Fig. 1.The cumulated segment masses resulted in the same values as themass of the living animals (paired t-test, P=0.01). A large proportion(58%) of the total mass was concentrated in the gaster (abdomen).Accordingly, the total CoM has to be near this body part. Thevariability in the gaster mass (s.d. of 3.1 mg or 14%) was highbecause of its variable filling level (Josens et al., 1998). Thisvariability completely determined the variability of the total mass of
List of symbols and abbreviationsax acceleration in the x-directionay acceleration in the y-directionaz acceleration in the z-directionBSLIP bipedal spring-loaded inverted pendulumCoM centre of massEkin kinetic energyEpot potential energyEtot total energyf stepping frequencyFx force in the anterio-posterior directionFy force in the lateral directionFz force in the vertical directionGRF ground reaction forcehCoM CoM heightIP inverted pendulumLLS lateral leg-spring sco contact widthscy stride lengthSLIP spring-loaded inverted pendulumssw swing widthtco contact timetcy cycle timetsw swing timev speedvx velocity in the x-directionvy velocity in the y-directionvz velocity in the z-directionx anterio-posterior directiony lateral directionz vertical directionα thorax–substrate angleβ caput–thorax angleγ caput–substrate angleδ gaster–thorax angleε gaster–substrate angleζ thorax–x-axis angle
Table 1. Average segment massGaster Caput Thorax Σ Legs Cumulative Total (in vivo)
Mass (mg) 13.00±3.08 3.47±0.23 3.38±0.26 2.21±0.22 22.06±3.12 21.77±3.32Relative mass 0.58 0.16 0.16 0.10
N=10, means ± s.d.
In vivo Cumulative Gaster Caput Thorax Legs0
5
10
15
20
25
Mas
s (m
g)
Fig. 1. Boxplot results of the segment mass distribution. The upper andlower parts of the blue box represent the interquartile range and the red lineis the median. Black bars extending from the box indicate the highest andlowest values, excluding outliers.
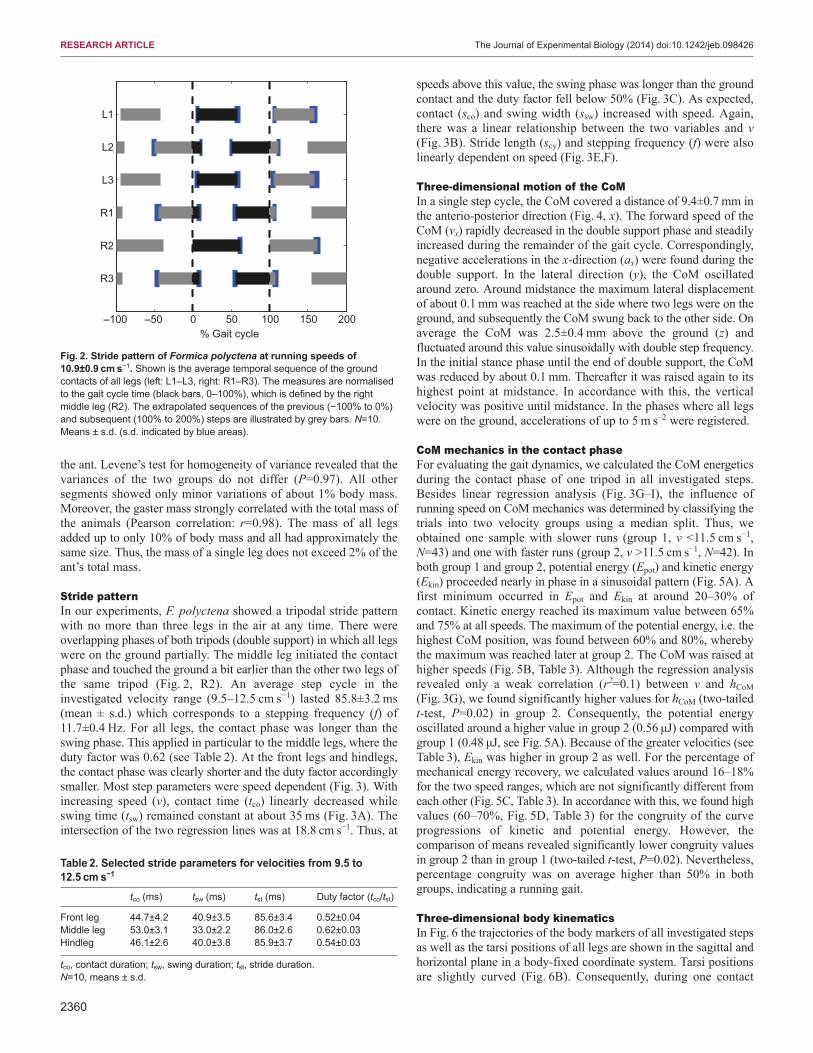
2360
RESEARCH ARTICLE The Journal of Experimental Biology (2014) doi:10.1242/jeb.098426
the ant. Levene’s test for homogeneity of variance revealed that thevariances of the two groups do not differ (P=0.97). All othersegments showed only minor variations of about 1% body mass.Moreover, the gaster mass strongly correlated with the total mass ofthe animals (Pearson correlation: r=0.98). The mass of all legsadded up to only 10% of body mass and all had approximately thesame size. Thus, the mass of a single leg does not exceed 2% of theant’s total mass.
Stride patternIn our experiments, F. polyctena showed a tripodal stride patternwith no more than three legs in the air at any time. There wereoverlapping phases of both tripods (double support) in which all legswere on the ground partially. The middle leg initiated the contactphase and touched the ground a bit earlier than the other two legs ofthe same tripod (Fig. 2, R2). An average step cycle in theinvestigated velocity range (9.5–12.5 cm s−1) lasted 85.8±3.2 ms(mean ± s.d.) which corresponds to a stepping frequency (f) of11.7±0.4 Hz. For all legs, the contact phase was longer than theswing phase. This applied in particular to the middle legs, where theduty factor was 0.62 (see Table 2). At the front legs and hindlegs,the contact phase was clearly shorter and the duty factor accordinglysmaller. Most step parameters were speed dependent (Fig. 3). Withincreasing speed (v), contact time (tco) linearly decreased whileswing time (tsw) remained constant at about 35 ms (Fig. 3A). Theintersection of the two regression lines was at 18.8 cm s−1. Thus, at
speeds above this value, the swing phase was longer than the groundcontact and the duty factor fell below 50% (Fig. 3C). As expected,contact (sco) and swing width (ssw) increased with speed. Again,there was a linear relationship between the two variables and v(Fig. 3B). Stride length (scy) and stepping frequency (f) were alsolinearly dependent on speed (Fig. 3E,F).
Three-dimensional motion of the CoMIn a single step cycle, the CoM covered a distance of 9.4±0.7 mm inthe anterio-posterior direction (Fig. 4, x). The forward speed of theCoM (vx) rapidly decreased in the double support phase and steadilyincreased during the remainder of the gait cycle. Correspondingly,negative accelerations in the x-direction (ax) were found during thedouble support. In the lateral direction (y), the CoM oscillatedaround zero. Around midstance the maximum lateral displacementof about 0.1 mm was reached at the side where two legs were on theground, and subsequently the CoM swung back to the other side. Onaverage the CoM was 2.5±0.4 mm above the ground (z) andfluctuated around this value sinusoidally with double step frequency.In the initial stance phase until the end of double support, the CoMwas reduced by about 0.1 mm. Thereafter it was raised again to itshighest point at midstance. In accordance with this, the verticalvelocity was positive until midstance. In the phases where all legswere on the ground, accelerations of up to 5 m s–2 were registered.
CoM mechanics in the contact phaseFor evaluating the gait dynamics, we calculated the CoM energeticsduring the contact phase of one tripod in all investigated steps.Besides linear regression analysis (Fig. 3G–I), the influence ofrunning speed on CoM mechanics was determined by classifying thetrials into two velocity groups using a median split. Thus, weobtained one sample with slower runs (group 1, v <11.5 cm s−1,N=43) and one with faster runs (group 2, v >11.5 cm s−1, N=42). Inboth group 1 and group 2, potential energy (Epot) and kinetic energy(Ekin) proceeded nearly in phase in a sinusoidal pattern (Fig. 5A). Afirst minimum occurred in Epot and Ekin at around 20–30% ofcontact. Kinetic energy reached its maximum value between 65%and 75% at all speeds. The maximum of the potential energy, i.e. thehighest CoM position, was found between 60% and 80%, wherebythe maximum was reached later at group 2. The CoM was raised athigher speeds (Fig. 5B, Table 3). Although the regression analysisrevealed only a weak correlation (r2=0.1) between v and hCoM
(Fig. 3G), we found significantly higher values for hCoM (two-tailedt-test, P=0.02) in group 2. Consequently, the potential energyoscillated around a higher value in group 2 (0.56 μJ) compared withgroup 1 (0.48 μJ, see Fig. 5A). Because of the greater velocities (seeTable 3), Ekin was higher in group 2 as well. For the percentage ofmechanical energy recovery, we calculated values around 16–18%for the two speed ranges, which are not significantly different fromeach other (Fig. 5C, Table 3). In accordance with this, we found highvalues (60–70%, Fig. 5D, Table 3) for the congruity of the curveprogressions of kinetic and potential energy. However, thecomparison of means revealed significantly lower congruity valuesin group 2 than in group 1 (two-tailed t-test, P=0.02). Nevertheless,percentage congruity was on average higher than 50% in bothgroups, indicating a running gait.
Three-dimensional body kinematicsIn Fig. 6 the trajectories of the body markers of all investigated stepsas well as the tarsi positions of all legs are shown in the sagittal andhorizontal plane in a body-fixed coordinate system. Tarsi positionsare slightly curved (Fig. 6B). Consequently, during one contact
–100 –50 0 50 100 150 200
R3
R2
R1
L3
L2
L1
% Gait cycle
Fig. 2. Stride pattern of Formica polyctena at running speeds of10.9±0.9 cm s−1. Shown is the average temporal sequence of the groundcontacts of all legs (left: L1–L3, right: R1–R3). The measures are normalisedto the gait cycle time (black bars, 0–100%), which is defined by the rightmiddle leg (R2). The extrapolated sequences of the previous (−100% to 0%)and subsequent (100% to 200%) steps are illustrated by grey bars. N=10.Means ± s.d. (s.d. indicated by blue areas).
Table 2. Selected stride parameters for velocities from 9.5 to12.5 cm s−1
tco (ms) tsw (ms) tst (ms) Duty factor (tco/tst)
Front leg 44.7±4.2 40.9±3.5 85.6±3.4 0.52±0.04Middle leg 53.0±3.1 33.0±2.2 86.0±2.6 0.62±0.03Hindleg 46.1±2.6 40.0±3.8 85.9±3.7 0.54±0.03
tco, contact duration; tsw, swing duration; tst, stride duration.N=10, means ± s.d.
2361
RESEARCH ARTICLE The Journal of Experimental Biology (2014) doi:10.1242/jeb.098426
phase the CoM swung to the side where two legs were on theground and back into the initial y-position. Marker B3 was locatedon average less than 0.3 mm away from the CoM. The pointsdigitised more cranially (B1/B2) seemed to move along an arcuatepath around a pivot point located close to the CoM (Fig. 6A).However, the gaster tip (B4) remained nearly at the same spot andkept its orientation (see below). Moreover, during the entireindividual step cycle, the angular position of the three mainsegments to each other varied little. The peak-to-peak amplitudes ofall rotational movements amounted to less than 5 deg (Fig. 7A). Inparticular, the angle between the caput and thorax (β) almost did notchange, remaining at 139.4±1.9 deg (Table 4). The same applied tothe gaster–substrate angle (ε), which on average remained at41.4±2.3 deg with an angular velocity around zero (Fig. 7B). Themost distinct rotational motion was the pitch movement of thethorax–caput complex around the petiolus and is reflected in α andδ. Because of the steady gaster position, they showed an almost
identical cosinusoidal time course with two oscillations per gaitcycle. On average, α oscillated around 22.7±2.3 deg while δamounted to 161.3±2.3 deg. This rotation was performed at angularvelocities of up to ±500 deg s−1 (Fig. 7B). We calculated therotational energy of pitch and found maximum values of 0.4 nJ.These are about 50 times smaller than the fluctuations of the kineticand potential energy of the CoM (Fig. 7C). On average, these twoenergy forms oscillated in a range of ±20 nJ with the sameamplitudes. The yaw (ζ) angle had a sinusoidal profile around 0 degwith one oscillation per stepping cycle.
Three-dimensional GRFsThe front and middle leg pair generated only minor propulsiveforces over the entire contact phase (Fx>0, Fig. 8), and brakedespecially during the first half of stance. In contrast, the hindlegsproduced relatively high positive forces in the running directionbefore slightly braking towards the end. In the lateral (Fy) direction,
6 8 10 12 14 16 18 20 2240
45
50
55
60
65
70
Dut
y fa
ctor
(%)
C
Duty factor=–1.33v+74.8, r2=0.6 6 8 10 12 14 16 18 20 22
2
3
4
5
6
7
8
Dis
tanc
e (m
m)
B
6 8 10 12 14 16 18 20 2220
30
40
50
60
70
80
Dur
atio
n (m
s)
Atco=–2.48v+80.8, r2=0.9tsw=0.05v+34.3, r2=0.2
sco=0.10v+4.5, r2=0.4ssw=0.36v–0.1, r2=0.8
6 8 10 12 14 16 18 20 2260
70
80
90
100
110
120
Cyc
le ti
me
(ms)
6 8 10 12 14 16 18 20 224
6
8
10
12
14
16
Stri
de le
ngth
(mm
)
6 8 10 12 14 16 18 20 226
8
10
12
14
16
18
Ste
ppin
g fre
quen
cy (H
z)
D E Fscy=0.48v+4.1, r2=0.8 f=0.34v+7.6, r2=0.7tcy=–2.16v+111.2, r2=0.7
CoM
hei
ght (
mm
)
v (cm s–1)
Rec
over
y (%
)
Con
grui
ty (%
)
G H I
6 8 10 12 14 16 18 20 220
1
2
3
4
5hCoM=0.03v+2.1, r2=0.1
6 8 10 12 14 16 18 20 220
25
50
75
100%Recovery=–0.25v+20.1, r2=0.0
6 8 10 12 14 16 18 20 220
25
50
75
100
%Congruity=–1.27v+80.6, r2=0.1
Fig. 3. Gait parameters relative to speed. Phase duration (A; tco, contact time; tsw, swing time), distance covered (B; sco, contact width; ssw, swing width), dutyfactor (C), cycle time (tcy; D), stride length (scy; E), stepping frequency (f; F), mean centre of mass (CoM) height (hCoM; G), percentage recovery (H) andpercentage congruity (I) versus running speed (v). In A and B, black dots symbolise the values of the contact phase and red dots represent the swing phase(N=85). Linear regressions are designated by solid lines, and the equations are presented for each plot.
2362
RESEARCH ARTICLE The Journal of Experimental Biology (2014) doi:10.1242/jeb.098426
the middle leg as well as the hindleg produced consistently negativeforces (i.e. pressing them outward). However, we registered nosignificant forces in the lateral direction in the front legs. All legsgenerated positive, substrate-normal forces (pressing on thesubstrate), whereby the time courses of the middle leg and hindlegwere very similar. Up until 30% of stance, both time courses steeplyincreased up to 0.5 body weight and subsequently fell offcontinuously. At midstance, the three legs all had the same forcevalues (one-third body weight). The front legs generated the samevertical force over a major part of the contact. Thus, the body weightwas shifted more and more towards the cranial legs. Withknowledge of the individual leg forces and the stride pattern, wecalculated the total leg-generated force acting on the CoM (Fig. 9A).While the vertical (Fz, red) and fore-aft force (Fx, blue) went throughtwo cycles per step, only one period was seen in the lateral direction(Fy, green). Fz on average corresponded to body weight andoscillated around this value with an amplitude of 0.4 body weight.After the overlap phase until midstance, this force was higher thanthe weight force. The maximum force was generated at about 20%and 70% of the gait cycle and then continuously decreased until the
next double support to its minimum. Fx oscillated around zero andwas negative during double support. At around midstance, this forcecomponent reached its maximum of 0.3. Fy fluctuated around zeroin a sinusoidal pattern with amplitudes below 0.1.
SubsumptionIn the following paragraph, we use a representative image sequence(Fig. 10) to describe the stepping pattern, the kinematics anddynamic contributions of the individual legs during level locomotionin F. polyctena. This comprehensive description provides thebackground for the considerations in the Discussion. All three legscan be considered as two-segmented in a simplified manner. Viewedin the sagittal plane, the distal segment (tibia, metatarsus and tarsus)of the front leg reaches the ground at an angle of about 50 deg at themoment of touchdown, while the femur is orientated ~10 deg to thehorizontal. Consequently, the angle between the two segments isaround 120 deg. In the course of stance, this angle decreases up to55 deg while the distal segment tilts over the contact point and theangle of attack is around 110 deg at lift-off. Meanwhile, the hindlegextends during the stance phase. As a result, the angle in the
0 50 1000
5
10
0 50 100
0
0.5
0 50 100
2.5
3.0
0 50 1007
11
15
0 50 100–4
0
4
0 50 100–4
0
4
0 50 100–5
0
5
% Gait cycle
0 50 100–5
0
5
0 50 100–5
0
5
x (m
m)
y (m
m)
v y (c
m s
–1)
v z (c
m s
–1)
a y (m
s–2
)
a x (m
s–2
)
a z (m
s–2
)
v x (c
m s
–1)
z (m
m)
–0.5 2.0
Fig. 4. Three-dimensional CoM kinematics in F. polyctena. Mean trajectories of CoM position, velocity and acceleration (a) during one gait cycle are shownin the coordinate system defined in Fig. 11C. The areas between the dashed vertical lines (0–12% and 50–62%) indicate phases when legs of both tripodswere on the ground. Mean values are shown as solid black lines and s.d. as grey areas. The investigated animals weighed 20.2±3.0 mg and ran with anaverage speed of 10.9±0.9 cm s−1. Presented curves were calculated from all measurements of animals in the velocity range from 9.5 to 12.5 cm s−1 (N=50).
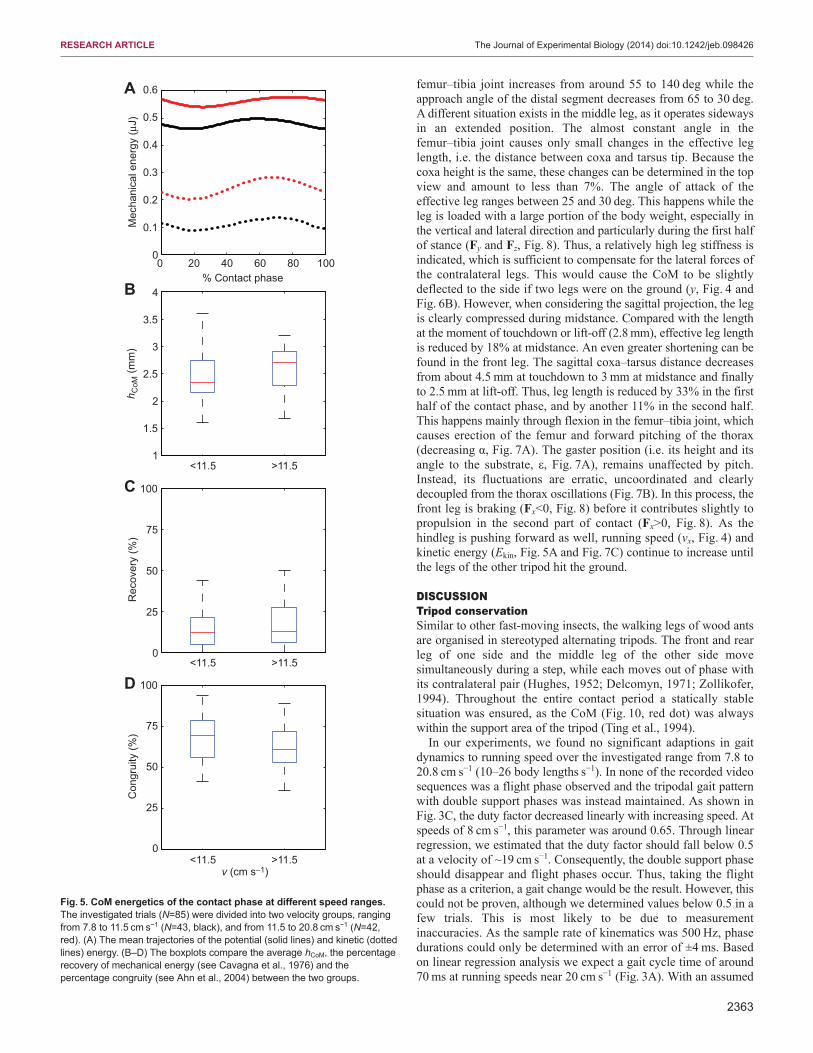
2363
RESEARCH ARTICLE The Journal of Experimental Biology (2014) doi:10.1242/jeb.098426
femur–tibia joint increases from around 55 to 140 deg while theapproach angle of the distal segment decreases from 65 to 30 deg.A different situation exists in the middle leg, as it operates sidewaysin an extended position. The almost constant angle in thefemur–tibia joint causes only small changes in the effective leglength, i.e. the distance between coxa and tarsus tip. Because thecoxa height is the same, these changes can be determined in the topview and amount to less than 7%. The angle of attack of theeffective leg ranges between 25 and 30 deg. This happens while theleg is loaded with a large portion of the body weight, especially inthe vertical and lateral direction and particularly during the first halfof stance (Fy and Fz, Fig. 8). Thus, a relatively high leg stiffness isindicated, which is sufficient to compensate for the lateral forces ofthe contralateral legs. This would cause the CoM to be slightlydeflected to the side if two legs were on the ground (y, Fig. 4 andFig. 6B). However, when considering the sagittal projection, the legis clearly compressed during midstance. Compared with the lengthat the moment of touchdown or lift-off (2.8 mm), effective leg lengthis reduced by 18% at midstance. An even greater shortening can befound in the front leg. The sagittal coxa–tarsus distance decreasesfrom about 4.5 mm at touchdown to 3 mm at midstance and finallyto 2.5 mm at lift-off. Thus, leg length is reduced by 33% in the firsthalf of the contact phase, and by another 11% in the second half.This happens mainly through flexion in the femur–tibia joint, whichcauses erection of the femur and forward pitching of the thorax(decreasing α, Fig. 7A). The gaster position (i.e. its height and itsangle to the substrate, ε, Fig. 7A), remains unaffected by pitch.Instead, its fluctuations are erratic, uncoordinated and clearlydecoupled from the thorax oscillations (Fig. 7B). In this process, thefront leg is braking (Fx<0, Fig. 8) before it contributes slightly topropulsion in the second part of contact (Fx>0, Fig. 8). As thehindleg is pushing forward as well, running speed (vx, Fig. 4) andkinetic energy (Ekin, Fig. 5A and Fig. 7C) continue to increase untilthe legs of the other tripod hit the ground.
DISCUSSIONTripod conservationSimilar to other fast-moving insects, the walking legs of wood antsare organised in stereotyped alternating tripods. The front and rearleg of one side and the middle leg of the other side movesimultaneously during a step, while each moves out of phase withits contralateral pair (Hughes, 1952; Delcomyn, 1971; Zollikofer,1994). Throughout the entire contact period a statically stablesituation was ensured, as the CoM (Fig. 10, red dot) was alwayswithin the support area of the tripod (Ting et al., 1994).
In our experiments, we found no significant adaptions in gaitdynamics to running speed over the investigated range from 7.8 to20.8 cm s−1 (10–26 body lengths s−1). In none of the recorded videosequences was a flight phase observed and the tripodal gait patternwith double support phases was instead maintained. As shown inFig. 3C, the duty factor decreased linearly with increasing speed. Atspeeds of 8 cm s−1, this parameter was around 0.65. Through linearregression, we estimated that the duty factor should fall below 0.5at a velocity of ~19 cm s−1. Consequently, the double support phaseshould disappear and flight phases occur. Thus, taking the flightphase as a criterion, a gait change would be the result. However, thiscould not be proven, although we determined values below 0.5 in afew trials. This is most likely to be due to measurementinaccuracies. As the sample rate of kinematics was 500 Hz, phasedurations could only be determined with an error of ±4 ms. Basedon linear regression analysis we expect a gait cycle time of around70 ms at running speeds near 20 cm s−1 (Fig. 3A). With an assumed
0 20 40 60 80 1000
0.1
0.2
0.3
0.4
0.5
0.6
Mec
hani
cal e
nerg
y (μ
J)
% Contact phase
<11.5 >11.51
1.5
2
2.5
3
3.5
4
h CoM
(mm
)
0
25
50
75
100
Rec
over
y (%
)
0
25
50
75
100
v (cm s–1)
Con
grui
ty (%
)
<11.5 >11.5
<11.5 >11.5
A
B
C
D
Fig. 5. CoM energetics of the contact phase at different speed ranges.The investigated trials (N=85) were divided into two velocity groups, rangingfrom 7.8 to 11.5 cm s−1 (N=43, black), and from 11.5 to 20.8 cm s−1 (N=42,red). (A) The mean trajectories of the potential (solid lines) and kinetic (dottedlines) energy. (B–D) The boxplots compare the average hCoM, the percentagerecovery of mechanical energy (see Cavagna et al., 1976) and thepercentage congruity (see Ahn et al., 2004) between the two groups.
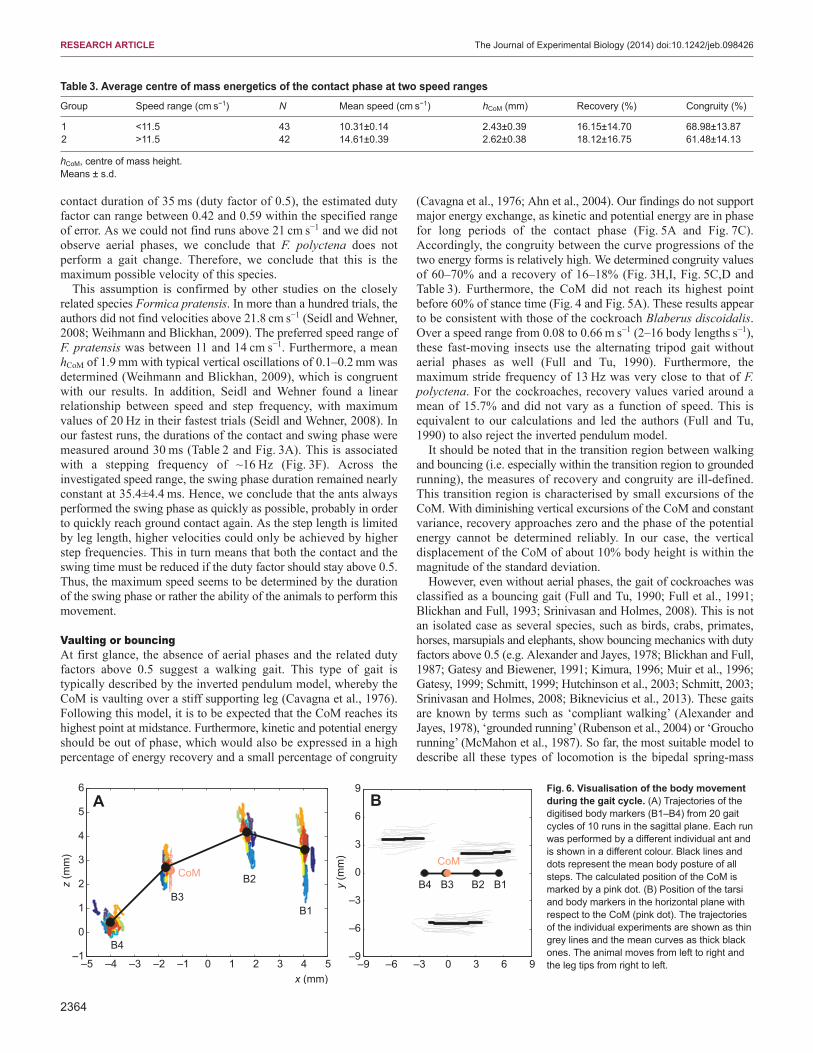
2364
RESEARCH ARTICLE The Journal of Experimental Biology (2014) doi:10.1242/jeb.098426
contact duration of 35 ms (duty factor of 0.5), the estimated dutyfactor can range between 0.42 and 0.59 within the specified rangeof error. As we could not find runs above 21 cm s−1 and we did notobserve aerial phases, we conclude that F. polyctena does notperform a gait change. Therefore, we conclude that this is themaximum possible velocity of this species.
This assumption is confirmed by other studies on the closelyrelated species Formica pratensis. In more than a hundred trials, theauthors did not find velocities above 21.8 cm s−1 (Seidl and Wehner,2008; Weihmann and Blickhan, 2009). The preferred speed range ofF. pratensis was between 11 and 14 cm s−1. Furthermore, a meanhCoM of 1.9 mm with typical vertical oscillations of 0.1–0.2 mm wasdetermined (Weihmann and Blickhan, 2009), which is congruentwith our results. In addition, Seidl and Wehner found a linearrelationship between speed and step frequency, with maximumvalues of 20 Hz in their fastest trials (Seidl and Wehner, 2008). Inour fastest runs, the durations of the contact and swing phase weremeasured around 30 ms (Table 2 and Fig. 3A). This is associatedwith a stepping frequency of ~16 Hz (Fig. 3F). Across theinvestigated speed range, the swing phase duration remained nearlyconstant at 35.4±4.4 ms. Hence, we conclude that the ants alwaysperformed the swing phase as quickly as possible, probably in orderto quickly reach ground contact again. As the step length is limitedby leg length, higher velocities could only be achieved by higherstep frequencies. This in turn means that both the contact and theswing time must be reduced if the duty factor should stay above 0.5.Thus, the maximum speed seems to be determined by the durationof the swing phase or rather the ability of the animals to perform thismovement.
Vaulting or bouncingAt first glance, the absence of aerial phases and the related dutyfactors above 0.5 suggest a walking gait. This type of gait istypically described by the inverted pendulum model, whereby theCoM is vaulting over a stiff supporting leg (Cavagna et al., 1976).Following this model, it is to be expected that the CoM reaches itshighest point at midstance. Furthermore, kinetic and potential energyshould be out of phase, which would also be expressed in a highpercentage of energy recovery and a small percentage of congruity
(Cavagna et al., 1976; Ahn et al., 2004). Our findings do not supportmajor energy exchange, as kinetic and potential energy are in phasefor long periods of the contact phase (Fig. 5A and Fig. 7C).Accordingly, the congruity between the curve progressions of thetwo energy forms is relatively high. We determined congruity valuesof 60–70% and a recovery of 16–18% (Fig. 3H,I, Fig. 5C,D andTable 3). Furthermore, the CoM did not reach its highest pointbefore 60% of stance time (Fig. 4 and Fig. 5A). These results appearto be consistent with those of the cockroach Blaberus discoidalis.Over a speed range from 0.08 to 0.66 m s−1 (2–16 body lengths s−1),these fast-moving insects use the alternating tripod gait withoutaerial phases as well (Full and Tu, 1990). Furthermore, themaximum stride frequency of 13 Hz was very close to that of F.polyctena. For the cockroaches, recovery values varied around amean of 15.7% and did not vary as a function of speed. This isequivalent to our calculations and led the authors (Full and Tu,1990) to also reject the inverted pendulum model.
It should be noted that in the transition region between walkingand bouncing (i.e. especially within the transition region to groundedrunning), the measures of recovery and congruity are ill-defined.This transition region is characterised by small excursions of theCoM. With diminishing vertical excursions of the CoM and constantvariance, recovery approaches zero and the phase of the potentialenergy cannot be determined reliably. In our case, the verticaldisplacement of the CoM of about 10% body height is within themagnitude of the standard deviation.
However, even without aerial phases, the gait of cockroaches wasclassified as a bouncing gait (Full and Tu, 1990; Full et al., 1991;Blickhan and Full, 1993; Srinivasan and Holmes, 2008). This is notan isolated case as several species, such as birds, crabs, primates,horses, marsupials and elephants, show bouncing mechanics with dutyfactors above 0.5 (e.g. Alexander and Jayes, 1978; Blickhan and Full,1987; Gatesy and Biewener, 1991; Kimura, 1996; Muir et al., 1996;Gatesy, 1999; Schmitt, 1999; Hutchinson et al., 2003; Schmitt, 2003;Srinivasan and Holmes, 2008; Biknevicius et al., 2013). These gaitsare known by terms such as ‘compliant walking’ (Alexander andJayes, 1978), ‘grounded running’ (Rubenson et al., 2004) or ‘Grouchorunning’ (McMahon et al., 1987). So far, the most suitable model todescribe all these types of locomotion is the bipedal spring-mass
Table 3. Average centre of mass energetics of the contact phase at two speed rangesGroup Speed range (cm s−1) N Mean speed (cm s−1) hCoM (mm) Recovery (%) Congruity (%)
1 <11.5 43 10.31±0.14 2.43±0.39 16.15±14.70 68.98±13.872 >11.5 42 14.61±0.39 2.62±0.38 18.12±16.75 61.48±14.13
hCoM, centre of mass height.Means ± s.d.
–9 –6 –3 0 3 6 9–9
–6
–3
0
3
6
9
CoM
B1B2B3B4y (m
m)
x (mm)
z (m
m)
A B
–5 –4 –3 –2 –1 0 1 2 3 4 5–1
0
1
2
3
4
5
6
B1
B2
B3
B4
CoM
Fig. 6. Visualisation of the body movementduring the gait cycle. (A) Trajectories of thedigitised body markers (B1–B4) from 20 gaitcycles of 10 runs in the sagittal plane. Each runwas performed by a different individual ant andis shown in a different colour. Black lines anddots represent the mean body posture of allsteps. The calculated position of the CoM ismarked by a pink dot. (B) Position of the tarsiand body markers in the horizontal plane withrespect to the CoM (pink dot). The trajectoriesof the individual experiments are shown as thingrey lines and the mean curves as thick blackones. The animal moves from left to right andthe leg tips from right to left.
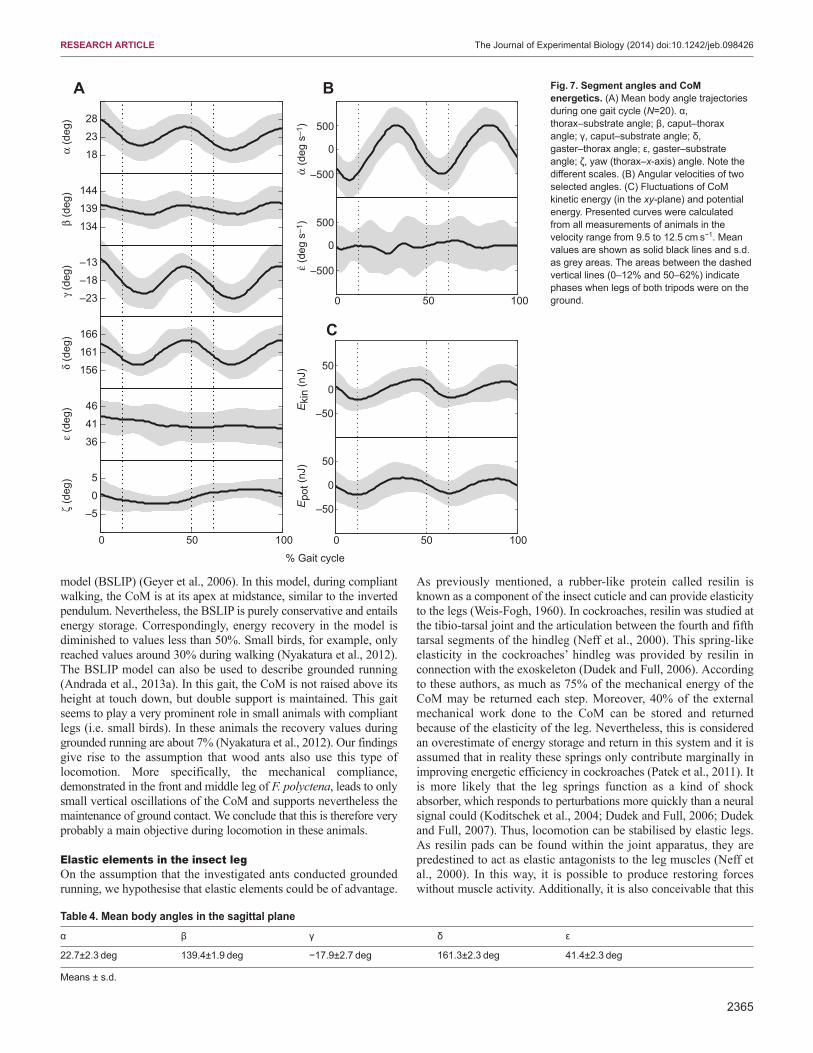
2365
RESEARCH ARTICLE The Journal of Experimental Biology (2014) doi:10.1242/jeb.098426
model (BSLIP) (Geyer et al., 2006). In this model, during compliantwalking, the CoM is at its apex at midstance, similar to the invertedpendulum. Nevertheless, the BSLIP is purely conservative and entailsenergy storage. Correspondingly, energy recovery in the model isdiminished to values less than 50%. Small birds, for example, onlyreached values around 30% during walking (Nyakatura et al., 2012).The BSLIP model can also be used to describe grounded running(Andrada et al., 2013a). In this gait, the CoM is not raised above itsheight at touch down, but double support is maintained. This gaitseems to play a very prominent role in small animals with compliantlegs (i.e. small birds). In these animals the recovery values duringgrounded running are about 7% (Nyakatura et al., 2012). Our findingsgive rise to the assumption that wood ants also use this type oflocomotion. More specifically, the mechanical compliance,demonstrated in the front and middle leg of F. polyctena, leads to onlysmall vertical oscillations of the CoM and supports nevertheless themaintenance of ground contact. We conclude that this is therefore veryprobably a main objective during locomotion in these animals.
Elastic elements in the insect legOn the assumption that the investigated ants conducted groundedrunning, we hypothesise that elastic elements could be of advantage.
As previously mentioned, a rubber-like protein called resilin isknown as a component of the insect cuticle and can provide elasticityto the legs (Weis-Fogh, 1960). In cockroaches, resilin was studied atthe tibio-tarsal joint and the articulation between the fourth and fifthtarsal segments of the hindleg (Neff et al., 2000). This spring-likeelasticity in the cockroaches’ hindleg was provided by resilin inconnection with the exoskeleton (Dudek and Full, 2006). Accordingto these authors, as much as 75% of the mechanical energy of theCoM may be returned each step. Moreover, 40% of the externalmechanical work done to the CoM can be stored and returnedbecause of the elasticity of the leg. Nevertheless, this is consideredan overestimate of energy storage and return in this system and it isassumed that in reality these springs only contribute marginally inimproving energetic efficiency in cockroaches (Patek et al., 2011). Itis more likely that the leg springs function as a kind of shockabsorber, which responds to perturbations more quickly than a neuralsignal could (Koditschek et al., 2004; Dudek and Full, 2006; Dudekand Full, 2007). Thus, locomotion can be stabilised by elastic legs.As resilin pads can be found within the joint apparatus, they arepredestined to act as elastic antagonists to the leg muscles (Neff etal., 2000). In this way, it is possible to produce restoring forceswithout muscle activity. Additionally, it is also conceivable that this
α (d
eg s
–1)
0 50 100
–500
0
500
–500
0
500
Eki
n (n
J)
0 50 100
–50
0
50
–50
0
50
% Gait cycle
ζ (d
eg)
ε (d
eg)
δ (d
eg)
γ (d
eg)
β (d
eg)
0 50 100
–5
0
5
36
41
46
156
161
166
–23
–18
–13
134
139
144
18
23
28
α (d
eg)
A B
C
ε (d
eg s
–1)
Epo
t (nJ
)
.
.
Fig. 7. Segment angles and CoMenergetics. (A) Mean body angle trajectoriesduring one gait cycle (N=20). α,thorax–substrate angle; β, caput–thoraxangle; γ, caput–substrate angle; δ,gaster–thorax angle; ε, gaster–substrateangle; ζ, yaw (thorax–x-axis) angle. Note thedifferent scales. (B) Angular velocities of twoselected angles. (C) Fluctuations of CoMkinetic energy (in the xy-plane) and potentialenergy. Presented curves were calculatedfrom all measurements of animals in thevelocity range from 9.5 to 12.5 cm s−1. Meanvalues are shown as solid black lines and s.d.as grey areas. The areas between the dashedvertical lines (0–12% and 50–62%) indicatephases when legs of both tripods were on theground.
Table 4. Mean body angles in the sagittal planeα β γ δ ε
22.7±2.3 deg 139.4±1.9 deg −17.9±2.7 deg 161.3±2.3 deg 41.4±2.3 deg
Means ± s.d.
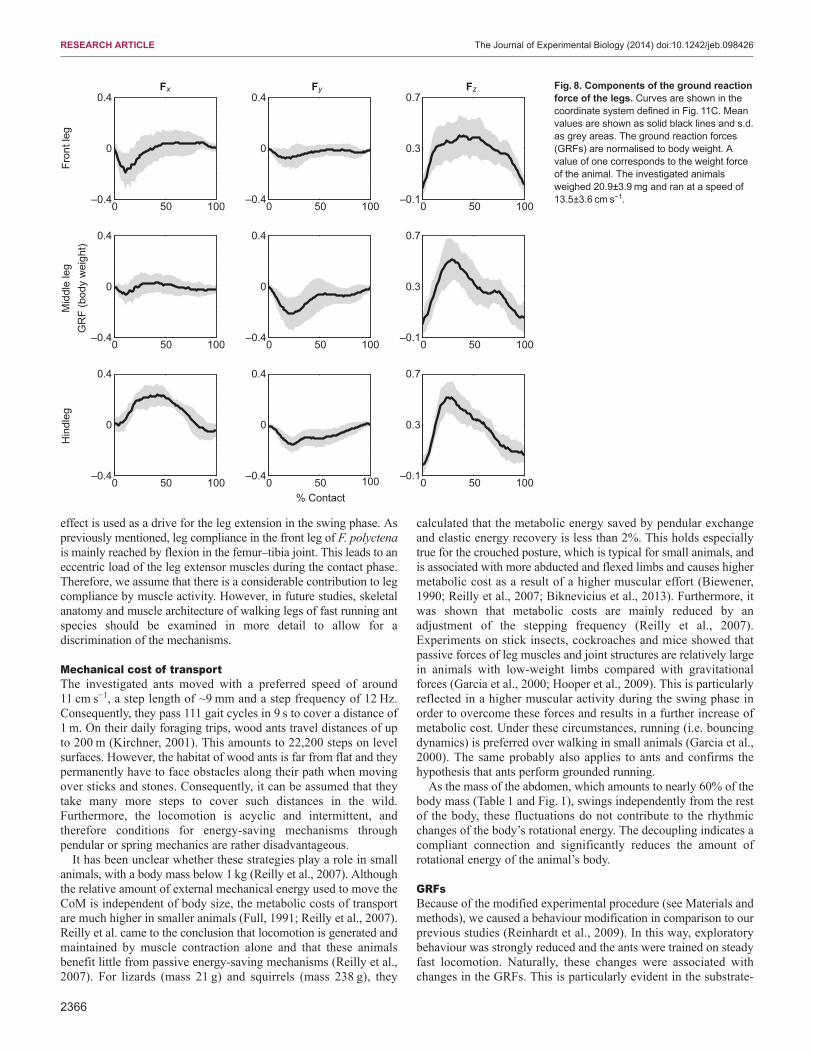
2366
RESEARCH ARTICLE The Journal of Experimental Biology (2014) doi:10.1242/jeb.098426
effect is used as a drive for the leg extension in the swing phase. Aspreviously mentioned, leg compliance in the front leg of F. polyctenais mainly reached by flexion in the femur–tibia joint. This leads to aneccentric load of the leg extensor muscles during the contact phase.Therefore, we assume that there is a considerable contribution to legcompliance by muscle activity. However, in future studies, skeletalanatomy and muscle architecture of walking legs of fast running antspecies should be examined in more detail to allow for adiscrimination of the mechanisms.
Mechanical cost of transportThe investigated ants moved with a preferred speed of around11 cm s−1, a step length of ~9 mm and a step frequency of 12 Hz.Consequently, they pass 111 gait cycles in 9 s to cover a distance of1 m. On their daily foraging trips, wood ants travel distances of upto 200 m (Kirchner, 2001). This amounts to 22,200 steps on levelsurfaces. However, the habitat of wood ants is far from flat and theypermanently have to face obstacles along their path when movingover sticks and stones. Consequently, it can be assumed that theytake many more steps to cover such distances in the wild.Furthermore, the locomotion is acyclic and intermittent, andtherefore conditions for energy-saving mechanisms throughpendular or spring mechanics are rather disadvantageous.
It has been unclear whether these strategies play a role in smallanimals, with a body mass below 1 kg (Reilly et al., 2007). Althoughthe relative amount of external mechanical energy used to move theCoM is independent of body size, the metabolic costs of transportare much higher in smaller animals (Full, 1991; Reilly et al., 2007).Reilly et al. came to the conclusion that locomotion is generated andmaintained by muscle contraction alone and that these animalsbenefit little from passive energy-saving mechanisms (Reilly et al.,2007). For lizards (mass 21 g) and squirrels (mass 238 g), they
calculated that the metabolic energy saved by pendular exchangeand elastic energy recovery is less than 2%. This holds especiallytrue for the crouched posture, which is typical for small animals, andis associated with more abducted and flexed limbs and causes highermetabolic cost as a result of a higher muscular effort (Biewener,1990; Reilly et al., 2007; Biknevicius et al., 2013). Furthermore, itwas shown that metabolic costs are mainly reduced by anadjustment of the stepping frequency (Reilly et al., 2007).Experiments on stick insects, cockroaches and mice showed thatpassive forces of leg muscles and joint structures are relatively largein animals with low-weight limbs compared with gravitationalforces (Garcia et al., 2000; Hooper et al., 2009). This is particularlyreflected in a higher muscular activity during the swing phase inorder to overcome these forces and results in a further increase ofmetabolic cost. Under these circumstances, running (i.e. bouncingdynamics) is preferred over walking in small animals (Garcia et al.,2000). The same probably also applies to ants and confirms thehypothesis that ants perform grounded running.
As the mass of the abdomen, which amounts to nearly 60% of thebody mass (Table 1 and Fig. 1), swings independently from the restof the body, these fluctuations do not contribute to the rhythmicchanges of the body’s rotational energy. The decoupling indicates acompliant connection and significantly reduces the amount ofrotational energy of the animal’s body.
GRFsBecause of the modified experimental procedure (see Materials andmethods), we caused a behaviour modification in comparison to ourprevious studies (Reinhardt et al., 2009). In this way, exploratorybehaviour was strongly reduced and the ants were trained on steadyfast locomotion. Naturally, these changes were associated withchanges in the GRFs. This is particularly evident in the substrate-
0 50 100–0.4
0
0.4
0 50 100–0.4
0
0.4
0 50 100–0.1
0.3
0.7
0 50 100–0.4
0
0.4
0 50 100–0.4
0
0.4
0 50 100–0.1
0.3
0.7
0 50 100–0.4
0
0.4
0 50 100–0.4
0
0.4
0 50 100–0.1
0.3
0.7
Fron
t leg
Fx Fy Fz
Mid
dle
leg
Hin
dleg
% Contact
GR
F (b
ody
wei
ght)
Fig. 8. Components of the ground reactionforce of the legs. Curves are shown in thecoordinate system defined in Fig. 11C. Meanvalues are shown as solid black lines and s.d.as grey areas. The ground reaction forces(GRFs) are normalised to body weight. Avalue of one corresponds to the weight forceof the animal. The investigated animalsweighed 20.9±3.9 mg and ran at a speed of13.5±3.6 cm s−1.
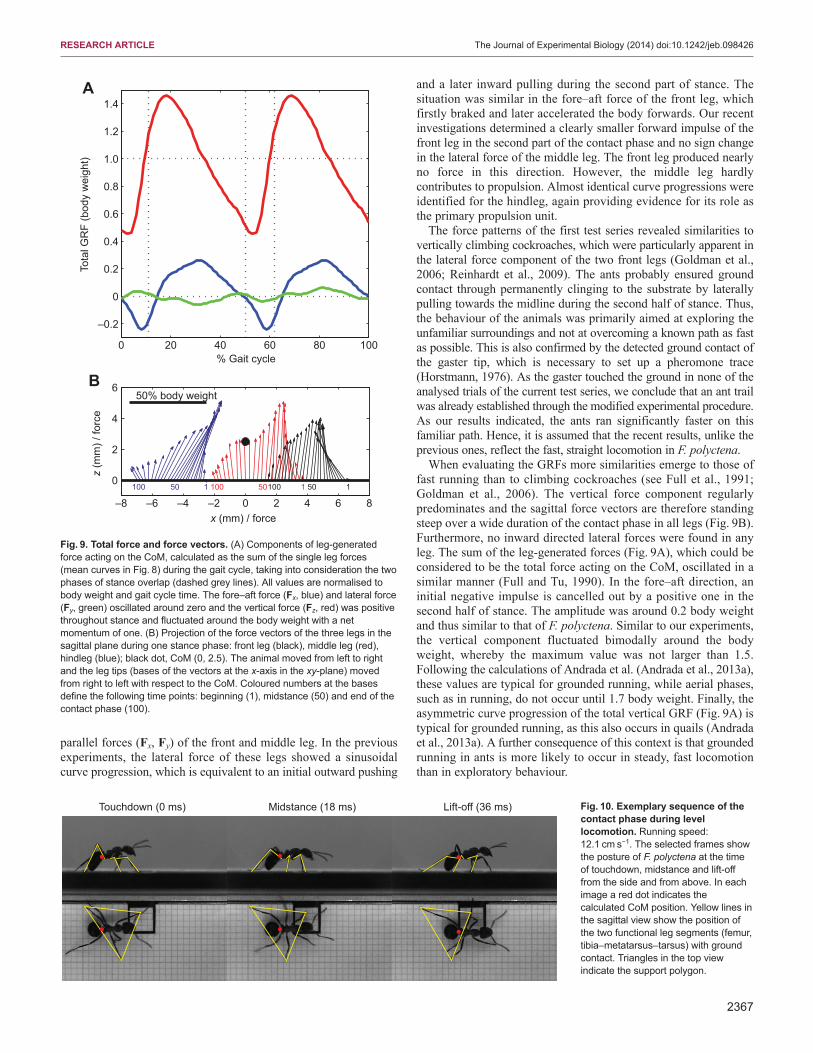
2367
RESEARCH ARTICLE The Journal of Experimental Biology (2014) doi:10.1242/jeb.098426
parallel forces (Fx, Fy) of the front and middle leg. In the previousexperiments, the lateral force of these legs showed a sinusoidalcurve progression, which is equivalent to an initial outward pushing
and a later inward pulling during the second part of stance. Thesituation was similar in the fore–aft force of the front leg, whichfirstly braked and later accelerated the body forwards. Our recentinvestigations determined a clearly smaller forward impulse of thefront leg in the second part of the contact phase and no sign changein the lateral force of the middle leg. The front leg produced nearlyno force in this direction. However, the middle leg hardlycontributes to propulsion. Almost identical curve progressions wereidentified for the hindleg, again providing evidence for its role asthe primary propulsion unit.
The force patterns of the first test series revealed similarities tovertically climbing cockroaches, which were particularly apparent inthe lateral force component of the two front legs (Goldman et al.,2006; Reinhardt et al., 2009). The ants probably ensured groundcontact through permanently clinging to the substrate by laterallypulling towards the midline during the second half of stance. Thus,the behaviour of the animals was primarily aimed at exploring theunfamiliar surroundings and not at overcoming a known path as fastas possible. This is also confirmed by the detected ground contact ofthe gaster tip, which is necessary to set up a pheromone trace(Horstmann, 1976). As the gaster touched the ground in none of theanalysed trials of the current test series, we conclude that an ant trailwas already established through the modified experimental procedure.As our results indicated, the ants ran significantly faster on thisfamiliar path. Hence, it is assumed that the recent results, unlike theprevious ones, reflect the fast, straight locomotion in F. polyctena.
When evaluating the GRFs more similarities emerge to those offast running than to climbing cockroaches (see Full et al., 1991;Goldman et al., 2006). The vertical force component regularlypredominates and the sagittal force vectors are therefore standingsteep over a wide duration of the contact phase in all legs (Fig. 9B).Furthermore, no inward directed lateral forces were found in anyleg. The sum of the leg-generated forces (Fig. 9A), which could beconsidered to be the total force acting on the CoM, oscillated in asimilar manner (Full and Tu, 1990). In the fore–aft direction, aninitial negative impulse is cancelled out by a positive one in thesecond half of stance. The amplitude was around 0.2 body weightand thus similar to that of F. polyctena. Similar to our experiments,the vertical component fluctuated bimodally around the bodyweight, whereby the maximum value was not larger than 1.5.Following the calculations of Andrada et al. (Andrada et al., 2013a),these values are typical for grounded running, while aerial phases,such as in running, do not occur until 1.7 body weight. Finally, theasymmetric curve progression of the total vertical GRF (Fig. 9A) istypical for grounded running, as this also occurs in quails (Andradaet al., 2013a). A further consequence of this context is that groundedrunning in ants is more likely to occur in steady, fast locomotionthan in exploratory behaviour.
–8 –6 –4 –2 0 2 4 6 8
0
2
4
650% body weight
x (mm) / force
z (m
m) /
forc
e
B
A
0 20 40 60 80 100
–0.2
0
0.2
0.4
0.6
0.8
1.0
1.2
1.4
% Gait cycle
Tota
l GR
F (b
ody
wei
ght)
1100 50 100 50 1 1100 50
Fig. 9. Total force and force vectors. (A) Components of leg-generatedforce acting on the CoM, calculated as the sum of the single leg forces(mean curves in Fig. 8) during the gait cycle, taking into consideration the twophases of stance overlap (dashed grey lines). All values are normalised tobody weight and gait cycle time. The fore–aft force (Fx, blue) and lateral force(Fy, green) oscillated around zero and the vertical force (Fz, red) was positivethroughout stance and fluctuated around the body weight with a netmomentum of one. (B) Projection of the force vectors of the three legs in thesagittal plane during one stance phase: front leg (black), middle leg (red),hindleg (blue); black dot, CoM (0, 2.5). The animal moved from left to rightand the leg tips (bases of the vectors at the x-axis in the xy-plane) movedfrom right to left with respect to the CoM. Coloured numbers at the basesdefine the following time points: beginning (1), midstance (50) and end of thecontact phase (100).
Touchdown (0 ms) Midstance (18 ms) Lift-off (36 ms) Fig. 10. Exemplary sequence of thecontact phase during levellocomotion. Running speed:12.1 cm s−1. The selected frames showthe posture of F. polyctena at the timeof touchdown, midstance and lift-offfrom the side and from above. In eachimage a red dot indicates thecalculated CoM position. Yellow lines inthe sagittal view show the position ofthe two functional leg segments (femur,tibia–metatarsus–tarsus) with groundcontact. Triangles in the top viewindicate the support polygon.
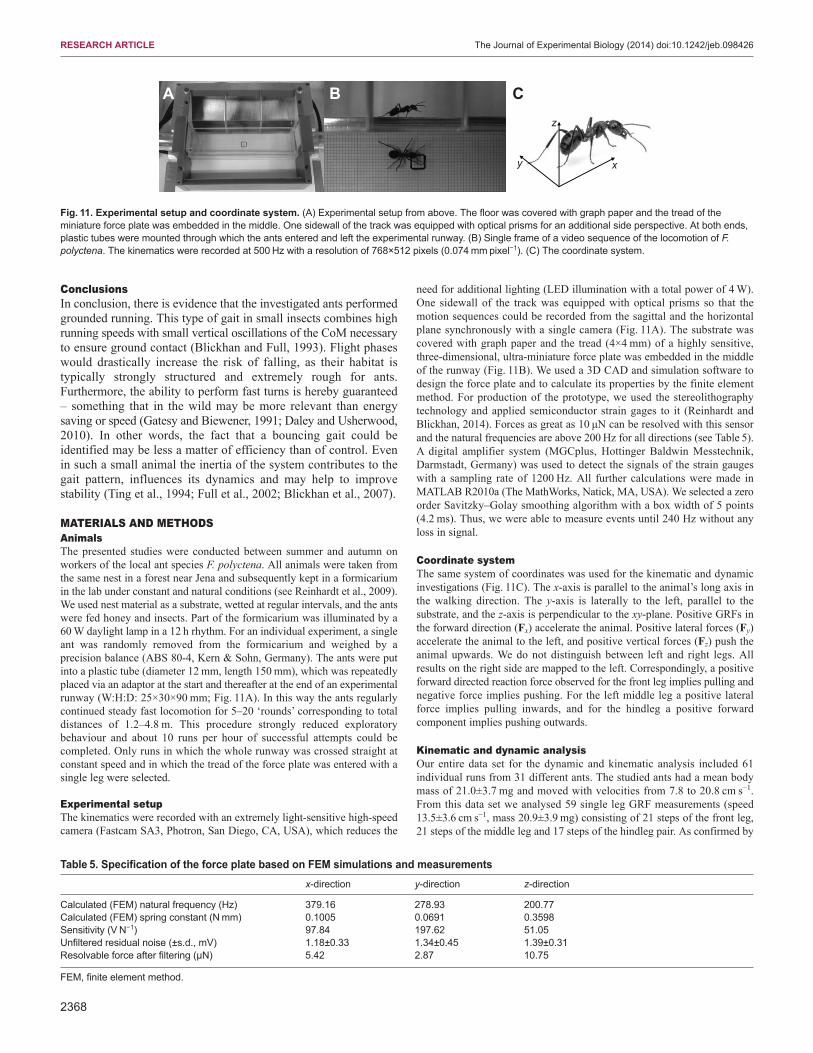
2368
RESEARCH ARTICLE The Journal of Experimental Biology (2014) doi:10.1242/jeb.098426
ConclusionsIn conclusion, there is evidence that the investigated ants performedgrounded running. This type of gait in small insects combines highrunning speeds with small vertical oscillations of the CoM necessaryto ensure ground contact (Blickhan and Full, 1993). Flight phaseswould drastically increase the risk of falling, as their habitat istypically strongly structured and extremely rough for ants.Furthermore, the ability to perform fast turns is hereby guaranteed– something that in the wild may be more relevant than energysaving or speed (Gatesy and Biewener, 1991; Daley and Usherwood,2010). In other words, the fact that a bouncing gait could beidentified may be less a matter of efficiency than of control. Evenin such a small animal the inertia of the system contributes to thegait pattern, influences its dynamics and may help to improvestability (Ting et al., 1994; Full et al., 2002; Blickhan et al., 2007).
MATERIALS AND METHODSAnimalsThe presented studies were conducted between summer and autumn onworkers of the local ant species F. polyctena. All animals were taken fromthe same nest in a forest near Jena and subsequently kept in a formicariumin the lab under constant and natural conditions (see Reinhardt et al., 2009).We used nest material as a substrate, wetted at regular intervals, and the antswere fed honey and insects. Part of the formicarium was illuminated by a60 W daylight lamp in a 12 h rhythm. For an individual experiment, a singleant was randomly removed from the formicarium and weighed by aprecision balance (ABS 80-4, Kern & Sohn, Germany). The ants were putinto a plastic tube (diameter 12 mm, length 150 mm), which was repeatedlyplaced via an adaptor at the start and thereafter at the end of an experimentalrunway (W:H:D: 25×30×90 mm; Fig. 11A). In this way the ants regularlycontinued steady fast locomotion for 5–20 ‘rounds’ corresponding to totaldistances of 1.2–4.8 m. This procedure strongly reduced exploratorybehaviour and about 10 runs per hour of successful attempts could becompleted. Only runs in which the whole runway was crossed straight atconstant speed and in which the tread of the force plate was entered with asingle leg were selected.
Experimental setupThe kinematics were recorded with an extremely light-sensitive high-speedcamera (Fastcam SA3, Photron, San Diego, CA, USA), which reduces the
need for additional lighting (LED illumination with a total power of 4 W).One sidewall of the track was equipped with optical prisms so that themotion sequences could be recorded from the sagittal and the horizontalplane synchronously with a single camera (Fig. 11A). The substrate wascovered with graph paper and the tread (4×4 mm) of a highly sensitive,three-dimensional, ultra-miniature force plate was embedded in the middleof the runway (Fig. 11B). We used a 3D CAD and simulation software todesign the force plate and to calculate its properties by the finite elementmethod. For production of the prototype, we used the stereolithographytechnology and applied semiconductor strain gages to it (Reinhardt andBlickhan, 2014). Forces as great as 10 μN can be resolved with this sensorand the natural frequencies are above 200 Hz for all directions (see Table 5).A digital amplifier system (MGCplus, Hottinger Baldwin Messtechnik,Darmstadt, Germany) was used to detect the signals of the strain gaugeswith a sampling rate of 1200 Hz. All further calculations were made inMATLAB R2010a (The MathWorks, Natick, MA, USA). We selected a zeroorder Savitzky–Golay smoothing algorithm with a box width of 5 points(4.2 ms). Thus, we were able to measure events until 240 Hz without anyloss in signal.
Coordinate systemThe same system of coordinates was used for the kinematic and dynamicinvestigations (Fig. 11C). The x-axis is parallel to the animal’s long axis inthe walking direction. The y-axis is laterally to the left, parallel to thesubstrate, and the z-axis is perpendicular to the xy-plane. Positive GRFs inthe forward direction (Fx) accelerate the animal. Positive lateral forces (Fy)accelerate the animal to the left, and positive vertical forces (Fz) push theanimal upwards. We do not distinguish between left and right legs. Allresults on the right side are mapped to the left. Correspondingly, a positiveforward directed reaction force observed for the front leg implies pulling andnegative force implies pushing. For the left middle leg a positive lateralforce implies pulling inwards, and for the hindleg a positive forwardcomponent implies pushing outwards.
Kinematic and dynamic analysisOur entire data set for the dynamic and kinematic analysis included 61individual runs from 31 different ants. The studied ants had a mean bodymass of 21.0±3.7 mg and moved with velocities from 7.8 to 20.8 cm s−1.From this data set we analysed 59 single leg GRF measurements (speed13.5±3.6 cm s−1, mass 20.9±3.9 mg) consisting of 21 steps of the front leg,21 steps of the middle leg and 17 steps of the hindleg pair. As confirmed by
CBA
xy
z
Fig. 11. Experimental setup and coordinate system. (A) Experimental setup from above. The floor was covered with graph paper and the tread of theminiature force plate was embedded in the middle. One sidewall of the track was equipped with optical prisms for an additional side perspective. At both ends,plastic tubes were mounted through which the ants entered and left the experimental runway. (B) Single frame of a video sequence of the locomotion of F.polyctena. The kinematics were recorded at 500 Hz with a resolution of 768×512 pixels (0.074 mm pixel−1). (C) The coordinate system.
Table 5. Specification of the force plate based on FEM simulations and measurementsx-direction y-direction z-direction
Calculated (FEM) natural frequency (Hz) 379.16 278.93 200.77Calculated (FEM) spring constant (N mm) 0.1005 0.0691 0.3598Sensitivity (V N−1) 97.84 197.62 51.05Unfiltered residual noise (±s.d., mV) 1.18±0.33 1.34±0.45 1.39±0.31Resolvable force after filtering (µN) 5.42 2.87 10.75
FEM, finite element method.
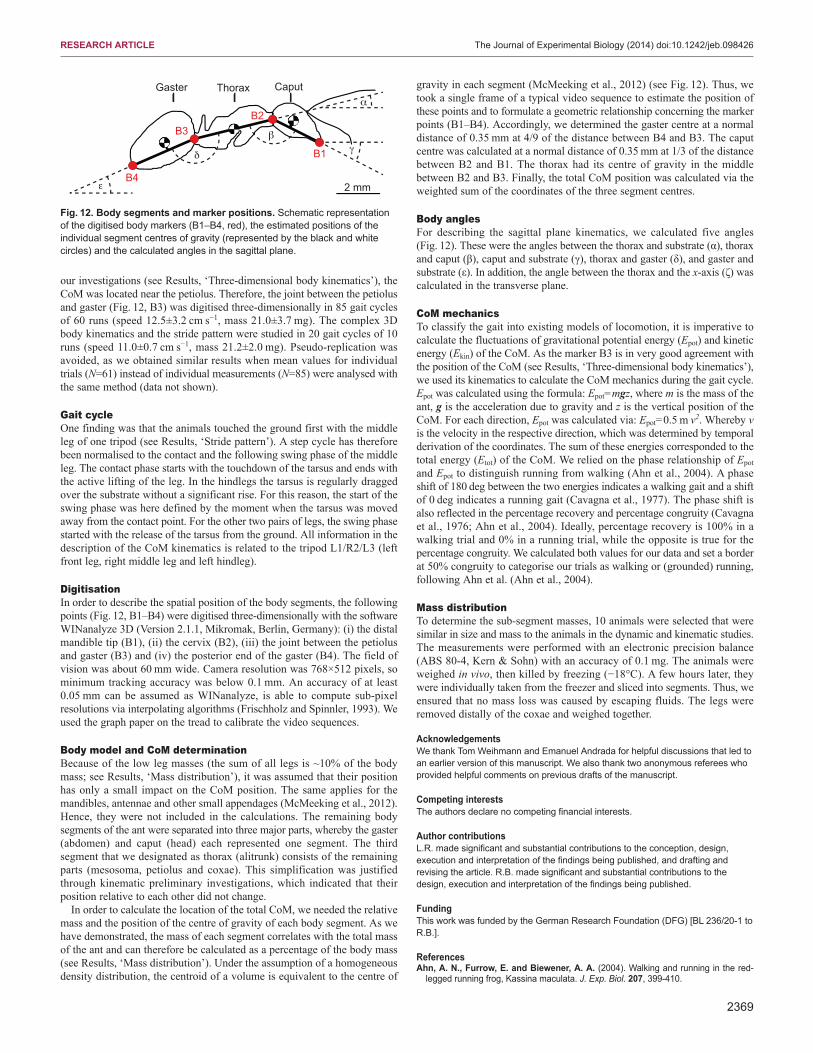
2369
RESEARCH ARTICLE The Journal of Experimental Biology (2014) doi:10.1242/jeb.098426
our investigations (see Results, ‘Three-dimensional body kinematics’), theCoM was located near the petiolus. Therefore, the joint between the petiolusand gaster (Fig. 12, B3) was digitised three-dimensionally in 85 gait cyclesof 60 runs (speed 12.5±3.2 cm s−1, mass 21.0±3.7 mg). The complex 3Dbody kinematics and the stride pattern were studied in 20 gait cycles of 10runs (speed 11.0±0.7 cm s−1, mass 21.2±2.0 mg). Pseudo-replication wasavoided, as we obtained similar results when mean values for individualtrials (N=61) instead of individual measurements (N=85) were analysed withthe same method (data not shown).
Gait cycleOne finding was that the animals touched the ground first with the middleleg of one tripod (see Results, ‘Stride pattern’). A step cycle has thereforebeen normalised to the contact and the following swing phase of the middleleg. The contact phase starts with the touchdown of the tarsus and ends withthe active lifting of the leg. In the hindlegs the tarsus is regularly draggedover the substrate without a significant rise. For this reason, the start of theswing phase was here defined by the moment when the tarsus was movedaway from the contact point. For the other two pairs of legs, the swing phasestarted with the release of the tarsus from the ground. All information in thedescription of the CoM kinematics is related to the tripod L1/R2/L3 (leftfront leg, right middle leg and left hindleg).
DigitisationIn order to describe the spatial position of the body segments, the followingpoints (Fig. 12, B1–B4) were digitised three-dimensionally with the softwareWINanalyze 3D (Version 2.1.1, Mikromak, Berlin, Germany): (i) the distalmandible tip (B1), (ii) the cervix (B2), (iii) the joint between the petiolusand gaster (B3) and (iv) the posterior end of the gaster (B4). The field ofvision was about 60 mm wide. Camera resolution was 768×512 pixels, sominimum tracking accuracy was below 0.1 mm. An accuracy of at least0.05 mm can be assumed as WINanalyze, is able to compute sub-pixelresolutions via interpolating algorithms (Frischholz and Spinnler, 1993). Weused the graph paper on the tread to calibrate the video sequences.
Body model and CoM determinationBecause of the low leg masses (the sum of all legs is ~10% of the bodymass; see Results, ‘Mass distribution’), it was assumed that their positionhas only a small impact on the CoM position. The same applies for themandibles, antennae and other small appendages (McMeeking et al., 2012).Hence, they were not included in the calculations. The remaining bodysegments of the ant were separated into three major parts, whereby the gaster(abdomen) and caput (head) each represented one segment. The thirdsegment that we designated as thorax (alitrunk) consists of the remainingparts (mesosoma, petiolus and coxae). This simplification was justifiedthrough kinematic preliminary investigations, which indicated that theirposition relative to each other did not change.
In order to calculate the location of the total CoM, we needed the relativemass and the position of the centre of gravity of each body segment. As wehave demonstrated, the mass of each segment correlates with the total massof the ant and can therefore be calculated as a percentage of the body mass(see Results, ‘Mass distribution’). Under the assumption of a homogeneousdensity distribution, the centroid of a volume is equivalent to the centre of
gravity in each segment (McMeeking et al., 2012) (see Fig. 12). Thus, wetook a single frame of a typical video sequence to estimate the position ofthese points and to formulate a geometric relationship concerning the markerpoints (B1–B4). Accordingly, we determined the gaster centre at a normaldistance of 0.35 mm at 4/9 of the distance between B4 and B3. The caputcentre was calculated at a normal distance of 0.35 mm at 1/3 of the distancebetween B2 and B1. The thorax had its centre of gravity in the middlebetween B2 and B3. Finally, the total CoM position was calculated via theweighted sum of the coordinates of the three segment centres.
Body anglesFor describing the sagittal plane kinematics, we calculated five angles(Fig. 12). These were the angles between the thorax and substrate (α), thoraxand caput (β), caput and substrate (γ), thorax and gaster (δ), and gaster andsubstrate (ε). In addition, the angle between the thorax and the x-axis (ζ) wascalculated in the transverse plane.
CoM mechanicsTo classify the gait into existing models of locomotion, it is imperative tocalculate the fluctuations of gravitational potential energy (Epot) and kineticenergy (Ekin) of the CoM. As the marker B3 is in very good agreement withthe position of the CoM (see Results, ‘Three-dimensional body kinematics’),we used its kinematics to calculate the CoM mechanics during the gait cycle.Epot was calculated using the formula: Epot=mgz, where m is the mass of theant, g is the acceleration due to gravity and z is the vertical position of theCoM. For each direction, Epot was calculated via: Epot=0.5 m v2. Whereby vis the velocity in the respective direction, which was determined by temporalderivation of the coordinates. The sum of these energies corresponded to thetotal energy (Etot) of the CoM. We relied on the phase relationship of Epot
and Epot to distinguish running from walking (Ahn et al., 2004). A phaseshift of 180 deg between the two energies indicates a walking gait and a shiftof 0 deg indicates a running gait (Cavagna et al., 1977). The phase shift isalso reflected in the percentage recovery and percentage congruity (Cavagnaet al., 1976; Ahn et al., 2004). Ideally, percentage recovery is 100% in awalking trial and 0% in a running trial, while the opposite is true for thepercentage congruity. We calculated both values for our data and set a borderat 50% congruity to categorise our trials as walking or (grounded) running,following Ahn et al. (Ahn et al., 2004).
Mass distributionTo determine the sub-segment masses, 10 animals were selected that weresimilar in size and mass to the animals in the dynamic and kinematic studies.The measurements were performed with an electronic precision balance(ABS 80-4, Kern & Sohn) with an accuracy of 0.1 mg. The animals wereweighed in vivo, then killed by freezing (−18°C). A few hours later, theywere individually taken from the freezer and sliced into segments. Thus, weensured that no mass loss was caused by escaping fluids. The legs wereremoved distally of the coxae and weighed together.
AcknowledgementsWe thank Tom Weihmann and Emanuel Andrada for helpful discussions that led toan earlier version of this manuscript. We also thank two anonymous referees whoprovided helpful comments on previous drafts of the manuscript.
Competing interestsThe authors declare no competing financial interests.
Author contributionsL.R. made significant and substantial contributions to the conception, design,execution and interpretation of the findings being published, and drafting andrevising the article. R.B. made significant and substantial contributions to thedesign, execution and interpretation of the findings being published.
FundingThis work was funded by the German Research Foundation (DFG) [BL 236/20-1 toR.B.].
ReferencesAhn, A. N., Furrow, E. and Biewener, A. A. (2004). Walking and running in the red-
legged running frog, Kassina maculata. J. Exp. Biol. 207, 399-410.
2 mm
B1
B2B3
B4
β
δ
ε
α
γ
Gaster CaputThorax
Fig. 12. Body segments and marker positions. Schematic representationof the digitised body markers (B1–B4, red), the estimated positions of theindividual segment centres of gravity (represented by the black and whitecircles) and the calculated angles in the sagittal plane.
2370
RESEARCH ARTICLE The Journal of Experimental Biology (2014) doi:10.1242/jeb.098426
Alexander, R. M. (1966). Rubber-like properties of the inner hinge-ligament ofPectinidae. J. Exp. Biol. 44, 119-130. Alexander, R. M. and Jayes, A. S. (1978). Vertical movements in walking and running.
J. Zool. 185, 27-40. Andersen, S. O. (1963). Characterization of a new type of cross-linkage in resilin, a
rubber-like protein. Biochim. Biophys. Acta 69, 249-262. Andersen, S. O. (1964). The cross-links in resilin identified as dityrosine and
trityrosine. Biochim. Biophys. Acta 93, 213-215. Andersen, S. O. and Weis-Fogh, T. (1964). Resilin. A rubberlike protein in arthropod
cuticle. In Advances in Insect Physiology, Vol. 2 (ed. J. W. L. Beament, J. E.Treherne and V. B. Wigglesworth), pp. 1-65. Academic Press.
Anderson, S. O. (1966). Covalent cross-links in a structural protein, resilin. ActaPhysiol. Scand. Suppl. 263, 1-81.
Andrada, E., Rode, C. and Blickhan, R. (2013a). Grounded running in quails:simulations indicate benefits of observed fixed aperture angle between legs beforetouch-down. J. Theor. Biol. 335, 97-107.
Andrada, E., Nyakatura, J. A., Bergmann, F. and Blickhan, R. (2013b). Adjustmentsof global and local hindlimb properties during terrestrial locomotion of the commonquail (Coturnix coturnix). J. Exp. Biol. 216, 3906-3916.
Bennet-Clark, H. (2007). The first description of resilin. J. Exp. Biol. 210, 3879-3881. Biewener, A. A. (1990). Biomechanics of mammalian terrestrial locomotion. Science
250, 1097-1103. Biknevicius, A. R., Reilly, S. M., McElroy, E. J. and Bennett, M. B. (2013).
Symmetrical gaits and center of mass mechanics in small-bodied, primitivemammals. Zoology 116, 67-74.
Blickhan, R. and Full, R. J. (1987). Locomotion energetics of the Ghost crab: II.mechanics of the centre of mass during walking and running. J. Exp. Biol. 130, 155-174.
Blickhan, R. and Full, R. J. (1993). Similarity in multilegged locomotion: bouncing likea monopode. J. Comp. Physiol. A 173, 509-517.
Blickhan, R., Seyfarth, A., Geyer, H., Grimmer, S., Wagner, H. and Günther, M.(2007). Intelligence by mechanics. Philos. Trans. R. Soc. A 365, 199-220.
Cavagna, G. A., Saibene, F. P. and Margaria, R. (1964). Mechanical work in running.J. Appl. Physiol. 19, 249-256.
Cavagna, G. A., Thys, H. and Zamboni, A. (1976). The sources of external work inlevel walking and running. J. Physiol. 262, 639-657.
Cavagna, G. A., Heglund, N. C. and Taylor, C. R. (1977). Mechanical work interrestrial locomotion: two basic mechanisms for minimizing energy expenditure. Am.J. Physiol. 233, R243-R261.
Daley, M. A. and Usherwood, J. R. (2010). Two explanations for the compliantrunning paradox: reduced work of bouncing viscera and increased stability in uneventerrain. Biol. Lett. 6, 418-421.
Delcomyn, F. (1971). The locomotion of the cockroach Periplaneta americana. J. Exp.Biol. 54, 443-452.
Duch, C. and Pflüger, H. J. (1995). Motor patterns for horizontal and upside downwalking and vertical climbing in the locust. J. Exp. Biol. 198, 1963-1976.
Dudek, D. M. and Full, R. J. (2006). Passive mechanical properties of legs fromrunning insects. J. Exp. Biol. 209, 1502-1515.
Dudek, D. M. and Full, R. J. (2007). An isolated insect leg’s passive recovery fromdorso-ventral perturbations. J. Exp. Biol. 210, 3209-3217.
Federle, W., Rohrseitz, K. and Hölldobler, B. (2000). Attachment forces of antsmeasured with a centrifuge: better ‘wax-runners’ have a poorer attachment to asmooth surface. J. Exp. Biol. 203, 505-512.
Frischholz, R. W. and Spinnler, K. P. (1993). Class of algorithms for real-timesubpixel registration. Proc. SPIE 1989, 50-59.
Full, R. (1991). The concepts of efficiency and economy in land locomotion. InEfficiency and Economy in Animal Physiology (ed. R. W. Blake), 97-131. Cambridge:Cambridge University Press.
Full, R. J. and Koehl, M. A. R. (1993). Drag and lift on running insects. J. Exp. Biol.176, 89-101.
Full, R. J. and Tu, M. S. (1990). Mechanics of six-legged runners. J. Exp. Biol. 148,129-146.
Full, R. J. and Tu, M. S. (1991). Mechanics of a rapid running insect: two-, four- andsix-legged locomotion. J. Exp. Biol. 156, 215-231.
Full, R. J., Blickhan, R. and Ting, L. H. (1991). Leg design in hexapedal runners. J.Exp. Biol. 158, 369-390.
Full, R. J., Kubow, T., Schmitt, J., Holmes, P. and Koditschek, D. (2002).Quantifying dynamic stability and maneuverability in legged locomotion. Integr.Comp. Biol. 42, 149-157.
Garcia, M., Kuo, A., Peattie, A. M., Wang, P. C. and Full, R. J. (2000). Damping andsize: Insights and biological inspiration. In International Symposium on AdaptiveMotion of Animals and Machines. Montreal: McGill University.
Gatesy, S. M. (1999). Guineafowl hind limb function. I: Cineradiographic analysis andspeed effects. J. Morphol. 240, 115-125.
Gatesy, S. M. and Biewener, A. A. (1991). Bipedal locomotion: effects of speed, sizeand limb posture in birds and humans. J. Zool. 224, 127-147.
Geyer, H., Seyfarth, A. and Blickhan, R. (2006). Compliant leg behaviour explainsbasic dynamics of walking and running. Proc. Biol. Sci. 273, 2861-2867.
Gladun, D. and Gorb, S. (2007). Insect walking techniques on thin stems. Arthropod-Plant Interact. 1, 77-91.
Goldman, D. I., Chen, T. S., Dudek, D. M. and Full, R. J. (2006). Dynamics of rapidvertical climbing in cockroaches reveals a template. J. Exp. Biol. 209, 2990-3000.
Graham, D. and Cruse, H. (1981). Coordinated walking of stick insects on a mercurysurface. J. Exp. Biol. 92, 229-241.
Heglund, N. C., Fedak, M. A., Taylor, C. R. and Cavagna, G. A. (1982). Energeticsand mechanics of terrestrial locomotion. IV. Total mechanical energy changes as afunction of speed and body size in birds and mammals. J. Exp. Biol. 97, 57-66.
Hooper, S. L., Guschlbauer, C., Blümel, M., Rosenbaum, P., Gruhn, M., Akay, T.and Büschges, A. (2009). Neural control of unloaded leg posture and of leg swingin stick insect, cockroach, and mouse differs from that in larger animals. J. Neurosci.29, 4109-4119.
Horstmann, K. (1976). Über die duftspur-orientierung bei waldameisen (Formicapolyctena Foerster). Insectes Soc. 23, 227-242.
Hughes, G. M. (1952). The co-ordination of insect movements: I the walkingmovements of insects. J. Exp. Biol. 29, 267-285.
Hutchinson, J. R., Famini, D., Lair, R. and Kram, R. (2003). Biomechanics: are fast-moving elephants really running? Nature 422, 493-494.
Josens, R. B., Farina, W. M. and Roces, F. (1998). Nectar feeding by the antCamponotus mus: intake rate and crop filling as a function of sucrose concentration.J. Insect Physiol. 44, 579-585.
Kimura, T. (1996). Centre of gravity of the body during the ontogeny of chimpanzeebipedal walking. Folia Primatol. (Basel) 66, 126-136.
Kirchner, W. (2001). Die Ameisen: Biologie und Verhalten. Munich: Beck C. H. Koditschek, D. E., Full, R. J. and Buehler, M. (2004). Mechanical aspects of legged
locomotion control. Arthropod Struct. Dev. 33, 251-272. Larsen, G. S., Frazier, S. F., Fish, S. E. and Zill, S. N. (1995). Effects of load
inversion in cockroach walking. J. Comp. Physiol. A 176, 229-238. Lipfert, S. W., Günther, M., Renjewski, D., Grimmer, S. and Seyfarth, A. (2012). A
model-experiment comparison of system dynamics for human walking and running.J. Theor. Biol. 292, 11-17.
McMahon, T. A., Valiant, G. and Frederick, E. C. (1987). Groucho running. J. Appl.Physiol. 62, 2326-2337.
McMeeking, R. M., Arzt, E. and Wehner, R. (2012). Cataglyphis desert ants improvetheir mobility by raising the gaster. J. Theor. Biol. 297, 17-25.
Michels, J. and Gorb, S. N. (2012). Detailed three-dimensional visualization of resilinin the exoskeleton of arthropods using confocal laser scanning microscopy. J.Microsc. 245, 1-16.
Muir, G. D., Gosline, J. M. and Steeves, J. D. (1996). Ontogeny of bipedallocomotion: walking and running in the chick. J. Physiol. 493, 589-601.
Neff, D., Frazier, S. F., Quimby, L., Wang, R. T. and Zill, S. (2000). Identification ofresilin in the leg of cockroach, Periplaneta americana: confirmation by a simplemethod using pH dependence of UV fluorescence. Arthropod Struct. Dev. 29, 75-83.
Nyakatura, J. A., Andrada, E., Grimm, N., Weise, H. and Fischer, M. S. (2012).Kinematics and center of mass mechanics during terrestrial locomotion in northernlapwings (Vanellus vanellus, Charadriiformes). J. Exp. Zool. A 317, 580-594.
Patek, S. N., Dudek, D. M. and Rosario, M. V. (2011). From bouncy legs to poisonedarrows: elastic movements in invertebrates. J. Exp. Biol. 214, 1973-1980.
Pelletier, Y. and Caissie, R. (2001). Behavioural and physical reactions of theColorado potato beetle, Leptinotarsa decemlineata (Say) (Coleoptera:Chrysomelidae) walking on a slanted surface. Biol. Cybern. 84, 269-277.
Reilly, S. M., McElroy, E. J. and Biknevicius, A. R. (2007). Posture, gait and theecological relevance of locomotor costs and energy-saving mechanisms intetrapods. Zoology 110, 271-289.
Reinhardt, L. and Blickhan, R. (2014). Ultra-miniature force plate for measuringtriaxial forces in the micronewton range. J. Exp. Biol. 217, 704-710.
Reinhardt, L., Weihmann, T. and Blickhan, R. (2009). Dynamics and kinematics ofant locomotion: do wood ants climb on level surfaces? J. Exp. Biol. 212, 2426-2435.
Rubenson, J., Heliams, D. B., Lloyd, D. G. and Fournier, P. A. (2004). Gait selectionin the ostrich: mechanical and metabolic characteristics of walking and running withand without an aerial phase. Proc. Biol. Sci. 271, 1091-1099.
Ruina, A., Bertram, J. E. A. and Srinivasan, M. (2005). A collisional model of theenergetic cost of support work qualitatively explains leg sequencing in walking andgalloping, pseudo-elastic leg behavior in running and the walk-to-run transition. J.Theor. Biol. 237, 170-192.
Sannasi, A. (1969). Resilin in the cuticle of click beetles. J. Georgia Entomol. Soc. 4,31-32.
Schmitt, D. (1999). Compliant walking in primates. J. Zool. 248, 149-160. Schmitt, D. (2003). Insights into the evolution of human bipedalism from experimental
studies of humans and other primates. J. Exp. Biol. 206, 1437-1448. Schmitt, J., Garcia, M., Razo, R. C., Holmes, P. and Full, R. J. (2002). Dynamics and
stability of legged locomotion in the horizontal plane: a test case using insects. Biol.Cybern. 86, 343-353.
Seidl, T. and Wehner, R. (2008). Walking on inclines: how do desert ants monitorslope and step length. Front. Zool. 5, 8.
Sponberg, S. and Full, R. J. (2008). Neuromechanical response of musculo-skeletalstructures in cockroaches during rapid running on rough terrain. J. Exp. Biol. 211,433-446.
Srinivasan, M. and Holmes, P. (2008). How well can spring-mass-like telescoping legmodels fit multi-pedal sagittal-plane locomotion data? J. Theor. Biol. 255, 1-7.
Srinivasan, M. and Ruina, A. (2006). Computer optimization of a minimal biped modeldiscovers walking and running. Nature 439, 72-75.
Ting, L. H., Blickhan, R. and Full, R. J. (1994). Dynamic and static stability inhexapedal runners. J. Exp. Biol. 197, 251-269.
Weihmann, T. and Blickhan, R. (2009). Comparing inclined locomotion in a ground-living and a climbing ant species: sagittal plane kinematics. J. Comp. Physiol. A 195,1011-1020.
Weis-Fogh, T. (1960). A rubber-like protein in insect cuticle. J. Exp. Biol. 37, 889-907. Zollikofer, C. (1994). Stepping patterns in ants – influence of speed and curvature. J.
Exp. Biol. 192, 95-106.
6 Poster I (Climbing strategies in ants)
Climbing strategies in ants
Reinhardt, L.1
Jahrestagung der Society for Experimental Biology, 2013, 3.7-6.7, Valencia, Spanien.
Akzeptiert: 10. Mai 2013
1 Friedrich-Schiller-Universität Jena
Institut für Sportwissenschaft
LS Bewegungswissenschaft
Seidelstr. 20
07749 Jena, Deutschland
Korrespondierender Autor
Lars Reinhardt
Email: [email protected]
Tel.: +49 3641 9 45706
6 Poster I (Climbing strategies in ants) 23
6.1 Introduction
Climbing is an everyday challenge for insects because they always have to move in a
highly structured environment. However, the strategies how these fast runners cope with
slopes are largely unknown so far. In order to better understand these strategies we have
studied continuous, upward locomotion of the wood ant species Formica polyctena at sub-
strate angles from 0° to 90°.
6.2 Materials and Methods
We have measured the ground reaction forces of the single legs on a relatively smooth
substrate at slopes between 0° and 90°. Thereby a highly sensitive, self-built ultra-miniature
force platform came to use. Simultaneously, kinematics were recorded from two orthogonal
perspectives using a high-speed video camera with 500 single pictures per second. Repre-
sentative points were digitized with the software WINanalyze 2.1 (Mikromak Service, Ber-
lin, Germany) and transferred into three-dimensional coordinates. Only runs were selected
in which the whole channel (10 cm) has been run through straight and with constant speed.
6.3 Results
Formica polyctena do not make any slope dependent modifications in posture and
stride pattern. Although velocities are largest at level substrates, they only decrease slightly
at higher slopes (cp. Tab. 6.1). As expected, the situation is quite different in the ground
reaction forces, which characterize the functioning of the single legs. Only the hind legs in
principle retain their mode of operation. As can be seen on the unchanged orientation of the
force vector (cp. Abb. 6.1). However, in the front and middle legs the angle between sub-
strate and force vector decreases with increasing incline. In concrete terms, this means that
Fx and Fy are growing while Fz is getting smaller. Thus, when climbing, the front legs gen-
erate high pulling forces, directed towards the body in anterio-posterior (96% FG) and lateral
direction. At slope angles greater than 45° the front leg pulls on the substrate (Fz < 0). These
forces have approximately the same amount as the opposite directed normal forces of the
hind legs.
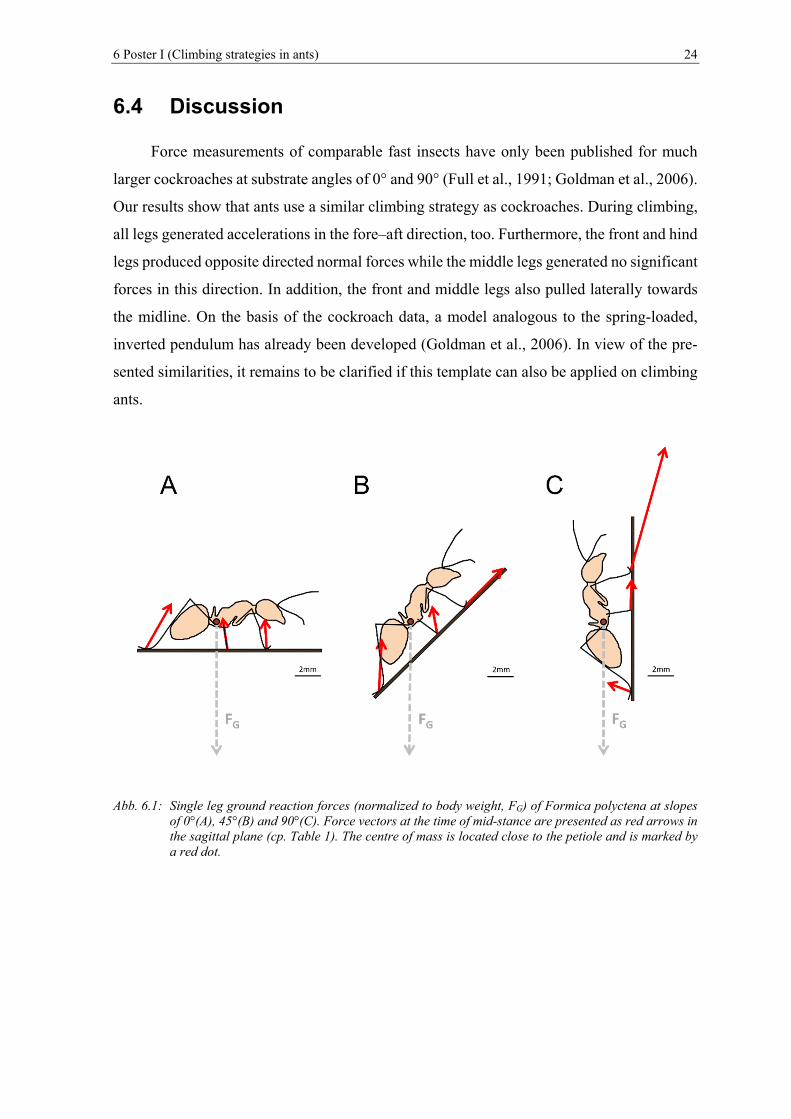
6 Poster I (Climbing strategies in ants) 24
6.4 Discussion
Force measurements of comparable fast insects have only been published for much
larger cockroaches at substrate angles of 0° and 90° (Full et al., 1991; Goldman et al., 2006).
Our results show that ants use a similar climbing strategy as cockroaches. During climbing,
all legs generated accelerations in the fore–aft direction, too. Furthermore, the front and hind
legs produced opposite directed normal forces while the middle legs generated no significant
forces in this direction. In addition, the front and middle legs also pulled laterally towards
the midline. On the basis of the cockroach data, a model analogous to the spring-loaded,
inverted pendulum has already been developed (Goldman et al., 2006). In view of the pre-
sented similarities, it remains to be clarified if this template can also be applied on climbing
ants.
Abb. 6.1: Single leg ground reaction forces (normalized to body weight, FG) of Formica polyctena at slopes of 0°(A), 45°(B) and 90°(C). Force vectors at the time of mid-stance are presented as red arrows in the sagittal plane (cp. Table 1). The centre of mass is located close to the petiole and is marked by a red dot.
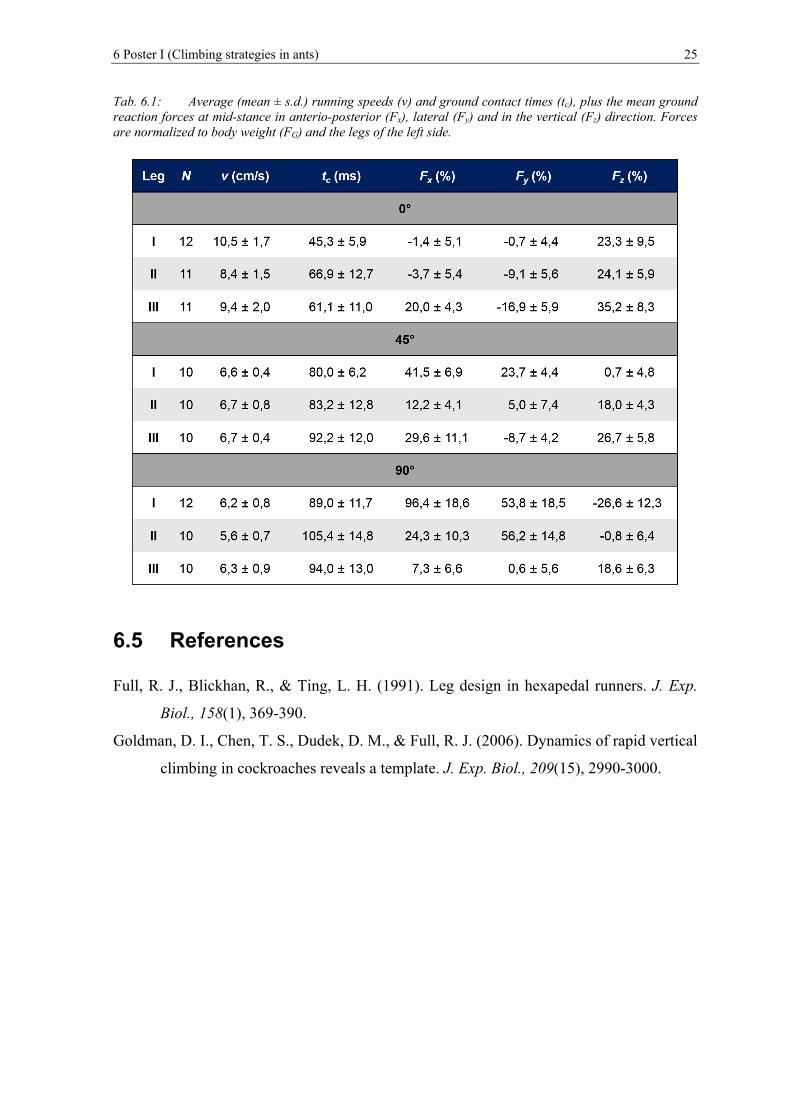
6 Poster I (Climbing strategies in ants) 25
Tab. 6.1: Average (mean ± s.d.) running speeds (v) and ground contact times (tc), plus the mean ground reaction forces at mid-stance in anterio-posterior (Fx), lateral (Fy) and in the vertical (Fz) direction. Forces are normalized to body weight (FG) and the legs of the left side.
6.5 References
Full, R. J., Blickhan, R., & Ting, L. H. (1991). Leg design in hexapedal runners. J. Exp.
Biol., 158(1), 369-390.
Goldman, D. I., Chen, T. S., Dudek, D. M., & Full, R. J. (2006). Dynamics of rapid vertical
climbing in cockroaches reveals a template. J. Exp. Biol., 209(15), 2990-3000.
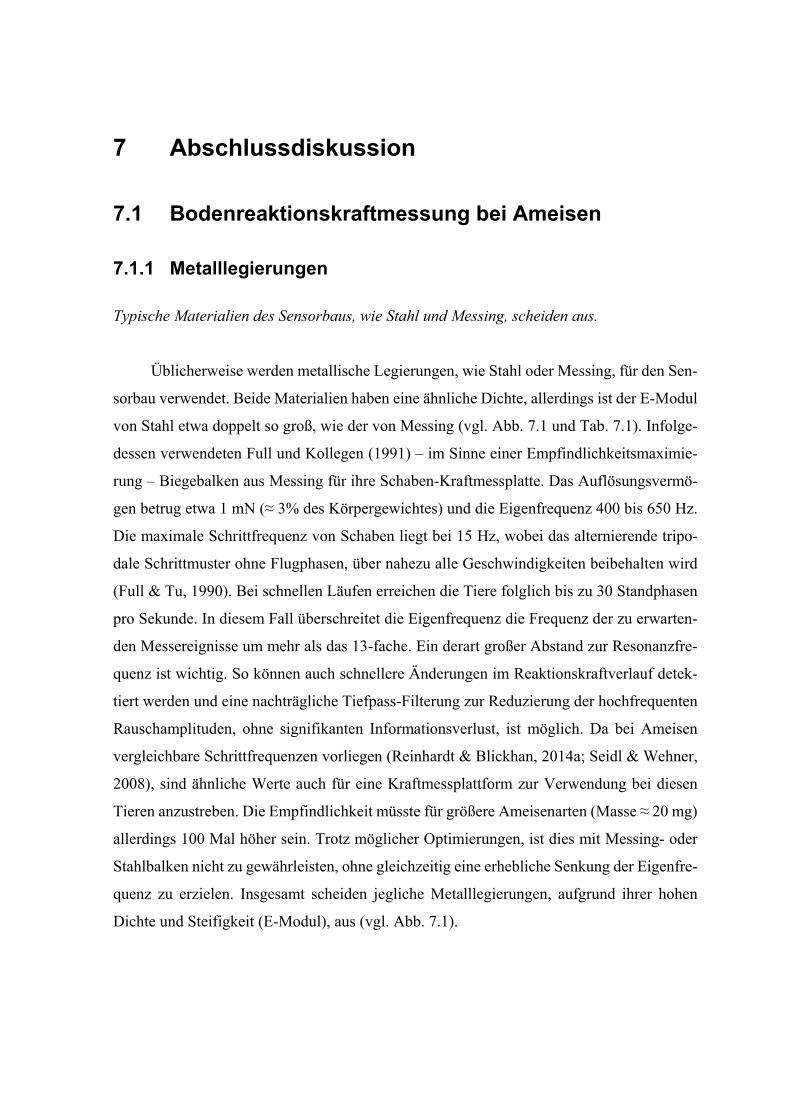
7 Abschlussdiskussion
7.1 Bodenreaktionskraftmessung bei Ameisen
7.1.1 Metalllegierungen
Typische Materialien des Sensorbaus, wie Stahl und Messing, scheiden aus.
Üblicherweise werden metallische Legierungen, wie Stahl oder Messing, für den Sen-
sorbau verwendet. Beide Materialien haben eine ähnliche Dichte, allerdings ist der E-Modul
von Stahl etwa doppelt so groß, wie der von Messing (vgl. Abb. 7.1 und Tab. 7.1). Infolge-
dessen verwendeten Full und Kollegen (1991) – im Sinne einer Empfindlichkeitsmaximie-
rung – Biegebalken aus Messing für ihre Schaben-Kraftmessplatte. Das Auflösungsvermö-
gen betrug etwa 1 mN (≈ 3% des Körpergewichtes) und die Eigenfrequenz 400 bis 650 Hz.
Die maximale Schrittfrequenz von Schaben liegt bei 15 Hz, wobei das alternierende tripo-
dale Schrittmuster ohne Flugphasen, über nahezu alle Geschwindigkeiten beibehalten wird
(Full & Tu, 1990). Bei schnellen Läufen erreichen die Tiere folglich bis zu 30 Standphasen
pro Sekunde. In diesem Fall überschreitet die Eigenfrequenz die Frequenz der zu erwarten-
den Messereignisse um mehr als das 13-fache. Ein derart großer Abstand zur Resonanzfre-
quenz ist wichtig. So können auch schnellere Änderungen im Reaktionskraftverlauf detek-
tiert werden und eine nachträgliche Tiefpass-Filterung zur Reduzierung der hochfrequenten
Rauschamplituden, ohne signifikanten Informationsverlust, ist möglich. Da bei Ameisen
vergleichbare Schrittfrequenzen vorliegen (Reinhardt & Blickhan, 2014a; Seidl & Wehner,
2008), sind ähnliche Werte auch für eine Kraftmessplattform zur Verwendung bei diesen
Tieren anzustreben. Die Empfindlichkeit müsste für größere Ameisenarten (Masse ≈ 20 mg)
allerdings 100 Mal höher sein. Trotz möglicher Optimierungen, ist dies mit Messing- oder
Stahlbalken nicht zu gewährleisten, ohne gleichzeitig eine erhebliche Senkung der Eigenfre-
quenz zu erzielen. Insgesamt scheiden jegliche Metalllegierungen, aufgrund ihrer hohen
Dichte und Steifigkeit (E-Modul), aus (vgl. Abb. 7.1).
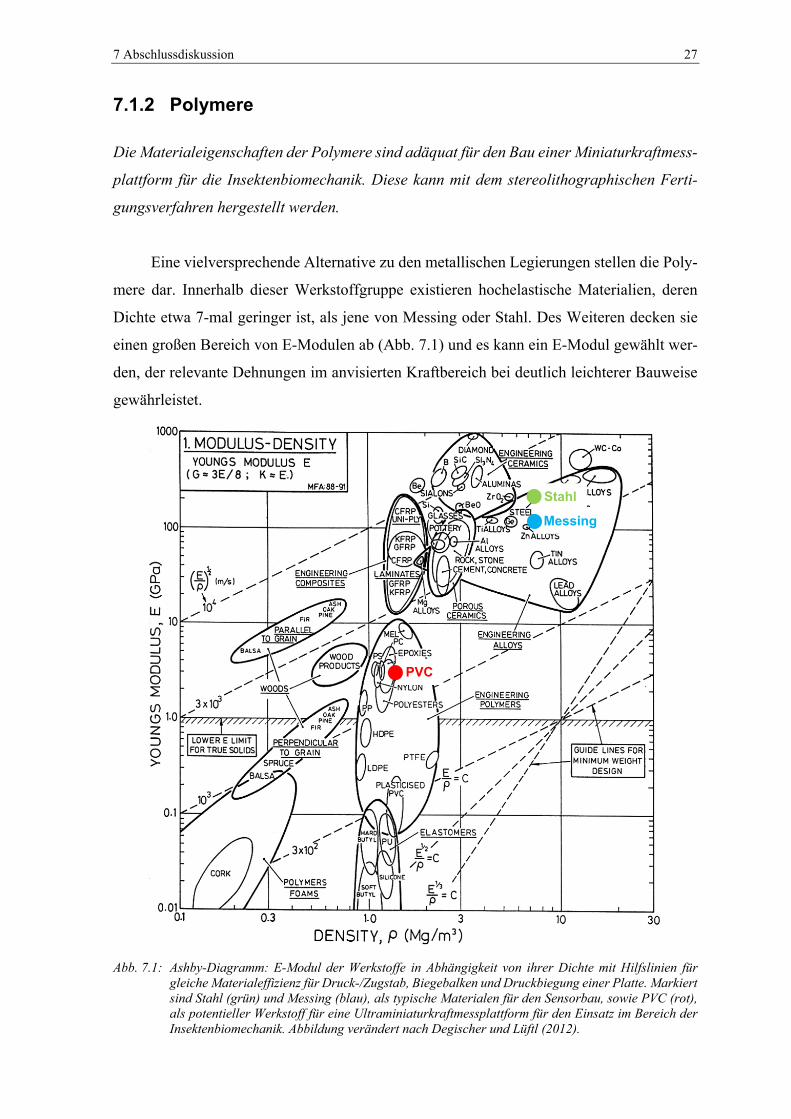
7 Abschlussdiskussion 27
7.1.2 Polymere
Die Materialeigenschaften der Polymere sind adäquat für den Bau einer Miniaturkraftmess-
plattform für die Insektenbiomechanik. Diese kann mit dem stereolithographischen Ferti-
gungsverfahren hergestellt werden.
Eine vielversprechende Alternative zu den metallischen Legierungen stellen die Poly-
mere dar. Innerhalb dieser Werkstoffgruppe existieren hochelastische Materialien, deren
Dichte etwa 7-mal geringer ist, als jene von Messing oder Stahl. Des Weiteren decken sie
einen großen Bereich von E-Modulen ab (Abb. 7.1) und es kann ein E-Modul gewählt wer-
den, der relevante Dehnungen im anvisierten Kraftbereich bei deutlich leichterer Bauweise
gewährleistet.
Abb. 7.1: Ashby-Diagramm: E-Modul der Werkstoffe in Abhängigkeit von ihrer Dichte mit Hilfslinien für gleiche Materialeffizienz für Druck-/Zugstab, Biegebalken und Druckbiegung einer Platte. Markiert sind Stahl (grün) und Messing (blau), als typische Materialen für den Sensorbau, sowie PVC (rot), als potentieller Werkstoff für eine Ultraminiaturkraftmessplattform für den Einsatz im Bereich der Insektenbiomechanik. Abbildung verändert nach Degischer und Lüftl (2012).
PVC
Messing
Stahl
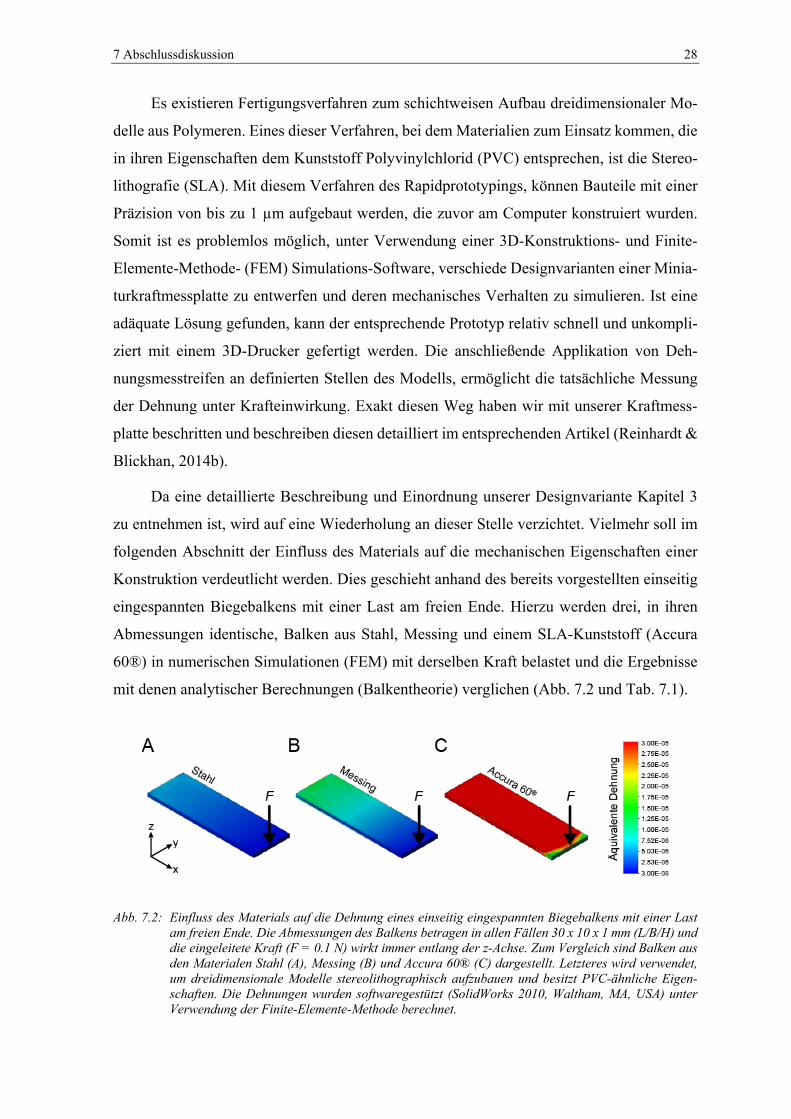
7 Abschlussdiskussion 28
Es existieren Fertigungsverfahren zum schichtweisen Aufbau dreidimensionaler Mo-
delle aus Polymeren. Eines dieser Verfahren, bei dem Materialien zum Einsatz kommen, die
in ihren Eigenschaften dem Kunststoff Polyvinylchlorid (PVC) entsprechen, ist die Stereo-
lithografie (SLA). Mit diesem Verfahren des Rapidprototypings, können Bauteile mit einer
Präzision von bis zu 1 µm aufgebaut werden, die zuvor am Computer konstruiert wurden.
Somit ist es problemlos möglich, unter Verwendung einer 3D-Konstruktions- und Finite-
Elemente-Methode- (FEM) Simulations-Software, verschiede Designvarianten einer Minia-
turkraftmessplatte zu entwerfen und deren mechanisches Verhalten zu simulieren. Ist eine
adäquate Lösung gefunden, kann der entsprechende Prototyp relativ schnell und unkompli-
ziert mit einem 3D-Drucker gefertigt werden. Die anschließende Applikation von Deh-
nungsmesstreifen an definierten Stellen des Modells, ermöglicht die tatsächliche Messung
der Dehnung unter Krafteinwirkung. Exakt diesen Weg haben wir mit unserer Kraftmess-
platte beschritten und beschreiben diesen detailliert im entsprechenden Artikel (Reinhardt &
Blickhan, 2014b).
Da eine detaillierte Beschreibung und Einordnung unserer Designvariante Kapitel 3
zu entnehmen ist, wird auf eine Wiederholung an dieser Stelle verzichtet. Vielmehr soll im
folgenden Abschnitt der Einfluss des Materials auf die mechanischen Eigenschaften einer
Konstruktion verdeutlicht werden. Dies geschieht anhand des bereits vorgestellten einseitig
eingespannten Biegebalkens mit einer Last am freien Ende. Hierzu werden drei, in ihren
Abmessungen identische, Balken aus Stahl, Messing und einem SLA-Kunststoff (Accura
60®) in numerischen Simulationen (FEM) mit derselben Kraft belastet und die Ergebnisse
mit denen analytischer Berechnungen (Balkentheorie) verglichen (Abb. 7.2 und Tab. 7.1).
Abb. 7.2: Einfluss des Materials auf die Dehnung eines einseitig eingespannten Biegebalkens mit einer Last am freien Ende. Die Abmessungen des Balkens betragen in allen Fällen 30 x 10 x 1 mm (L/B/H) und die eingeleitete Kraft (F = 0.1 N) wirkt immer entlang der z-Achse. Zum Vergleich sind Balken aus den Materialen Stahl (A), Messing (B) und Accura 60® (C) dargestellt. Letzteres wird verwendet, um dreidimensionale Modelle stereolithographisch aufzubauen und besitzt PVC-ähnliche Eigen-schaften. Die Dehnungen wurden softwaregestützt (SolidWorks 2010, Waltham, MA, USA) unter Verwendung der Finite-Elemente-Methode berechnet.
7 Abschlussdiskussion 29
Die Simulationsergebnisse stimmen erwartungsgemäß mit den Berechnungen der Bal-
kentheorie überein und bestätigen prinzipiell die Tauglichkeit des verwendeten Polymers für
das skizzierte Vorhaben (Tab. 7.1). Aufgrund der deutlich geringeren Dichte, beträgt die
Masse des Kunststoffbalkens nur etwa 15% derer der Metallbalken. Des Weiteren ist die
Dehnung bei gleicher Last etwa 80- (Stahl) bzw. 36-fach (Messing) höher. Dem großen Ge-
winn bei der Dehnung steht eine verhältnismäßig geringe Einbuße bei der Eigenfrequenz
gegenüber. Durch geschickte Optimierung der Balkengeometrie können dahingehend si-
cherlich noch Verbesserungen erzielt werden. Insgesamt sind diese Ergebnisse sehr verhei-
ßungsvoll und waren Ansporn für den unkonventionellen Versuch, eine Ultraminiaturkraft-
messplatte stereolithografisch herzustellen.
Tab. 7.1: Eigenschaften des Balkens bei Verwendung verschiedener Materialen. Eigenfrequenz, Auslen-kung am Balkenende und Dehnung wurden mit FEM berechnet.
Stahl Messing Accura 60®
Dichte (kg/m³) 7800 8500 1210
Masse (g) 2,34 2,55 0,36
E-Modul (MPa) 210 100 2,9
Auslenkung (mm) 5,14E-03 1,08E-02 3,72E-01
Steifigkeit (N/m) 19444 9259 269
Eigenfrequenz (Hz) 936 619 279
Auslenkung (mm) FEM 5,02E-03 1,04E-02 3,57E-01
Dehnung FEM 5,50E-06 1,20E-05 4,30E-04
Eigenfrequenz (Hz) FEM 944 628 285
7.1.3 Schwachstellen des Prototypen
Das viskoelastische Verhalten des Kunststoffes und die Lichtempfindlichkeit der Halbleiter-
dehnungsmessstreifen können das Messsignal beeinflussen. Die unausweichliche Verwen-
dung eines Sekundenklebers mindert die Qualität der Klebeverbindung.
7 Abschlussdiskussion 30
Die Verwendung eines Polymers für den Sensorbau bringt einige Nachteile mit sich.
Zum einen führt das viskoelastische Verhalten von Kunststoffen zu temperatur- und belas-
tungsinduzierten Kriecheffekten, die deutlich stärker ausgeprägt sind, als bei den üblicher-
weise verwendeten Metalllegierungen. Gerade bei statischen Messungen könnte es daher
zum „Wegdriften“ des Signals kommen. Ebenso würden Temperaturschwankungen, wie sie
beispielsweise durch Schatten oder Wind ausgelöst werden können, die Ausdehnung des
Materials bewirken, was ebenfalls zu einer Signaländerung der applizierten DMS führen
würde.
Ein weiteres Problem stellt die Klebeverbindung der DMS dar. Aufgrund des niedri-
gen Schmelzpunktes des Polymers (< 100 °C) ist die Verwendung eines heißhärtenden Ein-
komponentenklebstoffes, wie er standardmäßig für stabile und permanente Verbindungen
im DMS-Bereich verwendet wird, ausgeschlossen. Deshalb ist die Verwendung eines weni-
ger permanenten Klebers auf Cyanoacrylatbasis (Sekundenkleber) angezeigt.
Es versteht sich von selbst, dass bei den zu erwartenden Kräften im µN-Bereich Halb-
leiter-DMS verwendet werden müssen, die etwa 100-fach empfindlicher als Standard Fo-
lien-DMS sind. Der Bereich der elastischen Verformbarkeit ist bei Halbleiter-DMS wesent-
lich geringer, was einen kleinen Messbereich und eine hohe Fragilität bedingt. Überdies be-
darf es einer besonders sorgfältigen Abdeckung, da die temperaturbedingte Drift deutlich
höher ist und Halbleiterelemente auch auf Strahlung (Licht) reagieren.
Oben genannte Voraussetzungen erschweren die Messungen, dennoch sind sie durch-
führbar. Insbesondere muss beachtet werden, dass die Messungen unter möglichst konstan-
ten (Labor-) Bedingungen durchgeführt werden. Jegliche Änderungen der Umgebungstem-
peratur bzw. die direkte Einstrahlung des Sonnenlichtes muss vermieden werden. Eine be-
lastungsinduzierte Drift kann ausgeschlossen werden, da die Bodenkontaktzeiten von Amei-
sen deutlich unter 100 ms liegen und die Materialdehnungen aufgrund der geringen Kräfte
sehr klein sind. Auch wenn das Signal-Rausch-Verhältnis im Vergleich zu anderen Kraft-
messplatten noch ungünstig ist, konnten wir dennoch zeigen, dass der entwickelte Sensor
zuverlässig im µN-Bereich misst. Der Nachweis für die Tauglichkeit unserer Kraftmess-
platte bei der Bodenreaktionskraftmessung von kleinen Insekten wurde ebenfalls erbracht.
Bei aller Zurückhaltung sollte betont werden, dass das vorgestellte Verfahren einen
richtungsweisenden Ansatz auf dem Gebiet der biomechanischen Messtechnik darstellt.
7 Abschlussdiskussion 31
7.2 Biomechanik der Ameisenlokomotion
7.2.1 Schrittmuster und Gangartwechsel
Wie die meisten Insekten nutzen auch Waldameisen das tripodale Schrittmuster. Größten-
teils verhalten sich die kinematischen Parameter der Lokomotion proportional zur Ge-
schwindigkeit. Ein Gangartwechsel wurde bei Formica polyctena nicht gefunden.
Insekten laufen auf sechs Beinen und organisieren diese über einen weiten Geschwin-
digkeitsbereich in einem alternierenden, tripodalen Schrittmuster. Hierbei arbeitet das vor-
dere und hintere Bein von der einen und das mittlere von der anderen Seite des Körpers
synchron. Diese Tatsache ist hinlänglich bekannt und wurde bereits mehrfach, an verschie-
denen Spezies, bei unterschiedlichen Geschwindigkeiten und Anstiegen, nachgewiesen
(Delcomyn, 1971; Full et al., 1991; Full & Tu, 1991; Hughes, 1952; Seidl & Wehner, 2008;
Weihmann & Blickhan, 2009; Zollikofer, 1994c). Selbst bei sehr stark strukturierten Unter-
gründen oder beim vertikalen Klettern wichen Schaben nicht von diesem Muster ab
(Goldman et al., 2006; Sponberg & Full, 2008).
Erwartungsgemäß hielten auch Waldameisen den Tripod-Gang über alle untersuchten
Geschwindigkeiten und Steigungen aufrecht (Reinhardt & Blickhan, 2014a; Reinhardt et al.,
2009). Außerdem verliefen nahezu alle Schrittparameter direkt proportional zur Geschwin-
digkeit. Als einziger Parameter veränderte sich die Schwungphasendauer über alle Laufge-
schwindigkeiten nicht und betrug im Mittel etwa 35 ms. Diese Tatsache lässt darauf schlie-
ßen, dass die Tiere die Beine so schnell wie möglich nach vorn führen. Wahrscheinlich ist
es eine wesentliche Bestrebung, den Bodenkontakt schnell wiederzuerlangen und somit im-
mer möglichst viele Beine am Boden zu halten (Reinhardt & Blickhan, 2014a). Diese Stra-
tegie gewährleistet die permanente Interaktion mit dem Substrat und führt zur Erhöhung der
statischen Stabilität (Hughes, 1952; Ting et al., 1994). Einerseits können dadurch Vortriebs-
bzw. Haftkräfte übertragen und anderseits ständig die Eigenschaften des Untergrundes, so-
wie die Stellung zur Schwerkraft detektiert werden (Markl, 1974; Zill & Moran, 1981).
Ebenso erhöht der ständige Bodenkontakt die Wendigkeit, welche gerade bei der Bewälti-
gung von unebenem Gelände essentiell ist (Daley & Usherwood, 2010). Unsere Untersu-
chungen belegten ferner, dass die Mechanik des Körperschwerpunkts unverändert bleibt
(Reinhardt & Blickhan, 2014a). Da ein Gangartwechsel immer mit gravierenden Änderun-
gen in den Schrittparametern sowie den kinematischen und dynamischen Mustern einhergeht
7 Abschlussdiskussion 32
(Alexander, 1989; Hreljac, 1995), kann ein solcher, zumindest im untersuchten Geschwin-
digkeitsbereich, ausgeschlossen werden.
7.2.2 Lokomotion und Duftspuren
Die Lokomotion unterliegt den Zwängen der Kommunikation, da der Gaster für die Kenn-
zeichnung einer Duftspur den Boden berühren muss.
Waldameisen kennzeichnen ihre Route mit einem Spurpheromon, welches sich in Mit-
tel- und Enddarm befindet und durch Entleerung der Rektalblase nach außen abgegeben wird
(Horstmann, 1976). Daher wird zum Legen der Duftspur das distale Ende des Abdomens
über den Boden gezogen oder in regelmäßigen Abständen abgesetzt (Horstmann, 1976).
Zum prinzipiellen Nachweis der Bodenberührung dienten in jener Studie Spuren auf einer
berußten Glasplatte, welche beim Absetzen bzw. Schleifen des Gasters entstanden. Diese
Methode ließ eine genauere Quantifizierung des Bodenkontaktes selbstverständlich nicht zu.
Unsere Messungen bestätigen den Bodenkontakt des Gasters bei Formica und zeigen
zugleich, dass dessen Bremswirkung nicht unerheblich ist (Reinhardt & Blickhan, 2014b;
Reinhardt et al., 2009). Bei einem exemplarischen Einzelversuch war das Abdomen für 5 bis
10 ms am Boden (bzw. auf der Kraftmessplatte) und verursachte verhältnismäßig große
Kräfte in vertikaler und horizontaler Richtung. Während diese in vertikaler Richtung bis zu
150 µN (65% vom Körpergewicht) betrugen, entstanden (Brems-) Kräfte von bis zu 80 µN
in Wegrichtung (Reinhardt & Blickhan, 2014b). Dementsprechend verursacht das Spurlegen
einen signifikanten Widerstand, der durch einen erhöhten Muskeleinsatz ausgeglichen wer-
den muss. Selbstverständlich bringt eine etablierte Ameisenstraße auch große Vorteile für
die gesamte Kolonie mit sich, da sie meist den optimalen Weg zu einer bekannten Nahrungs-
quelle kennzeichnet. Auf diese Weise wird der effektive Nahrungstransport zum Nest durch
eine große Anzahl von Tieren effektiv organisiert und der individuelle Mehraufwand ausge-
glichen. Da sich die Duftspuren innerhalb weniger Tage verflüchtigen, müssen sie ständig
erneuert werden (Horstmann, 1976). Es ist folglich zweckmäßig und notwendig, dass viele
Tiere die Ameisenstraße auf ihrem Weg zur Nahrungsquelle nachzeichnen.
Der fortwährende Bodenkontakt des Gasters könnte demzufolge ein Hauptkriterium
bei der Lokomotion von Waldameisen sein. Dieses Kriterium schränkt die Kinematik ein
und wäre eine Erklärung für die Abstinenz von Flugphasen. Zusätzlich bedingt die konstante
7 Abschlussdiskussion 33
Körperhaltung den Umstand, dass sich der KSP nahe dem Petiolus und somit dicht am pro-
ximalen Ende des Gasters befindet (Reinhardt & Blickhan, 2014a; Zollikofer, 1994a). Folg-
lich ergeben sich durch die Bodenberührung nur geringe vertikale Oszillationen des Abdo-
mens und damit auch des KSP. Mit den in Kapitel 5 dargestellten Ergebnissen bestätigten
wir diese Vermutung und bewiesen die Entkopplung des Hinterleibs von den zyklischen
Bewegungen des restlichen Körpers. So blieb das Abdomen in gleichbleibender Orientierung
zum Boden, während der Thorax-Caput-Komplex eine rhythmische Nickbewegung mit dop-
pelter Schrittfrequenz und einer Amplitude von etwa 5-10° vollzog. Diese kinematische Ent-
kopplung (hiermit ist das Auflösen einer starren Kopplung der Kinematik aller Rumpfmas-
sen gemeint) spricht dafür, dass die Tiere den Gaster einfach passiv hängen lassen. Dies ist
aus Gründen der Energieeffizienz sinnvoll, da sich mehr als die Hälfte des Körpergewichtes
im Abdomen konzentriert. Denn jede muskelgetriebene Bewegung des Gasters erzeugt me-
tabolische Kosten, die nicht für die Lokomotion genutzt werden können. Höchstwahrschein-
lich wird die Entkopplung über eine elastische Verbindung zum Thorax realisiert. Wie an
zahlreichen anderen Stellen der Kutikula, könnte auch hier Resilin für die notwendige Elas-
tizität sorgen (Weis-Fogh, 1960).
Weiterhin ergaben unsere Studien, dass der KSP bei schnelleren Läufen signifikant
höher lag als bei langsameren (Reinhardt & Blickhan, 2014a). Das Anheben des KSP führt
wahrscheinlich zur Verringerung des Schleifens des Gasters, was wiederum zur Geschwin-
digkeitsmaximierung beiträgt. Im Umkehrschluss folgt, dass bei schnellen Läufen die Kenn-
zeichnung einer Duftspur vernachlässigt wird. Dies ist nachvollziehbar vor dem Hinter-
grund, dass die Erhöhung der Laufgeschwindigkeit meist mit Fluchtreaktionen einhergeht,
bei denen ausschließlich die Sicherung des Überlebens das primäre Ziel der Lokomotion
darstellt. Außerdem wäre es riskant, „gefährliche Orte“ mit einer Duftspur zu kennzeichnen.
Die abschließende Klärung dieses Sachverhaltes kann nur durch weitere Untersuchungen
erfolgen.
7.2.3 Kinematische und dynamische Muster
Die Mechanik des Körperschwerpunktes sowie die Bodenreaktionskräfte zeigen Parallelen
zu früheren Untersuchungen an Schaben und identifizieren die Gangart „Grounded-Run-
ning“. Höchstwahrscheinlich kann ein angepasstes BSLIP-Modell die gefundenen Muster
beschreiben.
7 Abschlussdiskussion 34
Neben den Bodenreaktionskräften werden zur Beschreibung und Einordnung der Lo-
komotion üblicherweise die Fluktuation des KSP sowie dessen Energetik während des
Schrittzyklus herangezogen. Unserer Ergebnisse an Waldameisen zeigen, dass potentielle
und kinetische Energie des KSP im untersuchten Geschwindigkeitsbereich annährend in
Phase verlaufen. Dementsprechend errechneten wir relativ hohe Werte für die %Congruity
(60-70%) und niedrige Werte für die %Recovery (16-18%). Dies steht im Einklang mit den
Befunden an Schaben, bei denen die %Recovery, aufgrund der gleichphasigen Energiever-
läufe, ähnlich gering war (Full & Tu, 1990, 1991). Des Weiteren erreichte der KSP bei diesen
extrem schnellen Insekten in der mittleren Standphase eines Tripods seine Minimalhöhe,
wobei die Summe der Vertikalkräfte unter den Beinen maximal und die der Horizontalkräfte
Null war (Full et al., 1991; Full & Tu, 1990, 1991). Da diese Ergebnisse den Vorhersagen
des Masse-Feder-Modells (SLIP, Blickhan, 1989) entsprachen, wurde die Lokomotion von
Schaben, trotz fehlender Flugphasen, als „Rennen“ eingeordnet (Blickhan & Full, 1993;
Full et al., 1991; Full & Tu, 1990; Srinivasan & Holmes, 2008).
Unsere Befunde bei Formica polyctena gehen in eine ähnliche Richtung. Allerdings
wurde die minimale KSP-Höhe, genau wie die maximale Vertikalkraft und der Nulldurch-
gang der Horizontalkraft, deutlich früher erreicht (Reinhardt & Blickhan, 2014a). Eine
Asymmetrie in den Bodenreaktionskraftverläufen ist typisch für eine besondere Art der dy-
namischen Lokomotion, welche besonders bei Vögeln zu finden ist – dem „Grounded Run-
ning“ (Andrada et al., 2013; Rubenson et al., 2004). Bei dieser Gangart existieren keine
Flugphasen und es kommt nur zu geringen vertikalen Auslenkungen des KSP.
Das aktuell passendste Modell zur Beschreibung des „Grounded Running“ ist das
BSLIP-Modell (Geyer et al., 2006). Durch die Verwendung von zwei Federbeinen lassen
sich Doppelstützphasen modellieren, wie sie auch beim Tripod-Gang der Insekten zu finden
sind. Durch die Einführung von Dämpfung und Beinasymmetrien können mit diesem Modell
auch asymmetrische Bodenreaktionskraftverläufe, wie bei Formica polyctena, generieren
(Andrada et al., in prep.). Aufgrund der dargestellten Parallelen ordnen wir die beobachtete
Gangart der Waldameisen als „Grounded-Running“ ein.
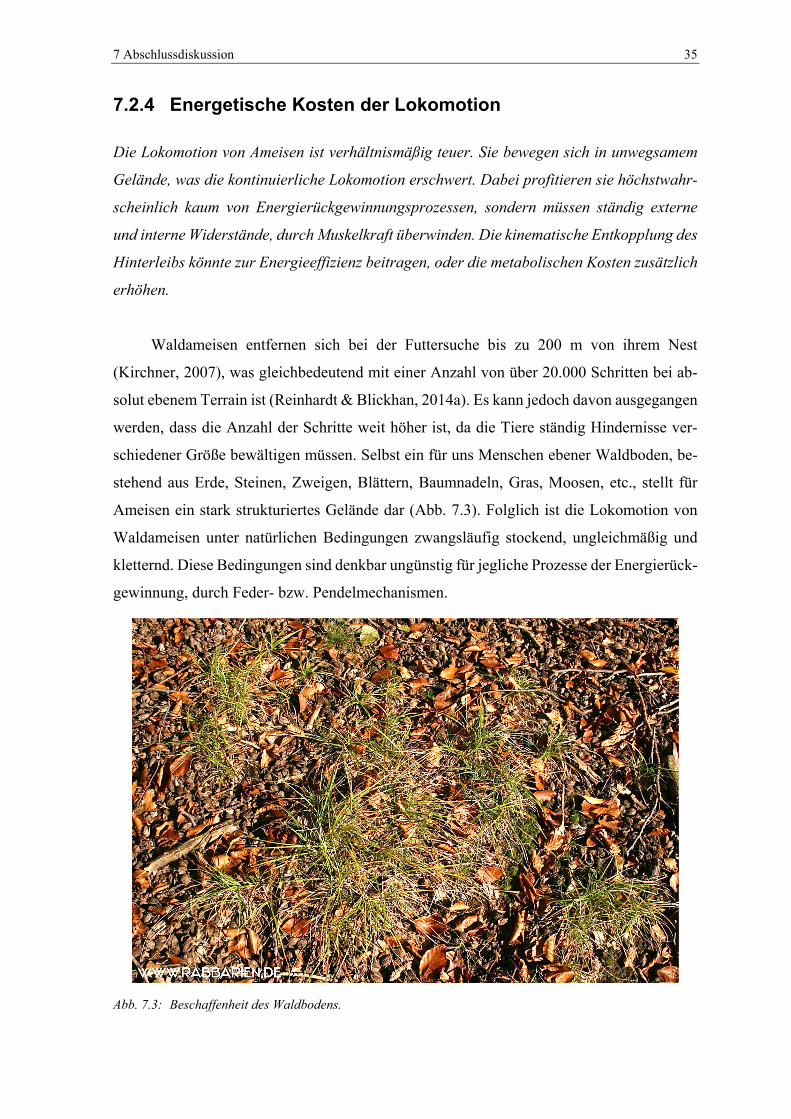
7 Abschlussdiskussion 35
7.2.4 Energetische Kosten der Lokomotion
Die Lokomotion von Ameisen ist verhältnismäßig teuer. Sie bewegen sich in unwegsamem
Gelände, was die kontinuierliche Lokomotion erschwert. Dabei profitieren sie höchstwahr-
scheinlich kaum von Energierückgewinnungsprozessen, sondern müssen ständig externe
und interne Widerstände, durch Muskelkraft überwinden. Die kinematische Entkopplung des
Hinterleibs könnte zur Energieeffizienz beitragen, oder die metabolischen Kosten zusätzlich
erhöhen.
Waldameisen entfernen sich bei der Futtersuche bis zu 200 m von ihrem Nest
(Kirchner, 2007), was gleichbedeutend mit einer Anzahl von über 20.000 Schritten bei ab-
solut ebenem Terrain ist (Reinhardt & Blickhan, 2014a). Es kann jedoch davon ausgegangen
werden, dass die Anzahl der Schritte weit höher ist, da die Tiere ständig Hindernisse ver-
schiedener Größe bewältigen müssen. Selbst ein für uns Menschen ebener Waldboden, be-
stehend aus Erde, Steinen, Zweigen, Blättern, Baumnadeln, Gras, Moosen, etc., stellt für
Ameisen ein stark strukturiertes Gelände dar (Abb. 7.3). Folglich ist die Lokomotion von
Waldameisen unter natürlichen Bedingungen zwangsläufig stockend, ungleichmäßig und
kletternd. Diese Bedingungen sind denkbar ungünstig für jegliche Prozesse der Energierück-
gewinnung, durch Feder- bzw. Pendelmechanismen.
Abb. 7.3: Beschaffenheit des Waldbodens.
7 Abschlussdiskussion 36
Schließlich wird grundsätzlich angezweifelt, dass diese Mechanismen überhaupt noch
eine Rolle spielen bei Tieren, deren Körpergewicht weniger als 1 kg beträgt (Reilly et al.,
2007). Obwohl die mechanische Arbeit, die pro Körpergewichtseinheit geleistet wird, über
alle Größenklassen hinweg nahezu konstant ist, sind die metabolischen Kosten bei kleinen
Tieren weit höher (Full, 1991; Reilly et al., 2007). Berechnet man den Wirkungsgrad der
Lokomotion, d.h. das Verhältnis von geleisteter Arbeit zu eingesetzter Energie, schneiden
Tiere umso günstiger ab, je größer sie sind. Beim Pferd beträgt der Wirkungsgrad 41,4%,
bei der Ameise dagegen nur 0,5% (Wehner & Gehring, 2013). Reilly et al. (2007) zeigten
an Eidechsen (m = 21 g) und Erdhörnchen (m = 238 g), dass der Anteil der mechanisch
rückgewonnenen Energie weniger als 2% der gesamten lokomotorischen Kosten ausmacht
und folgerten, dass die Fortbewegung kleiner Tiere quasi ausschließlich auf Muskelaktivität
beruht. Vor allem die, für kleine Tiere typische, kauernde Körperhaltung erhöht die metabo-
lischen Kosten immens. Anders als bei Tieren mit gestreckteren Gliedmaßen, wie z. B.
Hunde, Pferde oder gar Menschen, muss permanent mehr Muskelkraft aufgewendet werden,
um den Körper vom Boden abzustützen (Biewener, 1990; Biknevicius et al., 2013; Günther
et al., 2004; Reilly et al., 2007). Bei Insekten sind die Beine zudem seitlich abgespreizt und
arbeiten, bedingt durch die radiäre Anordnung, in der Bodenkontaktphase sogar gegeneinan-
der. Das belegen sowohl die Bodenreaktionskraftmessungen an Schaben, als auch unsere
eigenen Untersuchungen, welche ergaben, dass die Vorderbeine bremsen und die Hinter-
beine zeitgleich beschleunigen (Full et al., 1991; Full & Tu, 1990; Reinhardt & Blickhan,
2014a; Reinhardt et al., 2009). Welchen Einfluss dies auf die energetischen Kosten der Lo-
komotion hat, müssen weitere Studien erhellen.
Wie Experimente an Stabheuschrecken, Schaben und Mäusen zeigten, sind die relati-
ven passiven Kräfte der Muskeln und Gelenkstrukturen bei Tieren mit leichten Beinen ver-
hältnismäßig hoch (Garcia et al., 2000; Hooper et al., 2009). Die Überwindung dieser Kräfte,
speziell in der Schwungphase, führt zu einer vermehrten Muskelaktivität und dadurch eben-
falls zur Erhöhung der metabolischen Kosten. Dieser Umstand ist eine Erklärung, warum
kleine Tiere dynamische Gangarten, wie das Rennen, bevorzugen, anstatt zu Gehen (Garcia
et al., 2000). Dies gilt höchstwahrscheinlich auch für Ameisen und stärkt unsere Hypothese,
dass diese Insekten „Grounded-Running“ betreiben (Reinhardt & Blickhan, 2014a).
Im Rahmen unserer Studien haben wir gezeigt, dass der Gaster von Waldameisen,
dessen Masse nahezu 60% des Gesamtgewichtes beträgt, kinematisch entkoppelt von der
rhythmischen Nickbewegung (Pitch) des restlichen Körpers ist (Reinhardt & Blickhan,
2014a). Der Pitch entsteht durch die Aktivität der sechs am Thorax entspringenden Beine.
7 Abschlussdiskussion 37
Daher könnte diese Bewegung nur durch die isometrische Kontraktion von Muskeln oder
eine starre Verbindung zum Thorax (bzw. Petiolus) auf den Gaster übertragen werden. Da
die Orientierung des Gasters nahezu unverändert bleibt, kann eine passive visko-elastische
Kopplung vermutet werden und die Aktivität von Muskeln ist unwahrscheinlich. Sollte das
der Fall sein, würde dieses morphologische Detail helfen, die metabolischen Kosten zu sen-
ken.
Da das Spurpheromon am distalen Ende des Gasters austritt, garantiert seine gleich-
bleibende Orientierung die permanente Möglichkeit, Duftspuren legen zu können. Wie be-
reits erläutert, könnte dies eine wichtige Randbedingung der Lokomotion sein. Inwieweit die
möglicherweise entstehende Reibung einen Widerstand erzeugt, dessen Überwindung zur
Erhöhung der metabolischen Kosten führt, konnte mit der von uns verwendeten Methode
nicht aufgeklärt werden. Die Kräfte wurden nur sehr lokal auf der Trittfläche der Kraftmess-
plattform (4 x 4 mm) erfasst (Reinhardt & Blickhan, 2014b). Zukünftige Messungen, unter
Verwendung eines Sensors, welcher die Kontaktkräfte des Hinterleibs über eine längere
Strecke registriert, wären interessant. Die Untersuchungen könnten erklären, wie teuer das
Spurlegen für Ameisen tatsächlich ist, bzw. welche Rolle das Abdomen bei der Lokomotion
spielt.
7.2.5 Grounded Running bei Ameisen
Grounded Running scheint eine besondere Rolle bei der Lokomotion kleiner Lebewe-
sen zu spielen. Es kombiniert hohe Laufgeschwindigkeiten mit geringen vertikalen Oszilla-
tionen des KSP und ermöglicht dadurch die Aufrechterhaltung des Bodenkontaktes
(Blickhan & Full, 1993). Typischerweise ist ihr Habitat für Ameisen verhältnismäßig stark
strukturiert und extrem unwegsam (vgl. Abb. 7.3). Flugphasen würden in dieser Umgebung
das Sturzrisiko drastisch erhöhen. Des Weiteren wird hierdurch die Möglichkeit schnelle
Wendungen auszuführen gewahrt. Allein diese Tatsache könnte für die Tiere weit wichtiger
sein, als Energieeffizienz oder das Erreichen maximaler Geschwindigkeiten (Daley &
Usherwood, 2010; Gatesy & Biewener, 1991). Es ist denkbar, dass der federnde Gang auch
zur Bewegungskontrolle beiträgt. Selbst bei derart kleinen Lebewesen beeinflusst die Träg-
heit des Systems das Schrittmuster, sowie die Dynamik und hilft die Stabilität zu verbessern
(Blickhan et al., 2007; Full et al., 2002; Ting et al., 1994).
7 Abschlussdiskussion 38
7.2.6 Steigungsdynamik und Gravizeption
Mit wachsender Steigung kommt es zu einer radikalen Veränderung von Beinarbeitsmodus
und Beinbelastung. Dies gilt insbesondere für das Vorderbein, dessen substratnormale Bo-
denreaktionskräfte sich zwischen 0° und 90° kontinuierlich umkehren. Insbesondere der
starke Zusammenhang zwischen Substratwinkel und Belastung des Vorderbeins, prädesti-
niert die campaniformen Sensillen dieses Beines als Steigungsdetektoren.
Mit zunehmender Steigung verringern Waldmeisen ihre Laufgeschwindigkeit, ohne
jedoch die Kinematik oder das Schrittmuster zu verändern (Weihmann & Blickhan, 2009).
Erwartungsgemäß, zeigen unsere Bodenreaktionskraftmessungen, dass sich hingegen die
Arbeitsweise der einzelnen Beine bei der Bewältigung von Anstiegen radikal ändert
(Reinhardt, 2013). Diese Aussage gilt insbesondere für die Vorderbeine. Während diese bei
kontinuierlicher Lokomotion in der Ebene (0°) lediglich Vertikalkräfte erzeugen, um einen
Teil des Körpergewichtes zu tragen (Reinhardt & Blickhan, 2014a), kommt es bei diesen
Beinen zu einer massiven Zunahme der tangentialen Bodenreaktionskräfte (Fx) bei Substrat-
winkeln von 45° bzw. 90° (Reinhardt, 2013). D. h., die Tiere ziehen sich mit den Vorderb-
einen kräftig hangaufwärts. So wird beim vertikalen Klettern (Anstieg = 90°) in der mittleren
Kontaktphase nahezu das gesamte Körpergewicht vom ersten Bein gehalten, wobei das Zie-
hen am Substrat auch durch negative Normalkräfte (Fz) zum Ausdruck kommt. Für das hin-
tere Beinpaar ermittelten wir relativ konstante Kraftmuster über alle Substratwinkel. Die
größten antreibenden (d.h. substrat-tangentialen) Kräfte wurden hier bei mittleren Anstiegen
(45°) registriert. In substratnormaler Richtung nimmt die Belastung der Hinterbeine mit stei-
gendem Substratwinkel ab. Zusätzlich erzeugten die ersten beiden Beinpaare nach innen ge-
richtete Lateralkräfte, was bedeutet, dass sich die Tiere am Untergrund festklammerten (la-
teral schiebend verspannen).
Eine ähnliche Strategie bei der Bewältigung vertikaler Anstiege verfolgen Schaben
(Goldman et al., 2006). In Analogie zu unseren Messungen generierten alle Beine vortriebs-
wirksame Bodenreaktionskräfte. Ebenso waren die Normalkräfte des vorderen Beines nega-
tiv und besaßen denselben Betrag, wie die positiven Kräfte des hinteren Beinpaares. Eine
weitere Gemeinsamkeit zeigt sich in den Lateralkräften der vorderen beiden Beinpaare, wel-
che auch nach innen gerichtet waren. Auf Basis der Schaben-Daten wurde bereits ein SLIP-
ähnliches Modell, für das Klettern entwickelt (Goldman et al., 2006). Aufgrund der darge-
7 Abschlussdiskussion 39
stellten Parallelen zu den Bodenreaktionskräften beim Klettern von Ameisen, kann das Mo-
dell vermutlich auch auf Ameisen oder andere Insekten übertragen werden. Ein Beweis dafür
steht allerdings noch aus.
Die potentielle Kraftverteilung auf die Beine eines Tripods zum Zeitpunkt der mittle-
ren Standphase wurde bereits unter Verwendung eines sagittalen Modells für Substratwin-
keln von -180° bis 180° berechnet (Günther & Weihmann, 2011). Dieses Modell orientiert
sich an der Morphometrie von Schaben und setzt eine neigungsunabhängige Körperhaltung
und die Minimierung der Bodenreaktionskräfte und Hüftmomente an Vorder- und Hinter-
beinen voraus. Es prognostiziert die Umkehr der substratnormalen Bodenreaktionskräfte
(Fz) des Vorderbeines bei Anstiegen zwischen 0° und 90°. Unterhalb eines Winkels von
40,8° sind die Kräfte positiv (Druck auf das Substrat) und darüber negativ (Zug am Substrat).
Beim mittleren und hinteren Bein waren die Normalkräfte im selben Bereich ausschließlich
positiv. Übertragen auf die Schaben bedeutet dies, dass sie ab einem Anstieg von 40,8° (kri-
tischer Winkel) mit dem Vorderbein am Substrat ziehen müssen, um ein rückwärtiges Fallen
zu vermeiden (Günther & Weihmann, 2011, 2012). Unsere Steigungsmessungen bei F. po-
lyctena bestätigen die Modellvorhersagen dahingehend, dass sich auch bei Ameisen die Nor-
malkräfte des Vorderbeines mit wachsendem Anstieg umkehren (Reinhardt, 2013). Höchst-
wahrscheinlich ist der kritische Winkel bei Ameisen allerdings etwas größer, da wir bei 45°
immer noch minimale Druckkräfte gemessen haben. Eine, auf die Morphometrie von F. po-
lyctena angepasste Variante des Modells würde womöglich einen etwas anderen kritischen
Winkel ergeben. Dennoch bleibt die grundsätzliche Aussage der Modellierung erhalten: der
Kontaktverlust des Vorderbeins führt bei größeren Steigungen unweigerlich zum Absturz.
Die großen Veränderungen in den Bodenreaktionskräften des Vorderbeines, könnten
eine wichtige Rolle bei der Orientierung von Ameisen spielen. Vermutlich nutzen die Tiere
die Belastung dieses Beinpaares, um die Stellung zur Schwerkraft zu messen. In diesem
Zusammenhang könnten die, in großer Zahl im Trochanter vorhandenen, campaniformen
Sensillen als Steigungsdetektor zum Einsatz kommen (Zill et al., 2004). Vermutlich wird
diese Information für die Rekonstruktion der horizontalen Projektion der tatsächlich zurück-
gelegten Wegstrecke im Rahmen der Wegintegration genutzt (Wohlgemuth et al., 2002).
Somit liefert diese Arbeit einen neuen Ansatzpunkt für weitere Untersuchungen in diese
Richtung. Abschließend können wir die Vermutung von Seidl und Wehner (2008) bekräfti-
gen, dass die Beinbelastung als Eingangssignal für die Gravizeption verwendet wird. Mit
der Identifikation des Vorderbeins, als potentiell günstigsten Detektor, bei Anstiegen zwi-
schen 0° und 90°, können wir die bestehenden Aussagen sogar noch konkretisieren.
Literaturverzeichnis
Ahn, A. N., Furrow, E., & Biewener, A. A. (2004). Walking and running in the red-legged
running frog, Kassina maculata. J. Exp. Biol., 207(3), 399-410.
Akesson, S., & Wehner, R. (2002). Visual navigation in desert ants Cataglyphis fortis: are
snapshots coupled to a celestial system of reference? J. Exp. Biol., 205(14), 1971-
1978.
Alexander, R. M. (1989). Optimization and gaits in the locomotion of vertebrates. Physiol.
Rev., 69(4), 1199-1227.
Alexander, R. M. (1991). Energy-saving mechanisms in walking and running. J. Exp. Biol.,
160(1), 55-69.
Andrada, E., Rode, C., & Blickhan, R. (2013). Grounded running in quails: Simulations
indicate benefits of observed fixed aperture angle between legs before touch-down.
J. Theor. Biol., 335, 97-107.
Andrada, E., Rode, C., Sudtedja, Y., Nyakatura, J. A., & Blickhan, R. (in prep.). Trunk
orientation causes asymmetries in leg function in small bird terrestrial locomotion.
Autumn, K., Hsieh, S. T., Dudek, D. M., Chen, J., Chitaphan, C., & Full, R. J. (2006).
Dynamics of geckos running vertically. J. Exp. Biol., 209(2), 260-272.
Bartsch, M. S., Federle, W., Full, R. J., & Kenny, T. W. (2007). A Multiaxis Force Sensor
for the Study of Insect Biomechanics. J. Microelectromech. Syst., 16(3), 709-718.
Biewener, A. A. (1990). Biomechanics of mammalian terrestrial locomotion. Science,
250(4984), 1097-1103.
Biknevicius, A. R., Reilly, S. M., McElroy, E. J., & Bennett, M. B. (2013). Symmetrical
gaits and center of mass mechanics in small-bodied, primitive mammals. Zoology,
116(1), 67-74.
Blickhan, R. (1989). The spring-mass model for running and hopping. J. Biomech., 22(11-
12), 1217-1227.
Blickhan, R., & Barth, F. (1985). Strains in the exoskeleton of spiders. J. Comp. Physiol. A,
157(1), 115-147.
Blickhan, R., & Full, R. J. (1993). Similarity in multilegged locomotion: Bouncing like a
monopode. J. Comp. Physiol. A, 173(5), 509-517.
Blickhan, R., Seyfarth, A., Geyer, H., Grimmer, S., Wagner, H., & Günther, M. (2007).
Intelligence by mechanics. Philos. Trans. R. Soc. A, 365(1850), 199-220.
Bregy, P., Sommer, S., & Wehner, R. (2008). Nest-mark orientation versus vector navigation
in desert ants. J. Exp. Biol., 211(12), 1868-1873.
Literaturverzeichnis 41
Cavagna, G. A., Heglund, N. C., & Taylor, C. R. (1977). Mechanical work in terrestrial
locomotion: two basic mechanisms for minimizing energy expenditure. Am. J.
Physiol., 233(5), 243-261.
Cavagna, G. A., Thys, H., & Zamboni, A. (1976). The sources of external work in level
walking and running. J. Physiol., 262(3), 639-657.
Chen, G. Y., Thundat, T., Wachter, E. A., & Warmack, R. J. (1995). Adsorption-induced
surface stress and its effects on resonance frequency of microcantilevers. J. Appl.
Phys., 77(8), 3618-3622.
Clemente, C. J., & Federle, W. (2008). Pushing versus pulling: division of labour between
tarsal attachment pads in cockroaches. Proc. R. Soc. B, 275(1640), 1329-1336.
Cruse, H. (1976). The function of the legs in the free walking stick insect,Carausius morosus.
J. Comp. Physiol. A, 112(2), 235-262.
Dai, Z., Gorb, S. N., & Schwarz, U. (2002). Roughness-dependent friction force of the tarsal
claw system in the beetle Pachnoda marginata (Coleoptera, Scarabaeidae). J. Exp.
Biol., 205(16), 2479-2488.
Dai, Z., Wang, Z., & Ji, A. (2011). Dynamics of gecko locomotion: a force-measuring array
to measure 3D reaction forces. J. Exp. Biol., 214(5), 703-708.
Daley, M. A., & Usherwood, J. R. (2010). Two explanations for the compliant running
paradox: reduced work of bouncing viscera and increased stability in uneven terrain.
Biol. Lett., 6(3), 418-421.
Degischer, H. P., & Lüftl, S. (2012). Leichtbau. Wien: Wiley.
Delcomyn, F. (1971). The Locomotion of the Cockroach Periplaneta Americana. J. Exp.
Biol., 54(2), 443-452.
Dickinson, M. H., Farley, C. T., Full, R. J., Koehl, M. A., Kram, R., & Lehman, S. (2000).
How animals move: an integrative view. Science, 288(5463), 100-106.
Drechsler, P., & Federle, W. (2006). Biomechanics of smooth adhesive pads in insects:
influence of tarsal secretion on attachment performance. J. Comp. Physiol. A,
192(11), 1213-1222.
Duch, C., & Pflüger, H. J. (1995). Motor patterns for horizontal and upside down walking
and vertical climbing in the locust. J. Exp. Biol., 198(9), 1963-1976.
Endlein, T. (2007). Haftung und Fortbewegung: Kontrollmechanismen von
Adhäsionskräften bei Ameisen. (Dissertation), Julius-Maximilians-Universität
Würzburg, Würzburg.
Endlein, T., & Federle, W. (2008). Walking on smooth or rough ground: passive control of
pretarsal attachment in ants. J. Comp. Physiol. A, 194(1), 49-60.
Federle, W., Brainerd, E. L., McMahon, T. A., & Hölldobler, B. (2001). Biomechanics of
the movable pretarsal adhesive organ in ants and bees. Proc. Natl. Acad. Sci. USA,
98(11), 6215-6220.
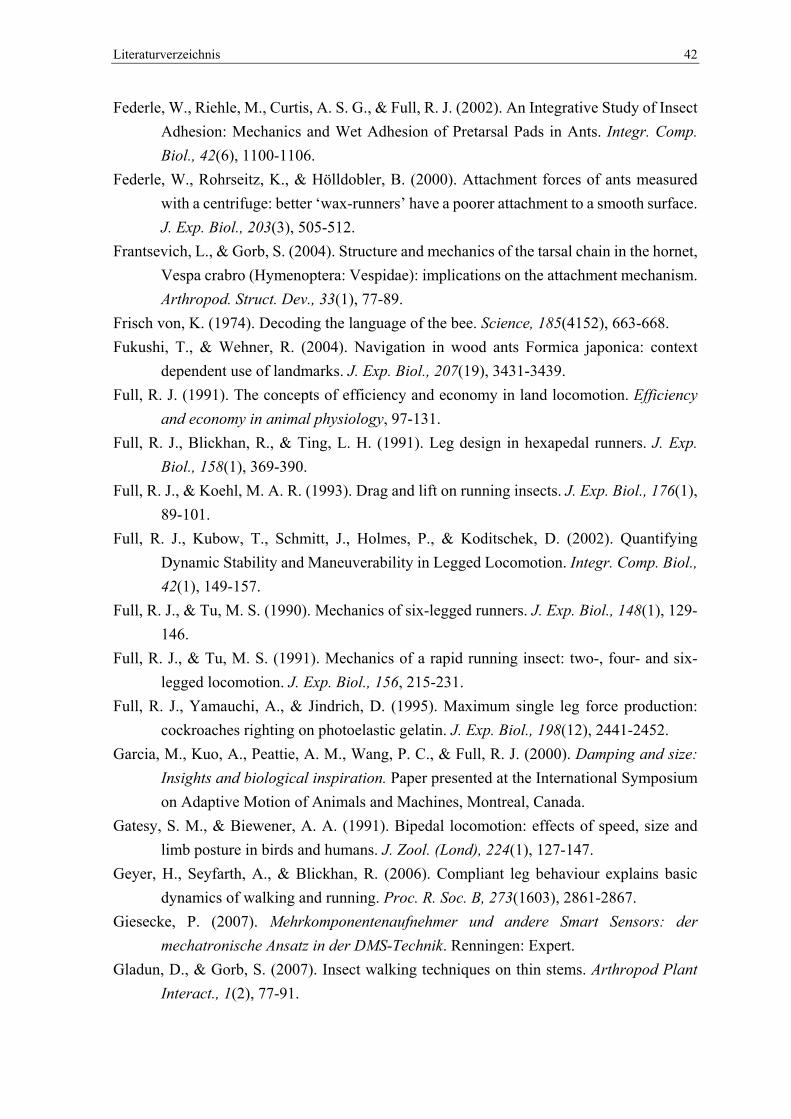
Literaturverzeichnis 42
Federle, W., Riehle, M., Curtis, A. S. G., & Full, R. J. (2002). An Integrative Study of Insect
Adhesion: Mechanics and Wet Adhesion of Pretarsal Pads in Ants. Integr. Comp.
Biol., 42(6), 1100-1106.
Federle, W., Rohrseitz, K., & Hölldobler, B. (2000). Attachment forces of ants measured
with a centrifuge: better ‘wax-runners’ have a poorer attachment to a smooth surface.
J. Exp. Biol., 203(3), 505-512.
Frantsevich, L., & Gorb, S. (2004). Structure and mechanics of the tarsal chain in the hornet,
Vespa crabro (Hymenoptera: Vespidae): implications on the attachment mechanism.
Arthropod. Struct. Dev., 33(1), 77-89.
Frisch von, K. (1974). Decoding the language of the bee. Science, 185(4152), 663-668.
Fukushi, T., & Wehner, R. (2004). Navigation in wood ants Formica japonica: context
dependent use of landmarks. J. Exp. Biol., 207(19), 3431-3439.
Full, R. J. (1991). The concepts of efficiency and economy in land locomotion. Efficiency
and economy in animal physiology, 97-131.
Full, R. J., Blickhan, R., & Ting, L. H. (1991). Leg design in hexapedal runners. J. Exp.
Biol., 158(1), 369-390.
Full, R. J., & Koehl, M. A. R. (1993). Drag and lift on running insects. J. Exp. Biol., 176(1),
89-101.
Full, R. J., Kubow, T., Schmitt, J., Holmes, P., & Koditschek, D. (2002). Quantifying
Dynamic Stability and Maneuverability in Legged Locomotion. Integr. Comp. Biol.,
42(1), 149-157.
Full, R. J., & Tu, M. S. (1990). Mechanics of six-legged runners. J. Exp. Biol., 148(1), 129-
146.
Full, R. J., & Tu, M. S. (1991). Mechanics of a rapid running insect: two-, four- and six-
legged locomotion. J. Exp. Biol., 156, 215-231.
Full, R. J., Yamauchi, A., & Jindrich, D. (1995). Maximum single leg force production:
cockroaches righting on photoelastic gelatin. J. Exp. Biol., 198(12), 2441-2452.
Garcia, M., Kuo, A., Peattie, A. M., Wang, P. C., & Full, R. J. (2000). Damping and size:
Insights and biological inspiration. Paper presented at the International Symposium
on Adaptive Motion of Animals and Machines, Montreal, Canada.
Gatesy, S. M., & Biewener, A. A. (1991). Bipedal locomotion: effects of speed, size and
limb posture in birds and humans. J. Zool. (Lond), 224(1), 127-147.
Geyer, H., Seyfarth, A., & Blickhan, R. (2006). Compliant leg behaviour explains basic
dynamics of walking and running. Proc. R. Soc. B, 273(1603), 2861-2867.
Giesecke, P. (2007). Mehrkomponentenaufnehmer und andere Smart Sensors: der
mechatronische Ansatz in der DMS-Technik. Renningen: Expert.
Gladun, D., & Gorb, S. (2007). Insect walking techniques on thin stems. Arthropod Plant
Interact., 1(2), 77-91.
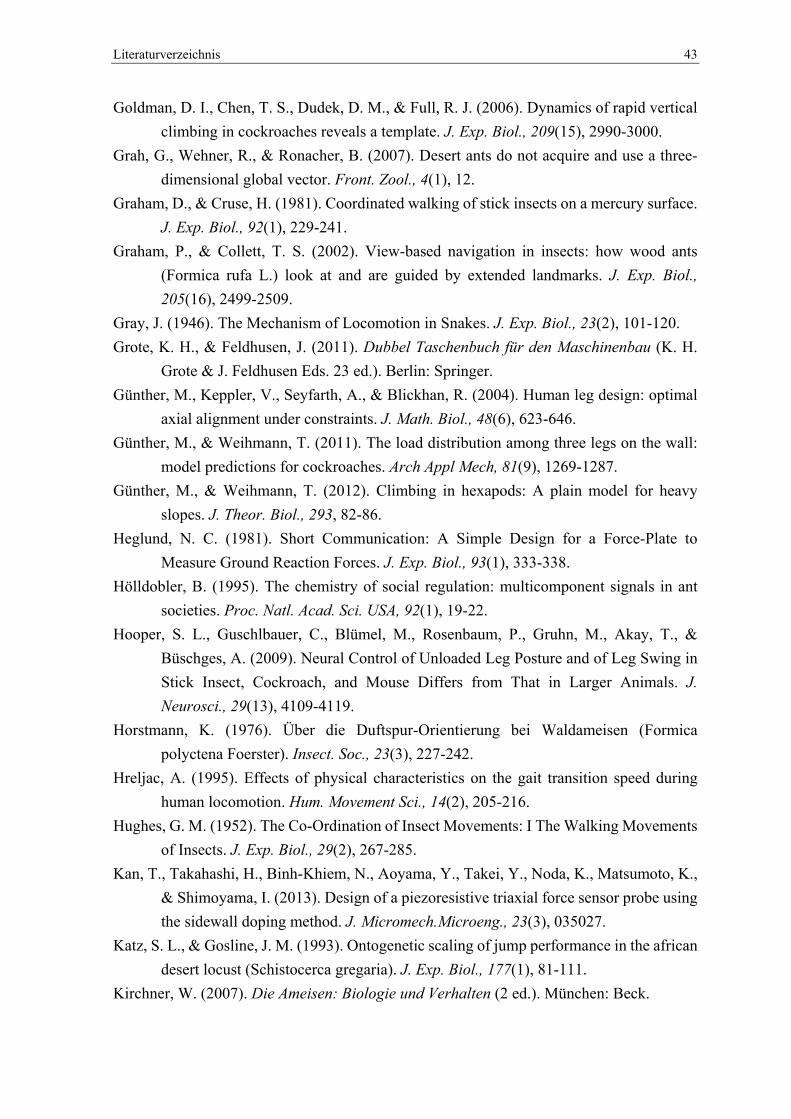
Literaturverzeichnis 43
Goldman, D. I., Chen, T. S., Dudek, D. M., & Full, R. J. (2006). Dynamics of rapid vertical
climbing in cockroaches reveals a template. J. Exp. Biol., 209(15), 2990-3000.
Grah, G., Wehner, R., & Ronacher, B. (2007). Desert ants do not acquire and use a three-
dimensional global vector. Front. Zool., 4(1), 12.
Graham, D., & Cruse, H. (1981). Coordinated walking of stick insects on a mercury surface.
J. Exp. Biol., 92(1), 229-241.
Graham, P., & Collett, T. S. (2002). View-based navigation in insects: how wood ants
(Formica rufa L.) look at and are guided by extended landmarks. J. Exp. Biol.,
205(16), 2499-2509.
Gray, J. (1946). The Mechanism of Locomotion in Snakes. J. Exp. Biol., 23(2), 101-120.
Grote, K. H., & Feldhusen, J. (2011). Dubbel Taschenbuch für den Maschinenbau (K. H.
Grote & J. Feldhusen Eds. 23 ed.). Berlin: Springer.
Günther, M., Keppler, V., Seyfarth, A., & Blickhan, R. (2004). Human leg design: optimal
axial alignment under constraints. J. Math. Biol., 48(6), 623-646.
Günther, M., & Weihmann, T. (2011). The load distribution among three legs on the wall:
model predictions for cockroaches. Arch Appl Mech, 81(9), 1269-1287.
Günther, M., & Weihmann, T. (2012). Climbing in hexapods: A plain model for heavy
slopes. J. Theor. Biol., 293, 82-86.
Heglund, N. C. (1981). Short Communication: A Simple Design for a Force-Plate to
Measure Ground Reaction Forces. J. Exp. Biol., 93(1), 333-338.
Hölldobler, B. (1995). The chemistry of social regulation: multicomponent signals in ant
societies. Proc. Natl. Acad. Sci. USA, 92(1), 19-22.
Hooper, S. L., Guschlbauer, C., Blümel, M., Rosenbaum, P., Gruhn, M., Akay, T., &
Büschges, A. (2009). Neural Control of Unloaded Leg Posture and of Leg Swing in
Stick Insect, Cockroach, and Mouse Differs from That in Larger Animals. J.
Neurosci., 29(13), 4109-4119.
Horstmann, K. (1976). Über die Duftspur-Orientierung bei Waldameisen (Formica
polyctena Foerster). Insect. Soc., 23(3), 227-242.
Hreljac, A. (1995). Effects of physical characteristics on the gait transition speed during
human locomotion. Hum. Movement Sci., 14(2), 205-216.
Hughes, G. M. (1952). The Co-Ordination of Insect Movements: I The Walking Movements
of Insects. J. Exp. Biol., 29(2), 267-285.
Kan, T., Takahashi, H., Binh-Khiem, N., Aoyama, Y., Takei, Y., Noda, K., Matsumoto, K.,
& Shimoyama, I. (2013). Design of a piezoresistive triaxial force sensor probe using
the sidewall doping method. J. Micromech.Microeng., 23(3), 035027.
Katz, S. L., & Gosline, J. M. (1993). Ontogenetic scaling of jump performance in the african
desert locust (Schistocerca gregaria). J. Exp. Biol., 177(1), 81-111.
Kirchner, W. (2007). Die Ameisen: Biologie und Verhalten (2 ed.). München: Beck.
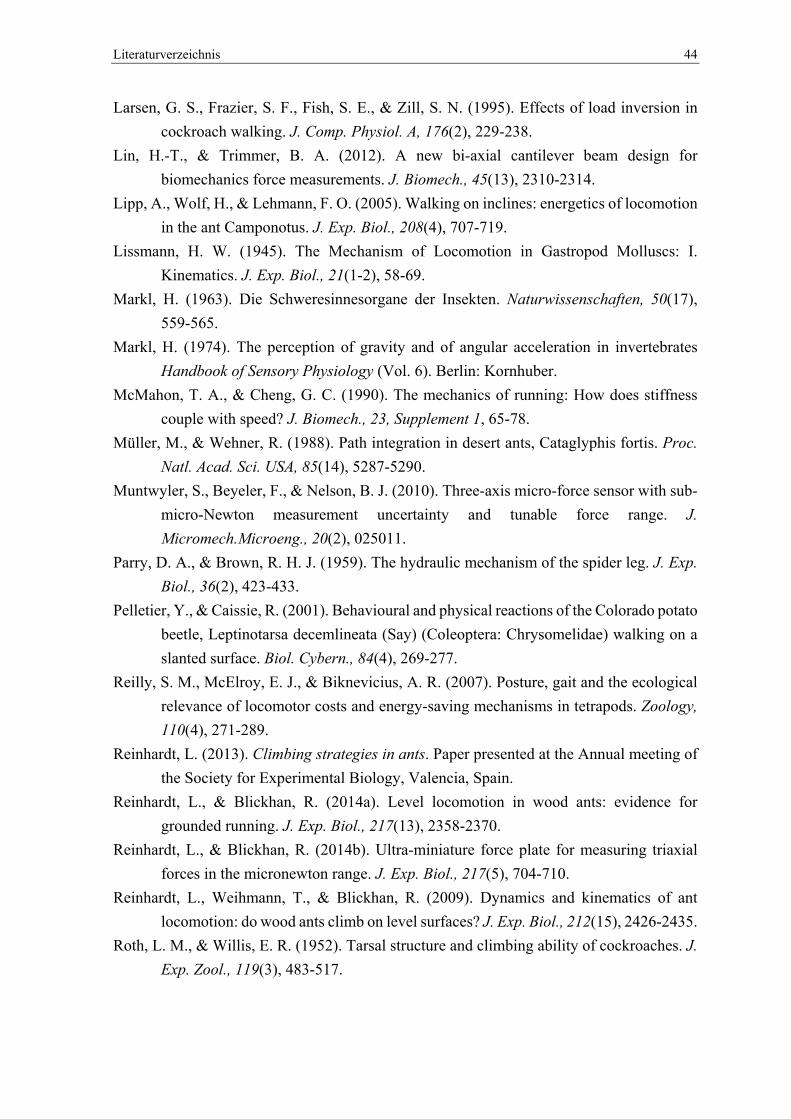
Literaturverzeichnis 44
Larsen, G. S., Frazier, S. F., Fish, S. E., & Zill, S. N. (1995). Effects of load inversion in
cockroach walking. J. Comp. Physiol. A, 176(2), 229-238.
Lin, H.-T., & Trimmer, B. A. (2012). A new bi-axial cantilever beam design for
biomechanics force measurements. J. Biomech., 45(13), 2310-2314.
Lipp, A., Wolf, H., & Lehmann, F. O. (2005). Walking on inclines: energetics of locomotion
in the ant Camponotus. J. Exp. Biol., 208(4), 707-719.
Lissmann, H. W. (1945). The Mechanism of Locomotion in Gastropod Molluscs: I.
Kinematics. J. Exp. Biol., 21(1-2), 58-69.
Markl, H. (1963). Die Schweresinnesorgane der Insekten. Naturwissenschaften, 50(17),
559-565.
Markl, H. (1974). The perception of gravity and of angular acceleration in invertebrates
Handbook of Sensory Physiology (Vol. 6). Berlin: Kornhuber.
McMahon, T. A., & Cheng, G. C. (1990). The mechanics of running: How does stiffness
couple with speed? J. Biomech., 23, Supplement 1, 65-78.
Müller, M., & Wehner, R. (1988). Path integration in desert ants, Cataglyphis fortis. Proc.
Natl. Acad. Sci. USA, 85(14), 5287-5290.
Muntwyler, S., Beyeler, F., & Nelson, B. J. (2010). Three-axis micro-force sensor with sub-
micro-Newton measurement uncertainty and tunable force range. J.
Micromech.Microeng., 20(2), 025011.
Parry, D. A., & Brown, R. H. J. (1959). The hydraulic mechanism of the spider leg. J. Exp.
Biol., 36(2), 423-433.
Pelletier, Y., & Caissie, R. (2001). Behavioural and physical reactions of the Colorado potato
beetle, Leptinotarsa decemlineata (Say) (Coleoptera: Chrysomelidae) walking on a
slanted surface. Biol. Cybern., 84(4), 269-277.
Reilly, S. M., McElroy, E. J., & Biknevicius, A. R. (2007). Posture, gait and the ecological
relevance of locomotor costs and energy-saving mechanisms in tetrapods. Zoology,
110(4), 271-289.
Reinhardt, L. (2013). Climbing strategies in ants. Paper presented at the Annual meeting of
the Society for Experimental Biology, Valencia, Spain.
Reinhardt, L., & Blickhan, R. (2014a). Level locomotion in wood ants: evidence for
grounded running. J. Exp. Biol., 217(13), 2358-2370.
Reinhardt, L., & Blickhan, R. (2014b). Ultra-miniature force plate for measuring triaxial
forces in the micronewton range. J. Exp. Biol., 217(5), 704-710.
Reinhardt, L., Weihmann, T., & Blickhan, R. (2009). Dynamics and kinematics of ant
locomotion: do wood ants climb on level surfaces? J. Exp. Biol., 212(15), 2426-2435.
Roth, L. M., & Willis, E. R. (1952). Tarsal structure and climbing ability of cockroaches. J.
Exp. Zool., 119(3), 483-517.
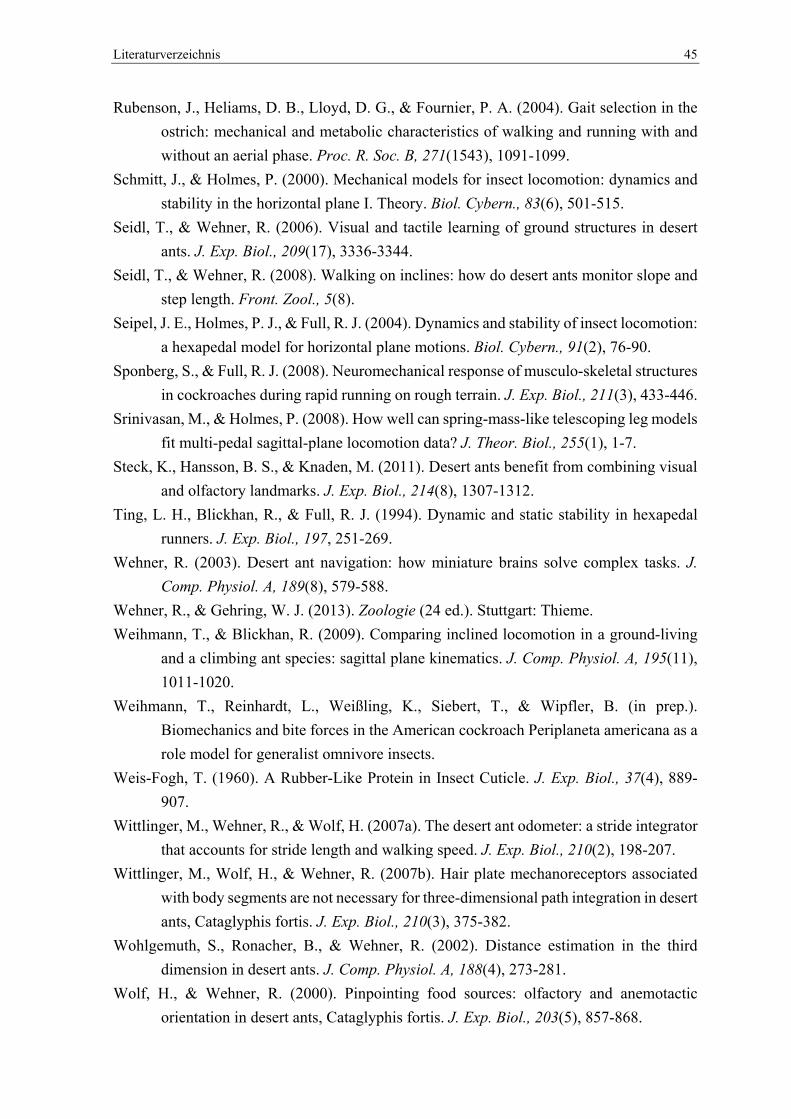
Literaturverzeichnis 45
Rubenson, J., Heliams, D. B., Lloyd, D. G., & Fournier, P. A. (2004). Gait selection in the
ostrich: mechanical and metabolic characteristics of walking and running with and
without an aerial phase. Proc. R. Soc. B, 271(1543), 1091-1099.
Schmitt, J., & Holmes, P. (2000). Mechanical models for insect locomotion: dynamics and
stability in the horizontal plane I. Theory. Biol. Cybern., 83(6), 501-515.
Seidl, T., & Wehner, R. (2006). Visual and tactile learning of ground structures in desert
ants. J. Exp. Biol., 209(17), 3336-3344.
Seidl, T., & Wehner, R. (2008). Walking on inclines: how do desert ants monitor slope and
step length. Front. Zool., 5(8).
Seipel, J. E., Holmes, P. J., & Full, R. J. (2004). Dynamics and stability of insect locomotion:
a hexapedal model for horizontal plane motions. Biol. Cybern., 91(2), 76-90.
Sponberg, S., & Full, R. J. (2008). Neuromechanical response of musculo-skeletal structures
in cockroaches during rapid running on rough terrain. J. Exp. Biol., 211(3), 433-446.
Srinivasan, M., & Holmes, P. (2008). How well can spring-mass-like telescoping leg models
fit multi-pedal sagittal-plane locomotion data? J. Theor. Biol., 255(1), 1-7.
Steck, K., Hansson, B. S., & Knaden, M. (2011). Desert ants benefit from combining visual
and olfactory landmarks. J. Exp. Biol., 214(8), 1307-1312.
Ting, L. H., Blickhan, R., & Full, R. J. (1994). Dynamic and static stability in hexapedal
runners. J. Exp. Biol., 197, 251-269.
Wehner, R. (2003). Desert ant navigation: how miniature brains solve complex tasks. J.
Comp. Physiol. A, 189(8), 579-588.
Wehner, R., & Gehring, W. J. (2013). Zoologie (24 ed.). Stuttgart: Thieme.
Weihmann, T., & Blickhan, R. (2009). Comparing inclined locomotion in a ground-living
and a climbing ant species: sagittal plane kinematics. J. Comp. Physiol. A, 195(11),
1011-1020.
Weihmann, T., Reinhardt, L., Weißling, K., Siebert, T., & Wipfler, B. (in prep.).
Biomechanics and bite forces in the American cockroach Periplaneta americana as a
role model for generalist omnivore insects.
Weis-Fogh, T. (1960). A Rubber-Like Protein in Insect Cuticle. J. Exp. Biol., 37(4), 889-
907.
Wittlinger, M., Wehner, R., & Wolf, H. (2007a). The desert ant odometer: a stride integrator
that accounts for stride length and walking speed. J. Exp. Biol., 210(2), 198-207.
Wittlinger, M., Wolf, H., & Wehner, R. (2007b). Hair plate mechanoreceptors associated
with body segments are not necessary for three-dimensional path integration in desert
ants, Cataglyphis fortis. J. Exp. Biol., 210(3), 375-382.
Wohlgemuth, S., Ronacher, B., & Wehner, R. (2002). Distance estimation in the third
dimension in desert ants. J. Comp. Physiol. A, 188(4), 273-281.
Wolf, H., & Wehner, R. (2000). Pinpointing food sources: olfactory and anemotactic
orientation in desert ants, Cataglyphis fortis. J. Exp. Biol., 203(5), 857-868.
Literaturverzeichnis 46
Wolf, H., & Wehner, R. (2005). Desert ants compensate for navigation uncertainty. J. Exp.
Biol., 208(22), 4223-4230.
Wood, R. J., Cho, K.-J., & Hoffman, K. (2009). A novel multi-axis force sensor for
microrobotics applications. Smart. Mater. Struct., 18(12), 125002.
Zill, S., Schmitz, J., & Büschges, A. (2004). Load sensing and control of posture and
locomotion. Arthropod. Struct. Dev., 33(3), 273-286.
Zill, S. N., & Moran, D. T. (1981). The Exoskeleton and Insect Proprioception. I. Responses
of Tibial Campaniform Sensilla to External and Muscle-Generated Forces in the
American Cockroach, Periplaneta Americana. J. Exp. Biol., 91(1), 1-24.
Zollikofer, C. (1994a). Stepping patterns in ants - influence of body morphology. J. Exp.
Biol., 192(1), 107-118.
Zollikofer, C. (1994b). Stepping patterns in ants - influence of load. J. Exp. Biol., 192(1),
119-127.
Zollikofer, C. (1994c). Stepping patterns in ants - influence of speed and curvature. J. Exp.
Biol., 192(1), 95-106.
Zumwalt, A. C., Hamrick, M., & Schmitt, D. (2006). Force plate for measuring the ground
reaction forces in small animal locomotion. J. Biomech., 39(15), 2877-2881.
Danksagung
An dieser Stelle ist es an der Zeit, denjenigen Menschen zu danken, die mich von
Beginn bis zum Fertigstellen meiner Dissertation begleitet und unterstützt haben.
Mein besonderer Dank gilt Herrn Prof. Dr. Reinhard Blickhan. Als mein Doktorvater
gab er mir als Sportwissenschaftler die Chance, in der Biomechanik zu promovieren. Damit
öffnete er mir das Tor zur Wissenschaft. Er gab mir den Freiraum mich selbst zu entfalten,
was meine Selbständigkeit förderte. Sein hoher Anspruch, der internationalen wissenschaft-
lichen Standards entspricht, formte meine Arbeits- und Denkweise. Selbst am Wochenende
und in den späten Abendstunden antwortete er mir bereitwillig auf meine Fragen.
Ich danke Herrn Dr. Tom Weihmann, der gerade zu Beginn der Promotion mein di-
rekter Ansprechpartner war. Durch sein biologisches und biomechanisches Wissen und Kön-
nen unterstützte er mich, den Zugang zur Arthropodenbiomechanik zu finden.
Mein weiterer Dank gilt Herrn Dr. Michael Günther. Durch zahlreiche Gespräche im
Café oder am Arbeitsplatz schärfte er meine (bio-) mechanische Denkweise. Seine Antwor-
ten und Kommentare waren hart aber herzlich.
Ich danke Herrn Prof. Dr. Tobias Siebert für die prompte Zusage als Zweitgutachter
zu fungieren. Durch die Einstellung als Elternzeitvertretung in seinem Projekt, sicherte er
mich finanziell ab und gab mir nebenbei den Freiraum diese Arbeit zu beenden.
Dem Drittgutachter Herrn Prof. Dr. Tobias Seidl gilt ebenfalls mein Dank der soforti-
gen und unkomplizierten Zusage, das Drittgutachten zu übernehmen.
Bei meinem Kollegen und Projektmitarbeiter Herrn Toni Wöhrl bedanke ich mich
recht herzlich für seine selbstlose Unterstützung beim Messen. So endete manch gemeinsa-
mer Messtag erst weit nach Mitternacht.
Ich bedanke mich bei meinen „Mitstreitern“ der Arbeitsgruppe für das angenehme Ar-
beitsklima und das kollegiale Miteinander. Besonders hervorheben möchte ich dabei Herrn
Dr. Stefan Hochstein und Herrn Dr. Emanuel Andrada.
Den unzähligen, kleinen, krabbelnden Probanden, die an den Studien teilgenommen
haben, bin ich ebenfalls zu großem Dank verpflichtet.
Zuletzt danke ich meiner Familie und meinen Eltern für Ihre Unterstützung.
Erklärung
Hiermit erkläre ich, dass mir die geltende Promotionsordnung der Fakultät bekannt ist
und dass ich die Dissertation selbst angefertigt und alle von mir benutzten Hilfsmittel, per-
sönliche Mitteilungen und Quellen in meiner Arbeit angegeben habe. Weiterhin erkläre ich,
dass mich keine Personen bei der Auswahl und Auswertung des Materials unterstützt haben.
Die Kapitel 3 bis 5 der vorliegenden kumulativen Dissertation sind in internationalen
wissenschaftlichen Zeitschriften publiziert. Von Prof. Dr. Reinhard Blickhan habe ich kon-
zeptionelle Unterstützung bei der Erstellung der Erstmanuskripte erhalten. Die Ideen für Ka-
pitel 3 und 5 stammen von mir und wurden federführend von mir ausgearbeitet. Die Erstel-
lung des Manuskriptes für Kapitel 4 war von enger Zusammenarbeit mit Dr. Tom Weihmann
geprägt. Als Hauptautor der Artikel oblag mir die Überarbeitung in Bezug auf die Anmer-
kungen und Empfehlungen der von den Zeitschrifteneditoren bestellten, anonymen Gutach-
ten. Weitere Personen haben mich bei der Erstellung der Manuskripte nicht unterstützt. Zu-
sätzlich sind die Arbeitsanteile, gemäß Autorenvereinbarung, in der Übersicht zu den Arti-
keln (Kapitel 2) explizit angegeben.
Ferner erkläre ich, dass ich nicht die Hilfe eines Promotionsberaters in Anspruch ge-
nommen habe und dass Dritte weder unmittelbar noch mittelbar geldwerte Leistungen von
mir für Arbeiten erhalten haben, die im Zusammenhang mit dem Inhalt der vorgelegten Dis-
sertation stehen.
Die Dissertation wurde noch nicht als Prüfungsarbeit für eine staatliche oder andere
wissenschaftliche Prüfung eingereicht und keine gleiche, ähnliche oder andere Abhandlung
bei einer anderen Hochschule als Dissertation eingereicht.
Ich versichere, nach bestem Wissen die reine Wahrheit gesagt und nichts verschwie-
gen zu haben.
Jena, den 20.06.2014 __________________________
Lars Reinhardt