Identification of an unusual glycosyltransferase from a ... · Figure 4: TLC plate photography of...
147
Identification of an unusual glycosyltransferase from a non-cultivated microorganism and the construction of an improved Escherichia coli strain harboring the rpoD gene from Clostridium cellulolyticum for metagenome searches Dissertation Zur Erlangung der Würde des Doktors der Naturwissenschaften des Fachbereichs Biologie, der Fakultät für Mathematik, Informatik und Naturwissenschaften, der Universität Hamburg vorgelegt von Julia Jürgensen aus Henstedt-Ulzburg Hamburg 2015
Transcript of Identification of an unusual glycosyltransferase from a ... · Figure 4: TLC plate photography of...
Identification of an unusual
glycosyltransferase from a
non-cultivated microorganism and the
construction of an improved
Escherichia coli strain
harboring the rpoD gene from
Clostridium cellulolyticum for
metagenome searches
Dissertation
Zur Erlangung der Würde des Doktors der Naturwissenschaften
des Fachbereichs Biologie, der Fakultät für Mathematik, Informatik und
Naturwissenschaften,
der Universität Hamburg
vorgelegt von
Julia Jürgensen
aus Henstedt-Ulzburg
Hamburg 2015

Table of contents I
Table of contents
1 Introduction ...................................................................................................... 1
1.1 Flavonoids................................................................................................... 1
1.2 Glycosyltransferases ................................................................................... 3
1.3 Biotechnology ............................................................................................. 4
1.3.1 Biotechnological relevance of glycosyltranferases....................................... 5
1.4 Metagenomics ............................................................................................. 5
1.5 Transcription ............................................................................................... 7
1.6 Phyla ........................................................................................................... 8
1.6.1 Proteobacteria ............................................................................................. 8
1.6.2 Firmicutes ................................................................................................... 9
1.6.2.1 Clostridium cellulolyticum ............................................................................ 9
1.7 Intention of this work ................................................................................... 9
2 Material & Methods ........................................................................................ 10
2.1 Bacterial strains, vectors, primers and constructs...................................... 10
2.2 Media and supplements ............................................................................ 15
2.2.1 Antibiotics and other supplements ............................................................. 16
2.2.2 LB Medium (Sambrook 2001).................................................................... 16
2.2.3 CM3 Medium for Clostridium cellulolyticum ............................................... 16
2.3 Samples and metagenomic libraries.......................................................... 17
2.3.1 Environmental samples ............................................................................. 17
2.3.1.1 Elephant feces .......................................................................................... 18
2.3.1.2 Elbe river sediment ................................................................................... 18
2.3.2 Metagenomic libraries ............................................................................... 18
2.4 Culture conditions ..................................................................................... 18
2.4.1 Cultivation of bacterial strains ................................................................... 18
2.4.2 Determination of cell density ..................................................................... 18
2.4.3 Cell harvesting .......................................................................................... 19
2.4.4 Strain maintenance ................................................................................... 19
2.5 Microscopy ................................................................................................ 19
2.5.1 Standard microscopy ................................................................................ 19
2.6 DNA purification ........................................................................................ 19
2.6.1 Isolation of genomic DNA .......................................................................... 19
2.6.1.1 Isolation of genomic DNA from elephant feces .......................................... 20
2.6.1.2 Isolation of genomic DNA from the Elbe river sediment ............................. 20
2.6.1.3 Isolation of genomic DNA, standard method ............................................. 21
2.6.2 Plasmid isolation “Quick and Dirty” ............................................................ 21
2.6.3 Plasmid isolation with a plasmid mini kit .................................................... 22
2.6.4 Gel extraction of DNA ............................................................................... 22
2.6.5 Purification and concentration of DNA ....................................................... 22
2.6.6 Spectrophotometrical determination of DNA concentration and purity ....... 23
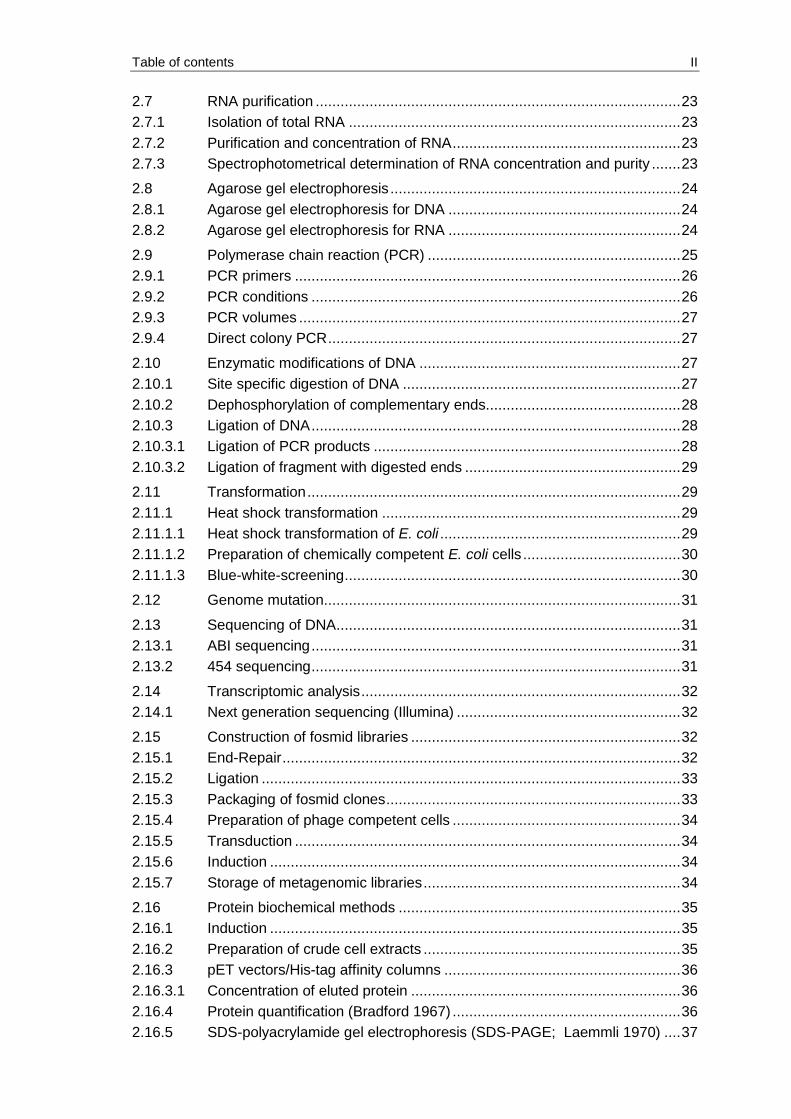
Table of contents II
2.7 RNA purification ........................................................................................ 23
2.7.1 Isolation of total RNA ................................................................................ 23
2.7.2 Purification and concentration of RNA ....................................................... 23
2.7.3 Spectrophotometrical determination of RNA concentration and purity ....... 23
2.8 Agarose gel electrophoresis ...................................................................... 24
2.8.1 Agarose gel electrophoresis for DNA ........................................................ 24
2.8.2 Agarose gel electrophoresis for RNA ........................................................ 24
2.9 Polymerase chain reaction (PCR) ............................................................. 25
2.9.1 PCR primers ............................................................................................. 26
2.9.2 PCR conditions ......................................................................................... 26
2.9.3 PCR volumes ............................................................................................ 27
2.9.4 Direct colony PCR ..................................................................................... 27
2.10 Enzymatic modifications of DNA ............................................................... 27
2.10.1 Site specific digestion of DNA ................................................................... 27
2.10.2 Dephosphorylation of complementary ends............................................... 28
2.10.3 Ligation of DNA ......................................................................................... 28
2.10.3.1 Ligation of PCR products .......................................................................... 28
2.10.3.2 Ligation of fragment with digested ends .................................................... 29
2.11 Transformation .......................................................................................... 29
2.11.1 Heat shock transformation ........................................................................ 29
2.11.1.1 Heat shock transformation of E. coli .......................................................... 29
2.11.1.2 Preparation of chemically competent E. coli cells ...................................... 30
2.11.1.3 Blue-white-screening ................................................................................. 30
2.12 Genome mutation...................................................................................... 31
2.13 Sequencing of DNA ................................................................................... 31
2.13.1 ABI sequencing ......................................................................................... 31
2.13.2 454 sequencing ......................................................................................... 31
2.14 Transcriptomic analysis ............................................................................. 32
2.14.1 Next generation sequencing (Illumina) ...................................................... 32
2.15 Construction of fosmid libraries ................................................................. 32
2.15.1 End-Repair ................................................................................................ 32
2.15.2 Ligation ..................................................................................................... 33
2.15.3 Packaging of fosmid clones ....................................................................... 33
2.15.4 Preparation of phage competent cells ....................................................... 34
2.15.5 Transduction ............................................................................................. 34
2.15.6 Induction ................................................................................................... 34
2.15.7 Storage of metagenomic libraries .............................................................. 34
2.16 Protein biochemical methods .................................................................... 35
2.16.1 Induction ................................................................................................... 35
2.16.2 Preparation of crude cell extracts .............................................................. 35
2.16.3 pET vectors/His-tag affinity columns ......................................................... 36
2.16.3.1 Concentration of eluted protein ................................................................. 36
2.16.4 Protein quantification (Bradford 1967) ....................................................... 36
2.16.5 SDS-polyacrylamide gel electrophoresis (SDS-PAGE; Laemmli 1970) .... 37
Table of contents III
2.16.5.1 Preparation of denaturing SDS-polyacrylamide gels ................................. 37
2.16.5.2 Sample preparation for SDS-PAGE and electrophoresis conditions .......... 39
2.16.5.3 Coomassie staining of proteins and estimation of molecular weight ......... 39
2.17 Assays for the detection and quantification of enzymatic activities ............ 40
2.17.1 Glycosyltransferase activities .................................................................... 40
2.17.1.1 Culture and clone preparation for the META assay ................................... 40
2.17.1.1.1 Large scale screening preparation ............................................................ 40
2.17.1.1.2 Single clone assay preparation ................................................................. 40
2.17.1.1.3 Quantification of glycosyltransferase activity ............................................. 41
2.17.1.1.4 Substrate specificity and glycosylation pattern .......................................... 41
2.17.1.1.5 Biocatalysis with purified protein ............................................................... 41
2.17.1.2 TLC analysis ............................................................................................. 42
2.17.1.2.1 Standard TLC analysis .............................................................................. 42
2.17.1.2.2 TLC analysis for quantification .................................................................. 42
2.17.2 Cellulolytic activities .................................................................................. 43
2.17.2.1 Congo red agar plate assay ...................................................................... 43
2.17.2.2 3,5-dinitrosalicylic acid (DNSA) assay ....................................................... 43
2.17.3 Esterolytic activities ................................................................................... 44
2.17.3.1 Tributyrin (TBT) agar plate assay .............................................................. 44
2.17.3.2 Para-nitrophenol (pNP) ester assay .......................................................... 44
2.17.3.2.1 pNP ester assay in a microtiter plate scale ................................................ 45
2.17.4 Amylase activity ........................................................................................ 45
3 Results ............................................................................................................ 46
3.1 Glycosyltransferase ................................................................................... 46
3.1.1 Metagenomic library construction .............................................................. 46
3.1.2 Screening of metagenomic libraries .......................................................... 46
3.1.2.1 Downsizing of the putative positive pool Elbe144b .................................... 48
3.1.3 Identification of the glycosyltransferase from pFOS144C11 ...................... 49
3.1.4 Overexpression and purification of GtfC .................................................... 50
3.1.5 Characterization of the new glycosyltransferase ....................................... 51
3.1.5.1 Glycosylation pattern and flavonoid substrates ......................................... 52
3.1.5.2 Quantification ............................................................................................ 54
3.1.5.3 Sugar substrate spectrum and product identification ................................. 56
3.1.5.3.1 Biotransformation analysis with different sugar additions .......................... 56
3.1.5.3.2 Detailed comparison of GtfC quercetin biotransformation products to reference substances ................................................................................ 57
3.2 Meta(genome)transcriptomic and overcoming limitations in E. coli ............ 60
3.2.1 Transcriptomic analysis of E. coli Epi300 carrying different fosmids .......... 60
3.2.1.1 Selection of different fosmids .................................................................... 60
3.2.1.2 Analysis of the transcription levels of the different fosmids ........................ 61
3.2.2 Overcoming the limitation .......................................................................... 68
3.2.2.1 Construction of the mutant E. coli Epi300 UHH01 ..................................... 69
3.2.3 Measuring the changed growth behavior ................................................... 72
3.2.3.1 Standard growth curve .............................................................................. 72
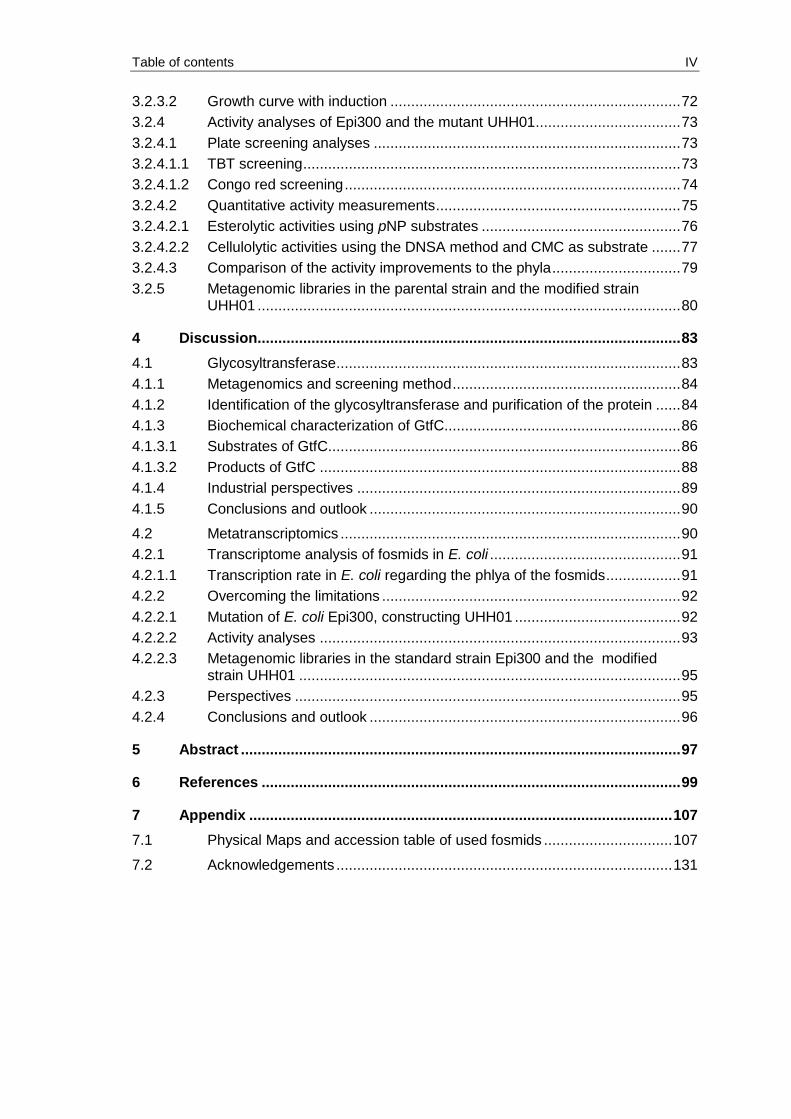
Table of contents IV
3.2.3.2 Growth curve with induction ...................................................................... 72
3.2.4 Activity analyses of Epi300 and the mutant UHH01 ................................... 73
3.2.4.1 Plate screening analyses .......................................................................... 73
3.2.4.1.1 TBT screening ........................................................................................... 73
3.2.4.1.2 Congo red screening ................................................................................. 74
3.2.4.2 Quantitative activity measurements ........................................................... 75
3.2.4.2.1 Esterolytic activities using pNP substrates ................................................ 76
3.2.4.2.2 Cellulolytic activities using the DNSA method and CMC as substrate ....... 77
3.2.4.3 Comparison of the activity improvements to the phyla ............................... 79
3.2.5 Metagenomic libraries in the parental strain and the modified strain UHH01 ...................................................................................................... 80
4 Discussion ...................................................................................................... 83
4.1 Glycosyltransferase ................................................................................... 83
4.1.1 Metagenomics and screening method ....................................................... 84
4.1.2 Identification of the glycosyltransferase and purification of the protein ...... 84
4.1.3 Biochemical characterization of GtfC......................................................... 86
4.1.3.1 Substrates of GtfC ..................................................................................... 86
4.1.3.2 Products of GtfC ....................................................................................... 88
4.1.4 Industrial perspectives .............................................................................. 89
4.1.5 Conclusions and outlook ........................................................................... 90
4.2 Metatranscriptomics .................................................................................. 90
4.2.1 Transcriptome analysis of fosmids in E. coli .............................................. 91
4.2.1.1 Transcription rate in E. coli regarding the phlya of the fosmids .................. 91
4.2.2 Overcoming the limitations ........................................................................ 92
4.2.2.1 Mutation of E. coli Epi300, constructing UHH01 ........................................ 92
4.2.2.2 Activity analyses ....................................................................................... 93
4.2.2.3 Metagenomic libraries in the standard strain Epi300 and the modified strain UHH01 ............................................................................................ 95
4.2.3 Perspectives ............................................................................................. 95
4.2.4 Conclusions and outlook ........................................................................... 96
5 Abstract .......................................................................................................... 97
6 References ..................................................................................................... 99
7 Appendix ...................................................................................................... 107
7.1 Physical Maps and accession table of used fosmids ............................... 107
7.2 Acknowledgements ................................................................................. 131
Figures V
Figures
Figure 1: Skeletal structures of two flavonoid groups. A, skeletal structure of flavonoids (flavan=2-phenylchroman) and its lettering; B, skeletal structure of isoflavonoids (isoflavan = 3-phenylchroman). ................................................. 2
Figure 2: Skeletal structures of the flavonoid (sub)groups used in this study. A, skeletal structure of the flavonoid subgroup flavonol; B, skeletal structure and numbering of the flavonoid subgroup flavanone; C, skeletal structure of the flavonoid subgroup flavone; D, skeletal structure of the isoflavonoid subgroup isoflavone; E, skeletal structure of the stilbenoid subgroup (trans) stilbene; F, skeletal structure of the minor flavonoid subgroup chalcone. ........... 3
Figure 3: Reaction mechanisms performed by glycosyltransferases family 1. The acceptor displays the flavonoid, the donor the nucleotide sugar. The mechanism is a SN2 reaction and requires a single nucleophilic attack. ............. 4
Figure 4: TLC plate photography of each 20 µl extracts from biotransformation reactions of 100 µM quercetin after 24 h (2.17.1.1.1). Pools of 48 clones (143a – 145b), including the active pool 144b, were analyzed. One band in 144b (arrow) showed the same Rf value and a similar fluorescence as the reference substance quercitrin (Q3). The TLC Plates were derivatized by "Naturstoffreagenz A" and documented at 365 nm (2.17.1.2.1). Q, quercetin (100 µM were used as substrate); S, spiraeoside; Q3, quercitrin. .................... 47
Figure 5: TLC-chromatograms of extracts of the 48 clone pool Elbe144b, the six clone pool, Elbe144C, and the single clone, pFOS144C11. Samples of 20 µl extracts were measured after a 24 h biotransformation of 100 µM quercetin (2.17.1.1.1, 2.17.1.2.1). A, 48 clone pool Elbe144b; B, the six clone pool Elbe144C; C, the single clone pFOS144C11. Q, quercetin (used as substrate); P2, first appearing and main product; P3, second product. Figure from (Rabausch et al. 2013). ................................................................. 48
Figure 6: Genetic context of gtfC from plasmid pSK144C11 from the Elbe river sediment. From (Rabausch et al. 2013). .......................................................... 49
Figure 7: TLC-chromatograms of extracts of the subclones pSK144C11 and pDgtfC. Samples of 20 µl were analyzed using 100 µM quercetin as substrate after 24 h biotransformation (2.17.1.2.1). Clone pSK144C11 (A), pDgtfC (B) (Rabausch et al. 2013). .................................................................. 50
Figure 8: Denaturing 12 % SDS-PAGE analysis of purified GtfC. The gel was stained with Coomassie Brilliant Blue solution. The arrow indicates the protein band of recombinant GtfC at a predicted molecular weight of 54.7 kDa, including the His10-tag. M: 7 µl marker (Thermo Scientific marker, #26614). Approximately 15 µg of protein were applied. .................................... 51
Figure 9: UV absorbance spectra (220 to 420 nm) of the three biotransformation products P1 (A), P2 (B) and P3 (C) of GtfC using quercetin as substrate. P1 showed the same spectrum as the reference substance isoquercitrin, and P2 the same as quercitrin. P3 showed shifts in its bands that could not be assigned to a specific substance (Rabausch et al. 2013). ................................ 58
Figure 10: Structure of quercetin and its possible O-glycosylation sites. Highlighted in blue are the positions that can be glycosylated by GtfC using different acceptor molecules, given only one hydroxyl group (3.1.5.1). Highlighted in orange is the C3 position, which was shown to be glycosylated, at least with rhamnose and glucose using quercetin as substrate (Table 9). .......................................................................................... 59
Figure 11: TLC analysis of extracts from biotransformations of quercetin (A) and kaempferol (B) that was used for absorbance spectra. Both substrates are also applied on the plates. E. coli pET19gtfC sample after 4 h. Designated
Figures VI
with white arrows are the two bands that represent the rhamnose and glucose addition to C3 of quercetin, respectively. For quercetin the rhamnose glycoside is named P2 and the glucose glycoside P1. The third band with the highest Rf value represents the still unknown product P3. For kaempferol (B) the yellow arrow shows astragalin, the 3-O-glucoside of kaempferol. TLC plates were derivatized by Naturstoffreagenz A and documented at 365 nm (2.17.1.2.1). K, kaempferol; Q, quercetin; IQ, isoquercitrin; Q3, quercitrin; A, astragalin; P, products. .................................... 59
Figure 12: Pie chart of the phylogenetic variety of the 19 transcriptional analyzed fosmids, based on highest similarities using NCBI-BLASTN. The main fraction is Bacteroidetes with more than 50 %. Fibrobacteres and Firmicutes show equal fractions at 21 %, respectively, Proteobacteria presents 11 % and Verrucomicrobia is the smallest fraction at 5 %.................. 62
Figure 13: Heatmap of all 492 elucidated ORFs in E. coli Epi300 based on their FPKM value, separated in the fosmids. The colors were given due to the FPKM values in the following order: grey, 0.1-5; yellow, 5-200; light orange, 201-1,000; red, more than 1,000, *, the two parallels did not belong to the same color code and the average was used; white, the two parallels were too differing (one parallel yellow, the other one red). ........................................ 64
Figure 14: Circos diagram of the 19 fosmid and the E. coli transcripts. The fosmids are abbreviated as shown in Table 5. Green dots: Range of the highest transcribed 10 % of E. coli genes, red dots: Range of the lowest 10 %. Black dots display the average 80 % of the FPKM values of the E. coli genes. .............................................................................................................. 67
Figure 15: Distribution of the FPKM values belonging to the 5 analyzed phyla. Grey, FPKM value lower than 5, yellow, FPKM value of 5.1 to 200; orange, 201-1,000; red, 1,001+; white, one parallel showed a high FPKM value and the second a low one. ...................................................................................... 68
Figure 16: Construction of the UHH01 mutant with used restriction sites. RpoD, sigma factor gene; ampR, the ampicillin resistance gene; Plac, the promoter from pBluescript SK II (+) and bioF, the E. coli gene in which the construct was inserted. .................................................................................................... 69
Figure 17: PCR products for the appA and bioF mutant. The upper part shows the integration in appA the part below shows the bioF mutant. Band 1 represents the 1 kb ladder. Band 2 and 3 using rpoD_XbaI_for and rpoD_BamHI_rev to amplificat the rpoD about 1.1 kb for the mutant (2) and no amplificat for the wild type (3). Band 4 and 5 using rpoD_XbaI_for and bioF/appA_control_rev with an estimated size of about 2.2 kb for the mutant (4) and the wild type (5). Band 6 and 7 using bioF/appA_control_for and Amp_HindIII_rev with an estimated size of 2.5 kb for the mutant. The mutant is shown in band 6, the wild type in band 7. Band 8 and 9 using the primer pair rpoD_control_for and bioF/appA_control_rev with an estimated size of 1.7 kb for the mutant. For appA the mutant is shown in band 8 and the wild type in band 9, for bioF the order is inverted. Band 10 and 11 display the PCR product using the primers bioF/appA_control_for and bioF/appA_control_rev with an estimated size of 2.6 kb for the mutant (10) and 600 bp for the bioF wild type of and 1.4 kb for the appA wild type (11). Band 12 displays the negative control without DNA supplemented, showing that the wild type band in the mutant is due to the recombinant Taq polymerase. ..................................................................................................... 71
Figure 18: Growth curve of the parental strain E. coli Epi300 in comparison to the mutant strain UHH01 over 18 h in LB medium. 3 parallels were performed; the standard deviations are shown as bars. ..................................................... 72
Figures VII
Figure 19: Growth curve of the parental strain E. coli Epi300 compared to the mutant UHH01, over 18 h in LB medium induced with 1 mM IPTG. 3 parallels were performed; the standard deviations are shown as bars. ............ 73
Figure 20: Congo red plate with fosmid pJB190D12 (O) in the two different strains. From left to right: Epi300, UHH01. For each strain 1 µl of culture was dotted on the plate. The plates were stained with congo red after 5 days at 37 °C. The halo around the UHH01 colony (right arrow) is brighter and larger than the one around Epi300 (left arrow). .................................................................. 75
Figure 21: Physical maps of three fosmids with esterolytic activity and the putative responsible ORFs. Fosmid N (pJB148G3) belongs to the phylum Proteobacteria and fosmids S (pJB77G10) and T (pJB84G2) to the Firmicutes. *E labels the relevant ORFs. .......................................................... 77
Figure 22: Physical maps of three fosmids with cellulolytic activity and the putative responsible ORFs. Fosmid I belongs to the phylum Bacteroidetes and fosmids U and W to Fibrobacteres. *C labels the relevant cellulolytic and *E a putative esterolytic ORF. ............................................................................... 79
Figure 23: The rhamnose pathway, in red, and some of its interactions with other deoxy sugar biosynthetic pathways (Giraud and Naismith 2000). .................... 89
Figure 24A: Physical maps of the fosmids used in the study (A-M). The color indicates the phylum they were assigned to. Legend is shown in the second part of the figure (Figure 24B). ....................................................................... 107
Tables VIII
Tables
Table 1: Bacterial strains used in this study. ............................................................... 10
Table 2: Vectors used in this study. ............................................................................ 10
Table 3: Primers used in this study. ............................................................................ 11
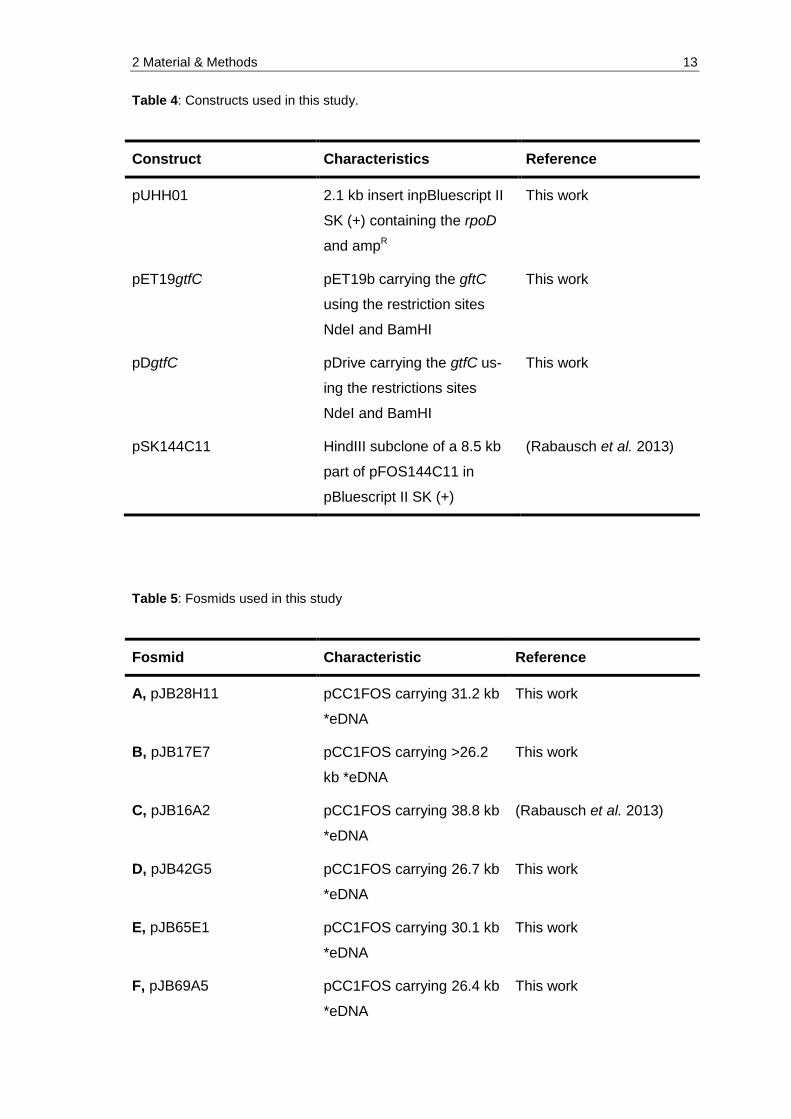
Table 4: Constructs used in this study. ........................................................................ 13
Table 5: Fosmids used in this study ............................................................................ 13
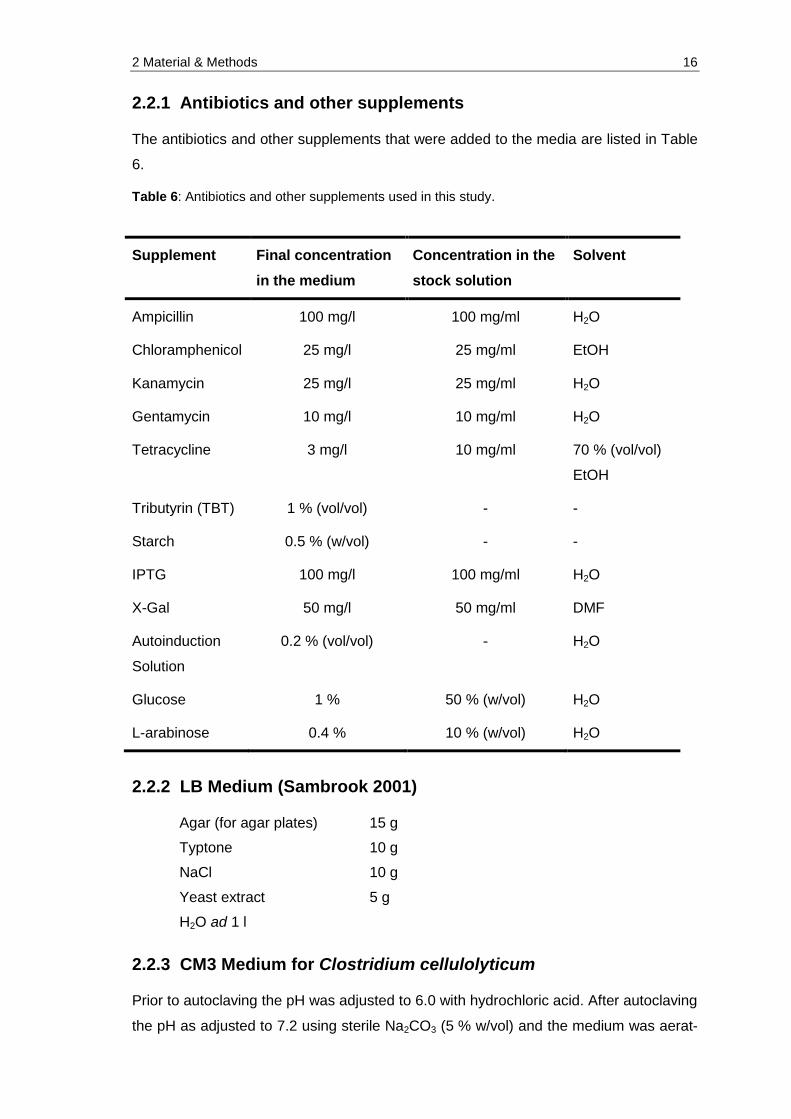
Table 6: Antibiotics and other supplements used in this study. ................................... 16
Table 7: PCR reaction conditions. ............................................................................... 26
Table 8: Pipetting scheme for SDS polyacrylamide gels. ............................................ 38
Table 9: Substrate specifity of GtfC for different flavonoids in biotransformation assays. Selected flavonoids are shown with their conversion after 24 h biotransformation with recombinant GtfC and 200 µM substrate, respectively. The product number derived from the evolving product peaks after the biotransformation. The conversion was compared among the groups and is not based on exact quantification. +/- very weak conversion, +, conversion; ++, good conversion; +++, almost complete conversion (Rabausch et al. 2013). .................................................................................... 53
Table 10: Flavonoid substrates, their conversion and products after biotransformation, with recombinant GtfC in triplicates. The conversion was calculated on the basis of substrate compared, 200 µM respectively, to defined amounts of reference substances. Rf values and products in bold indicate the main product of the biotransformation reaction. Products symbolized by “–“ were not specified due to commercially unavailable reference substances (Rabausch et al. 2013). ................................................. 55
Table 11: Sugar substrates added to the phosphate buffer during biotransformation with GtfC and the number of resulting products using quercetin as acceptor molecule. ....................................................................... 57
Table 12: Positive screened clones in the metagenomic library of elephant feces using three different screening methods. ......................................................... 60
Table 13: Mapped read statistics observed for the two replicates. % mRNA, percentage of total mapped reads against mRNA; % rtRNA, percentage of total mapped reads against rRNA and tRNA. ................................................... 63
Table 14: The five different phyla used for the transcriptomic analysis, their correspondent analyzed fosmid clones, the number of ORFs on these fosmids and their maximum average FPKM value (Figure 13). *, The average FPKM value is from higher differing parallels, where the parallels did not belong to the same color code used for the heatmap (Figure 13). ........ 65
Table 15: Number of the analyzed fosmid ORFs for specific FPKM values, an E. coli ORF example showing the same FPKM value in this analysis and its function in the cell, for comparison. .................................................................. 65
Table 16: Positive fosmid clones that were detected using the TBT plate screening method (2.17.3.1) in the parental strain E. coli Epi300 and the mutant strain UHH01. For every strain 1 µl of culture was dotted on the plate. The plates were analyzed after 5 days at 37 °C. + indicates the relative size of the halo; −, no halo. ............................................................................................... 74
Table 17: Positive fosmid clones that were detected using the congo red CMC plate screening method (2.17.2.1) in the parental strain, E. coli Epi300, and the mutant strain, UHH01. For every strain 1 µl of culture was dotted on the plate. The plates were stained with congo red after 5 days at 37 °C. + indicates the relative size of the halo. ............................................................... 75
Tables IX
Table 18: Esterolytic activities in Epi300 and its derivative UHH01 using 1 mM pNP-butyrate as substrate in a liquid quantitative screening. Calculated on the basis of relative activities per mg protein of crude cell extracts, subtracting the background activity of E. coli. The measurement was done after an incubation with the substrate for 30 min at 37 °C and afterwards measured at 405 nm. −, no activity; +, low activity; ++, medium activity; +++ high activity; ++++ very high activity. ................................................................ 76
Table 19: Esterolytic activities in Epi300 and its derivative UHH01 using 1 mM pNP-octanoate as substrate in a liquid quantitative screening. Calculated on the basis of relative activities per mg protein of crude cell extracts, subtracting the background activity of E. coli. The measurement was done after an incubation with the substrate for 30 min at 37 °C and afterwards measured at 405 nm. −, no activity; +, low activity; ++, medium activity; +++ high activity; ++++ very high activity. ................................................................ 77
Table 20: Cellulolytic activities in Epi300 and its derivate using CMC (carboxy methyl cellulose) as substrate in a liquid quantitative screening. Calculated on the basis of relative activities per mg protein of crude cell extracts. The measurement was done at 546 nm after an incubation with the substrate for 30 min at 37 °C and boiling it up with DNSA reagent for 15 min. −, no activity; +/-, hardly detectable activity; +, low activity; ++, medium activity; +++ high activity; ++++ very high activity. ......................................................... 78
Table 21: The phyla, their used number for activity screenings, the number of clones which showed activity and their number of improved activities due to the mutant strain UHH01, only considering the active clones. The activities were limited to esterolytic and cellulolytic ones . .............................................. 79
Table 22: Metagenomic libraries employed in the Epi300 and UHH01 with DNA material from the Elbe river (2.3.1.2) and their insert sizes. .............................. 80
Table 23: Positive clones and their activity level in the two metagenomic libraries, for Epi300 and the mutant strain UHH01, using the TBT screen. The plates were evaluated after 5 days of incubation at 37 °C. ......................................... 81
Table 24: Positive clones and their activity level in the two metagenomic libraries, for Epi300 and the mutant strain UHH01, using the amylase screen. The plates evaluated after 5 days of incubation at 37 °C and dyeing with Lugols' iodine solution for about 6 min. ........................................................................ 81
Table 25: Change in activity level on TBT after transformation of the in UHH01 detected fosmid clones into Epi300. The plates were evaluated after 5 days of incubation at 37 °C. ...................................................................................... 82
Table 26: ORFs identified and analyzed on pSK144C11 using NCBI BLAST, gtfC is the active ORF surrounded by the other ORFs, as shown in Figure 6 (Rabausch et al. 2013). .................................................................................... 85
Table 27: Representatives of flavonoid subgroups converted by GtfC and the conversion for the examples, that were shown in Table 10. ............................. 87
Table 28: Accession table of all 24 used fosmids (3.2). ............................................ 109
Abbreviations X
Abbreviations
aa amino acid(s)
Acc. No. accession number
ad up to
amp ampicillin
APS ammonium persulphate
ATP adenosine triphosphate
bidest bidistilled water
BLAST Basic Local Alignment Search Tool
bp base pairs
BSA bovine serum albumin
°C degree Celsius
CMC carboxymethylcellulose
Da Dalton
DNA deoxyribonucleic acid
DNase deoxyribonuclease
DMF dimethylformamide
DMSO dimethyl-sulfoxide
DNSA 3,5-dinitrosalicyl acid
dNTP deoxyribonucleotide triphosphate
dTDP deoxythymidine diphosphate
DSMZ German collection of Microorganisms and Cell Cultures
(“Deutsche Sammlung von Mikroorganismen und Zellkulturen
GmbH”)
EC number enzyme commission number
E-cup Eppendorf reaction tube
EDTA ethylene-diamine-tetraacetid-acid
EtAc ethylacetate
et al. et alii (Latin: and others)
EtOH ethanol
Fig. figure
FPKM fragments per kilo base per million mapped reads
g gram(s)
g earth's gravitational acceleration
GC% percentage of G and C in DNA sequences

Abbreviations XI
GH glycoside hydrolase
GtfC glycosyltransferase, metagenome derived
h hour(s)
HPLC-ESI-MS high performance liquid chromotography electrospray tandem
mass spectrometry
IPTG isopropyl thio-β-D-galactoside
KAc potassium acetate
kb kilobases
l litre(s)
LB Luria Bertani
µ micro- (1 x 10⁻⁶)
m milli- (1 x 10⁻³)
M molar
mA milliampere
Mbp megabasepairs
MCS multiple cloning site
META metagenome extract thin-layer chromotography analysis
min minute(s)
mRNA messenger RNA
n nano- (1 x 10⁻⁹)
NaAc sodium acetate
NaCl sodium chloride
NCBI National Center for Biotechnology Information
Ni-TED nickel tris-carboxymethyl ethylene diamine
OD optical density
ORF open reading frame
PAGE polyacrylamide gelelektrophoresis
PCR polymerase chain reaction
PEG polyethylene glycol
pH negative logarithm of the molar concentration of dissolved
hydronium ions
R resistence
Rf retention factor
RFLP restriction fragment length polymorphism
RNA ribonucleic acid
Abbreviations XII
RNase ribonuclease
rpm rotations per minute
rRNA ribosomal RNA
RT room temperature
RT retention time
SDS sodium dodecyl sulphate
sec second(s)
t time
Tann annealing temperature
Taq Thermus aquaticus
TBT tributyrin, glycerol tributyrate
TE Tris-EDTA
Tm melting temperature
UV ultraviolet
V volt
WT wildtype
w/vol weight per volume
vol. volume
vol/vol volume per volume
vol/w volume per weight
X-Gal 5-bromo-4-chloro-3-indolyl-β-D-galactopyranoside
Aminoacids
Ala Alanine
Arg Arginine
Asn Asparagine
Asp Aspartic acid
Cys Cysteine
Gln Glutamine
Glu Glutamic acid
Gyl Glycine
His Histindine
Ile Isoleucine
Leu Leucine
Abbreviations XIII
Lys Lysine
Met Methionine
Phe Phenylalanine
Pro Proline
Ser Serine
Thr Threonine
Trp Tryptophan
Tyr Tyrosine
Val Valine
Nucleobases
A Adenine
C Cytosine
G Guanine
T Thymine
Data submission to public databases
The sequences of the gene gtfC and its surrounding genes were deposited at GenBank
under the accession numbers AGH18139, JX157627 (gtfC), JX157628 (esmB),
JX157626 (esmA) and JX157629 (esmC).
All used fosmids were also deposited at GenBank under the following accession num-bers: KF540234 (pJB28H11), KF540229 & KF540230 (pJB17E7), JX188020 (pJB16A2), KF540236 (pJB42G5), KF540238 (pJB65E1), KF540239 (pJB69A5), KF540240 (pJB71G8), KF540242 (pJB83B9), KF540245 (pJB89E1), KF540246 (pJB92C9), KF540248 (pJB102C1), KF540249 (pJB135F11), KF540251& KF540252 (pJB154B8), KF540250 (pJB148G3), KF540253 & KF540227 (pJB190D12), KF540228 (pJB16B1), KF540235 (pJB39A3), KF540237 (pJB45G2), KF540241 (pJB77G10), KF540244 (pJB84G2), KF540231 & KF540232 (pJB18D1), KF540233 (pJB23D10), KF540243 (pJB84D8), KF540247 (pJB95A1).
1 Introduction 1
1 Introduction
1.1 Flavonoids
Flavonoids (from latin flavus=yellow) are plant secondary metabolites. They are the
most ubiquitous phenolic compounds found in nature and part of our daily nutrition.
They are exclusively produced in plants at low levels and fulfill many functions, such as
plant pigmentation for flower coloration (yellow or red/blue) to attract pollinator animals,
grub protection, chemical messengers, physiological regulators and cell cycle inhibitors
in higher plants. Flavonoids secreted by the root of a host plant, e.g. legumes, help
rhizobia in the infection stage of their symbiotic relationship. A huge number of flavo-
noids is known, estimated to be about 10,000 (Tahara 2007). The most ubiquitous fla-
vonoids in foods are flavonols and their main representatives are quercetin and
kaempferol. Foods with high flavonoid content are, for example, parsley, onions, ber-
ries, citrus fruits and some types of tea. As part of our nutrition they are well known for
their antioxidative and suggested radical scavenging nature (Bors and Saran 1987) as
well as other positive effects on human health (Ververidis et al. 2007), such as
anticarcinogenic (Christensen et al. 2012, Jin et al. 2012), antibacterial effects
(Cushnie and Lamb 2005) and positive effects on the cardiovascular system (Cassidy
et al. 2012, Macready et al. 2014). They interact with enzymes and DNA, about 30 en-
zymes in the human body can be inhibited by flavonoids. Because of these broad ef-
fects there is an increasing demand for specific flavonoids in pharma-, nutraceutical
and cosmetic industries (Schutz et al. 2006, Wang et al. 2006, Leonard et al. 2008).
The chemical structure of flavonoids (C6-C3-C6) consists of two aromatic rings linked
via a C3-bridge. Ring A is a benzene ring and Ring B is a phenyl benzene ring. For
most flavonoids the C3-bridge is closed to form a O-heterocyclic ring (the only excep-
tion are chalcones, see Figure 2F) which is named Ring C. The skeletal structure and
lettering of flavonoids is shown in Figure 1. Nine carbons consisting of Ring B and Ring
C are biosynthesized via the shikimate pathway. Ring A (C6) is supplied by three cy-
cles of the polyketide chain elongation reaction (Tahara 2007).

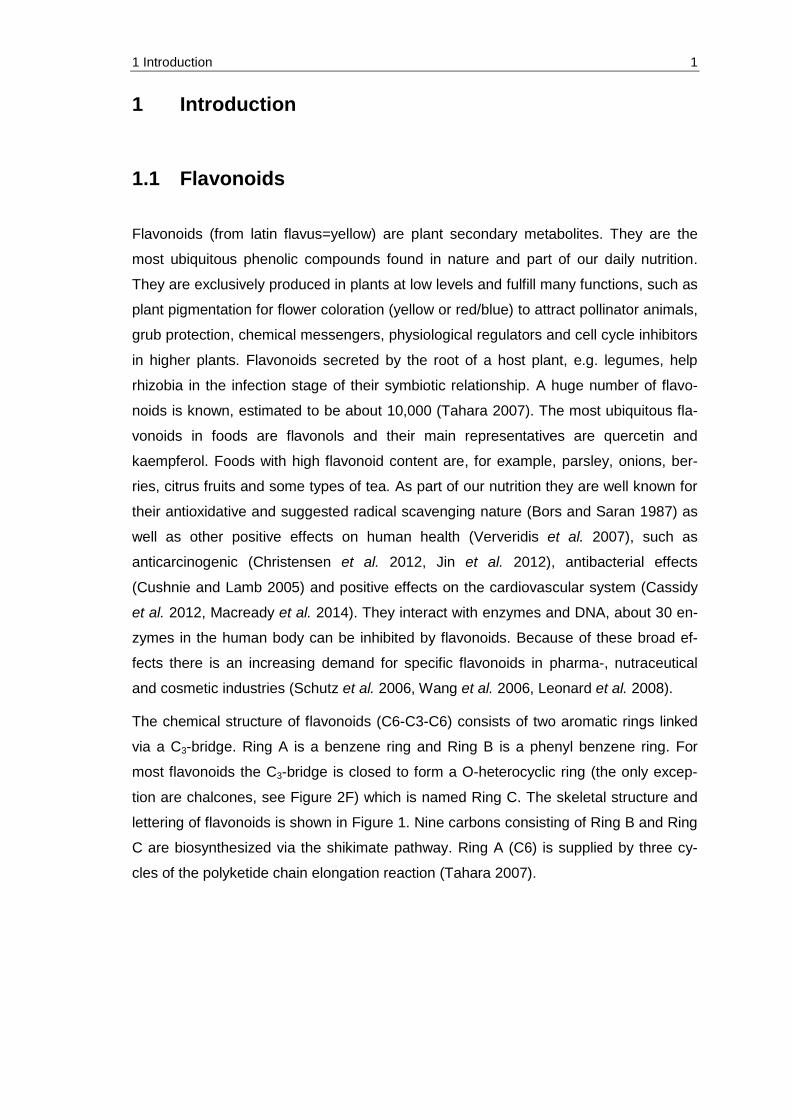
1 Introduction 2
Figure 1: Skeletal structures of two flavonoid groups. A, skeletal structure of flavonoids
(flavan=2-phenylchroman) and its lettering; B, skeletal structure of isoflavonoids (isoflavan = 3-
phenylchroman).
The chemical nature of the flavonoids depends on structural class, the degree of hy-
droxylation, other substitutions and conjugations, and the degree of polymerization
(Harborne 1986). Flavonoids are mainly divided into five groups, flavonoids in the nar-
row sense (Figure 1A), isoflavonoids (Figure 1B), stilbenoids, neoflavanoids and minor
flavonoids (Ververidis 2007), in which the first three are most relevant for this thesis.
Isoflavonoids are based on the 1,2-diphenylpropane whereas flavonoids are based on
the 1,3-diphenylpropane. The great majority of flavonoids have a 2- or 3-
phenylchroman skeleton.
Furthermore, they can generally be grouped into subgroups. The subgroups relevant
for this study are flavonols (Figure 2A), flavanones (Figure 2B), flavones (Figure 2C),
which all belong to the major flavonoids; isoflavones as subgroup of the isoflavonoids
(Figure 2D), stilbenes as subgroup of the stilbenes (Figure 2E) (Ververidis 2007) and
also one chalcone as subgroup of the minor flavonoids (Figure 2F).
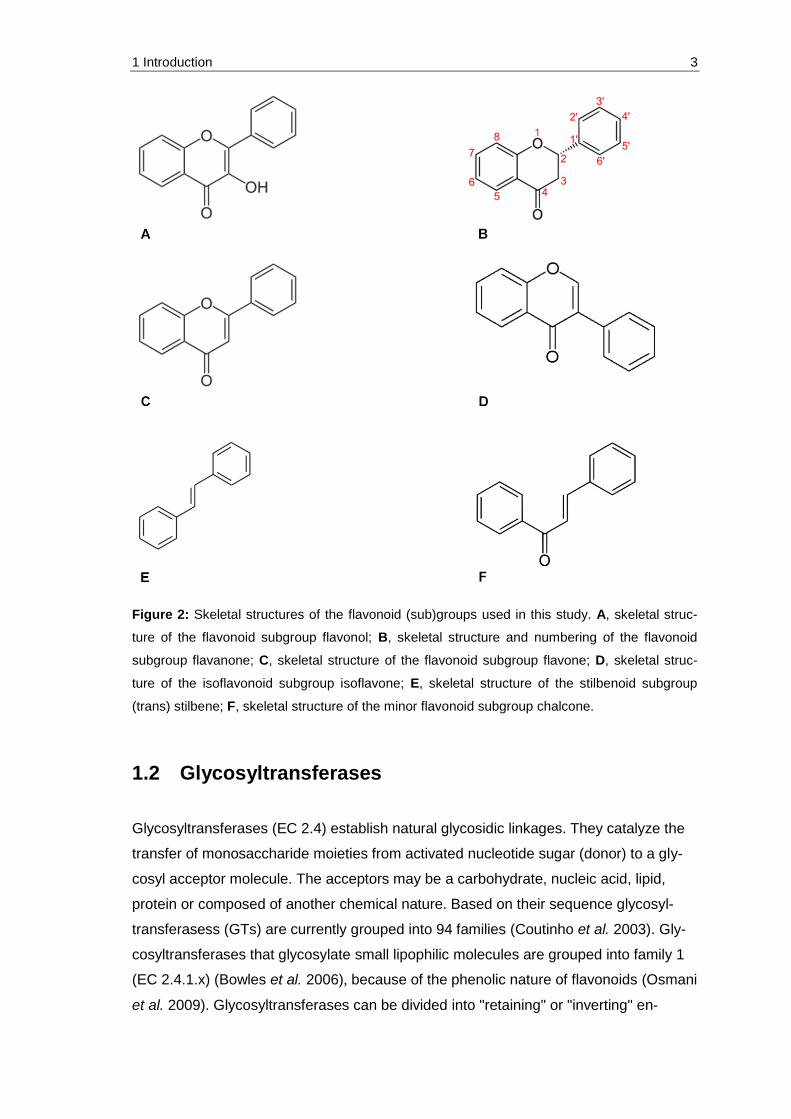
1 Introduction 3
Figure 2: Skeletal structures of the flavonoid (sub)groups used in this study. A, skeletal struc-
ture of the flavonoid subgroup flavonol; B, skeletal structure and numbering of the flavonoid
subgroup flavanone; C, skeletal structure of the flavonoid subgroup flavone; D, skeletal struc-
ture of the isoflavonoid subgroup isoflavone; E, skeletal structure of the stilbenoid subgroup
(trans) stilbene; F, skeletal structure of the minor flavonoid subgroup chalcone.
1.2 Glycosyltransferases
Glycosyltransferases (EC 2.4) establish natural glycosidic linkages. They catalyze the
transfer of monosaccharide moieties from activated nucleotide sugar (donor) to a gly-
cosyl acceptor molecule. The acceptors may be a carbohydrate, nucleic acid, lipid,
protein or composed of another chemical nature. Based on their sequence glycosyl-
transferasess (GTs) are currently grouped into 94 families (Coutinho et al. 2003). Gly-
cosyltransferases that glycosylate small lipophilic molecules are grouped into family 1
(EC 2.4.1.x) (Bowles et al. 2006), because of the phenolic nature of flavonoids (Osmani
et al. 2009). Glycosyltransferases can be divided into "retaining" or "inverting" en-
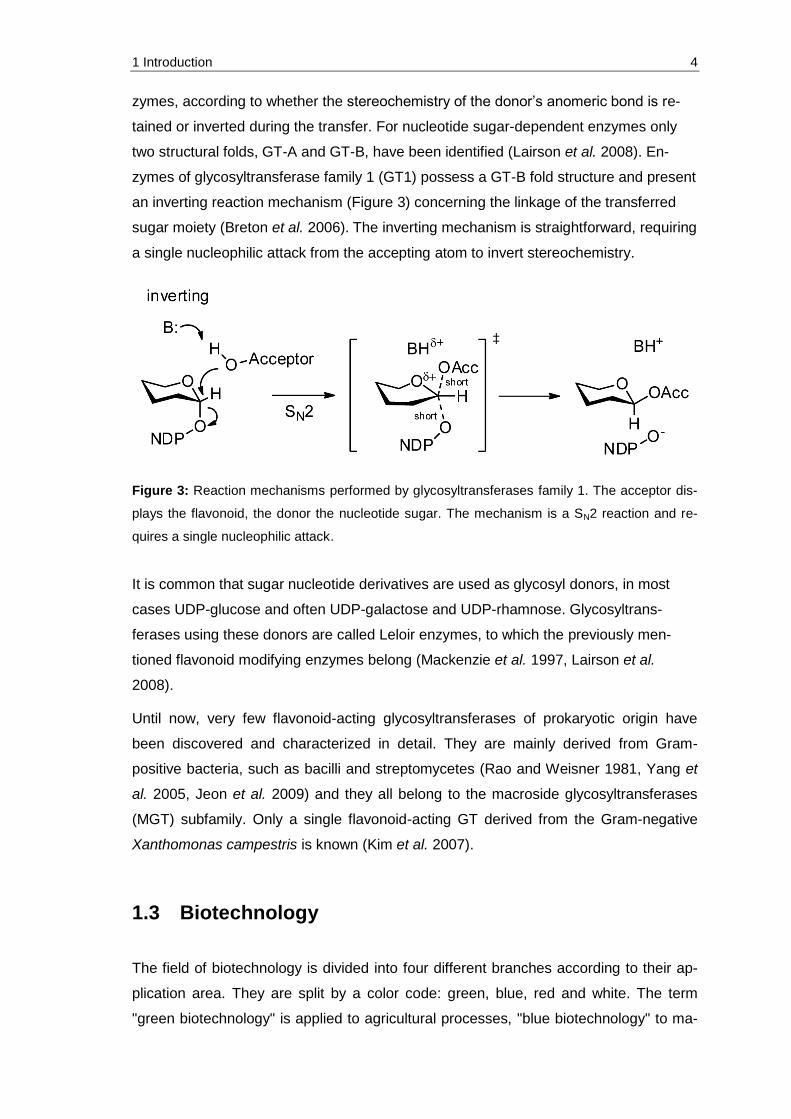
1 Introduction 4
zymes, according to whether the stereochemistry of the donor’s anomeric bond is re-
tained or inverted during the transfer. For nucleotide sugar-dependent enzymes only
two structural folds, GT-A and GT-B, have been identified (Lairson et al. 2008). En-
zymes of glycosyltransferase family 1 (GT1) possess a GT-B fold structure and present
an inverting reaction mechanism (Figure 3) concerning the linkage of the transferred
sugar moiety (Breton et al. 2006). The inverting mechanism is straightforward, requiring
a single nucleophilic attack from the accepting atom to invert stereochemistry.
Figure 3: Reaction mechanisms performed by glycosyltransferases family 1. The acceptor dis-
plays the flavonoid, the donor the nucleotide sugar. The mechanism is a SN2 reaction and re-
quires a single nucleophilic attack.
It is common that sugar nucleotide derivatives are used as glycosyl donors, in most
cases UDP-glucose and often UDP-galactose and UDP-rhamnose. Glycosyltrans-
ferases using these donors are called Leloir enzymes, to which the previously men-
tioned flavonoid modifying enzymes belong (Mackenzie et al. 1997, Lairson et al.
2008).
Until now, very few flavonoid-acting glycosyltransferases of prokaryotic origin have
been discovered and characterized in detail. They are mainly derived from Gram-
positive bacteria, such as bacilli and streptomycetes (Rao and Weisner 1981, Yang et
al. 2005, Jeon et al. 2009) and they all belong to the macroside glycosyltransferases
(MGT) subfamily. Only a single flavonoid-acting GT derived from the Gram-negative
Xanthomonas campestris is known (Kim et al. 2007).
1.3 Biotechnology
The field of biotechnology is divided into four different branches according to their ap-
plication area. They are split by a color code: green, blue, red and white. The term
"green biotechnology" is applied to agricultural processes, "blue biotechnology" to ma-

1 Introduction 5
rine and aquatic applications and "red biotechnology" refers to medical tasks. The
"white" or industrial biotechnology is distinguished by the use of living organisms, or
parts of them, and especially their secondary products for industrial processes
(Frazzetto 2003). These parts can be used in various applications, e.g. for the produc-
tion of pharmaceuticals, cosmetics, textiles and in the nutritional industry (Kirk et al.
2002). Employing biotechnology facilitates the reduction of energy costs and resource
requirements. Its applications are less toxic and contaminative in comparison to the
chemical industry. Biotechnology allows independence from fossil fuels by applying
sustainable chemistry in which renewable resources from plants (such as sugar and
vegetable oils) can be converted into fine and bulk chemicals and biofuels (bioethanol
and biodiesel). In addition, biocatalysts are of increasing importance for the production
of biodegradable plastic materials for example by "metabolic engineering" methods
(Soetaert and Vandamme 2006).
1.3.1 Biotechnological relevance of glycosyltranferases
As mentioned before, flavonoids are part of our daily nutrition and are well known for
some beneficial effects on our health. They have antioxidative, antibacterial and
anticarcinogenic effects (Ververidis et al. 2007). Effects of the glycosylation of flavo-
noids are an influence on water solubility and therefore the bioavailability of the com-
pounds (Graefe et al. 2001, Kren and Martinkova 2001). Because of all these charac-
teristics the demand for flavonoids is increasing in cosmetic, pharma- and nutraceutical
industries (Schutz et al. 2006, Wang et al. 2006, Leonard et al. 2008). The main prob-
lem in meeting this demand is that the flavonoids are produced by plants on a low level
and their extraction requires huge amounts of solvents. Furthermore, their structure is
complex (Manach et al. 2004) and thus not easily synthesized. Chemically, the regio-
specific modification of flavonoids is difficult and thus often fails. Because of these
regio-specific abilities of enzymes, flavonoid modifying enzymes are increasing in sig-
nificance (Das and Rosazza 2006).
1.4 Metagenomics
The expression metagenome describes the collective genome of all microbes in a spe-
cific habitat and metagenomics is the investigation of this genome. This method is
completely culture-independent, as the genomic information of a sample is transferred
to well-cultivable host strains. So the 99 – 99.9 % of microbiota considered non-
cultivable can now be investigated (Amann et al. 1995). This method includes 16S
1 Introduction 6
rRNA gene analysis up to complete sequencing of specific habitats and functional
analyses of the libraries.
For more than a decade metagenome research has shown its merit as a powerful tool
for discovering novel biocatalysts and other valuable biomolecules by using either func-
tion- or sequence-based screening technologies (Streit and Schmitz 2004, Ferrer et al.
2009, Uchiyama and Miyazaki 2009, Iqbal et al. 2012).
16S rRNA analysis is used to elucidate the phylogenetic characterization of the sample
(Warnecke et al. 2004). A complete sequencing of the genomic information contained
in a metagenomic library is useful for obtaining insight into the theoretical enzymatic
potential of a specific habitat.
The metagenomic library can be constructed by using the total isolated microbial DNA
of a specific habitat, which is ligated into a vector (e.g. fosmid) and transferred into a
well-cultivable and suitable host, most often E. coli (Handelsman et al. 1998). By using
sequence-based screenings, homologies can be used to reveal DNA fragments related
to known sequences, which is its major drawback (Daniel 2005), but also its main ad-
vantage because it is independent of secretion, folding and correct expression of het-
erologous proteins in the host strain.
A different codon usage could be a problem for the functional expression of a
metagenomic protein in certain hoststrains (Streit et al. 2004, Warren et al. 2008,
Uchiyama and Miyazaki 2009). In particular the development of next-generation se-
quencing (NGS) technology and improvements in bioinformatic tools have significantly
advanced this methodology (Simon and Daniel 2011).
The advantage of the function-based method is the opportunity to discover completely
novel enzymes and, by contrast with sequence based screenings, only functional en-
zymes are detected. It furthermore allows for a first judgment of the actual enzyme ac-
tivities and physicochemical parameters at the stage of the screening process. Thus,
there is a considerable interest in the use, development and improvement of function-
based metagenome screening technologies (Tuffin et al. 2009).
As already mentioned, the most frequently used host bacterium for metagenomic work
is E. coli and, therefore, several studies have been published that tried to reduce ex-
pression problems by constructing improved vector systems (Leggewie et al. 2006,
Troeschel et al. 2010). Because it is generally assumed that using E. coli only allows
for 40 % of foreign genes to be discovered by function-based searches (Gabor et al.
2004), alternative hosts have been established. Other hosts used for metagenomic
function-based screenings include Pseudomonas putida (Martinez et al. 2004), Strep-
1 Introduction 7
tomyces lividans (Courtois et al. 2003, McMahon et al. 2012), Sinorhizobium meliloti
(Wang et al. 2006, Schallmey et al. 2011), Rhizobium leguminosarum (Li et al. 2005,
Wexler et al. 2005), Desulfovibiro sp. (Rousset et al. 1998) and Streptomyces sp..
While these are all very recent and successful examples of the development of alterna-
tive metagenome hosts, none of these strains allow for the construction of libraries at
the same rate as, and with the ease of, E. coli. Clearly no other host strain is currently
available that would allow for the construction of metagenome libraries with clone num-
bers of 10,000 to 100,000 clones with medium to high copy vectors and inserts ranging
from 3 kb to 45 kb within a few days.
Considering these advantages it is not surprising that the majority of metagenome-
derived enzymes, that have been characterized biochemically, originated from function-
based screenings (Ferrer et al. 2009, Tuffin et al. 2009) in E. coli. This is not least due
to the simple plate-based screening procedures, required for rapid detection (Taupp et
al. 2011), the majority of biocatalysts that have been identified through these ap-
proaches are hydrolytic enzymes such as glycoside hydrolases and esterases (Simon
and Daniel 2009, Steele et al. 2009). For example, several cellulases (Ilmberger et al.
2012), thermostable esterases and lipases (Chow et al. 2012) and an α-L-
rhamnosidase (Rabausch et al., not published) have been detected.
1.5 Transcription
Transcription is the first step of gene expression and is initiated by sigma factors. In
bacteria, promoter recognition is carried out by the initiation factor σ- (sigma), which
binds RNA polymerase (RNAP) core enzyme and starts transcription. The core enzyme
of the RNA polymerase consists of five subunits, two identical α subunits, one β subu-
nit, one β' subunit and one ω subunit. The α, β and β' subunits are essential parts of
the RNA polymerase, the ω subunit helps in its assembly and is not ubiquitous. At the
start of initiation the core enzyme attaches to a sigma factor (σ), which forms the
holoenzyme. The sigma factor enables the binding of the RNAP to the appropriate
promoter downstream of the transcription start site. After the initiation of RNA transcrip-
tion, the sigma factor can leave the complex and only the core enzyme remains bound
to the DNA, or the binding state of the sigma factor changes to a weaker one
(Kapanidis et al. 2005) during elongation.
Sigma factors contain four major regions that are generally conserved. For example
one region exists only in primary sigma factors, such as RpoD and RpoS to ensure that
the sigma factor only binds to the promoter, when it is joined to the RNAP. The σ2 do-
1 Introduction 8
main contacts the β' region and is in position to bind the Pribnow box (−10 element) of
the promoter in the double-stranded DNA state. The domains σ3 and σ4 contact the β
subunit further upstream in the active-center channel, so the σ4 can recognize the −35
region of the promoter, when the DNA is still in the double-stranded state. Some pro-
moters lack a −35 sequence and present a so-called extended −10 sequence, which is
then recognized by the σ3 domain.
Bacteria encode for a single housekeeping σ-factor and a variable number of acces-
sory σ-factors that turn on the transcription of specific sets of genes in response to en-
vironmental stimuli (Wösten 1998). Sigma factors are distinguished by their character-
istic molecular weights. In E. coli seven σ-factors are known, of which rpoD encodes for
the housekeeping σ-factor and belongs to the group of σ70 with a molecular weight of
70 kDa. E. coli rpoD is responsible for the majority of transcriptions of essential genes
during exponential growth, and it recognises a typical -10 and -35 binding motif (Gruber
and Gross 2003). The other sigma factors are specialized and bind the promoters of
genes appropriate to environmental conditions to increase the transcription of required
genes (Osterberg et al. 2011). The different sigma factors compete for their common
(core RNA-Polymerase) substrate.
Experimental data published by transcribing genes derived from Pseudomonas
aeruginosa and Haemophilus influenzae in E. coli further suggest that its σ factors are
capable of recognizing about 50 % of foreign promoters (Warren et al. 2008) with ra-
ther low phylogenetic distances. However, no experimental data exists with respect to
functional metagenome library screenings that use the DNA of non-cultivated microor-
ganisms. It is also unknown to which extent metagenome-derived promoters are turned
on in fosmid vectors.
1.6 Phyla
Phylum is the taxonomic rank below kingdom and above class. Since the introduction
of metagenomics the number of major phyla has been increased to 52 (Rappe and
Giovannoni 2003).
1.6.1 Proteobacteria
Proteobacteria (Stackebrandt et al. 1988) consist of Gram-negative bacteria and repre-
sent the best known bacterial phylum. This group is defined according to rRNA se-
quences and is further divided into six classes. Escherichia coli is part of this group,
1 Introduction 9
belonging to the class of Gammaproteobacteria. The phylum contains a variety of
pathogens such as Salmonella, Vibrio, but also other non-parasitic bacteria. Most
members are anaerobic, facultatively or obligately.
1.6.2 Firmicutes
Firmicutes have a low GC content and are mostly Gram-positive. This phylum is divid-
ed into Clostridia, which are anaerobic; Bacilli, which are obligate or facultative aerobes
and the Mollicutes, which are parasitic bacteria.
1.6.2.1 Clostridium cellulolyticum
Clostridium is a genus of Gram-positive, rod-shaped, endospore building bacteria that
belong to the phylum Firmicutes. It consists of about 100 species, of which
C. cellulolyticum H10 (Petitdemange et al. 1984) is one. This strain was first isolated
from compost containing decayed grass and its genome has been completely se-
quenced. The circular genome has a size of about 4,068,736 bp. They are obligate
anaerobic, as all Clostridia, and they are able to ferment cellulosic plant materials and
produce acetate, ethanol, lactate and H2, which could be used as alternative energy
sources (Giallo et al. 1983).
1.7 Intention of this work
In this study metagenomics were analyzed in two different approaches. First, the re-
cently published META method (Rabausch et al. 2013) was confirmed to be able to
detect novel glycosyltransferases out of a metagenome. Two metagenomic libraries
from different habitats were screened, one of which was constructed during this study.
One positive clone expressing a novel glycosyltransferase was detected, which was
further analyzed for the substrate spectrum (donor and acceptor) and its products.
The second part of this work was based on the low hit rate for the detection of new
enzymes using functional screening methods. It was necessary to reveal the problem
of E. coli in expressing foreign genes in more detail. After detecting that the phyla of
the foreign genes had affected the transcription rate, an E. coli strain carrying a foreign
sigma factor, rpoD of Clostridium cellulolyticum, in its genome, was constructed. The
mutant strain was tested in multiple functional screenings, such as cellulolytic and
esterolytic ones and an improvement in the expression of relevant functional genes
was able to be demonstrated, compared to the parental strain.
2 Material & Methods 10
2 Material & Methods
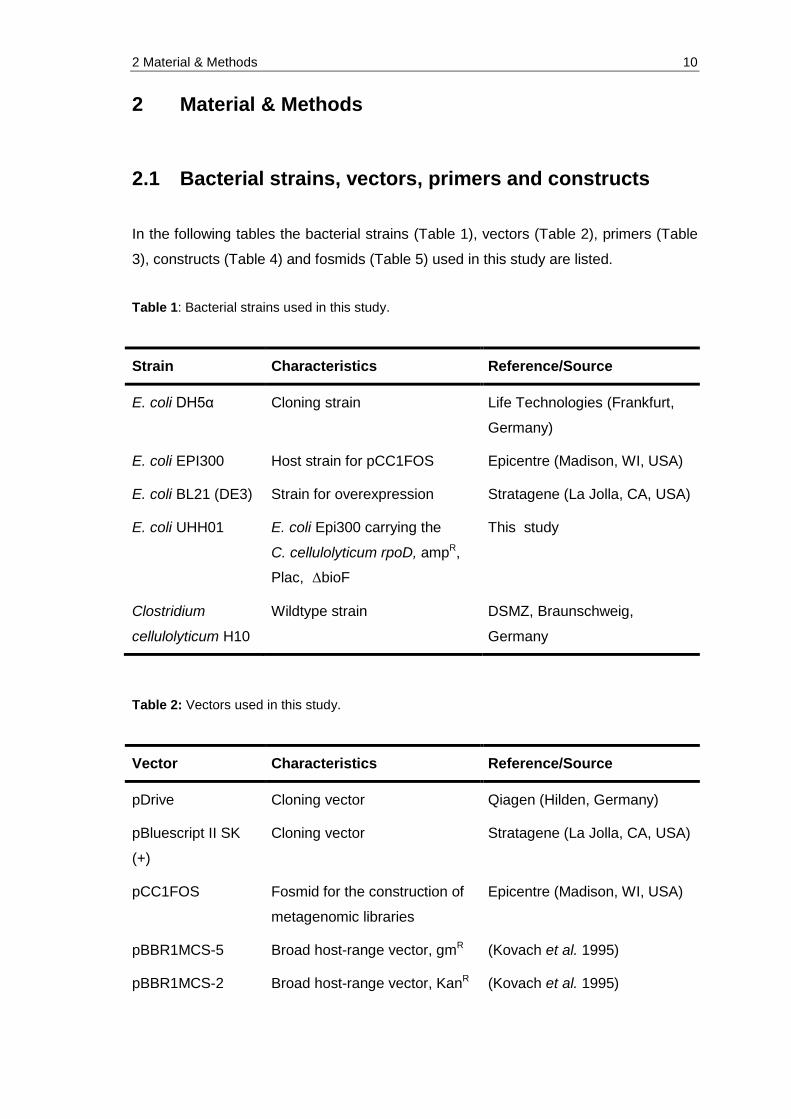
2.1 Bacterial strains, vectors, primers and constructs
In the following tables the bacterial strains (Table 1), vectors (Table 2), primers (Table
3), constructs (Table 4) and fosmids (Table 5) used in this study are listed.
Table 1: Bacterial strains used in this study.
Strain Characteristics Reference/Source
E. coli DH5α Cloning strain Life Technologies (Frankfurt,
Germany)
E. coli EPI300 Host strain for pCC1FOS Epicentre (Madison, WI, USA)
E. coli BL21 (DE3) Strain for overexpression Stratagene (La Jolla, CA, USA)
E. coli UHH01 E. coli Epi300 carrying the
C. cellulolyticum rpoD, ampR,
Plac, ΔbioF
This study
Clostridium
cellulolyticum H10
Wildtype strain DSMZ, Braunschweig,
Germany
Table 2: Vectors used in this study.
Vector Characteristics Reference/Source
pDrive Cloning vector Qiagen (Hilden, Germany)
pBluescript II SK
(+)
Cloning vector Stratagene (La Jolla, CA, USA)
pCC1FOS Fosmid for the construction of
metagenomic libraries
Epicentre (Madison, WI, USA)
pBBR1MCS-5 Broad host-range vector, gmR (Kovach et al. 1995)
pBBR1MCS-2 Broad host-range vector, KanR (Kovach et al. 1995)

2 Material & Methods 11
Vector Characteristics Reference/Source
pRedET (tet) Red/ET expression plasmid,
tetR
GeneBridges (Heidelberg,
Germany)
pMCL210 Low copy vector, 2.5 kb,
lacZalpha, Plac, CmR
(Nakano et al. 1995)
pTZ19R-Cm CmR, 3.1 kb, LacZ (Larbig et al. 2002)
pET19b Vector for the production of
proteins with His-Tag se-
quence
Stratagene (La Jolla, CA, USA)
Table 3: Primers used in this study.
Primer Sequence (5’-3’) Reference/
Source
sig_appA_for TCATGGTGTGCGTGCTCCAACCAAGGCCA
CGCAACTGATGCAGGATGTCAGAATTCTCT
CACTACGC
This study
sig_appA_rev TCAGTTTCACCTCTCCGGGCGGCGTATTTA
ATGACAGCGGCGTTTTATCATTTGCTGGCC
TTTTGCTCAC
This study
sig_bioF_for CGTTATCCGGTGGCGCAAGGAGCCGGACG
CTGGCTGGTGGCGGATGATCGCCAGGCTT
TACACTTTATGC
This study
sig_bioF_rev TTTCCGCCAGTGGCGCACTATCGCCGTCC
ATGCTGAACACGCCTTCTGTCAAGCTTTGG
TCTGACAGTTACCAATG
This study
bioF_control_for GCGGCAGCATTATGAGCTGG This study
bioF_control_rev AACCAGCCATTGTGCTGTTG This study
Amp_EcoRI_for GAATTCAATATGTATCCGCTCATGAG This study
Amp_HindIII_rev AAGCTTTGGTCTGACAGTTACCAATG This study
rpoD_XbaI_for TCTAGAGCTCGAAAGGAGGGGAAATAAGT This study
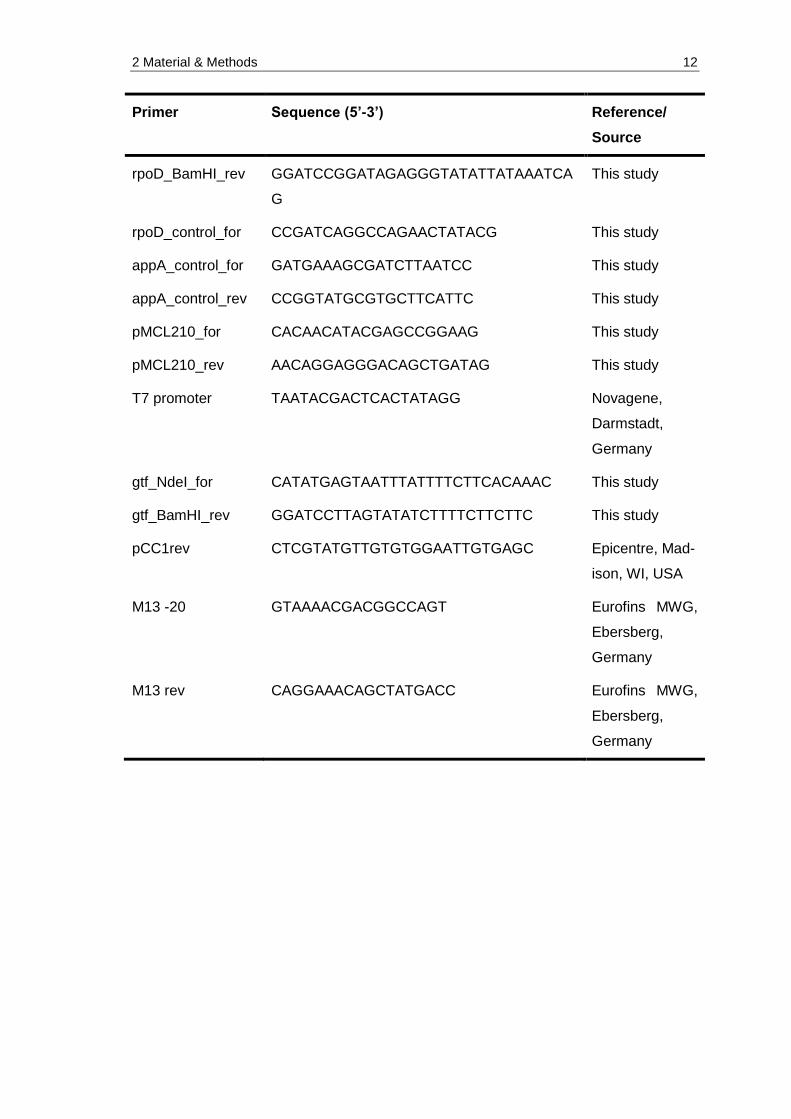
2 Material & Methods 12
Primer Sequence (5’-3’) Reference/
Source
rpoD_BamHI_rev GGATCCGGATAGAGGGTATATTATAAATCA
G
This study
rpoD_control_for CCGATCAGGCCAGAACTATACG This study
appA_control_for GATGAAAGCGATCTTAATCC This study
appA_control_rev CCGGTATGCGTGCTTCATTC This study
pMCL210_for CACAACATACGAGCCGGAAG This study
pMCL210_rev AACAGGAGGGACAGCTGATAG This study
T7 promoter TAATACGACTCACTATAGG Novagene,
Darmstadt,
Germany
gtf_NdeI_for CATATGAGTAATTTATTTTCTTCACAAAC This study
gtf_BamHI_rev GGATCCTTAGTATATCTTTTCTTCTTC This study
pCC1rev CTCGTATGTTGTGTGGAATTGTGAGC Epicentre, Mad-
ison, WI, USA
M13 -20 GTAAAACGACGGCCAGT Eurofins MWG,
Ebersberg,
Germany
M13 rev CAGGAAACAGCTATGACC Eurofins MWG,
Ebersberg,
Germany
2 Material & Methods 13
Table 4: Constructs used in this study.
Construct Characteristics Reference
pUHH01 2.1 kb insert inpBluescript II
SK (+) containing the rpoD
and ampR
This work
pET19gtfC pET19b carrying the gftC
using the restriction sites
NdeI and BamHI
This work
pDgtfC pDrive carrying the gtfC us-
ing the restrictions sites
NdeI and BamHI
This work
pSK144C11 HindIII subclone of a 8.5 kb
part of pFOS144C11 in
pBluescript II SK (+)
(Rabausch et al. 2013)
Table 5: Fosmids used in this study
Fosmid Characteristic Reference
A, pJB28H11 pCC1FOS carrying 31.2 kb
*eDNA
This work
B, pJB17E7 pCC1FOS carrying >26.2
kb *eDNA
This work
C, pJB16A2 pCC1FOS carrying 38.8 kb
*eDNA
(Rabausch et al. 2013)
D, pJB42G5 pCC1FOS carrying 26.7 kb
*eDNA
This work
E, pJB65E1 pCC1FOS carrying 30.1 kb
*eDNA
This work
F, pJB69A5 pCC1FOS carrying 26.4 kb
*eDNA
This work

2 Material & Methods 14
Fosmid Characteristic Reference
G, pJB71G8 pCC1FOS carrying 32.6 kb
*eDNA
This work
H, pJB83B9 pCC1FOS carrying 29.9 kb
*eDNA
This work
I, pJB89E1 pCC1FOS carrying 33.3 kb
*eDNA
This work
J, pJB92C9 pCC1FOS carrying 37.5 kb
*eDNA
This work
K, pJB102C1 pCC1FOS carrying 32.2 kb
*eDNA
This work
L, pJB135F11 pCC1FOS carrying 32.5 kb
*eDNA
This work
M, pJB154B8
pCC1FOS carrying >27.2
kb *eDNA
This work
N, pJB148G3 pCC1FOS carrying 28.8 kb
*eDNA
This work
O, pJB190D12
pCC1FOS carrying 34.4 kb
*eDNA
This work
P, pJB16B1 pCC1FOS carrying 28.5 kb
*eDNA
This work
Q, pJB39A3 pCC1FOS carrying 28.4 kb
*eDNA
This work
R, pJB45G2 pCC1FOS carrying 31.2 kb
*eDNA
This work in cooperation
with Ulrich Rabausch
S, pJB77G10 pCC1FOS carrying 32.5 kb
*eDNA
This work
T, pJB84G2 pCC1FOS carrying 35.6 kb
*eDNA
This work
U, pJB18D1
pCC1FOS carrying >33.4
kb *eDNA
This work

2 Material & Methods 15
Fosmid Characteristic Reference
V, pJB23D10 pCC1FOS carrying 36.2 kb
*eDNA
This work
W, pJB84D8 pCC1FOS carrying 33.8 kb
*eDNA
This work
X, pJB95A1 pCC1FOS carrying 33.6 kb
*eDNA
This work
pFOS144C11 Fosmid from the Elbe river
sediment metagenome
library conferring glycosyl-
transferase activity
(Rabausch et al. 2013)
2.2 Media and supplements
All media were autoclaved at 121 °C for 20 min. Antibiotics and other heat sensitive
supplements (Table 6) were sterile filtered and added to the media after these had
cooled down to about 60 °C.
2 Material & Methods 16
2.2.1 Antibiotics and other supplements
The antibiotics and other supplements that were added to the media are listed in Table
6.
Table 6: Antibiotics and other supplements used in this study.
Supplement Final concentration
in the medium
Concentration in the
stock solution
Solvent
Ampicillin 100 mg/l 100 mg/ml H2O
Chloramphenicol 25 mg/l 25 mg/ml EtOH
Kanamycin 25 mg/l 25 mg/ml H2O
Gentamycin 10 mg/l 10 mg/ml H2O
Tetracycline 3 mg/l 10 mg/ml 70 % (vol/vol)
EtOH
Tributyrin (TBT) 1 % (vol/vol) - -
Starch 0.5 % (w/vol) - -
IPTG 100 mg/l 100 mg/ml H2O
X-Gal 50 mg/l 50 mg/ml DMF
Autoinduction
Solution
0.2 % (vol/vol) - H2O
Glucose 1 % 50 % (w/vol) H2O
L-arabinose 0.4 % 10 % (w/vol) H2O
2.2.2 LB Medium (Sambrook 2001)
Agar (for agar plates) 15 g
Typtone 10 g
NaCl 10 g
Yeast extract 5 g
H2O ad 1 l
2.2.3 CM3 Medium for Clostridium cellulolyticum
Prior to autoclaving the pH was adjusted to 6.0 with hydrochloric acid. After autoclaving
the pH as adjusted to 7.2 using sterile Na2CO3 (5 % w/vol) and the medium was aerat-
2 Material & Methods 17
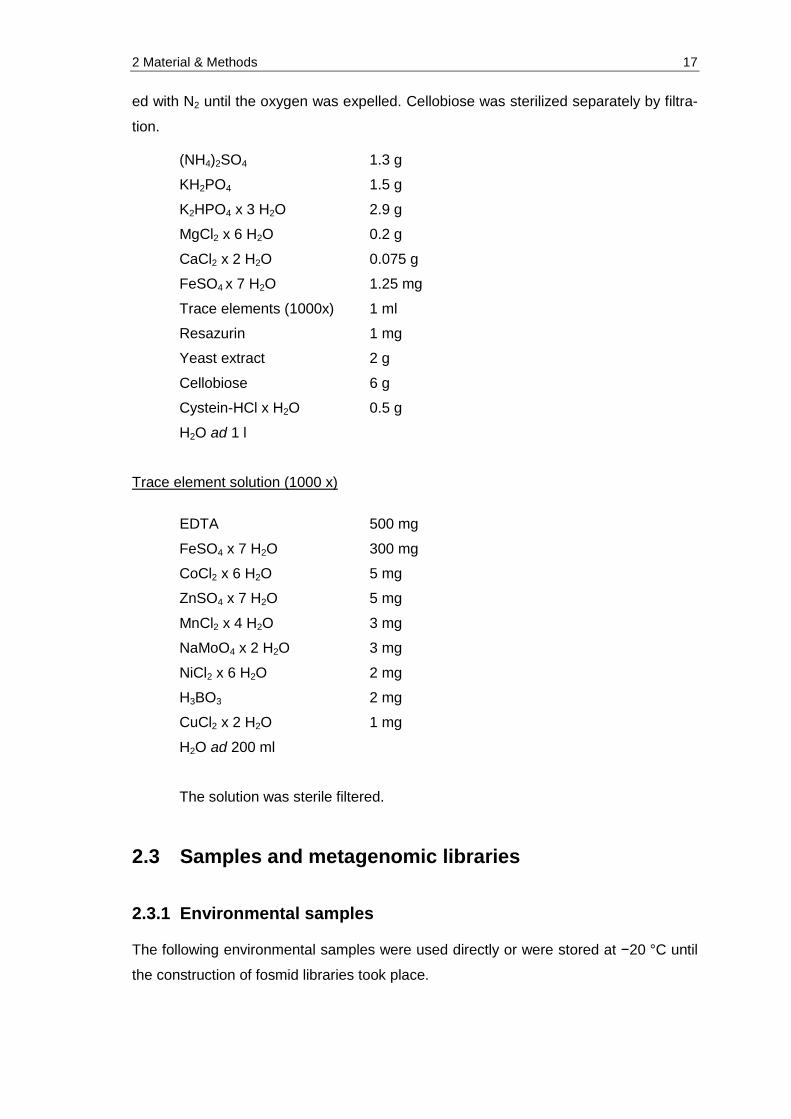
ed with N2 until the oxygen was expelled. Cellobiose was sterilized separately by filtra-
tion.
(NH4)2SO4 1.3 g
KH2PO4 1.5 g
K2HPO4 x 3 H2O 2.9 g
MgCl2 x 6 H2O 0.2 g
CaCl2 x 2 H2O 0.075 g
FeSO4 x 7 H2O 1.25 mg
Trace elements (1000x) 1 ml
Resazurin 1 mg
Yeast extract 2 g
Cellobiose 6 g
Cystein-HCl x H2O 0.5 g
H2O ad 1 l
Trace element solution (1000 x)
EDTA 500 mg
FeSO4 x 7 H2O 300 mg
CoCl2 x 6 H2O 5 mg
ZnSO4 x 7 H2O 5 mg
MnCl2 x 4 H2O 3 mg
NaMoO4 x 2 H2O 3 mg
NiCl2 x 6 H2O 2 mg
H3BO3 2 mg
CuCl2 x 2 H2O 1 mg
H2O ad 200 ml
The solution was sterile filtered.
2.3 Samples and metagenomic libraries
2.3.1 Environmental samples
The following environmental samples were used directly or were stored at −20 °C until
the construction of fosmid libraries took place.
2 Material & Methods 18
2.3.1.1 Elephant feces
The elephant feces for this study were collected in a zoo called Hagenbecks Tierpark
(Hamburg, Germany) from an asian elephant born in 2003 by N. Ilmberger (AG Streit,
Universität Hamburg). The sample was taken when the animal was 6 years old. The
feces was immediately stored in 86 % glycerine at −20 °C.
2.3.1.2 Elbe river sediment
The sediment samples from the Elbe river were collected at the location Teufelsbrück
(Elbe km 626) at a sediment depth until 15 cm and Glückstadt (Elbe km 675) at a sed-
iment depth between 0 and 5 cm and were used directly for the gDNA preparation by I.
Krohn-Molt (AG Streit, Universität Hamburg) and S. Böhnke (AG Perner, Universität
Hamburg), respectively.
2.3.2 Metagenomic libraries
The library from the Elbe river sediment, location Glücksstadt, was constructed by S.
Böhnke (AG Perner, Universität Hamburg) and comprises about 30,000 clones. The
fosmid library with DNA of the elephant feces was done during this study in cooperation
with U. Rabausch (AG Streit, Universität Hamburg) and the libraries with DNA of the
river Elbe sediment, location Teufelsbrück, were constructed during in this study. All
libraries had an insert frequency of 100 %.
2.4 Culture conditions
2.4.1 Cultivation of bacterial strains
E. coli strains were grown, if not mentioned otherwise, aerobically at 37 °C on LB Me-
dium (2.2.2) for 18 hours and, if necessary, with appropriate antibiotics. Liquid cultures
were shaken at 200 rpm on a VKS 75 A control shaker (Edmund Bühler GmbH,
Hechingen, Germany).
Clostridium cellulolyctium was grown anaerobically in serum bottles filled with CM3
Medium (2.2.3) at 37 °C for six days.
2.4.2 Determination of cell density
For the determination of the cell density of liquid cultures, the optical density (OD) was
measured at a wavelength of 600 nm (OD600) with a SmartSpecTMPlus spectrophotom-

2 Material & Methods 19
eter (BIO-RAD, Hercules, CA, USA). Cell numbers can be calculated based on the fact
that an OD600 of 0.1 corresponds to a cell number of 1x10⁸ E. coli cells/ml.
2.4.3 Cell harvesting
Liquid cell cultures were harvested by centrifugation. Up to 5 ml were transferred to E-
cups and sedimented in a tabletop microcentrifuge (minispin Plus, Eppendorf, Ham-
burg, Germany) or a refrigerated centrifuge 5417R (Eppendorf, Hamburg, Germany) at
10,000 X g and 4 °C for 1 min. Larger volumes were harvested either using a Falcon
centrifuge 5804R (up to 45 ml, rotor A-4-44, Eppendorf, Hamburg, Germany) or a
Sorvall RC6+ centrifuge (up to 50 ml: rotor SS-34; up to 400 ml: rotor F10S-6x500y;
Thermo scientific, Braunschweig, Germany) at 4,000 X g and 4 °C for 15 min.
2.4.4 Strain maintenance
For long-term storage of bacterial strains, sterile glycerol (86 % vol/vol) was added to
overnight cultures to a final volume of 33 % (vol/vol). Glycerol stocks were stored at
−70 °C in a screw-cap tube.
For fosmid libraries (2.15) the clones were grown in 96 well plates in 150 µl LB Medium
(2.2.2) overnight and afterwards mixed with 100 µl glycerol (86 % vol/vol), before the
storage at −70 °C.
2.5 Microscopy
2.5.1 Standard microscopy
For the standard applications, such as gram tests and unstained microscopy, the
Olympus BX41 (Olympus, Hamburg, Germany) was used.
2.6 DNA purification
2.6.1 Isolation of genomic DNA
For the isolation of (meta-) genomic DNA different Kits and techniques were used.
2 Material & Methods 20
2.6.1.1 Isolation of genomic DNA from elephant feces
For the isolation of DNA from elephant feces the QIAamp DNA Mini Stool Kit (Qiagen,
Hilden, Germany) was used, following the protocol.
2.6.1.2 Isolation of genomic DNA from the Elbe river sediment
For a high yield gDNA isolation from the Elbe river sediment a modified version of the
Yeates et. al method was required (developed and performed by I. Krohn-Molt). 50 g of
the sample were shaken overnight in 100 ml extraction buffer (100 mM Tris-HCl
[pH 8.0], 100 mM Na-EDTA [pH 8.0], 1.5 M NaCl, 0.1 % TWEEN 80) at 200 rpm on a
VKS 75 A control shaker (Edmund Bühler GmbH, Hechingen, Germany). The addition
of TWEEN 80 reduced the surface tension, so the bacteria were released from the sed-
iment more easily. Afterwards, 50 mg lysozyme were added. The sample was incubat-
ed for 1 h while shaking at 37 °C and 5 mg Proteinase K were added and the sample
was again incubated for 1 hat 37 °C and 200 rpm. Afterwards SDS (10 ml, 20 %
(vol/vol)) was added and incubated for 90 min at 65 °C. The sample was transferred in
a 250 ml centrifuge vessel and centrifuged at 6,000 X g for 10 min at RT (Sorvall RC6+
centrifuge, rotor F14S-6x250y, Thermo scientific, Braunschweig, Germany). The pellet
was resolved in 100 ml extraction buffer, incubated for 10 min at 65 °C and centrifuged
again. The supernatants were collected in a 500 ml centrifuge vessel and mixed with
1 vol. PEG (Polyethyleneglycol 6000 [30 %])/NaCl (1.6 M). After 2 h incubation at RT
the sample was centrifuged at 10,000 X g for 20 min (Sorvall RC6+ centrifuge, rotor
F10S-6x500y, Thermo scientific, Braunschweig, Germany). The pellet was resuspend-
ed in 20 ml TE (10 mM Tris-HCl, 1 mM Na-EDTA, pH 8.0).To separate DNA from poly-
saccharides and proteins, the sample was transferred to a sterile 50 ml centrifuge ves-
sel and mixed with 7.5 M KAc, to a final concentration of 0.75 M. After incubation for
5 min on ice, the polysaccharides and proteins were isolated via centrifugation at
16,000 X g, 4 °C and 30 min (Sorvall RC6+ centrifuge, rotor SS-34, Thermo scientific,
Braunschweig, Germany). The extraction of DNA was done by a phe-
nol/chloroform/isoamyl alcohol precipitation. The hydrous phase was mixed with 1 vol.
chloroform/isoamyl alcohol (24:1), inverted and centrifuged at 13,600 X g for 15 min
(minispin Plus, Eppendorf, Hamburg, Germany). As an additional cleaning step the
hydrous phase was mixed with 1 vol. phenol/chloroform/isoamyl alcohol (25:24:1), in-
verted and again centrifuged at 13,600 X g for 15 min. The hydrous phase was, with
avoidance of the inter phase, transferred in a new reaction tube and after addition of
0.7 M 2-propanol, already mixed with 1/10 vol. 3 M NaAc, precipitated over night
at−20 °C. The next day the sample was centrifuged at 16,000 X g at 4 °C for 90 min.
The supernatant was discarded and the DNA pellet was washed twice with 1 ml ice
2 Material & Methods 21
cold EtOH (70 % vol/vol), respectively. Afterwards the pellet was dried and then re-
solved in 1 ml TE, over night at 4 °C.
2.6.1.3 Isolation of genomic DNA, standard method
For the standard isolation of gDNA the peqGOLD Bacterial DNA Kit (PEQLAB
Biotechnologie GmbH, Erlangen, Germany) was used following the manufacturer's
instructions.
2.6.2 Plasmid isolation “Quick and Dirty”
The “Quick and Dirty Prep” was used to isolate plasmid and fosmid DNA. All centrifuga-
tion steps were performed at 13,000 X g and RT (minispin Plus, Eppendorf, Hamburg,
Germany) if not mentioned otherwise.
An overnight culture of 1.5 ml was centrifuged for 30 sec (minispin Plus, Eppendorf,
Hamburg, Germany) and the sedimented cells were suspended in 100 µl buffer P1
before 200 µl buffer P2 were added. The tube was inverted several times and incubat-
ed at RT for 1 to 5 min until the clearance of the sample. Then 200 µl chloroform were
added and the sample was mixed well. After the addition of 150 µl buffer P3, the tube
was inverted carefully and centrifuged for 5 min. The upper phase was transferred into
a new tube and the same volume 2-propanol was added. After inverting, the sample
was incubated at −20 °C for 30 min. Then the sample was centrifuged at 4 °C for
20 min (centrifuge 5417R, Eppendorf, Hamburg, Germany). The supernatant was re-
moved and the pellet washed twice with 300 µl ethanol (70 % vol/vol), followed by a
centrifugation at 4 °C for 2 min (centrifuge 5417R, Eppendorf, Hamburg, Germany).
Finally, the pellet was dried at RT and suspended in 50 to 100 µl sterile H2Obidest DNA
quantity and integrity were determined with spectrophotometry (2.6.6) and agarose gel
electrophoresis (2.8.1).
P1 buffer
EDTA 10 mM
Tris-HCl 50 mM
RNase 1 mg/ml
The pH was adjusted to 8.0 and the solution was sterile filtered and stored at 4 °C.
RNase was added to the autoclaved buffer after it was incubated for 15 min at 95 °C.
2 Material & Methods 22
P2 buffer
NaOH 200 mM
SDS 1 % (w/vol)
The solution was sterile filtered.
P3 buffer
KAc 3 M
The pH was adjusted to 5.5 with acetic acid and the solution was sterile filtered.
2.6.3 Plasmid isolation with a plasmid mini kit
In order to obtain pure plasmid and fosmid DNA that can be used for sequencing, a
“HighSpeed Plasmid mini kit” was used according to the manufacturer's instructions
(Avegene life science, Taipei, Taiwan, China). DNA was isolated from 2-5 ml of an
overnight culture and the DNA was eluted with 20 to 50 µl of H2Obidest, warmed up to
70 °C.
2.6.4 Gel extraction of DNA
To purify single DNA bands from agarose gels (2.8.1), the QIAquick® Gel Extraction Kit
I (Qiagen, Hilden, Germany) was used, following manufacturer's protocol. Prior the
target DNA fragment was excised from the agarose gel (2.8.1) with a scalpel and trans-
ferred into a sterile reaction tube. Obtained DNA was checked for integrity and concen-
tration by agarose gel electrophoresis (2.8.1) and spectrophotometry (2.6.6).
2.6.5 Purification and concentration of DNA
When purification of DNA was required, the “Gel/PCR DNA Fragments Extraction kit”
(Avegene life science, Taipei, Taiwan, China) was used and the protocol for PCR
cleanup was followed according to the manual. DNA was eluted with 20 to 40 µl of
H2Obidest. The concentration of small volumes of DNA solutions was carried out in a
vacuum concentrator (Concentrator 5301, Eppendorf, Hamburg, Germany) at 45 °C for
up to 5 min.
2 Material & Methods 23
2.6.6 Spectrophotometrical determination of DNA concentration and
purity
To determine the quantity and purity of dissolved DNA, a SmartSpec™ Plus spectro-
photometer (Bio-Rad, Hercules, CA, USA) was used. The extinction was measured at
260 nm in UV cuvettes (Brand, Wertheim, Germany) against a H2Obidest blind. The DNA
content can be calculated as an extinction of 1.0 corresponds to a concentration of
50 µg/ml double-stranded DNA. The purity of DNA is indicated by the ratio of the ex-
tinctions at 260 nm and 280 nm. Pure DNA has a ratio260/280 of 1.8 to 2.0 (Sambrook
2001).
2.7 RNA purification
2.7.1 Isolation of total RNA
To isolate the total RNA of a sample the UltraClean Microbial RNA Isolation Kit (MO
BIO Laboratories, Carlsbad, CA, USA) was used, following the instructions. For the
isolation overnight cultures (18 h) of E. coli, carrying fosmids, were used. The cultures
were grown in LB Medium (2.2.2) with 12.5 µg/ml chloramphenicol and autoinduction
solution (Table 6).RNA quantity and integrity were determined with spectrophotometry
(2.7.3) and agarose gel electrophoresis (2.8.2).
2.7.2 Purification and concentration of RNA
Before the concentration of RNA it is necessary to remove the remaining DNA. For this
removal the RTS DNase™ Kit (MO BIO Laboratories, Carlsbad, CA, USA) was used,
following the manufacturer’s instruction. Afterwards the purified RNA was concentrated
using the RNA Clean & Concentrator™ Kit, following the protocol. Every clone was
eluted with 6 µl RNase free H2O.
2.7.3 Spectrophotometrical determination of RNA concentration and
purity
To determine the quantity and purity of dissolved RNA, a Synergy HT (Biotek, Winoo-
ski, VT, USA) was used. The extinction was measured at 260 nm in a Take3 plate
(Biotek, Winooski, VT, USA) against a H2Obidest blind. The RNA content can be calcu-
lated as an extinction of 1.0 corresponds to a concentration of 40 µg/ml RNA. The puri-

2 Material & Methods 24
ty of RNA is indicated by the ratio of the extinctions at 260 nm and 280 nm. Pure RNA
has a ratio 260/280 of 2.0.
2.8 Agarose gel electrophoresis
2.8.1 Agarose gel electrophoresis for DNA
The size, quantity and integrity of DNA were analyzed with agarose gel electrophore-
sis. Agarose gels (0.8 % (w/vol) in TAE buffer) were applied in an electrophoresis gel
chamber (Hoefer™ HE-33 mini horizontal submarine unit, Amersham Biosciences,
Piscataway, NJ, USA) filled with TAE buffer. Samples were supplied with 1/10 vol.
loading dye before loading onto the gel. DNA fragments were separated at 120 V for
25 min with a power supply EPS 301 (Amersham Biosciences, Piscataway, NJ, USA).
Agarose gels were stained in an ethidium bromide solution (10 g/ml) for 15 min and
washed briefly in a water bath to remove surplus ethidium bromide. Visualization and
documentation were carried out in a Universal Hood II (BIO-RAD, Milan, Italy) support-
ed by Quantity I 1-D-Analysis software (BIO-RAD, Philadelphia, PA, USA). The deter-
mination of the size of DNA fragments was performed by the comparison with the
standard GeneRuler™ 1 kb DNA Ladder (Thermo scientific, Braunschweig, Germany)
that was also applied on the agarose gel.
TAE buffer (50x)
Tris 2 M
EDTA 100 mM
The pH was adjusted to 8.2 with acetic acid.
Loading dye
Glycerol 60 ml
EDTA 50 mM
Bromphenol blue 0.5 g
Xylencyanol 0.5 g
H2O ad 200 ml
2.8.2 Agarose gel electrophoresis for RNA
The gel electrophoresis specialized for RNAs is used to check the integrity of the RNA,
by comparison of the 16S rRNA and 23S rRNA band, the 23S rRNA should be twice as
bright as the 16S rRNA band. The rest of the RNA should appear as a smear between
2 Material & Methods 25
those two distinct bands. The prepared agarose gel was applied in an electrophoresis
gel chamber (Hoefer™ HE-33 mini horizontal submarine unit, Amersham Biosciences,
Piscataway, NJ, USA) filled with the FA gel running buffer. Samples were supplied with
1/10 vol/vol 2X RNA Loading Dye (Thermo scientific, Braunschweig, Germany) and
heated up to 70 °C for 10 min. RNA fragments were separated at 120 V for 60 to
70 min with a power supply EPS 301 (Amersham Biosciences, Piscataway, NJ, USA).
Agarose gels were stained in an ethidium bromide solution (10 g/ml) for 15 min and
washed briefly in a water bath to remove surplus ethidium bromide. Visualization and
documentation were carried out in a Universal Hood II (BIO-RAD, Milan, Italy) support-
ed by Quantity I 1-D-Analysis software (BIO-RAD, Philadelphia, PA, USA). The deter-
mination of the size of DNA fragments was performed by the comparison with the
standard RiboRuler High Range RNA Ladder (Thermo scientific, Braunschweig, Ger-
many) that was also applied on the agarose gel.
FA gel buffer (10x)
MOPS 200 mM
NaAc 50 mM
EDTA 10 mM
The pH was adjusted to 7.0, using NaOH.
Formaldehyde gel solution
Agarose 1.2 g
FA gel buffer (10x) 10 ml
Formaldehyde 1.2 ml
H2O (RNase free) ad 100 ml
FA gel running buffer
FA gel buffer (10x) 100 ml
Formaldehyde (37 % vol/vol) 20 ml
H2O (RNase free) 880 ml
2.9 Polymerase chain reaction (PCR)
Specific DNA fragments were amplified with PCR. PCR products were analysed using
agarose gel electrophoresis (2.8.1).
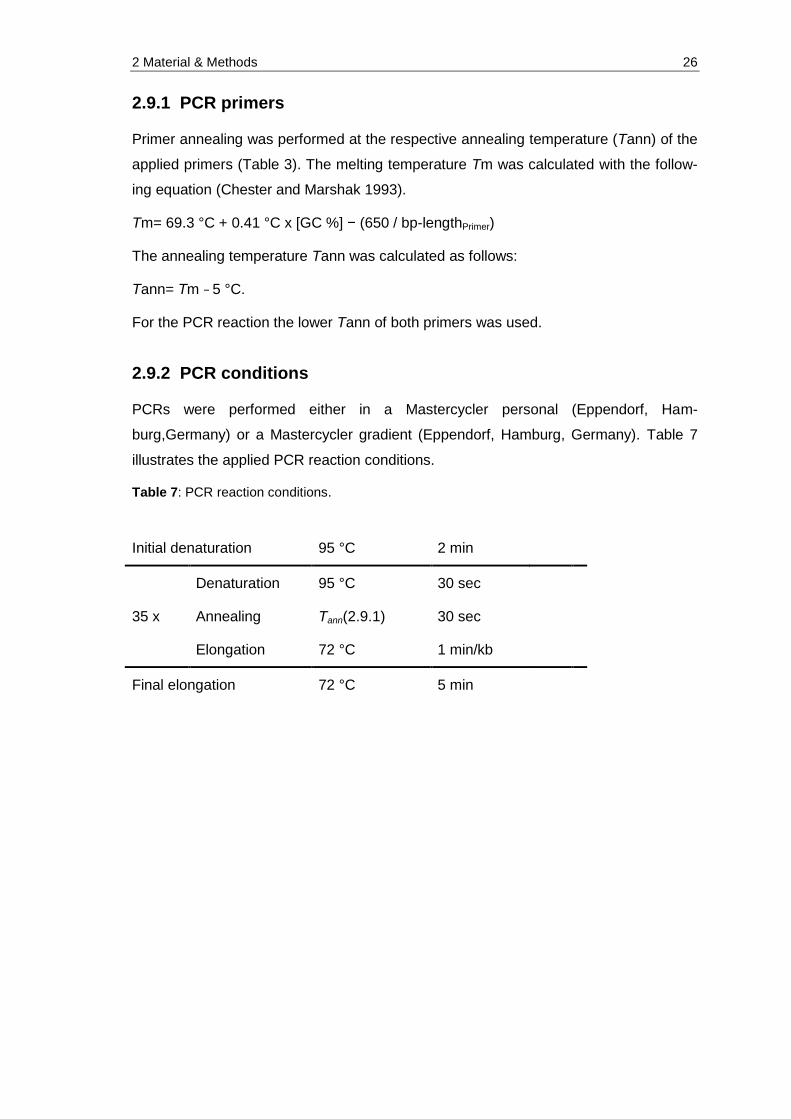
2 Material & Methods 26
2.9.1 PCR primers
Primer annealing was performed at the respective annealing temperature (Tann) of the
applied primers (Table 3). The melting temperature Tm was calculated with the follow-
ing equation (Chester and Marshak 1993).
Tm= 69.3 °C + 0.41 °C x [GC %] − (650 / bp-lengthPrimer)
The annealing temperature Tann was calculated as follows:
Tann= Tm − 5 °C.
For the PCR reaction the lower Tann of both primers was used.
2.9.2 PCR conditions
PCRs were performed either in a Mastercycler personal (Eppendorf, Ham-
burg,Germany) or a Mastercycler gradient (Eppendorf, Hamburg, Germany). Table 7
illustrates the applied PCR reaction conditions.
Table 7: PCR reaction conditions.
Initial denaturation 95 °C 2 min
35 x
Denaturation 95 °C 30 sec
Annealing Tann(2.9.1) 30 sec
Elongation 72 °C 1 min/kb
Final elongation 72 °C 5 min
2 Material & Methods 27
2.9.3 PCR volumes
The standard PCR reaction contained the following ingredients.
Template 1 µl
Taq polymerase buffer (10x) 2.5 µl
dNTPs (2 mM) 2 µl
Forward Primer (10 µM) 1 µl
Reverse Primer (10 µM) 1 µl
Taq polymerase 0.5 µL
H2O ad 25 µl
Taq polymerase buffer (10x)
Tris 100 mM
MgCl2 25 mM
KCl 500 mM
The pH was adjusted to 8.3 and the solution was sterile filtered.
2.9.4 Direct colony PCR
Direct colony PCR was applied to verify putative positive clones after ligation (2.10.3)
and transformation (2.11). Therefore specific vector primers (Table 3) were used. The
respective colonies were suspended individually in 20 µl water; 1 µl of this suspension
was added to the PCR reaction as template. The standard reaction conditions (2.9.2)
and volumes (2.9.3) were used.
2.10 Enzymatic modifications of DNA
2.10.1 Site specific digestion of DNA
For the site specific digestion of DNA restriction endonucleases were applied. The fol-
lowing reaction mixtures were prepared A) for analytical and B) for preparative diges-
tions.
2 Material & Methods 28
A) Analytical digestion
DNA solution 1- 2 μl
Reaction buffer (10x) 1 μl
Restriction enzyme 0.5 μl
H2O ad 10 μl
B) Preparative digestion
DNA solution 5-10 μl
Reaction buffer (10x) 5 μl
Restriction enzyme 2 μl
H2O ad 50 μl
Analytical digestions were incubated for 1.5 h and preparative digestions for 3 h to
overnight at the respective optimal temperature that was provided by the enzymes’
deliverer, Thermo Scientific (Braunschweig, Germany). The digestions were analyzed
by agarose gel electrophoresis (2.8.1). Vector preparations were dephosphorylated
(2.10.2) after digestion.
2.10.2 Dephosphorylation of complementary ends
In order to avoid re- or self-ligation, the 5´-end phosphate groups of digested DNA were
cleaved enzymatically with Antarctic phosphatase (New England Biolabs, Frankfurt am
Main, Germany).
Preparative digestion 95 μl
Antarctic phosphatase buffer (10x) 11 μl
Antarctic phosphatase 4 μl
After 20 min of incubation at 37 °C, the enzyme was inactivated at 60 °C for 5 min. Fi-
nally, the DNA was purified (2.6.5).
2.10.3 Ligation of DNA
2.10.3.1 Ligation of PCR products
Genes or other DNA fragments that were amplified by PCR were ligated into pDrive
cloning vector (Table 2, “PCR cloning kit”, QIAGEN, Hilden, Germany) according to the
manufacturer's instructions after being purified (2.7.2). The pDrive vector is provided in
2 Material & Methods 29
linearized form with U-overhangs on each side. The A-overlaps of the PCR-product
that are produced by the Taq polymerase ligate with the vector ends.
Purified insert 2 μl
pDrive 0.5 μl
Ligation master mix 2.5 μl
The ligation was incubated for at least 2 h at 16 °C. Subsequently, the plasmids were
transferred in competent E. coli DH5α cells by heat shock (2.11.1.1).
2.10.3.2 Ligation of fragment with digested ends
The ligation of ends generated by restriction enzymes (2.10.1) was carried out in the
following reaction mixture.
Insert 0.2 µg
Vector molar ratio insert:vector 2:1 to 10:1
Ligation buffer (10x) 2 μl
T4 DNA ligase (Thermo Scientific) 0.5 µl
H2O ad 20 µl
The reaction was incubated for 2 to 16 h at 22 °C and E. coli (2.11.1.2) was then trans-
formed (2.11.1.1) with the ligation.
2.11 Transformation
2.11.1 Heat shock transformation
2.11.1.1 Heat shock transformation of E. coli
Competent E. coli DH5α, BL21 (DE3) and Epi300 (including the modified versions)
cells (2.11.1.2) were transformed by heat shock with recombinant plasmids or fosmids.
One aliquot of competent cells in an E-cup was thawed on ice for 5 min. After adding
5 μl of ligation reaction mixture (ca. 0.1 μg of DNA) and gentle stirring with a pipette,
the cells were incubated on ice for 20 min. The heat shock was carried out by incubat-
ing the cells at 42 °C for 90 sec. The cells were put on ice immediately and incubated
there for another 5 min. 800 μl of liquid LB medium were added to the cells before they
were incubated at 37 °C for 30 to 45 min. Finally, the transformed cells were plated out
on LB agar plates containing selective antibiotics (Table 6). The plates were incubated
overnight at 37 °C.
2 Material & Methods 30
2.11.1.2 Preparation of chemically competent E. coli cells
An overnight culture of the desired E. coli strain (2.5 ml) was used to inoculate 250 ml
of preheated liquid LB Medium (2.2.2) (37 °C) in a 1 l Erlenmeyer flask. The culture
was incubated at 37 °C on a VKS 75 A control shaker (Edmund Bühler GmbH,
Hechingen, Germany) at 200 rpm for 90 to 120 min until an OD600 of 0.5 was reached.
The culture was cooled on ice for 5 min and then the cells were sedimented by centrif-
ugation (4,000 X g, 4 °C, 5 min, Sorvall RC6+ centrifuge, rotor F10S-6x500y, Thermo
scientific, Braunschweig, Germany). The supernatant was removed while the cell pellet
was kept on ice. The cells were resuspended in 75 ml of cool buffer TFB1. The sus-
pension was divided into two 50 ml Falcon tubes and incubated on ice for 90 min.
Then, the cells were sedimented again by centrifugation (4,500 X g, 4 °C, 5 min,
centriuge 5804R, Eppendorf, Hamburg, Germany), the supernatant was discarded and
the cell pellet resuspended in 5 ml of cold buffer TFB2. The cell suspension was divid-
ed into aliquots of 100 µl in cooled E-cups, frozen in liquid nitrogen and stored immedi-
ately at −70 °C.
Buffer TFB1
RbCl 100 mM
MnCl2 50 mM
KAc 30 mM
CaCl2 10 mM
Glycerol 15 %
H2Obidest ad 100 ml
The pH was adjusted to 5.8 with acetic acid and the solution was sterilized by filtration.
Buffer TFB2
MOPS 10 mM
RbCl 10 mM
CaCl2 75 mM
Glycerol 15 %
H2Obidest ad 20 ml
The pH was adjusted to 6.8 with KOHaq and the solution was sterilized by filtration
2.11.1.3 Blue-white-screening
The strain E. coli DH5α has a deletion in its lacZ gene so that it cannot produce an ac-
tive β-galactosidase, only the C-terminal ω-subunit. Vectors like pDrive and pBluescript
SK II (+) (Table 2) encode the N-terminal α-subunit of the β-galactosidase which has
2 Material & Methods 31
an additional MCS within. Together with both subunits, the β-galactosidase is being
complemented to its functional form. Transformations of E. coli with recombinant
pDrive and pBluescript SK II (+) were plated out on agar plates containing the inductor
IPTG and the glucose-analog X-Gal as well as appropriate antibiotics (Table 6). Colo-
nies of clones with active β-galactosidase can be screened, as the β-galactosidase
cleaves the X-Gal molecule and by oxidation with aerial oxygen, a blue color develops.
By the insertion of a DNA fragment into the MCS of the α-subunit-coding gene of the
vector, no active β-galactosidase can be produced and so, the colonies of clones with
an insert appear white.
2.12 Genome mutation
To create the insertion mutation in the genome of E. coli Epi300 (Table 1) the Quick &
Easy E. coli Gene Deletion Kit (Gene Bridges, Heidelberg, Germany) was used, follow-
ing the manufacturer's protocol. Therefore a customized insert cassette was designed.
Using PCR (2.9), purification (2.6.5) and ligation (2.10.3.2) the selected genes were
subsequently cloned (2.10.3.1, 2.11.1.1) into pBluescript SK II (+) (Table 2). The inser-
tion primers (Table 3) were designed due to the E. coli gene in which the insertion
should take place. The pRedET(tet) vector (Table 2) was used. The insertion remained
in the genome.
2.13 Sequencing of DNA
2.13.1 ABI sequencing
Sequencing was carried out in the group of Prof. S. Schreiber at the “Institut für
klinische Molekularbiologie” (IKMB, Christian Albrechts University, Kiel, Germany).
Samples were purified (2.6.5) and adjusted to a DNA concentration of 100 ng/μl (plas-
mids) or 120 ng/μl (fosmids) in H2Obidest. Then, 3 μl of DNA were mixed with 1 μl of pri-
mer (Table 3) (4.8 μM). According to the manufacturer's instructions, a reaction mixture
was added. An ABI 3730XL DNA analyzer (Ap-plied Biosytems/Life technologies,
Darmstadt, Germany) was used based on the Sanger technique (Sanger et al. 1977).
2.13.2 454 sequencing
Sequencing of entire fosmids was accomplished by M. Schilhabel in the group of Prof.
S. Schreiber at the IKMB with a 454 FLX sequencer system (Roche 454, Branford,
2 Material & Methods 32
USA). The pyrosequencing technique is based on de novo sequencing by a whole
shotgun approach (Ronaghi et al. 1998). Isolated DNA (2.6.3) with a minimum concen-
tration of 200 ng/μl and an optical purity of E260/280 of 1.6-2.0 in H2Obidest was required.
Fosmids were pooled in equimolar amounts and afterwards sequenced with the Roche
FLX.
2.14 Transcriptomic analysis
2.14.1 Next generation sequencing (Illumina)
Further processing and sequencing of the transcriptome was carried out at the GATC
Biotech AG (Konstanz, Germany). For the rRNA depletion, the mRNA only procaryotic
mRNA Isolation Kit (Epicentre, Madison, WI, USA) was used, for each of the pools to
prevent differing depletion rates per clone. The sequencing was done with the Illumina
HiSeq2000 technology (using the 100 bp single read) and software. Isolated total RNA
(2.7) with a minimum amount of 1.5 µg and a purity of E260/280 of 1.8-2.2 in H2O (RNase
free) was required for every clone in the sent pool. For the analysis an artificial refer-
ence genome, constructed from all sent sequences was used and the RNA Seq reads
were aligned to it using Bowtie 2.1.0. Using the Cufflinks-Package 2.1.1 the differential
expression levels were determined.
2.15 Construction of fosmid libraries
Fosmid libraries were constructed with the CopyControl™ Fosmid LibraryProduction Kit
from Epicentre (Madison, WI, USA) according to the instruction manual.
2.15.1 End-Repair
After the isolation (2.6.1) and analysis of the metagenomic DNA for its purity, integrity
and quantity (2.6.6,2.6.5), its ends were adjusted to blunt ends. Therfore the following
reaction was performed:

2 Material & Methods 33
End-Repair buffer (10x) 4 µl
dNTPs (2.5 mM) 4 µl
ATP (10 mM) 4 µl
DNA up to 10 µg
End-Repair Enzyme Mix 2 µl
H2O ad 40 µl
The reaction mixture was incubated for 45 min at room temperature and then inactivat-
ed for 10 min at 70 °C.
2.15.2 Ligation
The end-repaired DNA (2.15.1) and the vector pCC1FOS (Table 4) were ligated at a
molar ratio of 1:10. The following reaction was incubated for 2 h at room temperature
before it was inactivated at 70 °C for 10 min.
Fast-Link Ligation buffer (10x) 0.5 µl
ATP (10 mM) 0.5 µl
pCC1FOS (0.5 μg/μL) 0.5 µl
Insert DNA 0.1-3 µl*
Fast-Link ligase 0.5 µl
H2O ad 5 µl
* E.g. 0.5 μl (0.25 μg) vector would be ligated with 0.125 μg DNA with a size of approx-
imately 40 kb.
2.15.3 Packaging of fosmid clones
To package the ligation (2.15.2) in phage particles, one tube of MaxPlax Lambda
Packaging Extracts was thawed and one half added to the ligation, the remaining
packaging extract was again stored at −70 °C. The reaction was then incubated for
90 min at 30 °C before the other half of the packaging extract was added to the reac-
tion that was then again incubated at 30 °C for 90 min. Dilution buffer was added to a
final volume of 1 ml. Then 25 µl chloroform were added and the reaction was mixed
briefly and stored at 4 °C.

2 Material & Methods 34
Dilution buffer
Tris 10 mM
NaCl 100 mM
MgCl2 10 mM
The pH was adjusted to 8.3.
2.15.4 Preparation of phage competent cells
To prepare phage competent cells, 50 ml LB (2.2.2; + 10 mM MgSO4) were inoculated
with an overnight culture of EPI300 (Table 1) cells and incubated at 37 °C until an
OD600 of 0.8-1.0 was reached. The cells were stored at 4 °C until further use.
2.15.5 Transduction
For the transduction, 10 µl packaged fosmids (2.15.3) were added to 100 µl competent
cells (2.15.4) and incubated for 20 min at 37 °C. The infected cells were spread on LB
plates (2.2.2) containing IPTG, X-Gal and 12.5 µg/ml chloramphenicol (Table 6).
Several individual clones were analyzed for insert frequency and size by induction
(2.15.6), fosmid preparation (2.6.3), restriction analysis (2.10.1) and agarose gel elec-
trophoresis (2.8.1).
2.15.6 Induction
For the analysis of fosmid clones, their induction from a single copy vector to a high
copy vector is possible. To induce the increase of the copy number, LB medium (2.2.2)
with 12.5 µg/ml chloramphenicol (Table 6) was inoculated with 10 % (vol/vol) of an
overnight culture and supplied with 0.1 % (vol/vol) induction solution (supplied within
the kit). The culture was then incubated for 5 h at 37 °C and 200 rpm on a VKS 75 A
control shaker (Edmund Bühler GmbH, Hechingen, Germany) and the cells subse-
quently harvested for further analysis. Another possibility is the direct incubation over
night using 0.2 % of the autoinduction solution (also supplied with the kit) for 18 h.
2.15.7 Storage of metagenomic libraries
The fosmid clones were picked in wells of microtiter plates filled with 150 µl LB +
12.5 µg/ml chloramphenicol (2.2.2, Table 6). The plates were incubated overnight at
37 °C and then supplied with 33 % (vol/vol) glycerol (final volume) and stored at
−70 °C.

2 Material & Methods 35
2.16 Protein biochemical methods
2.16.1 Induction
Cultures were inoculated with 1 % of an overnight culture and grown on a shaker (VKS
75 A control, Edmund Bühler GmbH, Hechingen, Germany) at 200 rpm. In order to find
the optimal temperature for expression, different incubation temperatures were tried
out. Cultures were incubated at 37 °C for 2-3 h, at 28 °C for 3-4 h and at 17 °C for 6-
8 h, until an OD600 of 0.8 was reached. The production of the recombinant proteins by
E. coli BL21 (DE3) was then induced by the addition of 1 mM isopropyl-beta-D-
thiogalactopyranoside (IPTG), as recommended (Donovan et al. 1996). The induced
cells were further incubated until a high cell density was reached (up to 4 h at 37 °C
and up to 18 h at 17 °C). The temperature and concentration of IPTG that brought the
best yield of recombinant enzyme were applied in further expression studies.
2.16.2 Preparation of crude cell extracts
After incubation, the induced cultures were harvested by centrifugation (2.4.3). The
pellets were resuspended in (PB) or LEW buffer (2.16.3). Cells of pellets resulting from
a culture volume bigger than 100 ml were disrupted in a French pressure cell (Ameri-
can Instrument Company, Silver Spring, MD, USA) with at least one repeat in order to
obtain a clear lysate. The high pressure in the press causes the cells to burst. High
viscosity of the lysate due to genomic DNA was lowered by ultrasonication for 5 to
15 min. This method was also applied to cell pellets resulting from culture volumes of
less than 100 ml with a sonotrode (ultrasonication processor UP 200S, 24 kHz, 200 W,
Dr. Hielscher GmbH, Teltow, Germany). The cell suspension was sonicated on ice in
an E-cup for 5 to 30 min (amplitude 50 %, cycle 0.5) until the lysate visibly started to
clear. Cellular debris was sedimented by centrifugation at 4,500 X g and 4 °C for
20 min (centrifuge 5417R, Eppendorf, Hamburg, Germany). Larger volumes were har-
vested in a Sorvall RC6+ centrifuge (rotor SS-34; Thermo scientific, Braunschweig,
Germany) at 4,000 X g and 4 °C for 20 min. The supernatant containing the proteins
was transferred to a new E-cup or Falcon tube and stored at 4 °C for up to two weeks
and the cell pellet was discarded if not used for denaturing purification.
0.1 M Phosphate buffer (PB) pH 7.0
KH2PO4 aq (0.2 M) 39 ml
K2HPO4aq(0.2 M) 61 ml
H2Obidest ad 200 ml
2 Material & Methods 36
0.1 M Phosphate buffer (PB) pH 8.0
KH2PO4aq(0.2 M) 5.3 ml
K2HPO4 aq (0.2 M) 94.7 ml
H2Obidest ad 200 ml
The pH was measured and if necessary adjusted with KH2PO4 aq (0.2 M) or
K2HPO4aq(0.2 M).
Lysis buffer
NaH2PO4 50 mM
NaCl 300 mM
Imidazole 10 mM
The substances were solved in H2Obidest and pH was adjusted to 8.0 with NaOH.
2.16.3 pET vectors/His-tag affinity columns
Proteins containing a His-tag sequence were purified with Protino® Ni-TED 2000
packed columns (Macherey-Nagel, Düren, Germany) as described in the manufactur-
er’s protocol. The required buffers were supplied with the kit. The column was equili-
brated with 4 ml LEW buffer. Then the lysate (2.16.2) was transferred onto the column
and the column was allowed to empty by gravity flow. The column was washed twice
by applying 4 ml LEW buffer before the elution of the recombinant protein was per-
formed by applying 3 ml elution buffer for three times. For a higher purity different
amounts of imidazole (10 to 250 mM) were added to the elution buffer, eluted with 3
times 1 ml respectively for a fractionized elution. The elution fractions with low purity
were discarded. Molecular weight and purity of the protein were analyzed by SDS-
PAGE (2.16.5).
2.16.3.1 Concentration of eluted protein
To concentrate the eluted protein the Vivaspin 20 (Sartorius, Göttingen, Germany) with
the appropriate filter size was used following the manufacturer’s instructions until the
desired concentration was reached.
2.16.4 Protein quantification (Bradford 1967)
For the quantitative measurement of a protein concentration, the Roti®-Quant solution
was applied (Carl Roth GmbH, Karlsruhe, Germany) according to the manufacturer's
protocol. The anionic dye Coomassie Brilliant Blue G250 that is part of the solution
binds to positively charged amino acids of the proteins and thus a color change reac-

2 Material & Methods 37
tion takes place. By this, the protein concentration was measured after an incubation
for 10 min in the dark using - a photometer (SmartSpecTM Plus, BIO RAD, Hercules,
CA, USA) at 595 nm against a protein free blank with buffer. The extinctions were
compared with a standard curve made with concentrations of BSA between 0.2 and
1 mg/ml as a reference protein, so the concentrations could be calculated.
2.16.5 SDS-polyacrylamide gel electrophoresis (SDS-PAGE;
Laemmli 1970)
The protein solutions were analyzed by SDS-PAGE. SDS is an anionic amphipathic
substance that binds to polypeptides. It acts denaturing and confers an almost evenly
distributed charge. The denatured proteins can migrate in the electromagnetic field
through the matrix. The electrophoretic mobility is dependent on a function of the length
of a polypeptide chain and its charge. Smaller polypeptides move faster through the
matrix than larger ones. The Mini-Protean equipment (BioRad, Munich, Germany) was
used for preparing the gels and for carrying out the electrophoresis.
2.16.5.1 Preparation of denaturing SDS-polyacrylamide gels
Usually, discontinuous gels with a 7 % stacking gel and a 10 or 12 % separating gel
were prepared. After cleaning both with 70 % EtOH, a spacer plate was put together
with a short plate and arrested in a casting frame. The glass plate construct was
clamped in a casting stand and loaded with approximately 5 ml of separating gel (Table
8). The gel was overlaid with a thin layer of water in order to get a smooth gel surface
and to ensure almost anoxic polymerization. After ca. 30 min, the water was removed
with a tissue and the stacking gel (Table 8) was applied on the separating gel. A comb
with 10 wells was set in the stacking gel before its polymerization. After ca. 20 min, the
comb was removed and the gel ready for electrophoresis.
Separating gel stock solution
Tris 1.5 M
SDS 0.4 % (w/vol)
H2Obidest ad 250 ml pH 8.8
Stacking gel stock solution
Tris 0.5 M
SDS 0.4 % (w/vol)
H2Obidest ad 100 ml pH 6.8
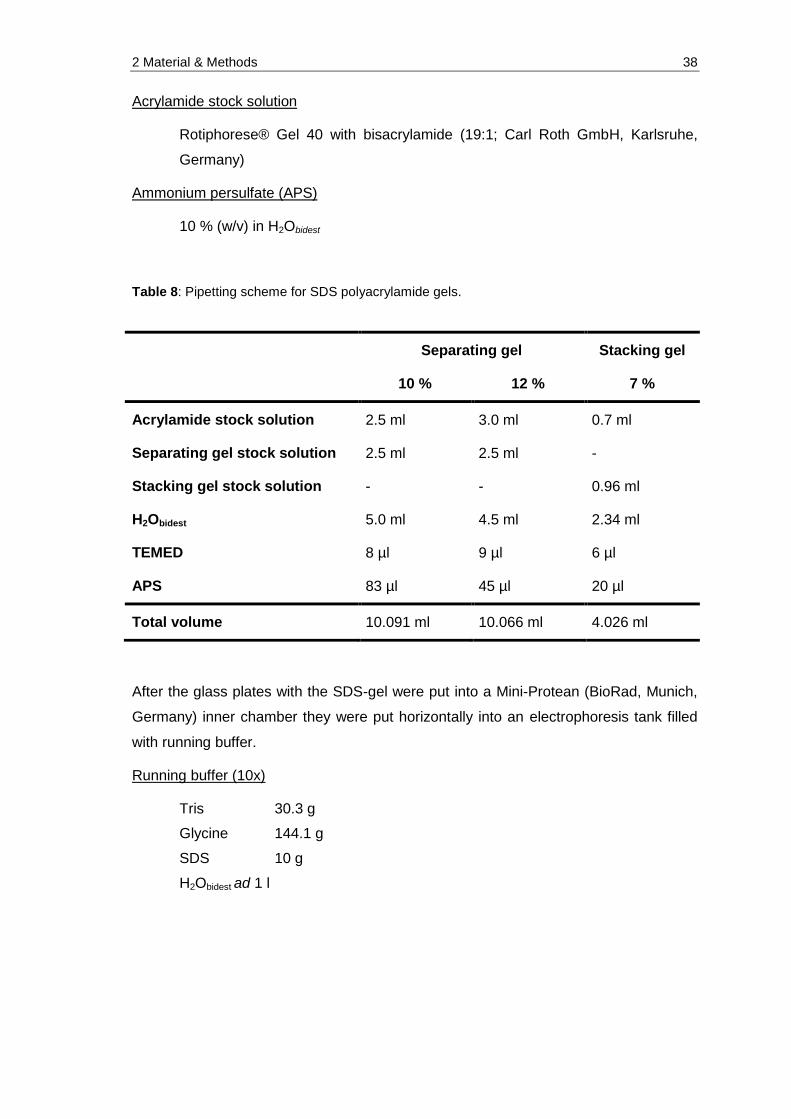
2 Material & Methods 38
Acrylamide stock solution
Rotiphorese® Gel 40 with bisacrylamide (19:1; Carl Roth GmbH, Karlsruhe,
Germany)
Ammonium persulfate (APS)
10 % (w/v) in H2Obidest
Table 8: Pipetting scheme for SDS polyacrylamide gels.
Separating gel Stacking gel
10 % 12 % 7 %
Acrylamide stock solution 2.5 ml 3.0 ml 0.7 ml
Separating gel stock solution 2.5 ml 2.5 ml -
Stacking gel stock solution - - 0.96 ml
H2Obidest 5.0 ml 4.5 ml 2.34 ml
TEMED 8 µl 9 µl 6 µl
APS 83 µl 45 µl 20 µl
Total volume 10.091 ml 10.066 ml 4.026 ml
After the glass plates with the SDS-gel were put into a Mini-Protean (BioRad, Munich,
Germany) inner chamber they were put horizontally into an electrophoresis tank filled
with running buffer.
Running buffer (10x)
Tris 30.3 g
Glycine 144.1 g
SDS 10 g
H2Obidest ad 1 l
2 Material & Methods 39
2.16.5.2 Sample preparation for SDS-PAGE and electrophoresis
conditions
Samples were mixed 4:1 with denaturing loading dye and incubated at 95 °C for 5 min.
After centrifugation at 13,000 X g for 2 min in a minispin centrifuge (Eppendorf, Ham-
burg, Germany), samples were applied in the molds of the SDS-gel.
Loading dye
Glycerol 50 % (vol/vol)
Dithiothreitol (DTT) 100 mM
SDS 4 % (w/vol)
Bromphenol blue 0.02 % (w/vol)
Tris-HCl (pH 6.8) 150 mM
EDTA 1 mM
NaCl 30 mM
H2Obidest ad 10 ml
The loading dye was stored as aliquots of 1 ml at −20 °C.
When two gels were running in parallel, amperage of 40 mA was set until the dye front
passed the stacking gel. The power was supplied by a PowerPac TM Basic (BioRad,
Munich, Germany). The samples passed through the separating gel with 60 mA. For
only one gel, the amperage was lowered to 20 mA and 30 mA, respectively, until the
dye front reached the end of the gel.
2.16.5.3 Coomassie staining of proteins and estimation of molecular
weight
After electrophoresis, the SDS-gels were stained overnight with Coomassie Brilliant
Blue R250 (Gerbu Biotechnik GmbH, Gaiberg, Germany) that binds non-specifically to
proteins.
Staining solution (1 l)
Coomassie Brilliant Blue R-250 (10 % solution) 4 ml
Methanol 0.4 l
Acetic acid 0.1 l
H2Obidest 0.5 l
The gel was decolorized for a few hours with 20 % acetic acid so separate blue protein
bands were visible. The protein bands were compared with the bands of an unstained
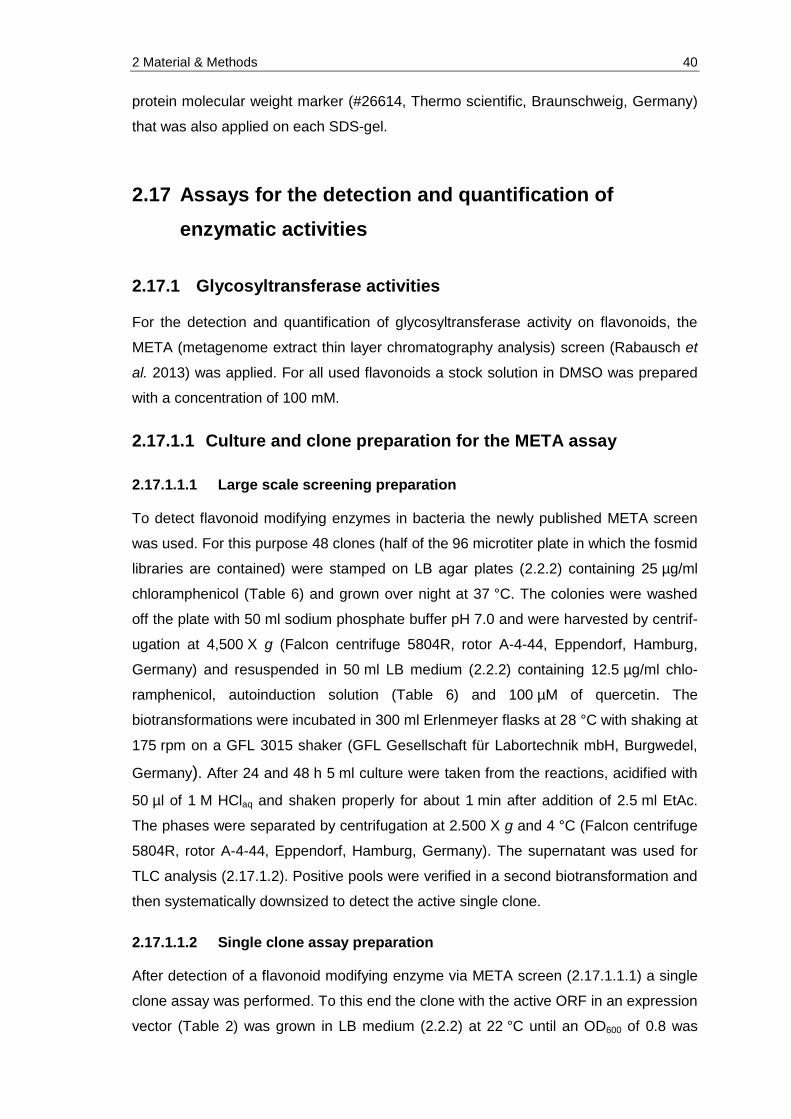
2 Material & Methods 40
protein molecular weight marker (#26614, Thermo scientific, Braunschweig, Germany)
that was also applied on each SDS-gel.
2.17 Assays for the detection and quantification of
enzymatic activities
2.17.1 Glycosyltransferase activities
For the detection and quantification of glycosyltransferase activity on flavonoids, the
META (metagenome extract thin layer chromatography analysis) screen (Rabausch et
al. 2013) was applied. For all used flavonoids a stock solution in DMSO was prepared
with a concentration of 100 mM.
2.17.1.1 Culture and clone preparation for the META assay
2.17.1.1.1 Large scale screening preparation
To detect flavonoid modifying enzymes in bacteria the newly published META screen
was used. For this purpose 48 clones (half of the 96 microtiter plate in which the fosmid
libraries are contained) were stamped on LB agar plates (2.2.2) containing 25 µg/ml
chloramphenicol (Table 6) and grown over night at 37 °C. The colonies were washed
off the plate with 50 ml sodium phosphate buffer pH 7.0 and were harvested by centrif-
ugation at 4,500 X g (Falcon centrifuge 5804R, rotor A-4-44, Eppendorf, Hamburg,
Germany) and resuspended in 50 ml LB medium (2.2.2) containing 12.5 µg/ml chlo-
ramphenicol, autoinduction solution (Table 6) and 100 µM of quercetin. The
biotransformations were incubated in 300 ml Erlenmeyer flasks at 28 °C with shaking at
175 rpm on a GFL 3015 shaker (GFL Gesellschaft für Labortechnik mbH, Burgwedel,
Germany). After 24 and 48 h 5 ml culture were taken from the reactions, acidified with
50 µl of 1 M HClaq and shaken properly for about 1 min after addition of 2.5 ml EtAc.
The phases were separated by centrifugation at 2.500 X g and 4 °C (Falcon centrifuge
5804R, rotor A-4-44, Eppendorf, Hamburg, Germany). The supernatant was used for
TLC analysis (2.17.1.2). Positive pools were verified in a second biotransformation and
then systematically downsized to detect the active single clone.
2.17.1.1.2 Single clone assay preparation
After detection of a flavonoid modifying enzyme via META screen (2.17.1.1.1) a single
clone assay was performed. To this end the clone with the active ORF in an expression
vector (Table 2) was grown in LB medium (2.2.2) at 22 °C until an OD600 of 0.8 was
2 Material & Methods 41
reached. Then the culture was induced at 17 °C over night (2.16.1) and harvested by
centrifugation (Falcon centrifuge 5804R, rotor A-4-44, Eppendorf, Hamburg, Germany)
at 4.500 g and resuspended in 50 mM sodium phosphate buffer pH 7.0 supplemented
with 1 % (w/vol) α-D-glucose. Biotransformations with a final concentration of 200 µM
flavonoid inoculated from stock solutions of 100 mM in DMSO were incubated in
300 ml Erlenmeyer flasks at 28 °C and 175 rpm on a GFL 3015 shaker (GFL
Gesellschaft für Labortechnik mbH, Burgwedel, Germany) for up to 24 h. 5 ml culture
were withdrawn in certain intervals, acidified with 150 µl 1 M H3PO4aq and mixed with
2.5 ml EtAc. After shaking the culture for about 1 min the phases were separated by
centrifugation at 2.500 X g and 4 °C (Falcon centrifuge 5804R, rotor A-4-44,
Eppendorf, Hamburg, Germany). The supernatant was applied for the TLC analysis
(2.17.1.2).
2.17.1.1.3 Quantification of glycosyltransferase activity
For the quantification the cells were treated as in the single clone assay preparation
(2.17.1.1.2). Instead of the EtAc step 100 µl of the culture were taken and dissolved
2/10 (vol/vol) in EtAc/acetic acid 3:1. These acidified samples were centrifuged at
10,000 X g and 4 °C in a refrigerated centrifuge 5417R (Eppendorf, Hamburg, Germa-
ny) and the supernatant was applied for the TLC analysis (2.17.1.2).
2.17.1.1.4 Substrate specificity and glycosylation pattern
In order to scan the substrate spectrum and the glycosylation pattern of the
glycosyltransferase different flavonoids from all flavonoid groups with varying free hy-
droxyl-groups were added to the culture, all in a final concentration of 200 µM. The
flavonoids were provided by Merck (Darmstadt, Germany) or Extrasynthese (Lyon,
France). Quercetin, Kaempferol, Luteolin, Naringenin, Genistein, Tiliroside, t-
Resveratrol, Xanthohumol, Fisetin, Hesperetin, Rhamnetin, Isorhamnetin, Tamarixetin,
Galangin, 3,6-Dihydroxyflavone, Eupatorin-5-methylether, 3’,4’-Dihydroxyflavone, 7-
Methoxyflavonol, 4’-Hydroxyflavanone, Luremin, Catechin, Epicatechin, Pratol and
Quercetin-3,3’,4’,7-tetramethylether were used. Based on the glycosylation of the dif-
ferent flavonoids the substrate spectrum and favored glycosylation positions of the
glycosyltransferase could be verified.
2.17.1.1.5 Biocatalysis with purified protein
The biocatalytic reaction mixture of 1 ml contained about 5 µg of the purified protein.
The Reaction was performed in 50 mM sodium phosphate buffer, pH 7.0, at 37 °C. The
acceptor substrate (flavonoid) was added to the reaction mixture in a final concentra-
2 Material & Methods 42
tion of 100 µM, the donor substrate to a final concentration of 500 µM from a 50 mM
stock solution in 50 mM sodium phosphate buffer, pH 7.0. As performed for the quanti-
fication (2.17.1.1.3) the extract was dissolved 2/10 (vol/vol) in EtAc/acetic acid 3:1
which stopped the reaction.
2.17.1.2 TLC analysis
The supernatant transferred into HPLC flat bottom vials was used for TLC analysis.
2.17.1.2.1 Standard TLC analysis
Samples of 20 µl were applied on 20×10 cm2 (HP)TLC silica 60 F254 plates (Merck
KGaA, Darmstadt, Germany) against 200 pmol of reference flavonoids. To avoid car-
ryover of substances, samples were spotted with a double syringe rinsing step in be-
tween by the ATS 4 (CAMAG, Muttenz, Switzerland). The sampled TLC plates were
developed in ethyl acetate/acetic acid/formic acid/water 100:11:11:27 (‘Universal
Pflanzenlaufmittel’) (Wagner 1983). After separation the plates were dried in a hybridi-
sation oven (Biometra OV2, Biometra GmbH, Goettingen, Germany) at 80 °C for 5 min.
The absorbance of the separated bands was determined densitometrically depending
on the absorbance maximum of the applied educt substances at 285 to 370 nm (D2
lamp) by a TLC Scanner 3 (CAMAG, Muttenz, Switzerland).Subsequently, the sub-
stances on developed TLC plates were derivatized by dipping the plates in a
methanolic solution of 1 % (w/vol) diphenyl boric acid β-aminoethyl ester (DPBA) (Neu
1957) for one second using a Chromatogram Immersion Device (CAMAG, Muttenz,
Switzerland) followed by drying the TLC plates in hot air with a fan. The TLC plates
were dipped in or sprayed with a 5 % (w/vol) solution of polyethylene glycol 4000 in
ethanol (70 %, vol/vol). For dipping, a chromatogram immersion device (Camag,
Muttenz, Switzerland) was used. After two minutes the bands were visualized at
365 nm with a UV hand lamp and photographed. Alternatively, fluorescence of the
bands was determined densitometrically by the TLC Scanner 3 depending on the ab-
sorbance maximum of the applied substances at 320 to 370 nm (D2 lamp). The exami-
nation was done using the appendant program (winCATS 1.4.4).
2.17.1.2.2 TLC analysis for quantification
To quantify flavonoids in biotransformation and biocatalytic reactions, samples were
diluted 1/10 in ethyl acetate/acetic acid 3:1 to stop the reaction. Samples of 20 µl were
sprayed by an ATS 4 (CAMAG, Muttenz, Switzerland) on HPTLC silica 60 F254 plates
(Merck KGaA, Darmstadt, Germany) against different amounts of respective standard
educt and product substances. TLC plates were developed, dried, derivatized and ana-
2 Material & Methods 43
lyzed as described in section 2.17.1.2.1. Regression curves were calculated from the
peak area of the applied reference substances to determine the amount of produced
and residual flavonoid using the TLC Scanner 3 and the winCATS programm (version
1.4.4) (CAMAG, Muttenz, Switzerland).
2.17.2 Cellulolytic activities
For the detection of cellulolytic clones, the congo red agar plate assay (2.17.2.1) was
applied. The quantification of activity was performed with the DNSA assay (2.17.2.2).
2.17.2.1 Congo red agar plate assay
For the detection of cellulolytic activity, strains and metagenomic clones were streaked
or stamped on appropriate agar plates (2.2.2) containing 0.2 % (w/vol) CMC
(carboxymethylcellulose). The plates were incubated for 3 to 5 days at 37 °C and then
overlaid with 5 ml of 0.2 % (vol/vol) congo red. The plates were incubated for 30 min
before the congo red solution was discarded and the plates were washed with 1 M
NaCl three times for 30 min. Positive clones exhibited an orange halo on the red
stained plates.
2.17.2.2 3,5-dinitrosalicylic acid (DNSA) assay
To quantify cellulolytic activity, crude cell extract were used in the DNSA assay. The
activity was determined by the amount of reducing sugar released from cellulose as
this sugar reduces 3,5-dinitrosalicylic acid (DNSA) to 3-amino-5-nitrosalicylic acid
which can be quantified at 546 nm.
DNSA mixture
Crude cell extract 100 µL
CMC (2 %, w/vol) 250 µl
McIllvaine buffer 150 µl
This reaction mixture was incubated for 30 min at 37 °C. Then 750 µl DNSA reagent
were added and the sample incubated for 15 min at 95 °C. The reducing sugar ends
were quantified at 546 nm in a SmartSpec™ Plus spectrophotometer (Bio-Rad, Hercu-
les, CA, USA) in comparison with a calibration line for using glucose as a standard.
McIllvaine buffer
Na2HPO4 0.2 M
The pH of 6.5 was adjusted with 0.1 M citric acid at 65 °C.
2 Material & Methods 44
DNSA reagent
3,5-dinitrosalicylic acid 10 g
NaOH 10 g
K-Na-Tartrat 200 g
Na2SO3 0.5 g
Phenol 2 g
H2O ad 1 l
The solution was stored at 4 °C and protected from light.
2.17.3 Esterolytic activities
For the detection of esterolytic clones, the TBT agar plate assay (2.17.2.1) was ap-
plied. The quantification of activity was performed with the pNP assay (2.17.2.2).
2.17.3.1 Tributyrin (TBT) agar plate assay
E. coli clones were tested for lipolytic activity by transferring them on LB agar plates
containing 1 % tributyrin (TBT) as indicator substrate. For the preparation of the medi-
um, LB agar (2.2.2) was prepared and heated in a microwave. Then, the TBT was
added and the medium was homogenized for 3 min with an ULTRA TURRAX® T18
basic homogenizer (IKA WORKS Inc., Wilmington, NC, USA). The agar was auto-
claved immediately and the plates were prepared as soon as possible to avoid TBT
drop formation. Active clones hydrolyze TBT, butyric acid is being released and the
colonies show the formation of clear halos surrounding them after growth for three to
five nights at 37 °C.
2.17.3.2 Para-nitrophenol (pNP) ester assay
pNP esters are substrates that release chromogenic para-nitrophenol (=4-nitrophenol
orpNP) when the ester bond to a fatty acid is being hydrolyzed by an esterase or li-
pase. Activity tests were performed by incubating the enzymes with 1 mM pNP sub-
strate in 0.1 M potassium phosphate buffer (PB, pH 8.0) at assay temperatures of
37 °C, unless otherwise indicated. Substrates with different acyl chain lengths were
purchased from Sigma Aldrich (Munich, Germany): butyrate (C4), octanoate (C8),
decanoate (C10), and dodecanoate (C12).Stock solutions with each substrate were
prepared with a 10 mM concentration in isopropanol and stored at 4 °C for up to
4 weeks. The reaction was measured by quantification of the released yellow para-
nitrophenol at 405 nm in a Synergy HT (Biotek, Winooski, VT, USA). The extinction
was measured against a protein free blank containing the respective pNP ester. The
2 Material & Methods 45
background esterase activity of the E. coli itself was measured ten times for each strain
and the mean value was deducted. The activities, based on the OD405 in relation to the
protein amount (2.16.4), between the different fosmids were compared.
2.17.3.2.1 pNP ester assay in a microtiter plate scale
In a microtiter plate scale, clones were grown separately in 5 ml test tubes over night at
37 °C with 12.5 µg/ml chloramphenicol and autoinduction solution (2.2.1). After incuba-
tion crude cell extracts (2.16.2) in PB pH 7.0 were prepared. 10 µl of each crude cell
extract were transferred to a 96 well microtiter plate and incubated with 190 µl of phos-
phate buffer (pH 8.0) that contained either 1 mM pNP butyrate, octanoate, decanoate
or dodecanoate, in order to screen if the enzymes are active on short or long chain
fatty acid esters. The samples were incubated for 30 min at 37 °C and subsequently,
the extinction of the cleaved para-nitrophenol was measured in a microtiter plate spec-
trophotometer (Synergy HT, Biotek, Winooski, VT, USA) at 405 nm against an empty
E. coli clone.
2.17.4 Amylase activity
E. coli clones were tested for their amylase activity by transferring them on LB agar
plates (2.2.2) containing 0.5 % (w/vol) of starch. After growing for three to five nights at
37 °C the plates were covered with Lugol's iodine solution. After about 6 min the starch
in the medium is colored dark purple and the solution was removed. Active clones re-
duce starch to sugar and the colonies show the formation of halos surrounding them.
3 Results 46
3 Results
3.1 Glycosyltransferase
Flavonoids possess an increasing industrial importance, because of their positive ef-
fects on human health and antioxidative properties (Ververidis et al. 2007, Konate et al.
2014), relevant to many industries. The glycosylated flavonoids are rare in nature and
their extraction from the plants is laborious (Manach et al. 2004). Thus, there is a de-
mand for new methods to obtain them in increased amounts.
To fulfill this demand and be able to detect novel flavonoid modifying enzymes from
bacteria, an activity-based screening method was developed. The method was named
META for metagenome extract thin-layer chromatography analysis (Rabausch et al.
2013) was developed. In this study different metagenomic libraries were screened by
META in order to detect flavonoid modifying enzymes.
3.1.1 Metagenomic library construction
As a promising habitat for carbohydrate active bacteria a metagenomic library was
constructed (2.15)1 of DNA isolated from fresh elephant feces (2.3.1.1, 2.6.1.1). The
library contained 20,000 clones. To determine the insert size, randomly selected
fosmids were purified (2.6.2) and a RFLP-analysis (restriction fragment length poly-
morphism) was performed using BamHI (2.10.1). The average insert size was 37.5 kb
(data not shown). As shown by Ilmberger et al. 2012 the microbiome of the elephant
feces is highly diverse and comprised bacteria of seven major phyla: Verrucomicrobia,
Actinobacteria, Lentisphaera, Spirochaetes and, especially, Firmicutes, Bacteroidetes
and Proteobacteria.
3.1.2 Screening of metagenomic libraries
Two libraries were screened for flavonoid modifying enzymes using the META screen
(2.17.1). First the elephant feces library with 20,000 clones (3.1.1) and, second, a li-
brary from Elbe river sediment (2.3.1.2) with 30,000 clones and an average insert size
of 35 kb (Rabausch et al. 2013), whereof about 18,000 clones were screened using
quercetin as substrate (quercetin is an abundant flavonoid in plants and it is also an
aglycon with many possibilities for O-glycosylations) and with the following reference
1 in cooperation with Ulrich Rabausch, AG Streit.

3 Results 47
substances for comparison: quercitrin (quercetin-3-O-L-rhamnoside), isoquercitrin
(quercetin-3-O-L-glucoside), spiraeoside (quercetin-4'-O-glucoside), rutin (quercetin-3-
O-glucorhamnoside) and hyperoside (quercetin-3-O-galactoside).
In the Elbe library one active clone pool (144b) of 48 clones was revealed (Figure 4).
Biotransformations of quercetin (2.17.1.1.1) with pool Elbe144b, a product that pro-
duced a strong band at the same height as quercitrin, was detected by TLC.
Q 143a 143b S 144a 144b Q3 145a 145b
Figure 4: TLC plate photography of each 20 µl extracts from biotransformation reactions of 100
µM quercetin after 24 h (2.17.1.1.1). Pools of 48 clones (143a – 145b), including the active pool
144b, were analyzed. One band in 144b (arrow) showed the same Rf value and a similar fluo-
rescence as the reference substance quercitrin (Q3). The TLC Plates were derivatized by
"Naturstoffreagenz A" and documented at 365 nm (2.17.1.2.1). Q, quercetin (100 µM were used
as substrate); S, spiraeoside; Q3, quercitrin.
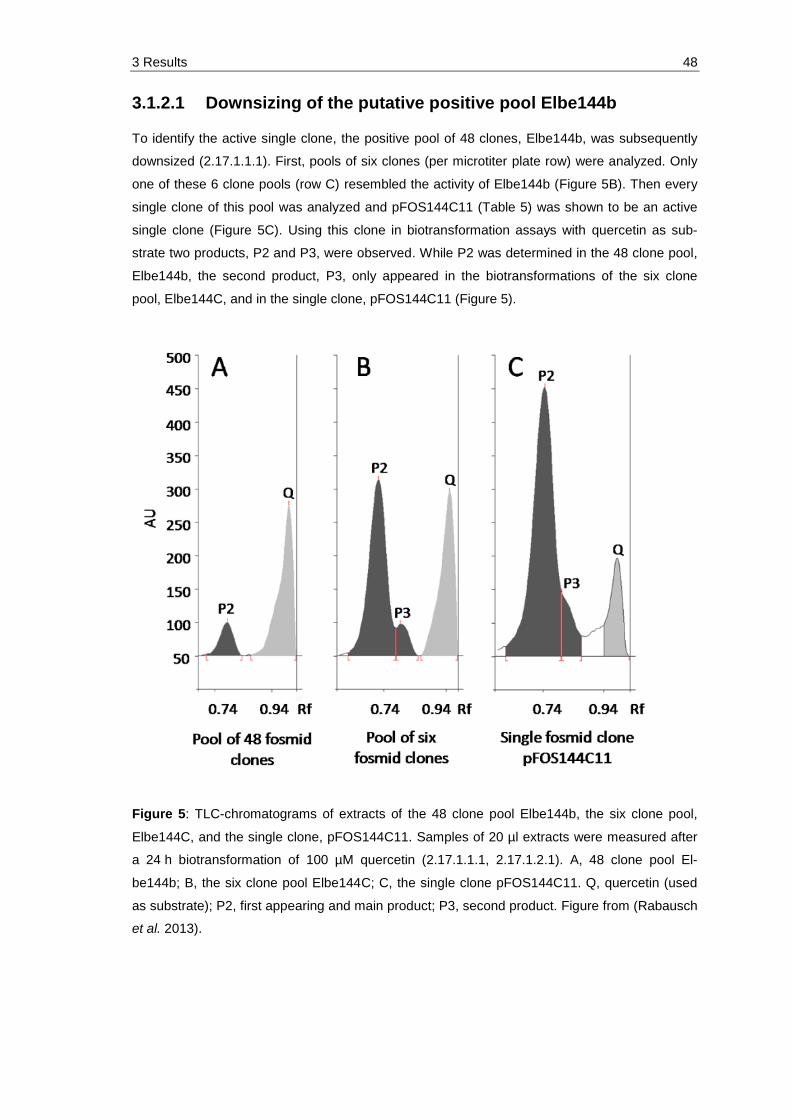
3 Results 48
3.1.2.1 Downsizing of the putative positive pool Elbe144b
To identify the active single clone, the positive pool of 48 clones, Elbe144b, was subsequently
downsized (2.17.1.1.1). First, pools of six clones (per microtiter plate row) were analyzed. Only
one of these 6 clone pools (row C) resembled the activity of Elbe144b (Figure 5B). Then every
single clone of this pool was analyzed and pFOS144C11 (Table 5) was shown to be an active
single clone (Figure 5C). Using this clone in biotransformation assays with quercetin as sub-
strate two products, P2 and P3, were observed. While P2 was determined in the 48 clone pool,
Elbe144b, the second product, P3, only appeared in the biotransformations of the six clone
pool, Elbe144C, and in the single clone, pFOS144C11 (Figure 5).
Figure 5: TLC-chromatograms of extracts of the 48 clone pool Elbe144b, the six clone pool,
Elbe144C, and the single clone, pFOS144C11. Samples of 20 µl extracts were measured after
a 24 h biotransformation of 100 µM quercetin (2.17.1.1.1, 2.17.1.2.1). A, 48 clone pool El-
be144b; B, the six clone pool Elbe144C; C, the single clone pFOS144C11. Q, quercetin (used
as substrate); P2, first appearing and main product; P3, second product. Figure from (Rabausch
et al. 2013).
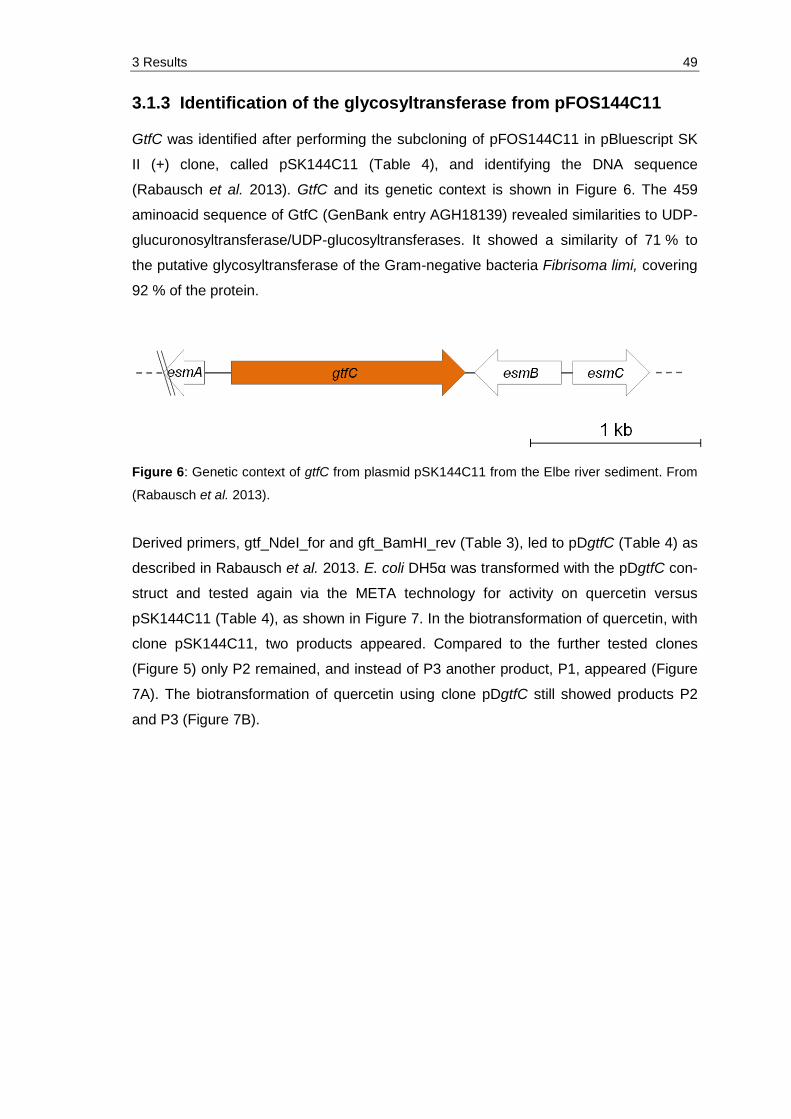
3 Results 49
3.1.3 Identification of the glycosyltransferase from pFOS144C11
GtfC was identified after performing the subcloning of pFOS144C11 in pBluescript SK
II (+) clone, called pSK144C11 (Table 4), and identifying the DNA sequence
(Rabausch et al. 2013). GtfC and its genetic context is shown in Figure 6. The 459
aminoacid sequence of GtfC (GenBank entry AGH18139) revealed similarities to UDP-
glucuronosyltransferase/UDP-glucosyltransferases. It showed a similarity of 71 % to
the putative glycosyltransferase of the Gram-negative bacteria Fibrisoma limi, covering
92 % of the protein.
Figure 6: Genetic context of gtfC from plasmid pSK144C11 from the Elbe river sediment. From
(Rabausch et al. 2013).
Derived primers, gtf_NdeI_for and gft_BamHI_rev (Table 3), led to pDgtfC (Table 4) as
described in Rabausch et al. 2013. E. coli DH5α was transformed with the pDgtfC con-
struct and tested again via the META technology for activity on quercetin versus
pSK144C11 (Table 4), as shown in Figure 7. In the biotransformation of quercetin, with
clone pSK144C11, two products appeared. Compared to the further tested clones
(Figure 5) only P2 remained, and instead of P3 another product, P1, appeared (Figure
7A). The biotransformation of quercetin using clone pDgtfC still showed products P2
and P3 (Figure 7B).
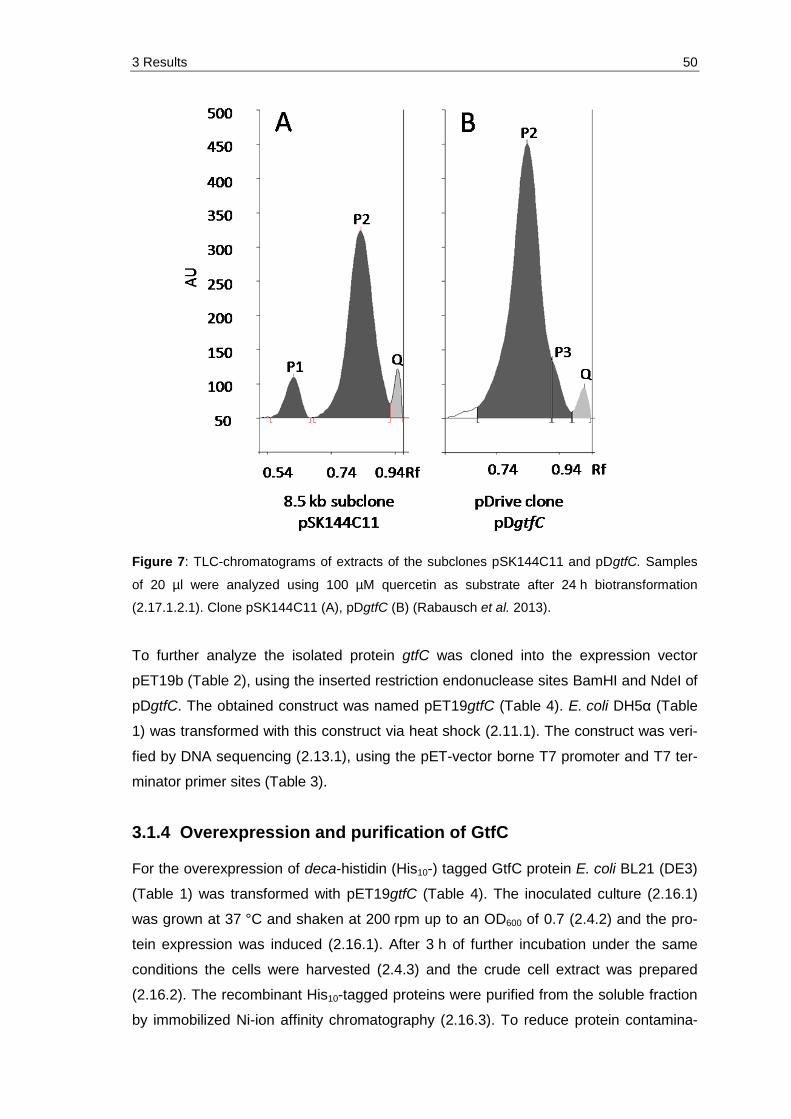
3 Results 50
Figure 7: TLC-chromatograms of extracts of the subclones pSK144C11 and pDgtfC. Samples
of 20 µl were analyzed using 100 µM quercetin as substrate after 24 h biotransformation
(2.17.1.2.1). Clone pSK144C11 (A), pDgtfC (B) (Rabausch et al. 2013).
To further analyze the isolated protein gtfC was cloned into the expression vector
pET19b (Table 2), using the inserted restriction endonuclease sites BamHI and NdeI of
pDgtfC. The obtained construct was named pET19gtfC (Table 4). E. coli DH5α (Table
1) was transformed with this construct via heat shock (2.11.1). The construct was veri-
fied by DNA sequencing (2.13.1), using the pET-vector borne T7 promoter and T7 ter-
minator primer sites (Table 3).
3.1.4 Overexpression and purification of GtfC
For the overexpression of deca-histidin (His10-) tagged GtfC protein E. coli BL21 (DE3)
(Table 1) was transformed with pET19gtfC (Table 4). The inoculated culture (2.16.1)
was grown at 37 °C and shaken at 200 rpm up to an OD600 of 0.7 (2.4.2) and the pro-
tein expression was induced (2.16.1). After 3 h of further incubation under the same
conditions the cells were harvested (2.4.3) and the crude cell extract was prepared
(2.16.2). The recombinant His10-tagged proteins were purified from the soluble fraction
by immobilized Ni-ion affinity chromatography (2.16.3). To reduce protein contamina-
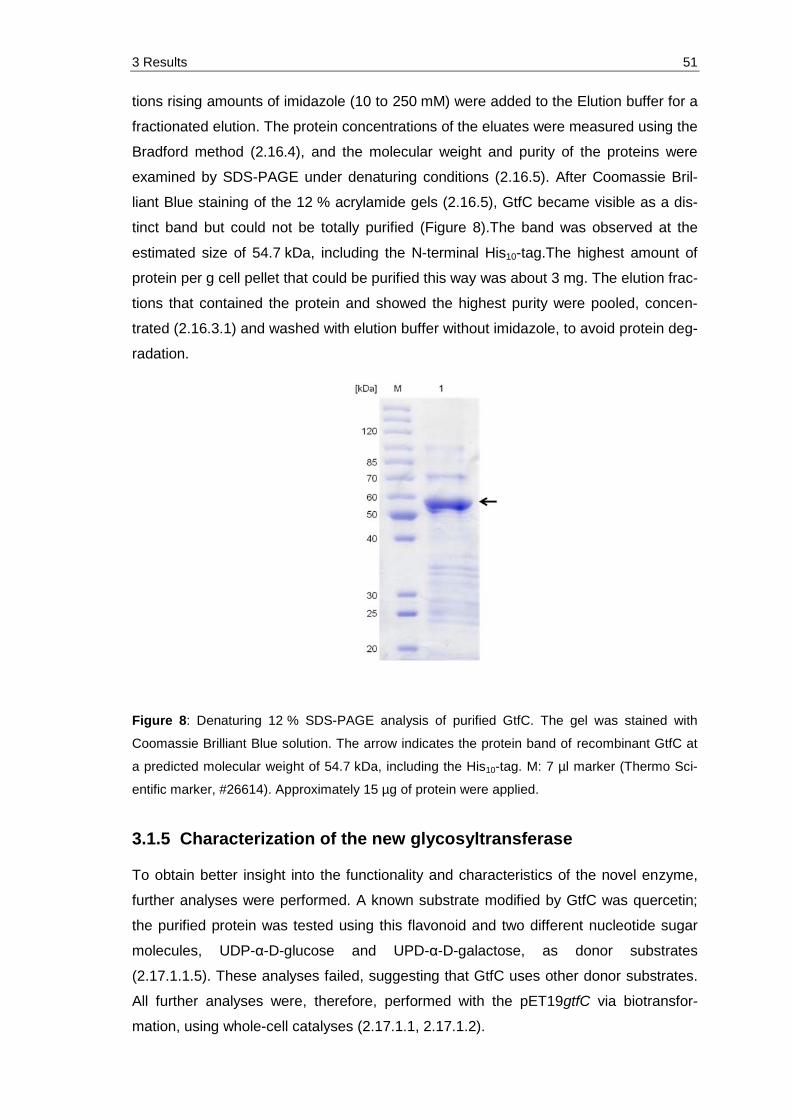
3 Results 51
tions rising amounts of imidazole (10 to 250 mM) were added to the Elution buffer for a
fractionated elution. The protein concentrations of the eluates were measured using the
Bradford method (2.16.4), and the molecular weight and purity of the proteins were
examined by SDS-PAGE under denaturing conditions (2.16.5). After Coomassie Bril-
liant Blue staining of the 12 % acrylamide gels (2.16.5), GtfC became visible as a dis-
tinct band but could not be totally purified (Figure 8).The band was observed at the
estimated size of 54.7 kDa, including the N-terminal His10-tag.The highest amount of
protein per g cell pellet that could be purified this way was about 3 mg. The elution frac-
tions that contained the protein and showed the highest purity were pooled, concen-
trated (2.16.3.1) and washed with elution buffer without imidazole, to avoid protein deg-
radation.
Figure 8: Denaturing 12 % SDS-PAGE analysis of purified GtfC. The gel was stained with
Coomassie Brilliant Blue solution. The arrow indicates the protein band of recombinant GtfC at
a predicted molecular weight of 54.7 kDa, including the His10-tag. M: 7 µl marker (Thermo Sci-
entific marker, #26614). Approximately 15 µg of protein were applied.
3.1.5 Characterization of the new glycosyltransferase
To obtain better insight into the functionality and characteristics of the novel enzyme,
further analyses were performed. A known substrate modified by GtfC was quercetin;
the purified protein was tested using this flavonoid and two different nucleotide sugar
molecules, UDP-α-D-glucose and UPD-α-D-galactose, as donor substrates
(2.17.1.1.5). These analyses failed, suggesting that GtfC uses other donor substrates.
All further analyses were, therefore, performed with the pET19gtfC via biotransfor-
mation, using whole-cell catalyses (2.17.1.1, 2.17.1.2).
3 Results 52
3.1.5.1 Glycosylation pattern and flavonoid substrates
To determine the substrate range of GtfC, a substrate panel was tested. The panel
consisted of flavonoid classes of flavones, flavonoles, flavanones, isoflavones, one
stilbene and one chalcone with different hydroxyl patterns. After inducing protein ex-
pression using IPTG (3.1.5.2), and following the resuspension of the culture in a 50 mM
phosphate buffer, the biotransformation with each substrate (200 µM) was performed in
a 50 mM phosphate buffer with an addition of 1 % glucose. Samples of 200 µl were
resolved 4:1 in 800 µl EtOAc:HAc (3:1), and TLC analysis was performed (2.17.1.2.1).
Important flavonoid substrates are shown in Table 9 and Table 10.
To gain more information about the glycosylated positions, flavonoids with only one
hydroxyl group were used as substrates. The C3' position was glycosylated by GtfC,
which was shown by using eupatorin-5-methylether as substrate, the C4' position gly-
cosylation is shown using the substrate 4'-hydroxyflavanone. Biotransformation of a
substrate (3',4'-dihydroxyflavone) with both B-ring hydroxyl group positions, C3' and
C4', presented three products. The glycosylation of the C3 position by GtfC was shown
by using 7-methoxyflavonol as substrate for the biotransformation, yielding two prod-
ucts. Also, the C7 position (pratol) and the C5 position (quercetin-3,3',4',7-
tetramethylether) were glycosylated using the new enzyme, although the conversion
rate of quercetin-3,3',4',7-tetramethylether was low. It was shown that GtfC could gly-
cosylate every free hydroxyl group that was offered. Considering the different flavonoid
classes used for the biotransformation it could be shown that GtfC is highly promiscu-
ous. The enzyme transformed flavones (e.g. luteolin, pratol), flavonoles (e.g. quercetin,
kaempferol, galangin), flavanones (e.g. naringenin, 4'-hydroxyflavanone), isoflavones
(e.g. genestein), stilbenes (e.g. t-resveratrol) as well as chalcones (e.g. xanthohumol).
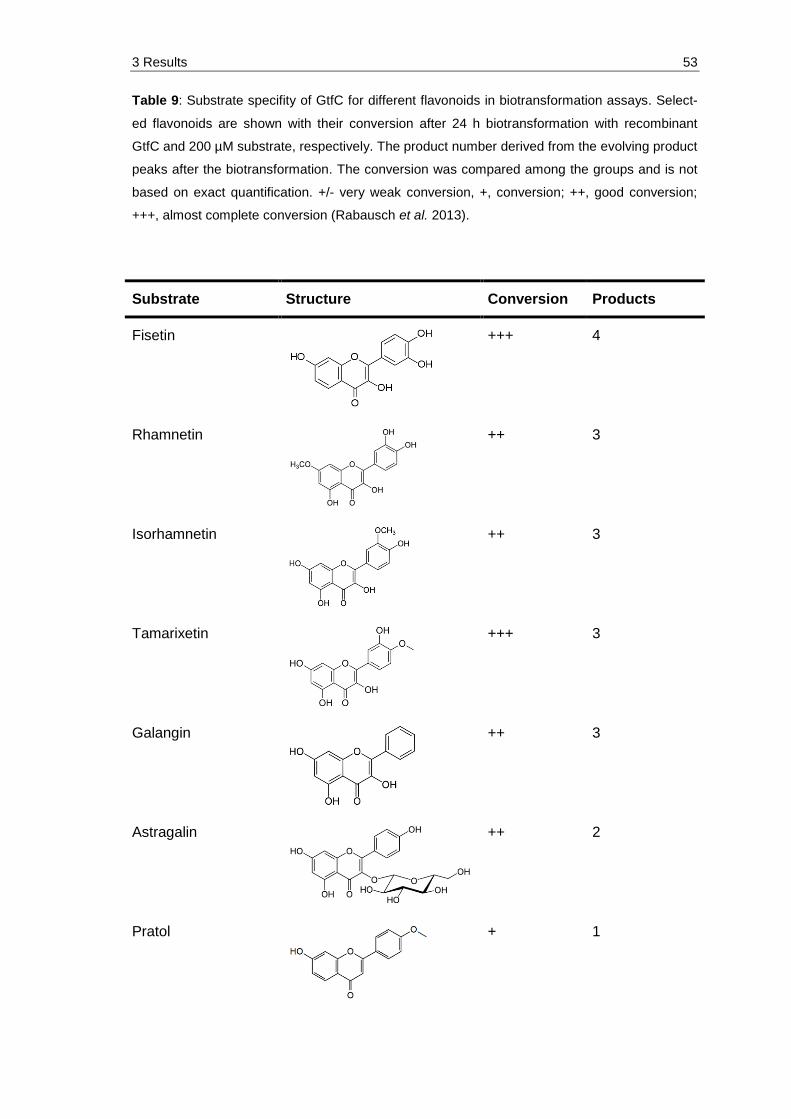
3 Results 53
Table 9: Substrate specifity of GtfC for different flavonoids in biotransformation assays. Select-
ed flavonoids are shown with their conversion after 24 h biotransformation with recombinant
GtfC and 200 µM substrate, respectively. The product number derived from the evolving product
peaks after the biotransformation. The conversion was compared among the groups and is not
based on exact quantification. +/- very weak conversion, +, conversion; ++, good conversion;
+++, almost complete conversion (Rabausch et al. 2013).
Substrate Structure Conversion Products
Fisetin
+++ 4
Rhamnetin
++ 3
Isorhamnetin
++ 3
Tamarixetin
+++ 3
Galangin
++ 3
Astragalin
++ 2
Pratol
+ 1
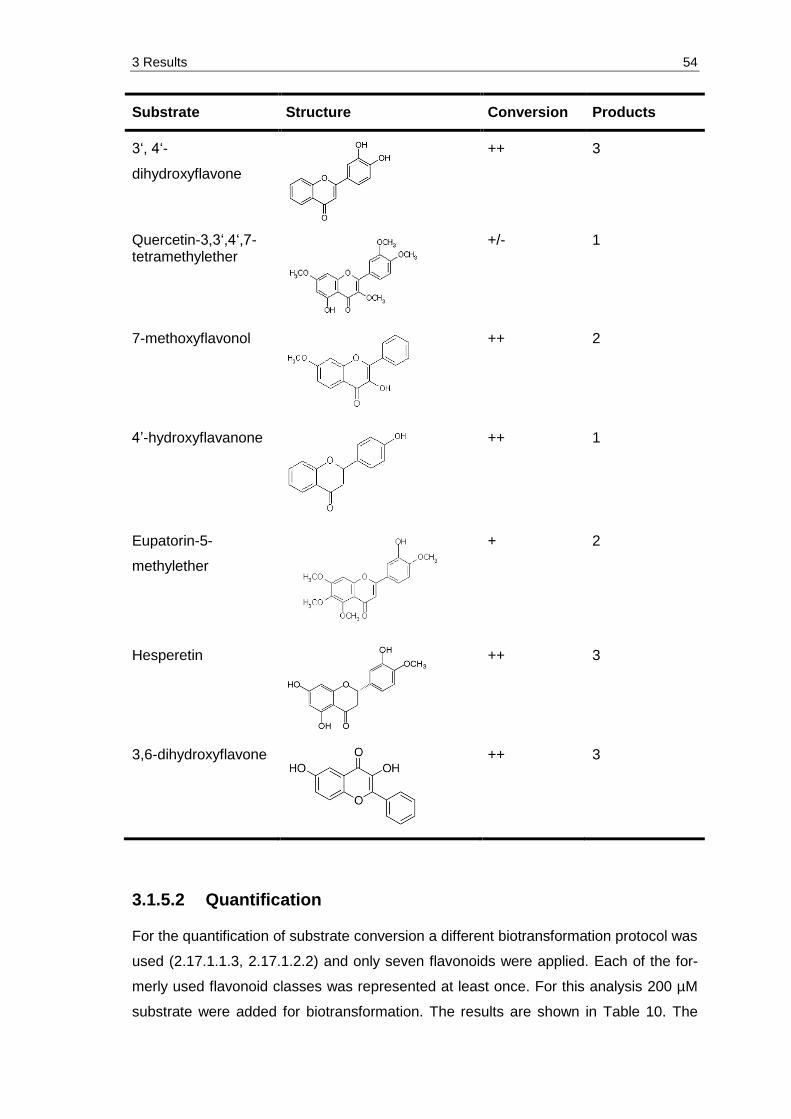
3 Results 54
Substrate Structure Conversion Products
3‘, 4‘-
dihydroxyflavone
++ 3
Quercetin-3,3‘,4‘,7- tetramethylether
+/- 1
7-methoxyflavonol
++ 2
4’-hydroxyflavanone
++ 1
Eupatorin-5-
methylether
+ 2
Hesperetin
++ 3
3,6-dihydroxyflavone
++ 3
3.1.5.2 Quantification
For the quantification of substrate conversion a different biotransformation protocol was
used (2.17.1.1.3, 2.17.1.2.2) and only seven flavonoids were applied. Each of the for-
merly used flavonoid classes was represented at least once. For this analysis 200 µM
substrate were added for biotransformation. The results are shown in Table 10. The
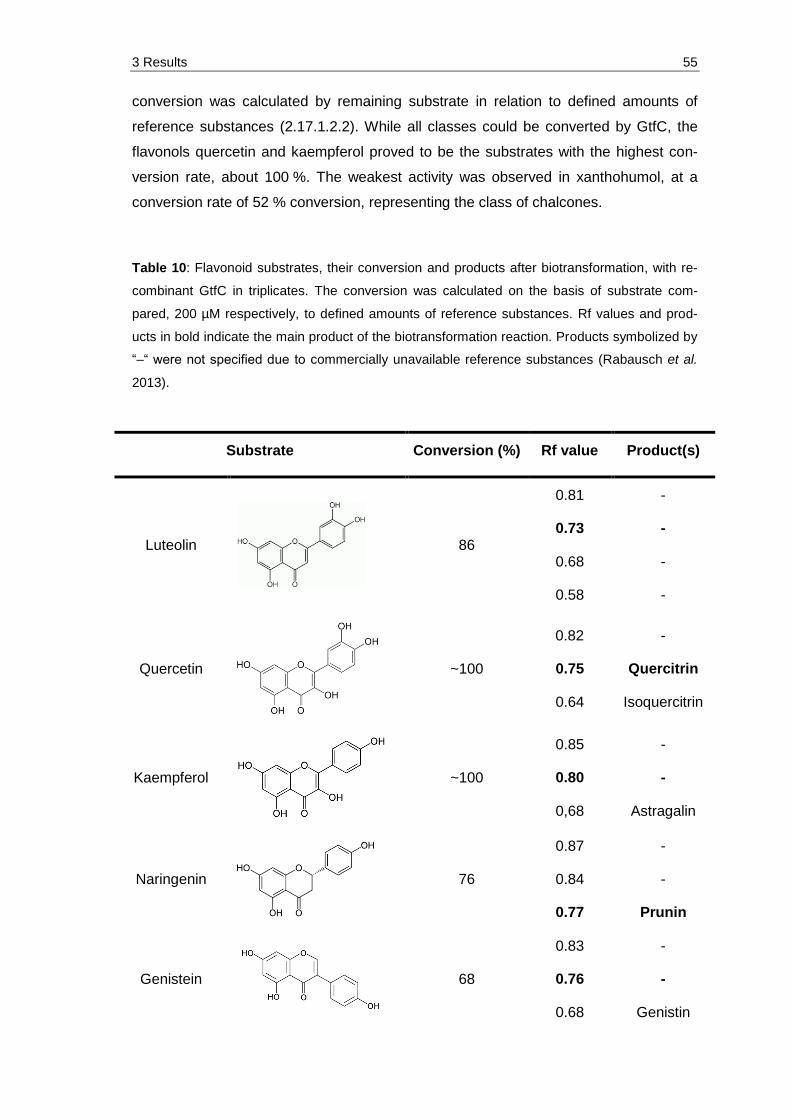
3 Results 55
conversion was calculated by remaining substrate in relation to defined amounts of
reference substances (2.17.1.2.2). While all classes could be converted by GtfC, the
flavonols quercetin and kaempferol proved to be the substrates with the highest con-
version rate, about 100 %. The weakest activity was observed in xanthohumol, at a
conversion rate of 52 % conversion, representing the class of chalcones.
Table 10: Flavonoid substrates, their conversion and products after biotransformation, with re-
combinant GtfC in triplicates. The conversion was calculated on the basis of substrate com-
pared, 200 µM respectively, to defined amounts of reference substances. Rf values and prod-
ucts in bold indicate the main product of the biotransformation reaction. Products symbolized by
“–“ were not specified due to commercially unavailable reference substances (Rabausch et al.
2013).
Substrate Conversion (%) Rf value Product(s)
Luteolin
86
0.81
0.73
0.68
0.58
-
-
-
-
Quercetin
~100
0.82
0.75
0.64
-
Quercitrin
Isoquercitrin
Kaempferol
~100
0.85
0.80
0,68
-
-
Astragalin
Naringenin
76
0.87
0.84
0.77
-
-
Prunin
Genistein
68
0.83
0.76
0.68
-
-
Genistin
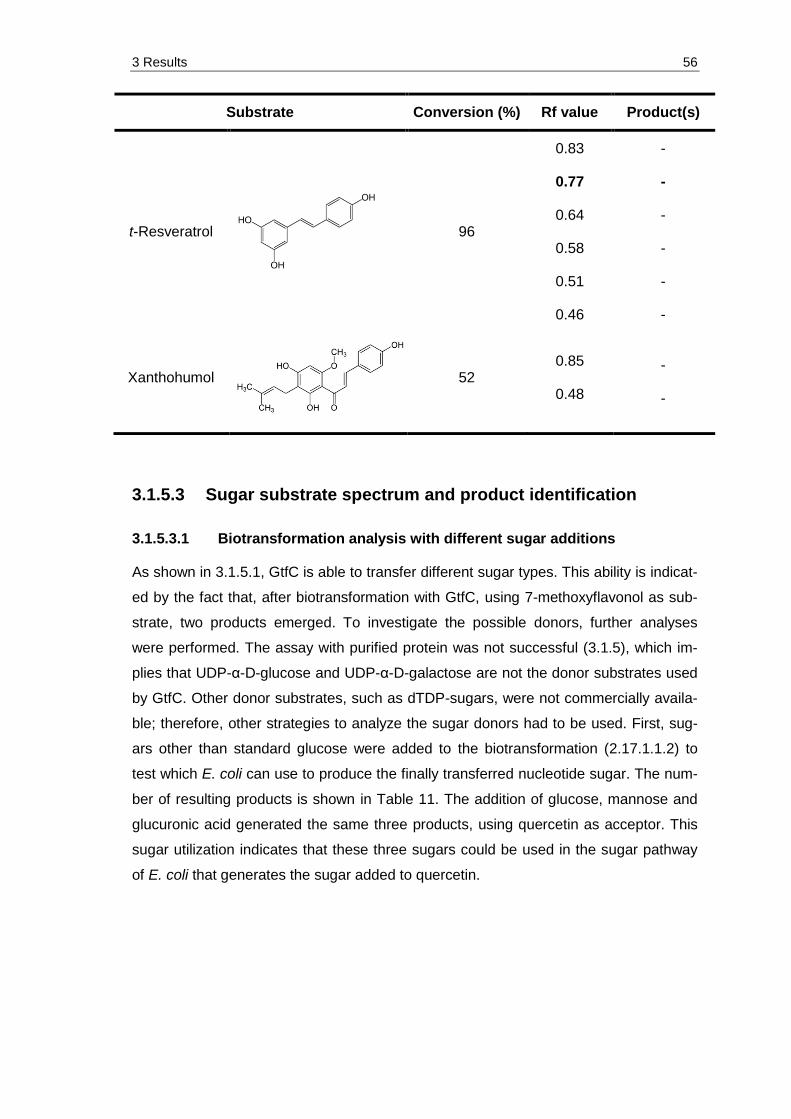
3 Results 56
Substrate Conversion (%) Rf value Product(s)
t-Resveratrol
96
0.83
0.77
0.64
0.58
0.51
0.46
-
-
-
-
-
-
Xanthohumol
52 0.85
0.48
-
-
3.1.5.3 Sugar substrate spectrum and product identification
3.1.5.3.1 Biotransformation analysis with different sugar additions
As shown in 3.1.5.1, GtfC is able to transfer different sugar types. This ability is indicat-
ed by the fact that, after biotransformation with GtfC, using 7-methoxyflavonol as sub-
strate, two products emerged. To investigate the possible donors, further analyses
were performed. The assay with purified protein was not successful (3.1.5), which im-
plies that UDP-α-D-glucose and UDP-α-D-galactose are not the donor substrates used
by GtfC. Other donor substrates, such as dTDP-sugars, were not commercially availa-
ble; therefore, other strategies to analyze the sugar donors had to be used. First, sug-
ars other than standard glucose were added to the biotransformation (2.17.1.1.2) to
test which E. coli can use to produce the finally transferred nucleotide sugar. The num-
ber of resulting products is shown in Table 11. The addition of glucose, mannose and
glucuronic acid generated the same three products, using quercetin as acceptor. This
sugar utilization indicates that these three sugars could be used in the sugar pathway
of E. coli that generates the sugar added to quercetin.
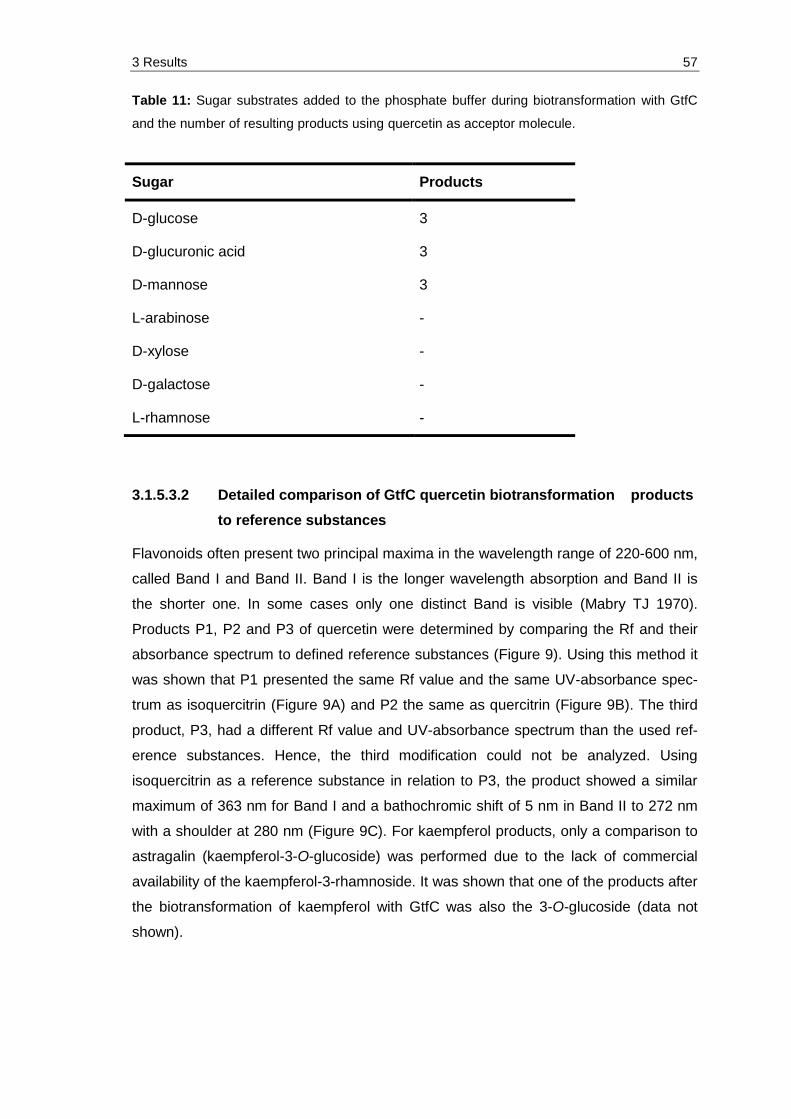
3 Results 57
Table 11: Sugar substrates added to the phosphate buffer during biotransformation with GtfC
and the number of resulting products using quercetin as acceptor molecule.
Sugar Products
D-glucose 3
D-glucuronic acid 3
D-mannose 3
L-arabinose -
D-xylose -
D-galactose -
L-rhamnose -
3.1.5.3.2 Detailed comparison of GtfC quercetin biotransformation products
to reference substances
Flavonoids often present two principal maxima in the wavelength range of 220-600 nm,
called Band I and Band II. Band I is the longer wavelength absorption and Band II is
the shorter one. In some cases only one distinct Band is visible (Mabry TJ 1970).
Products P1, P2 and P3 of quercetin were determined by comparing the Rf and their
absorbance spectrum to defined reference substances (Figure 9). Using this method it
was shown that P1 presented the same Rf value and the same UV-absorbance spec-
trum as isoquercitrin (Figure 9A) and P2 the same as quercitrin (Figure 9B). The third
product, P3, had a different Rf value and UV-absorbance spectrum than the used ref-
erence substances. Hence, the third modification could not be analyzed. Using
isoquercitrin as a reference substance in relation to P3, the product showed a similar
maximum of 363 nm for Band I and a bathochromic shift of 5 nm in Band II to 272 nm
with a shoulder at 280 nm (Figure 9C). For kaempferol products, only a comparison to
astragalin (kaempferol-3-O-glucoside) was performed due to the lack of commercial
availability of the kaempferol-3-rhamnoside. It was shown that one of the products after
the biotransformation of kaempferol with GtfC was also the 3-O-glucoside (data not
shown).
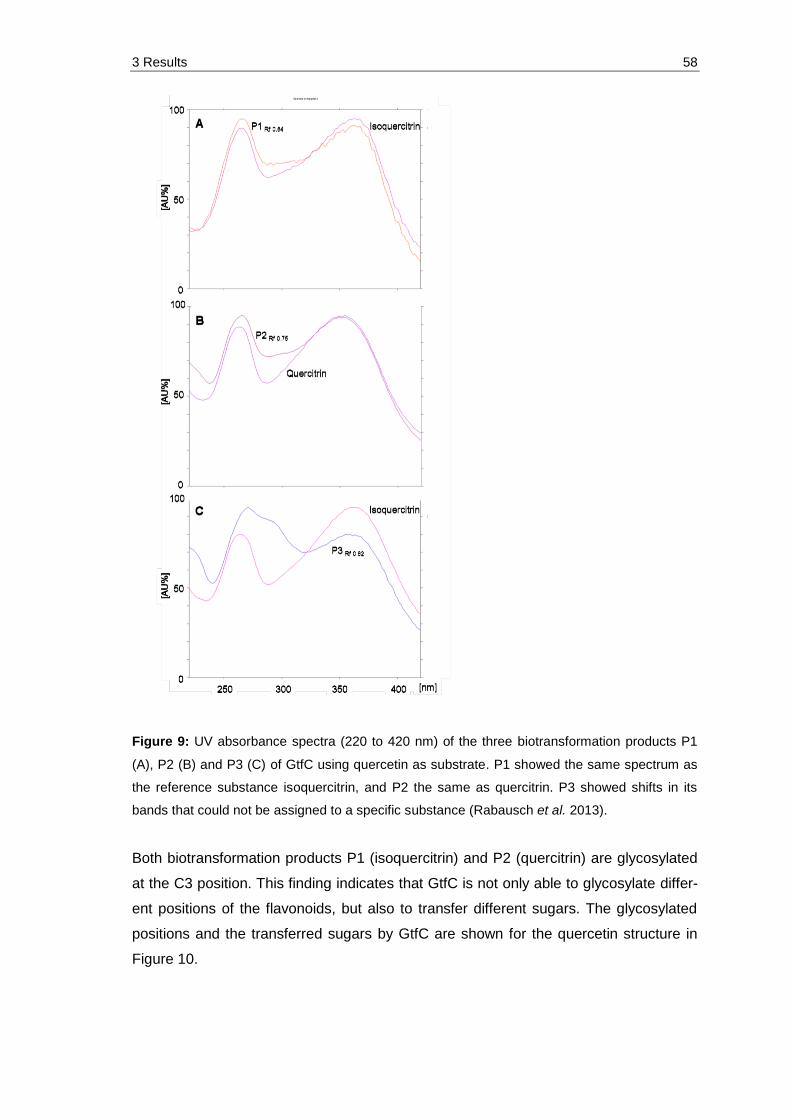
3 Results 58
Figure 9: UV absorbance spectra (220 to 420 nm) of the three biotransformation products P1
(A), P2 (B) and P3 (C) of GtfC using quercetin as substrate. P1 showed the same spectrum as
the reference substance isoquercitrin, and P2 the same as quercitrin. P3 showed shifts in its
bands that could not be assigned to a specific substance (Rabausch et al. 2013).
Both biotransformation products P1 (isoquercitrin) and P2 (quercitrin) are glycosylated
at the C3 position. This finding indicates that GtfC is not only able to glycosylate differ-
ent positions of the flavonoids, but also to transfer different sugars. The glycosylated
positions and the transferred sugars by GtfC are shown for the quercetin structure in
Figure 10.
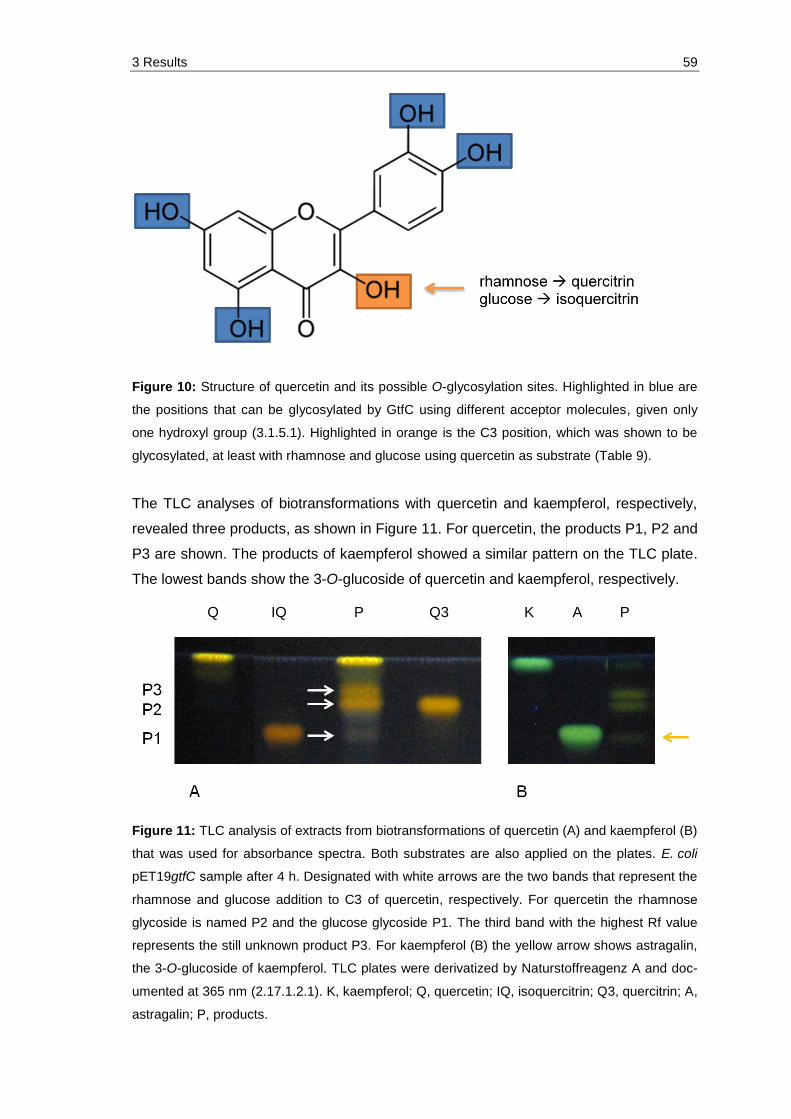
3 Results 59
Figure 10: Structure of quercetin and its possible O-glycosylation sites. Highlighted in blue are
the positions that can be glycosylated by GtfC using different acceptor molecules, given only
one hydroxyl group (3.1.5.1). Highlighted in orange is the C3 position, which was shown to be
glycosylated, at least with rhamnose and glucose using quercetin as substrate (Table 9).
The TLC analyses of biotransformations with quercetin and kaempferol, respectively,
revealed three products, as shown in Figure 11. For quercetin, the products P1, P2 and
P3 are shown. The products of kaempferol showed a similar pattern on the TLC plate.
The lowest bands show the 3-O-glucoside of quercetin and kaempferol, respectively.
Q IQ P Q3 K A P
Figure 11: TLC analysis of extracts from biotransformations of quercetin (A) and kaempferol (B)
that was used for absorbance spectra. Both substrates are also applied on the plates. E. coli
pET19gtfC sample after 4 h. Designated with white arrows are the two bands that represent the
rhamnose and glucose addition to C3 of quercetin, respectively. For quercetin the rhamnose
glycoside is named P2 and the glucose glycoside P1. The third band with the highest Rf value
represents the still unknown product P3. For kaempferol (B) the yellow arrow shows astragalin,
the 3-O-glucoside of kaempferol. TLC plates were derivatized by Naturstoffreagenz A and doc-
umented at 365 nm (2.17.1.2.1). K, kaempferol; Q, quercetin; IQ, isoquercitrin; Q3, quercitrin; A,
astragalin; P, products.

3 Results 60
3.2 Meta(genome)transcriptomic and overcoming
limitations in E. coli
3.2.1 Transcriptomic analysis of E. coli Epi300 carrying different
fosmids
The assumption that E. coli is limited in its transcription when expressing foreign genes
from metagenomes was never further analyzed. To overcome this lack of knowledge a
whole genome transcriptome analysis was performed with E. coli Epi300, each clone
carrying 1 of 24 different fosmids from the elephant feces metagenomic library
(2.3.1.1).
3.2.1.1 Selection of different fosmids
First the chosen metagenomic library of elephant feces was screened for different hy-
drolytic enzyme activities to gain preliminary information about the already existing po-
tential of the elephant feces metagenomic library. Three different screens were per-
formed, a TBT plate screen (2.17.3.1, 2.17.3.1) for the detection of esterases, a congo
red plate screen (2.17.2.1) for the detection of cellulases and the recently published
META screen (2.17.1) to detect flavonoid modifying enzymes. The results are shown in
Table 12. The screening revealed 75 positive clones of which one cellulase was recent-
ly published (Ilmberger et al. 2012), and one α-L-rhamnosidase is submitted for
publicaton (Rabausch et al. 2014).
Table 12: Positive screened clones in the metagenomic library of elephant feces using three
different screening methods.
Screen/Enzyme Positive clones found Reference
META/Flavonoid modifying 1 This work,
(Rabausch et al. 2014)
Congo red/Cellulases 11 N. Ilmberger, personal
communication
TBT/Esterases 63 This work,
(Chow et al. 2012)

3 Results 61
From 24 clones 5 with cellulolytic, 6 with esterolytic activity and 13 randomly chosen
clones, so far, without detected enzymatic activity the fosmid DNA was prepared
(2.6.3), purified (2.6.5), checked for their integrity (2.6.6) and further analyzed via the
454 pyrosequencing (2.13.2). Sequences are depicted in physical maps (Figure ) and
listed in an accession table (Table 28). They were analyzed with respect to their phylo-
genetic affiliation, using NCBI-BLASTN and their highest similarity to known and pub-
lished sequences. Within this scope it could be observed that 13 fosmids belong to the
phylum Bacteroidetes, 2 to the phylum Proteobacteria, 4 to Firmicutes, 1 to
Verrucomicrobia and 4 to Fibrobacteres.
The complete nucleotide sequences of all 24 fosmids were deposited at GenBank with
the following accession numbers: KF540234 (A, pJB28H11), KF540229 & KF540230
(B, pJB17E7), JX188020 (C, pJB16A2), KF540236 (D, pJB42G5), KF540238 (E,
pJB65E1), KF540239 (F, pJB69A5), KF540240 (G, pJB71G8), KF540242 (H,
pJB83B9), KF540245 (I, pJB89E1), KF540246 (J, pJB92C9), KF540248 (K,
pJB102C1), KF540249 (L, pJB135F11), KF540251& KF540252 (M, pJB154B8),
KF540250 (N, pJB148G3), KF540253 & KF540227 (O, pJB190D12), KF540228 (P,
pJB16B1), KF540235 (Q, pJB39A3), KF540237 (R, pJB45G2), KF540241 (S,
pJB77G10), KF540244 (T, pJB84G2), KF540231 & KF540232 (U, pJB18D1),
KF540233 (V, pJB23D10), KF540243 (W, pJB84D8), KF540247 (X, pJB95A1).
These fosmids contained an average insert size of 31.7 kb and in total 492 ORFs.
Genes were annotated, using Clonemanager 9 and NCBI-BLASTN. Physical maps of
each fosmid insert were constructed (Figure 24A&B).
3.2.1.2 Analysis of the transcription levels of the different fosmids
After elucidating the fosmid insert sequences and annotating the ORFs, a
transcriptome analysis was performed to gain insights into the different transcription
levels in E. coli, dependent on the predicted phyla of the fosmids. Therefore, 19 fosmid-
carrying clones, out of the 24 sequenced clones, representing the complete range of
phyla as shown in Figure 12, were evaluated, 5 did not provide good quality in tran-
scription analysis. They are, therefore, not further mentioned. The ORFs were sepa-
rately assigned to a phylum. This assignment was due to the highest similarity using
NCBI BLASTN. If aberrations occurred within one fosmid, the main part of ORFs was
used to allocate the fosmid clone to a phylum. This procedure provides only a rough
classification.
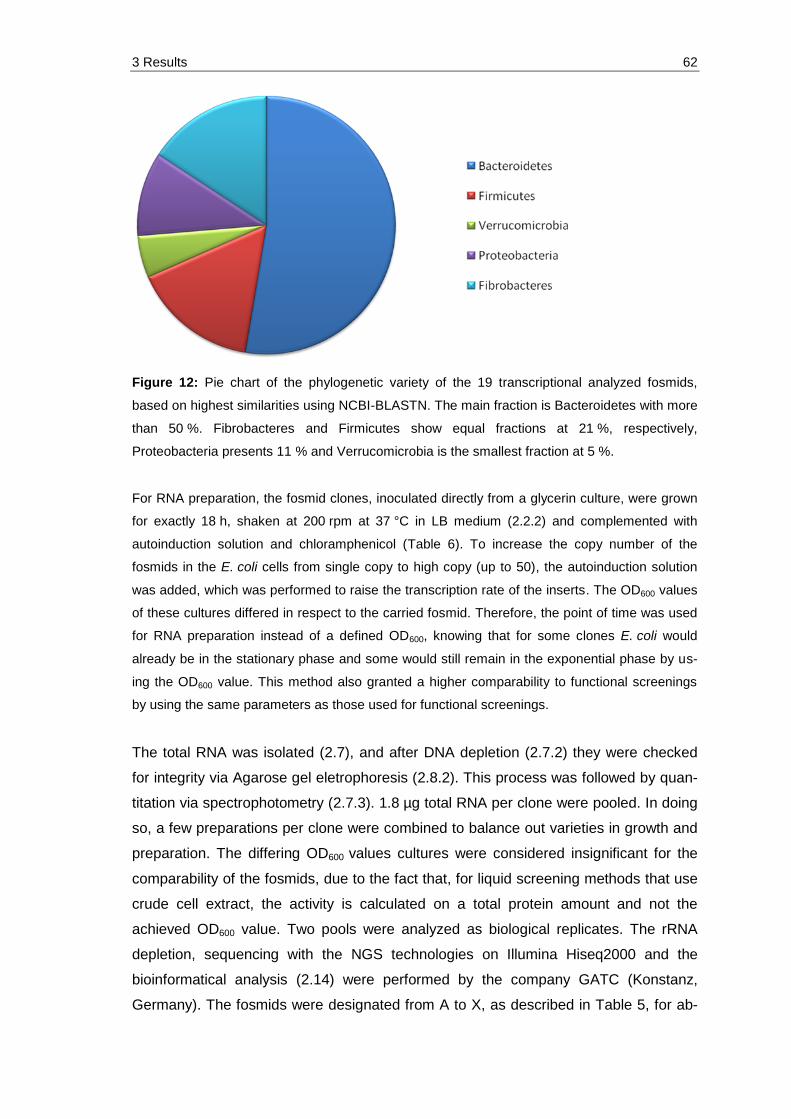
3 Results 62
Figure 12: Pie chart of the phylogenetic variety of the 19 transcriptional analyzed fosmids,
based on highest similarities using NCBI-BLASTN. The main fraction is Bacteroidetes with more
than 50 %. Fibrobacteres and Firmicutes show equal fractions at 21 %, respectively,
Proteobacteria presents 11 % and Verrucomicrobia is the smallest fraction at 5 %.
For RNA preparation, the fosmid clones, inoculated directly from a glycerin culture, were grown
for exactly 18 h, shaken at 200 rpm at 37 °C in LB medium (2.2.2) and complemented with
autoinduction solution and chloramphenicol (Table 6). To increase the copy number of the
fosmids in the E. coli cells from single copy to high copy (up to 50), the autoinduction solution
was added, which was performed to raise the transcription rate of the inserts. The OD600 values
of these cultures differed in respect to the carried fosmid. Therefore, the point of time was used
for RNA preparation instead of a defined OD600, knowing that for some clones E. coli would
already be in the stationary phase and some would still remain in the exponential phase by us-
ing the OD600 value. This method also granted a higher comparability to functional screenings
by using the same parameters as those used for functional screenings.
The total RNA was isolated (2.7), and after DNA depletion (2.7.2) they were checked
for integrity via Agarose gel eletrophoresis (2.8.2). This process was followed by quan-
titation via spectrophotometry (2.7.3). 1.8 µg total RNA per clone were pooled. In doing
so, a few preparations per clone were combined to balance out varieties in growth and
preparation. The differing OD600 values cultures were considered insignificant for the
comparability of the fosmids, due to the fact that, for liquid screening methods that use
crude cell extract, the activity is calculated on a total protein amount and not the
achieved OD600 value. Two pools were analyzed as biological replicates. The rRNA
depletion, sequencing with the NGS technologies on Illumina Hiseq2000 and the
bioinformatical analysis (2.14) were performed by the company GATC (Konstanz,
Germany). The fosmids were designated from A to X, as described in Table 5, for ab-
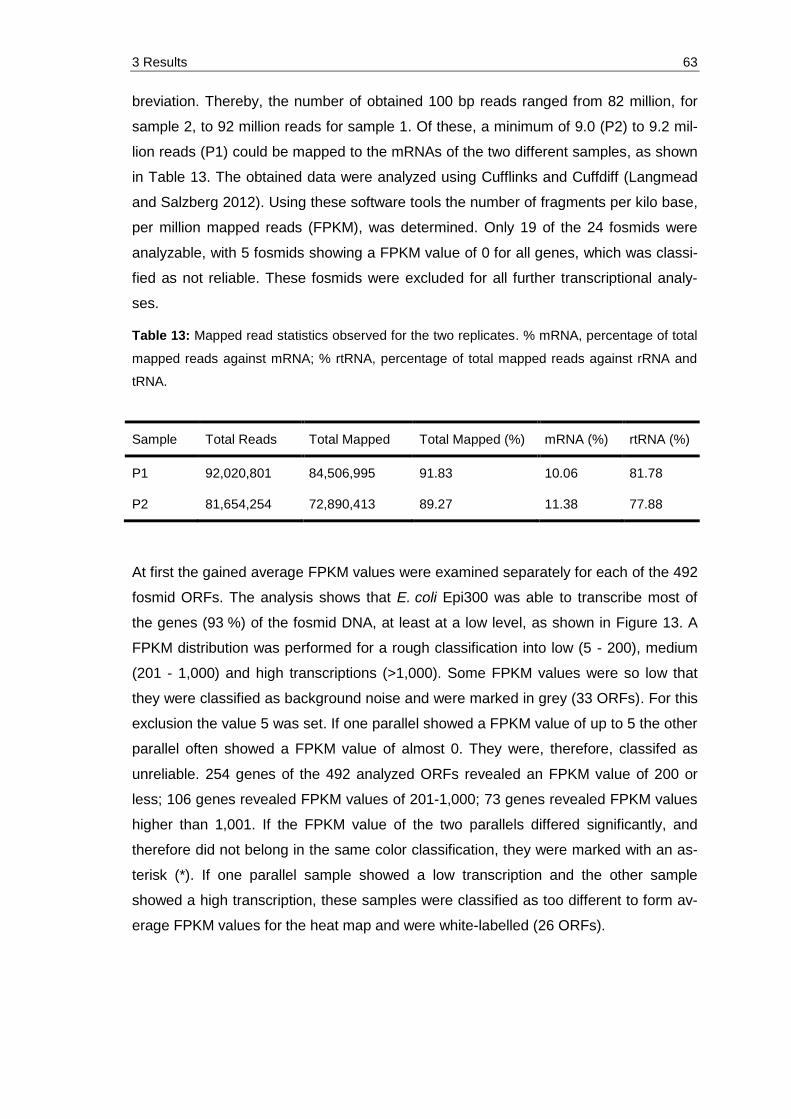
3 Results 63
breviation. Thereby, the number of obtained 100 bp reads ranged from 82 million, for
sample 2, to 92 million reads for sample 1. Of these, a minimum of 9.0 (P2) to 9.2 mil-
lion reads (P1) could be mapped to the mRNAs of the two different samples, as shown
in Table 13. The obtained data were analyzed using Cufflinks and Cuffdiff (Langmead
and Salzberg 2012). Using these software tools the number of fragments per kilo base,
per million mapped reads (FPKM), was determined. Only 19 of the 24 fosmids were
analyzable, with 5 fosmids showing a FPKM value of 0 for all genes, which was classi-
fied as not reliable. These fosmids were excluded for all further transcriptional analy-
ses.
Table 13: Mapped read statistics observed for the two replicates. % mRNA, percentage of total
mapped reads against mRNA; % rtRNA, percentage of total mapped reads against rRNA and
tRNA.
Sample Total Reads Total Mapped Total Mapped (%) mRNA (%) rtRNA (%)
P1 92,020,801 84,506,995 91.83 10.06 81.78
P2 81,654,254 72,890,413 89.27 11.38 77.88
At first the gained average FPKM values were examined separately for each of the 492
fosmid ORFs. The analysis shows that E. coli Epi300 was able to transcribe most of
the genes (93 %) of the fosmid DNA, at least at a low level, as shown in Figure 13. A
FPKM distribution was performed for a rough classification into low (5 - 200), medium
(201 - 1,000) and high transcriptions (>1,000). Some FPKM values were so low that
they were classified as background noise and were marked in grey (33 ORFs). For this
exclusion the value 5 was set. If one parallel showed a FPKM value of up to 5 the other
parallel often showed a FPKM value of almost 0. They were, therefore, classifed as
unreliable. 254 genes of the 492 analyzed ORFs revealed an FPKM value of 200 or
less; 106 genes revealed FPKM values of 201-1,000; 73 genes revealed FPKM values
higher than 1,001. If the FPKM value of the two parallels differed significantly, and
therefore did not belong in the same color classification, they were marked with an as-
terisk (*). If one parallel sample showed a low transcription and the other sample
showed a high transcription, these samples were classified as too different to form av-
erage FPKM values for the heat map and were white-labelled (26 ORFs).

3 Results 64
Figure 13: Heatmap of all 492 elucidated ORFs in E. coli Epi300 based on their FPKM value,
separated in the fosmids. The colors were given due to the FPKM values in the following order:
grey, 0.1-5; yellow, 5-200; light orange, 201-1,000; red, more than 1,000, *, the two parallels did
not belong to the same color code and the average was used; white, the two parallels were too
differing (one parallel yellow, the other one red).
The transcriptome data were allocated according to the originated phyla of the specific
fosmids. The distribution of the specific fosmids to the phyla is shown in Table 14, in-
cluding their highest average FPKM value for the concerned phy-lum, the correspond-
ent analyzed fosmid clones and the corresponding number of ORFs. Just regarding the
phyla and their highest FPKM value, Bacteroidetes is the best transcribed phylum by
far, followed by Proteobacteria and Firmicutes. Fibrobacteres and Verrucomicrobia are
the least transcribed phyla.
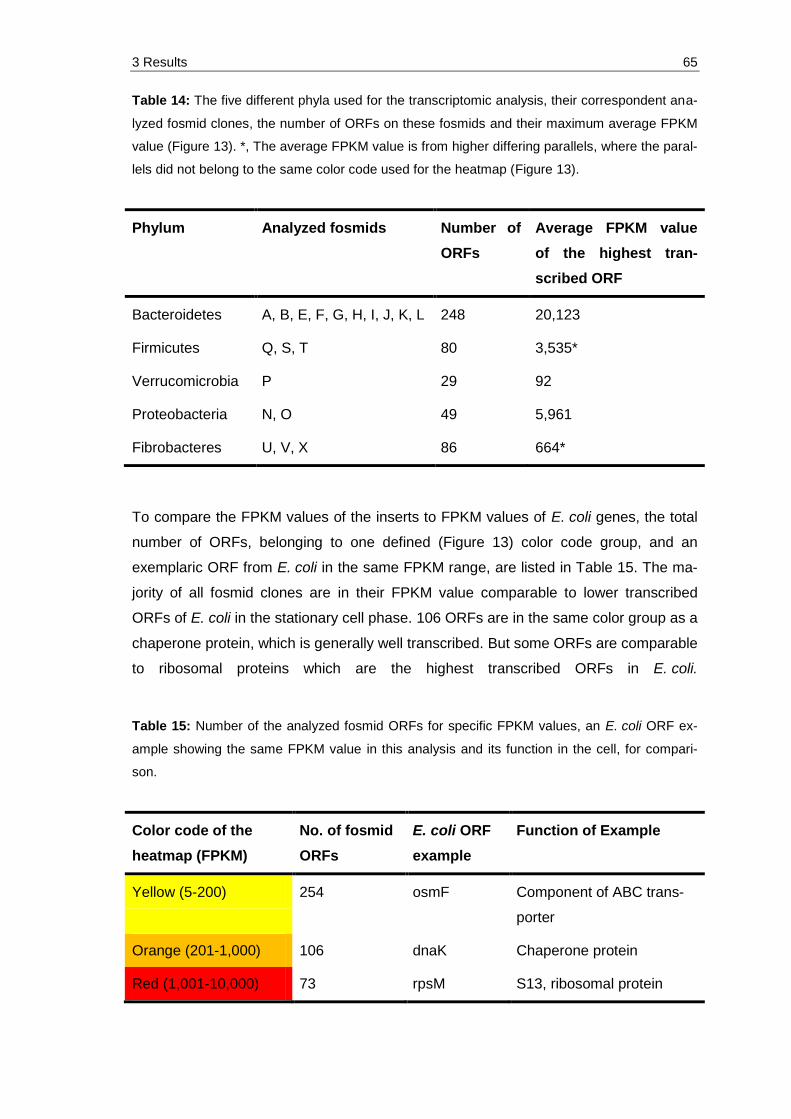
3 Results 65
Table 14: The five different phyla used for the transcriptomic analysis, their correspondent ana-
lyzed fosmid clones, the number of ORFs on these fosmids and their maximum average FPKM
value (Figure 13). *, The average FPKM value is from higher differing parallels, where the paral-
lels did not belong to the same color code used for the heatmap (Figure 13).
Phylum Analyzed fosmids Number of
ORFs
Average FPKM value
of the highest tran-
scribed ORF
Bacteroidetes A, B, E, F, G, H, I, J, K, L 248 20,123
Firmicutes Q, S, T 80 3,535*
Verrucomicrobia P 29 92
Proteobacteria N, O 49 5,961
Fibrobacteres U, V, X 86 664*
To compare the FPKM values of the inserts to FPKM values of E. coli genes, the total
number of ORFs, belonging to one defined (Figure 13) color code group, and an
exemplaric ORF from E. coli in the same FPKM range, are listed in Table 15. The ma-
jority of all fosmid clones are in their FPKM value comparable to lower transcribed
ORFs of E. coli in the stationary cell phase. 106 ORFs are in the same color group as a
chaperone protein, which is generally well transcribed. But some ORFs are comparable
to ribosomal proteins which are the highest transcribed ORFs in E. coli.
Table 15: Number of the analyzed fosmid ORFs for specific FPKM values, an E. coli ORF ex-
ample showing the same FPKM value in this analysis and its function in the cell, for compari-
son.
Color code of the
heatmap (FPKM)
No. of fosmid
ORFs
E. coli ORF
example
Function of Example
Yellow (5-200) 254 osmF Component of ABC trans-
porter
Orange (201-1,000) 106 dnaK Chaperone protein
Red (1,001-10,000) 73 rpsM S13, ribosomal protein

3 Results 66
For a more detailed comparison between the transcription rate of the fosmids and the
E. coli genes, a further diagram was designed using Circos software. The diagram de-
picts each ORF, E. coli and fosmid, showing their FPKM value and their given classifi-
cation. It shows all 19 analyzed fosmids and the whole E. coli genome with their tran-
scription level per ORF. Due to the fact that the sequence of E. coli Epi300 is not pub-
lished, the genome of E. coli K12 substrain MG1655 (NCBI) was used as reference. In
the diagram, the lowest 10 % of E. coli genes were colored red, the highest 10 % tran-
scribed genes were colored in green and the average, 80 %, were colored black. The
comparison of transcription rates of the different phyla is not distinct because the
amount of analyzed clones per phylum varies. Nevertheless, a trend was observable.
Regarding the phyla of the fosmids, the circos diagram in Figure 14 confirms that
Verrucomicrobia seems to be the least transcribed phylum in E. coli, with 97 % of its
ORFs marked in red. Therefore, it belongs to the lowest 10 % transcribed ORFs of
E. coli. Bacteroidetes is thus the best transcribed phylum with about 51 % of its genes
transcribed in the green part and 30 % in the average area. Fibrobacteres and
Firmicutes show a rather similar distribution. With both rather few genes are in the high
transcribed area but 72 % are in the lowest for Fibrobacteres and 62 % for Firmicutes.
Proteobacteria have their highest percentage in the black, average area (47 %) of tran-
scription, 33 % in the green area and 20 % in the red.
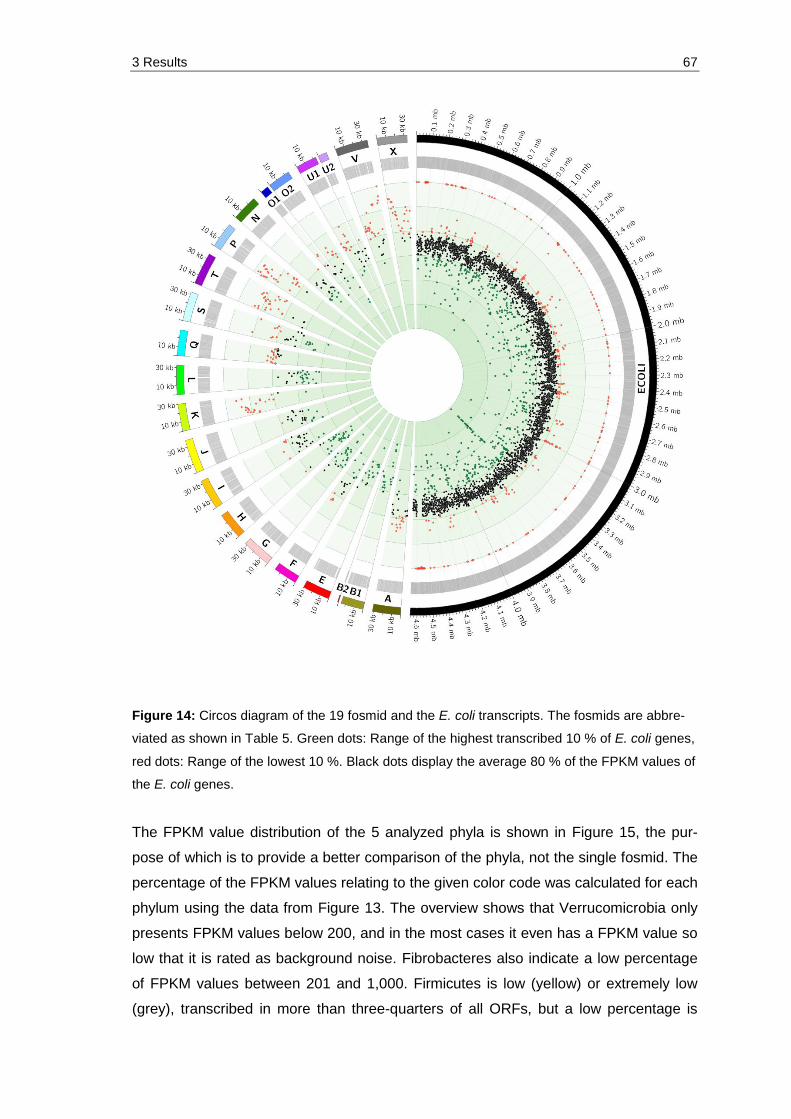
3 Results 67
Figure 14: Circos diagram of the 19 fosmid and the E. coli transcripts. The fosmids are abbre-
viated as shown in Table 5. Green dots: Range of the highest transcribed 10 % of E. coli genes,
red dots: Range of the lowest 10 %. Black dots display the average 80 % of the FPKM values of
the E. coli genes.
The FPKM value distribution of the 5 analyzed phyla is shown in Figure 15, the pur-
pose of which is to provide a better comparison of the phyla, not the single fosmid. The
percentage of the FPKM values relating to the given color code was calculated for each
phylum using the data from Figure 13. The overview shows that Verrucomicrobia only
presents FPKM values below 200, and in the most cases it even has a FPKM value so
low that it is rated as background noise. Fibrobacteres also indicate a low percentage
of FPKM values between 201 and 1,000. Firmicutes is low (yellow) or extremely low
(grey), transcribed in more than three-quarters of all ORFs, but a low percentage is
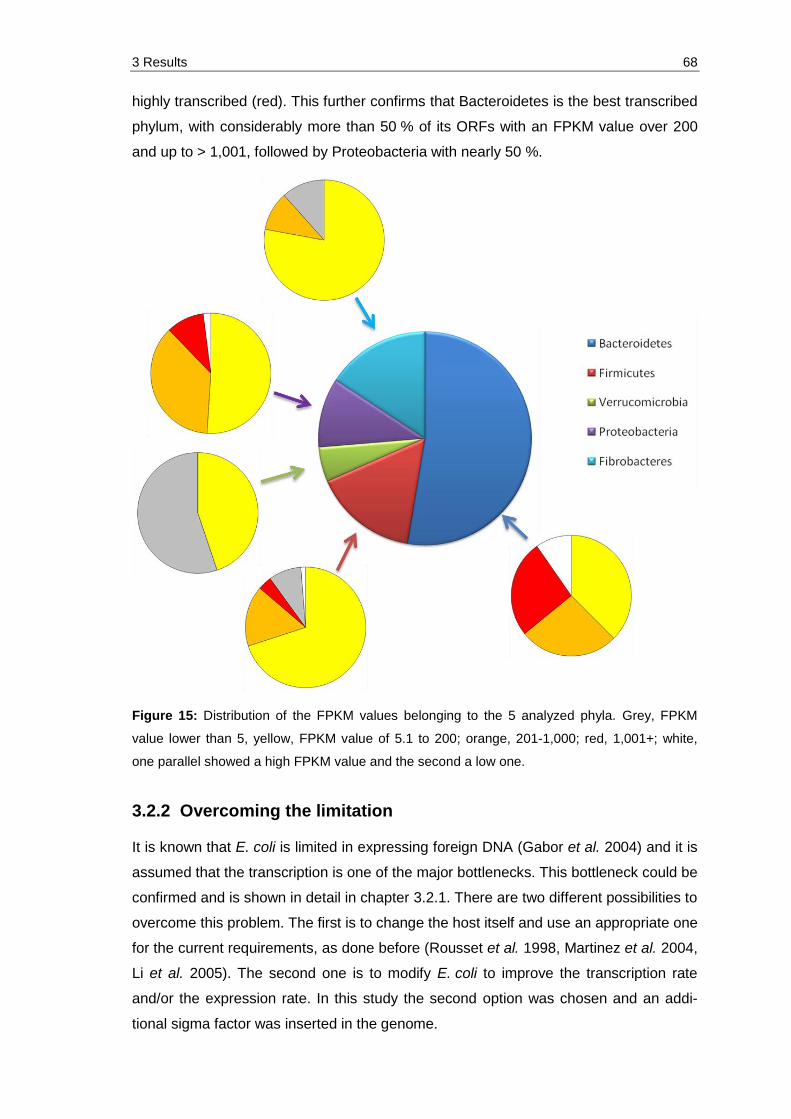
3 Results 68
highly transcribed (red). This further confirms that Bacteroidetes is the best transcribed
phylum, with considerably more than 50 % of its ORFs with an FPKM value over 200
and up to > 1,001, followed by Proteobacteria with nearly 50 %.
Figure 15: Distribution of the FPKM values belonging to the 5 analyzed phyla. Grey, FPKM
value lower than 5, yellow, FPKM value of 5.1 to 200; orange, 201-1,000; red, 1,001+; white,
one parallel showed a high FPKM value and the second a low one.
3.2.2 Overcoming the limitation
It is known that E. coli is limited in expressing foreign DNA (Gabor et al. 2004) and it is
assumed that the transcription is one of the major bottlenecks. This bottleneck could be
confirmed and is shown in detail in chapter 3.2.1. There are two different possibilities to
overcome this problem. The first is to change the host itself and use an appropriate one
for the current requirements, as done before (Rousset et al. 1998, Martinez et al. 2004,
Li et al. 2005). The second one is to modify E. coli to improve the transcription rate
and/or the expression rate. In this study the second option was chosen and an addi-
tional sigma factor was inserted in the genome.
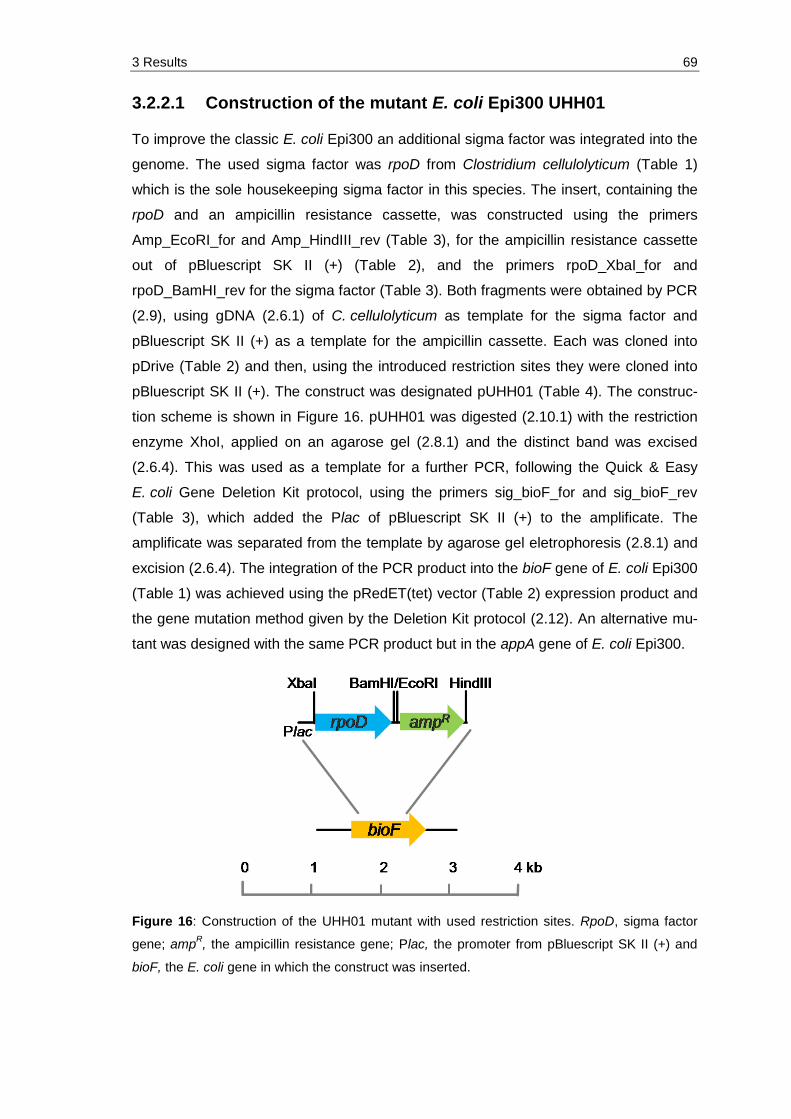
3 Results 69
3.2.2.1 Construction of the mutant E. coli Epi300 UHH01
To improve the classic E. coli Epi300 an additional sigma factor was integrated into the
genome. The used sigma factor was rpoD from Clostridium cellulolyticum (Table 1)
which is the sole housekeeping sigma factor in this species. The insert, containing the
rpoD and an ampicillin resistance cassette, was constructed using the primers
Amp_EcoRI_for and Amp_HindIII_rev (Table 3), for the ampicillin resistance cassette
out of pBluescript SK II (+) (Table 2), and the primers rpoD_XbaI_for and
rpoD_BamHI_rev for the sigma factor (Table 3). Both fragments were obtained by PCR
(2.9), using gDNA (2.6.1) of C. cellulolyticum as template for the sigma factor and
pBluescript SK II (+) as a template for the ampicillin cassette. Each was cloned into
pDrive (Table 2) and then, using the introduced restriction sites they were cloned into
pBluescript SK II (+). The construct was designated pUHH01 (Table 4). The construc-
tion scheme is shown in Figure 16. pUHH01 was digested (2.10.1) with the restriction
enzyme XhoI, applied on an agarose gel (2.8.1) and the distinct band was excised
(2.6.4). This was used as a template for a further PCR, following the Quick & Easy
E. coli Gene Deletion Kit protocol, using the primers sig_bioF_for and sig_bioF_rev
(Table 3), which added the Plac of pBluescript SK II (+) to the amplificate. The
amplificate was separated from the template by agarose gel eletrophoresis (2.8.1) and
excision (2.6.4). The integration of the PCR product into the bioF gene of E. coli Epi300
(Table 1) was achieved using the pRedET(tet) vector (Table 2) expression product and
the gene mutation method given by the Deletion Kit protocol (2.12). An alternative mu-
tant was designed with the same PCR product but in the appA gene of E. coli Epi300.
Figure 16: Construction of the UHH01 mutant with used restriction sites. RpoD, sigma factor
gene; ampR, the ampicillin resistance gene; Plac, the promoter from pBluescript SK II (+) and
bioF, the E. coli gene in which the construct was inserted.
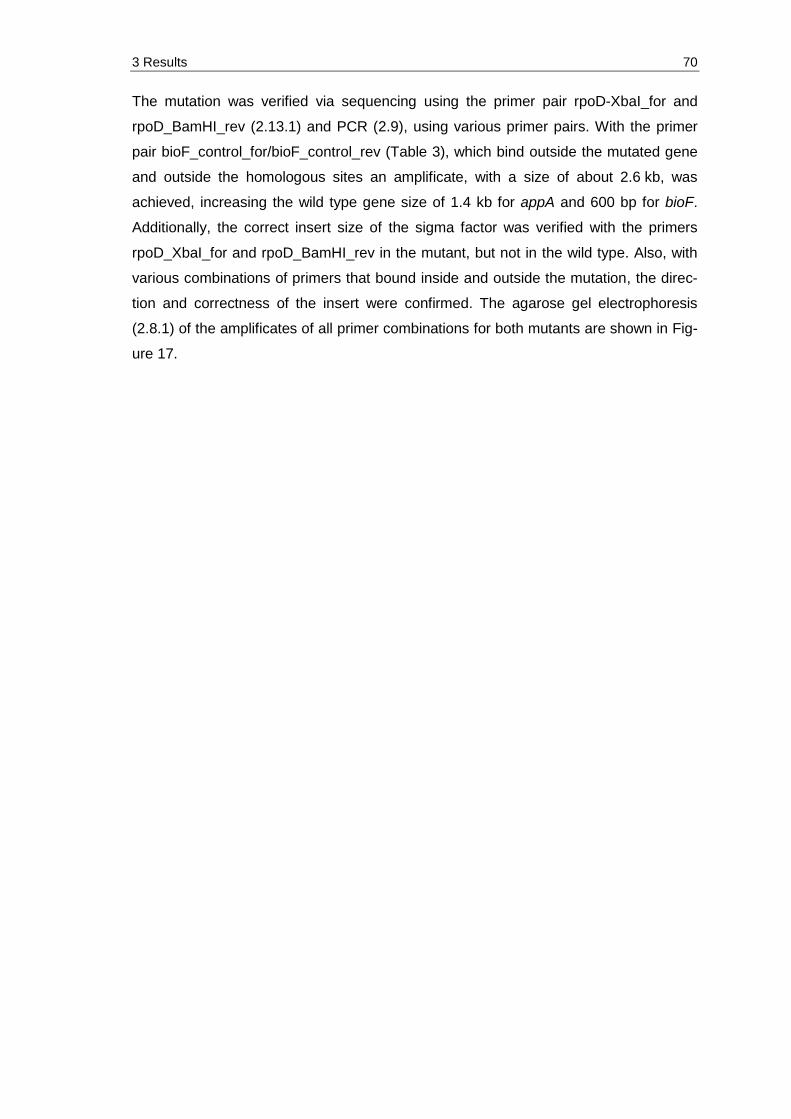
3 Results 70
The mutation was verified via sequencing using the primer pair rpoD-XbaI_for and
rpoD_BamHI_rev (2.13.1) and PCR (2.9), using various primer pairs. With the primer
pair bioF_control_for/bioF_control_rev (Table 3), which bind outside the mutated gene
and outside the homologous sites an amplificate, with a size of about 2.6 kb, was
achieved, increasing the wild type gene size of 1.4 kb for appA and 600 bp for bioF.
Additionally, the correct insert size of the sigma factor was verified with the primers
rpoD_XbaI_for and rpoD_BamHI_rev in the mutant, but not in the wild type. Also, with
various combinations of primers that bound inside and outside the mutation, the direc-
tion and correctness of the insert were confirmed. The agarose gel electrophoresis
(2.8.1) of the amplificates of all primer combinations for both mutants are shown in Fig-
ure 17.

3 Results 71
1 M 2 3 4 5 6 7 8 9 10 11 12
Figure 17: PCR products for the appA and bioF mutant. The upper part shows the integration in
appA the part below shows the bioF mutant. Band 1 represents the 1 kb ladder. Band 2 and 3
using rpoD_XbaI_for and rpoD_BamHI_rev to amplificat the rpoD about 1.1 kb for the mutant
(2) and no amplificat for the wild type (3). Band 4 and 5 using rpoD_XbaI_for and
bioF/appA_control_rev with an estimated size of about 2.2 kb for the mutant (4) and the wild
type (5). Band 6 and 7 using bioF/appA_control_for and Amp_HindIII_rev with an estimated size
of 2.5 kb for the mutant. The mutant is shown in band 6, the wild type in band 7. Band 8 and 9
using the primer pair rpoD_control_for and bioF/appA_control_rev with an estimated size of 1.7
kb for the mutant. For appA the mutant is shown in band 8 and the wild type in band 9, for bioF
the order is inverted. Band 10 and 11 display the PCR product using the primers
bioF/appA_control_for and bioF/appA_control_rev with an estimated size of 2.6 kb for the mu-
tant (10) and 600 bp for the bioF wild type of and 1.4 kb for the appA wild type (11). Band 12
displays the negative control without DNA supplemented, showing that the wild type band in the
mutant is due to the recombinant Taq polymerase.

3 Results 72
3.2.3 Measuring the changed growth behavior
3.2.3.1 Standard growth curve
To gain a first indication of the impact of the additional sigma factors, a standard
growth curve was performed with the mutant strain UHH01 and the parental strain
E. coli Epi300 (Table 1) in three parallels each. 20 ml of LB (2.2.2) was inoculated with
an overnight preculture of up to an OD600 of 0.01 and shaken at 200 rpm at 37 °C for
18 h, while measuring them hourly. The data are shown in Figure 18. It could be shown
that the mutant strain was still able to replicate. UHH01 and E. coli Epi300 nearly
showed identical growth behavior over the 18 h. The growth curve is shown for the
mutation in the bioF gene, the strain with the mutation in the appA gene grew identical-
ly. Only one strain (bioF) was used for all further analyses.
Figure 18: Growth curve of the parental strain E. coli Epi300 in comparison to the mutant strain
UHH01 over 18 h in LB medium. 3 parallels were performed; the standard deviations are shown
as bars.
3.2.3.2 Growth curve with induction
Because the modified strain carried Plac upstream of the inserted sigma factor growth
was assayed in the presence of IPTG. Again, a 20 ml LB medium (2.2.2), this time
supplemented with 1 mM IPTG (Table 6), was inoculated with an overnight preculture
until an OD600 of 0.01 was reached. These cultures, done in triples, were shaken at
200 rpm at 37 °C for 18 h and measured hourly. The data are shown in Figure 19. All
the cultures achieved a slightly higher OD600 than the uninduced ones (Figure 18). The
strain UHH01 and its parental strain E. coli Epi300 were still mostly identical in their
growth behavior.
3 Results 73
Figure 19: Growth curve of the parental strain E. coli Epi300 compared to the mutant UHH01,
over 18 h in LB medium induced with 1 mM IPTG. 3 parallels were performed; the standard
deviations are shown as bars.
3.2.4 Activity analyses of Epi300 and the mutant UHH01
After verifying that the growth behavior of the strain was not affected by the sigma fac-
tors, activity analyses were performed. To test for differences, 24 fosmids from the ele-
phant feces library (2.3.1.1, 2.15) were selected, either by already known activity (5
cellulase, 6 esterase, 1 putative flavonoid modifying, which showed also cellulolytic
activity, (Table 12) or randomly, for the statistics, as already mentioned in 3.2.1.1.
UHH01 (Table 1) was transformed via heat shock (2.11.1) with the prepared fosmids
(2.6.3).
3.2.4.1 Plate screening analyses
Two different screening methods were chosen. The congo red screen for detecting
cellulolytic activity and the TBT screening method for the detection of esterolytic activi-
ty. For both screening methods 1 µl of each culture, directly from the glycerine culture,
were dotted on the plates for comparability of the colonies and, therefore, their devel-
oping halos. All plates used contained 12.5 µg chloramphenicol (Table 6).
3.2.4.1.1 TBT screening
For both strains all 24 fosmids were tested on TBT plates (2.17.3.1) for 5 days at
37 °C. The results of the test are shown in Table 16, delineating the halo sizes around
the colonies. No new active clones could be detected by using the plate screening
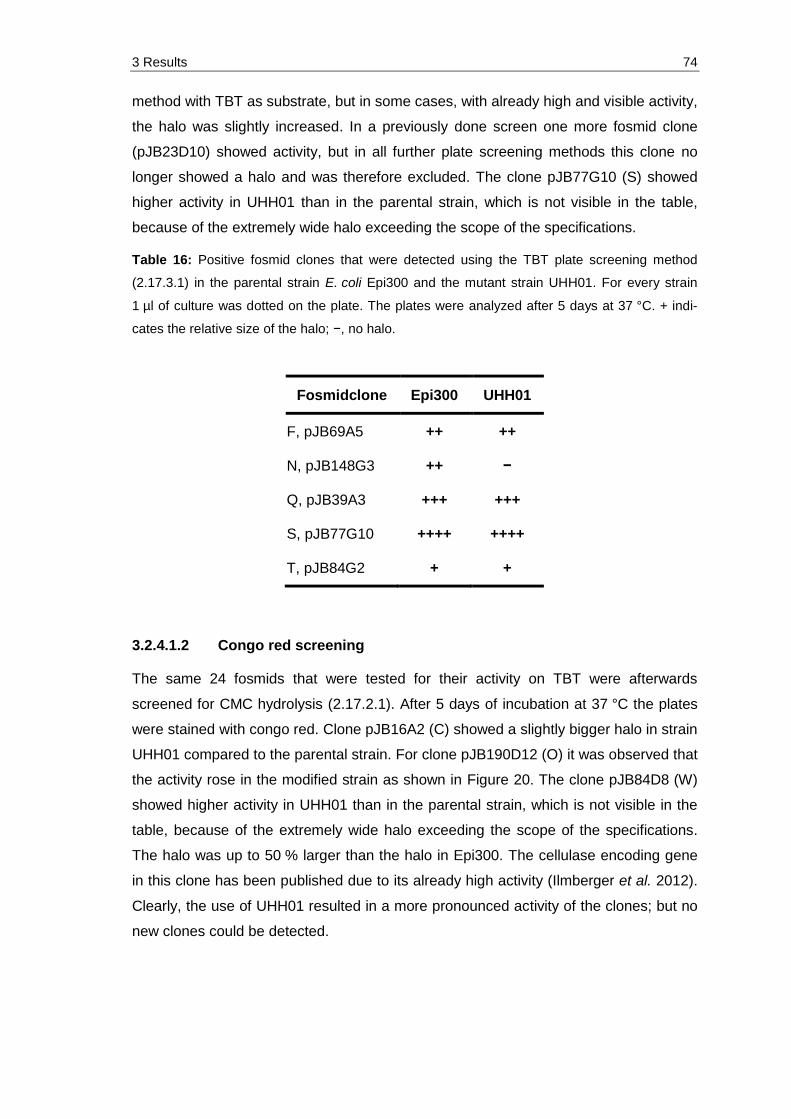
3 Results 74
method with TBT as substrate, but in some cases, with already high and visible activity,
the halo was slightly increased. In a previously done screen one more fosmid clone
(pJB23D10) showed activity, but in all further plate screening methods this clone no
longer showed a halo and was therefore excluded. The clone pJB77G10 (S) showed
higher activity in UHH01 than in the parental strain, which is not visible in the table,
because of the extremely wide halo exceeding the scope of the specifications.
Table 16: Positive fosmid clones that were detected using the TBT plate screening method
(2.17.3.1) in the parental strain E. coli Epi300 and the mutant strain UHH01. For every strain
1 µl of culture was dotted on the plate. The plates were analyzed after 5 days at 37 °C. + indi-
cates the relative size of the halo; −, no halo.
Fosmidclone Epi300 UHH01
F, pJB69A5 ++ ++
N, pJB148G3 ++ −
Q, pJB39A3 +++ +++
S, pJB77G10 ++++ ++++
T, pJB84G2 + +
3.2.4.1.2 Congo red screening
The same 24 fosmids that were tested for their activity on TBT were afterwards
screened for CMC hydrolysis (2.17.2.1). After 5 days of incubation at 37 °C the plates
were stained with congo red. Clone pJB16A2 (C) showed a slightly bigger halo in strain
UHH01 compared to the parental strain. For clone pJB190D12 (O) it was observed that
the activity rose in the modified strain as shown in Figure 20. The clone pJB84D8 (W)
showed higher activity in UHH01 than in the parental strain, which is not visible in the
table, because of the extremely wide halo exceeding the scope of the specifications.
The halo was up to 50 % larger than the halo in Epi300. The cellulase encoding gene
in this clone has been published due to its already high activity (Ilmberger et al. 2012).
Clearly, the use of UHH01 resulted in a more pronounced activity of the clones; but no
new clones could be detected.
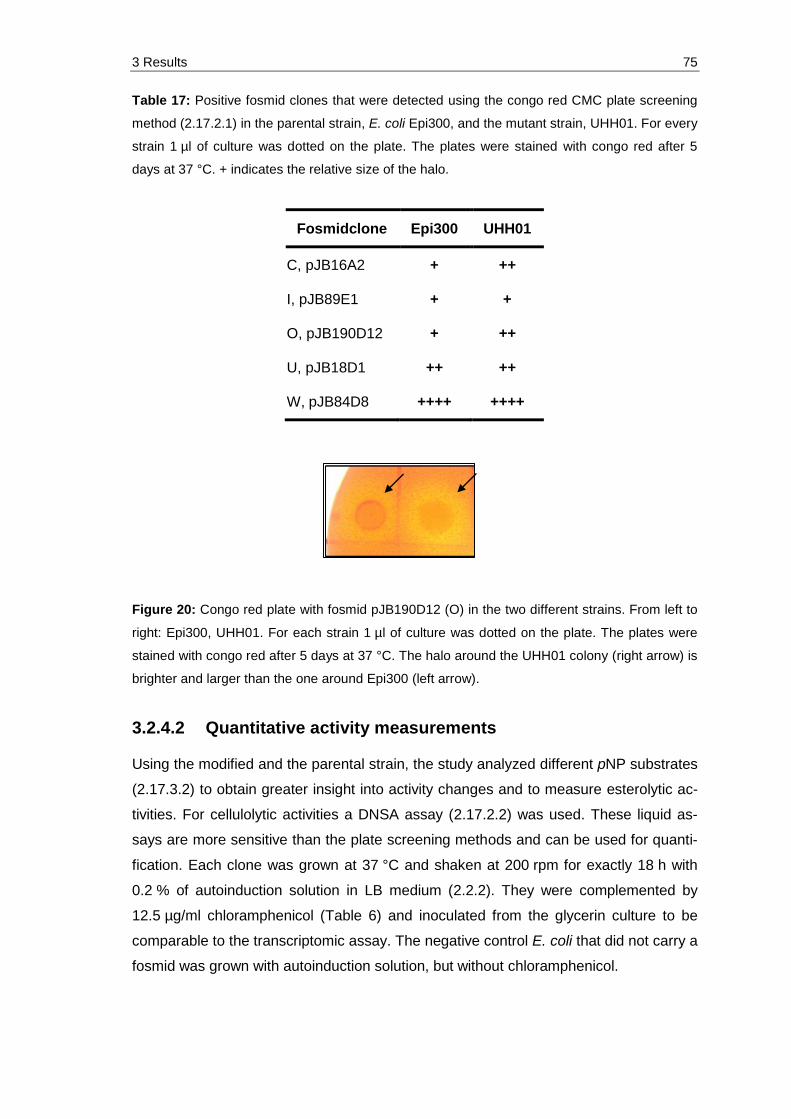
3 Results 75
Table 17: Positive fosmid clones that were detected using the congo red CMC plate screening
method (2.17.2.1) in the parental strain, E. coli Epi300, and the mutant strain, UHH01. For every
strain 1 µl of culture was dotted on the plate. The plates were stained with congo red after 5
days at 37 °C. + indicates the relative size of the halo.
Fosmidclone Epi300 UHH01
C, pJB16A2 + ++
I, pJB89E1 + +
O, pJB190D12 + ++
U, pJB18D1 ++ ++
W, pJB84D8 ++++ ++++
Figure 20: Congo red plate with fosmid pJB190D12 (O) in the two different strains. From left to
right: Epi300, UHH01. For each strain 1 µl of culture was dotted on the plate. The plates were
stained with congo red after 5 days at 37 °C. The halo around the UHH01 colony (right arrow) is
brighter and larger than the one around Epi300 (left arrow).
3.2.4.2 Quantitative activity measurements
Using the modified and the parental strain, the study analyzed different pNP substrates
(2.17.3.2) to obtain greater insight into activity changes and to measure esterolytic ac-
tivities. For cellulolytic activities a DNSA assay (2.17.2.2) was used. These liquid as-
says are more sensitive than the plate screening methods and can be used for quanti-
fication. Each clone was grown at 37 °C and shaken at 200 rpm for exactly 18 h with
0.2 % of autoinduction solution in LB medium (2.2.2). They were complemented by
12.5 µg/ml chloramphenicol (Table 6) and inoculated from the glycerin culture to be
comparable to the transcriptomic assay. The negative control E. coli that did not carry a
fosmid was grown with autoinduction solution, but without chloramphenicol.
3 Results 76
3.2.4.2.1 Esterolytic activities using pNP substrates
To measure esterolytic activities, two different carbon backbone chain lengths were
chosen, C4 and C8. The reaction was carried out using crude cell extract for 30 min at
37 °C. Each reaction contained 1 mM pNP substrate (2.17.3.2) and was later meas-
ured at 405 nm.
Using pNP-butyrate (C4) as substrate, 4 fosmids showed activity in both strains. Activi-
ty of pJB39A3 was only detected in the mutant strain, UHH01. The results are summa-
rized in Table 18. Due to the already high activity of pJB77G10, the increased activity
using UHH01 is not visible in the table.
Table 18: Esterolytic activities in Epi300 and its derivative UHH01 using 1 mM pNP-butyrate as
substrate in a liquid quantitative screening. Calculated on the basis of relative activities per mg
protein of crude cell extracts, subtracting the background activity of E. coli. The measurement
was done after an incubation with the substrate for 30 min at 37 °C and afterwards measured at
405 nm. −, no activity; +, low activity; ++, medium activity; +++ high activity; ++++ very high
activity.
Fosmidclone Epi300 UHH01
F, pJB69A5 +++ ++++
N, pJB148G3 +++ ++++
Q, pJB39A3 − +++
S, pJB77G10 ++++ ++++
T, pJB84G2 +++ ++
The measurements with pNP-octanoate as substrate showed an even higher spectrum
of improved activities than that for pNP-butyrate, but the discovery rate overall, using
the longer C-chain was less than that for C4. The results are shown in Table 19. Both
strains that were also active in the parental strain showed improved activity in the mu-
tant strain and two clones were only detectable in UHH01.
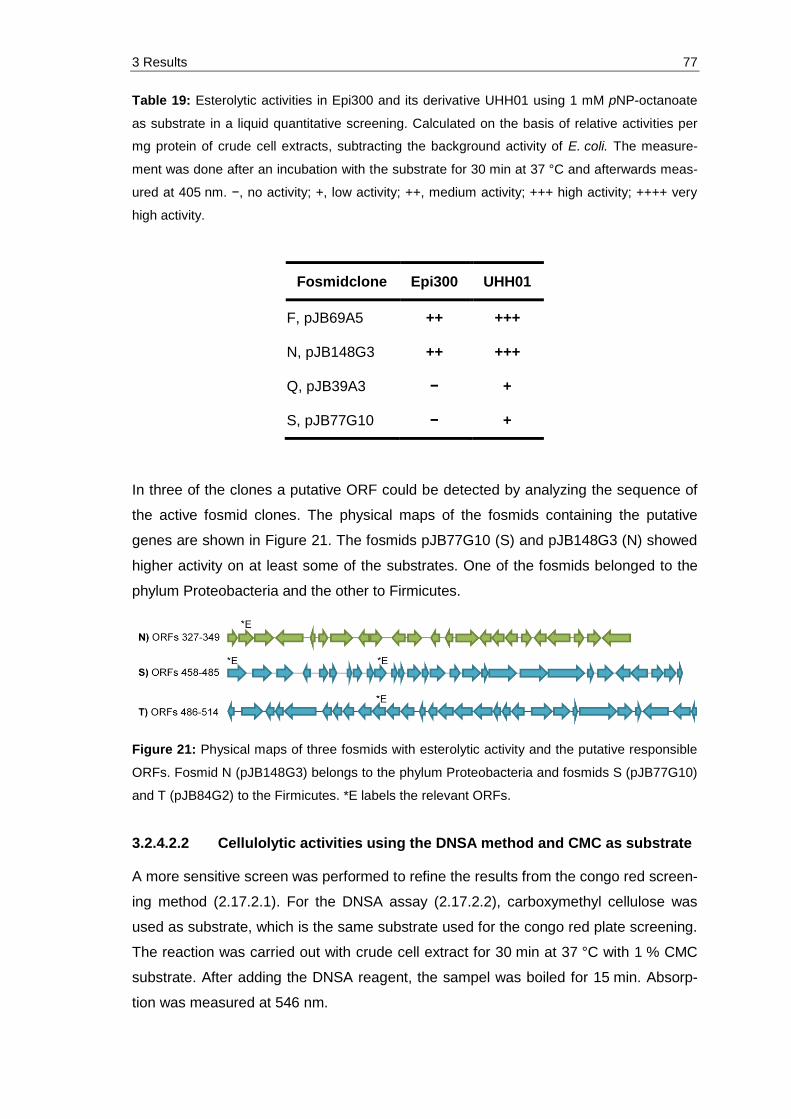
3 Results 77
Table 19: Esterolytic activities in Epi300 and its derivative UHH01 using 1 mM pNP-octanoate
as substrate in a liquid quantitative screening. Calculated on the basis of relative activities per
mg protein of crude cell extracts, subtracting the background activity of E. coli. The measure-
ment was done after an incubation with the substrate for 30 min at 37 °C and afterwards meas-
ured at 405 nm. −, no activity; +, low activity; ++, medium activity; +++ high activity; ++++ very
high activity.
Fosmidclone Epi300 UHH01
F, pJB69A5 ++ +++
N, pJB148G3 ++ +++
Q, pJB39A3 − +
S, pJB77G10 − +
In three of the clones a putative ORF could be detected by analyzing the sequence of
the active fosmid clones. The physical maps of the fosmids containing the putative
genes are shown in Figure 21. The fosmids pJB77G10 (S) and pJB148G3 (N) showed
higher activity on at least some of the substrates. One of the fosmids belonged to the
phylum Proteobacteria and the other to Firmicutes.
Figure 21: Physical maps of three fosmids with esterolytic activity and the putative responsible
ORFs. Fosmid N (pJB148G3) belongs to the phylum Proteobacteria and fosmids S (pJB77G10)
and T (pJB84G2) to the Firmicutes. *E labels the relevant ORFs.
3.2.4.2.2 Cellulolytic activities using the DNSA method and CMC as substrate
A more sensitive screen was performed to refine the results from the congo red screen-
ing method (2.17.2.1). For the DNSA assay (2.17.2.2), carboxymethyl cellulose was
used as substrate, which is the same substrate used for the congo red plate screening.
The reaction was carried out with crude cell extract for 30 min at 37 °C with 1 % CMC
substrate. After adding the DNSA reagent, the sampel was boiled for 15 min. Absorp-
tion was measured at 546 nm.
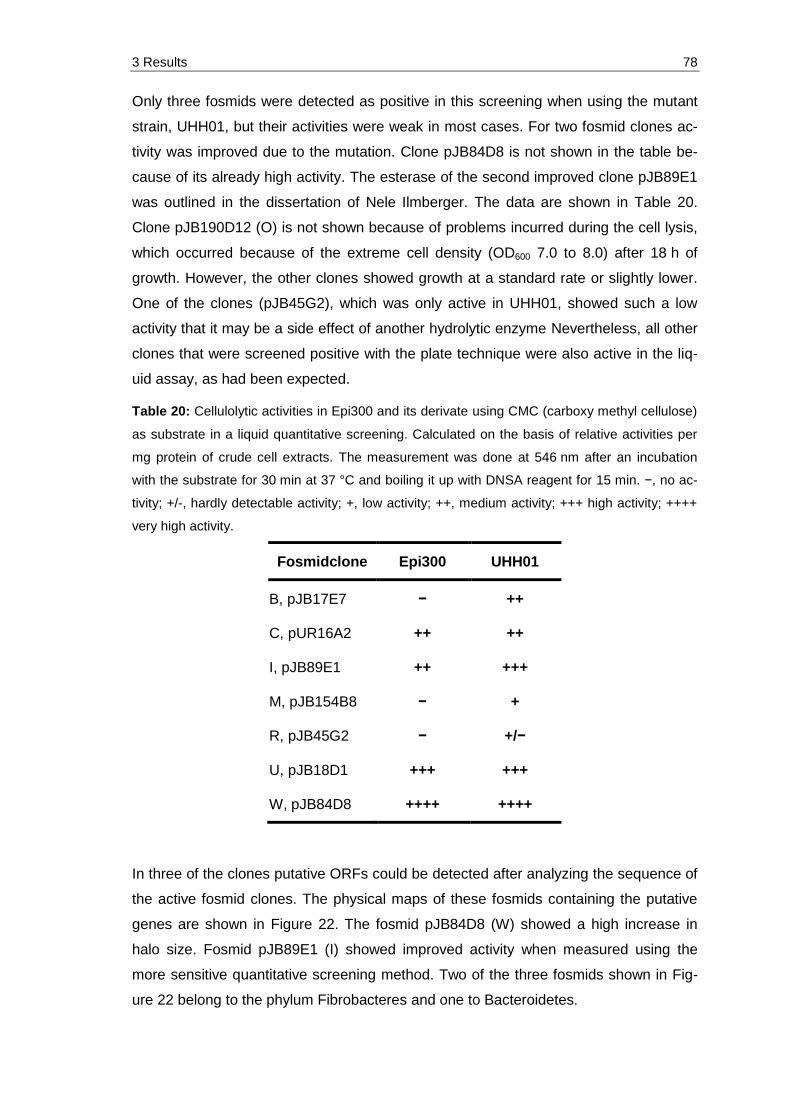
3 Results 78
Only three fosmids were detected as positive in this screening when using the mutant
strain, UHH01, but their activities were weak in most cases. For two fosmid clones ac-
tivity was improved due to the mutation. Clone pJB84D8 is not shown in the table be-
cause of its already high activity. The esterase of the second improved clone pJB89E1
was outlined in the dissertation of Nele Ilmberger. The data are shown in Table 20.
Clone pJB190D12 (O) is not shown because of problems incurred during the cell lysis,
which occurred because of the extreme cell density (OD600 7.0 to 8.0) after 18 h of
growth. However, the other clones showed growth at a standard rate or slightly lower.
One of the clones (pJB45G2), which was only active in UHH01, showed such a low
activity that it may be a side effect of another hydrolytic enzyme Nevertheless, all other
clones that were screened positive with the plate technique were also active in the liq-
uid assay, as had been expected.
Table 20: Cellulolytic activities in Epi300 and its derivate using CMC (carboxy methyl cellulose)
as substrate in a liquid quantitative screening. Calculated on the basis of relative activities per
mg protein of crude cell extracts. The measurement was done at 546 nm after an incubation
with the substrate for 30 min at 37 °C and boiling it up with DNSA reagent for 15 min. −, no ac-
tivity; +/-, hardly detectable activity; +, low activity; ++, medium activity; +++ high activity; ++++
very high activity.
Fosmidclone Epi300 UHH01
B, pJB17E7 − ++
C, pUR16A2 ++ ++
I, pJB89E1 ++ +++
M, pJB154B8 − +
R, pJB45G2 − +/−
U, pJB18D1 +++ +++
W, pJB84D8 ++++ ++++
In three of the clones putative ORFs could be detected after analyzing the sequence of
the active fosmid clones. The physical maps of these fosmids containing the putative
genes are shown in Figure 22. The fosmid pJB84D8 (W) showed a high increase in
halo size. Fosmid pJB89E1 (I) showed improved activity when measured using the
more sensitive quantitative screening method. Two of the three fosmids shown in Fig-
ure 22 belong to the phylum Fibrobacteres and one to Bacteroidetes.

3 Results 79
Figure 22: Physical maps of three fosmids with cellulolytic activity and the putative responsible
ORFs. Fosmid I belongs to the phylum Bacteroidetes and fosmids U and W to Fibrobacteres. *C
labels the relevant cellulolytic and *E a putative esterolytic ORF.
3.2.4.3 Comparison of the activity improvements to the phyla
When comparing activity changes caused by UHH01 to the phyla of the affected fosmid
clones it is observable that the highest percentage of improvements, due to the muta-
tion, were achieved in the phyla Proteobacteria, Bacteroidetes and Firmicutes, in this
order. Only active clones were considered for the percentage. The lowest improve-
ments were obtained in the phylum Fibrobacteres at only 50 %. The data are shown in
Table 21. The stated activity improvements are limited to esterolytic (3.2.4.1.1,
3.2.4.2.1) and cellulolytic (3.2.4.1.2, 3.2.4.2.2) activities.
Table 21: The phyla, their used number for activity screenings, the number of clones which
showed activity and their number of improved activities due to the mutant strain UHH01, only
considering the active clones. The activities were limited to esterolytic and cellulolytic ones .
Phylum Number of
analyzed
clones be-
longing the
phylum
Number of
active
clones in
the phylum
Number of
these clones
with higher
activity in
UHH01
Improved activi-
ty in this phylum
only considering
the active
clones (%)
Bacteroidetes 13 5 4 80 %
Firmicutes 4 4 3 75 %
Verrucomicrobia 1 0 0 −
Proteobacteria 2 2 2 100 %
Fibrobacteres 4 2 1 50 %

3 Results 80
3.2.5 Metagenomic libraries in the parental strain and the modified
strain UHH01
To prove that the strain UHH01 is indeed usable for the construction of metagenomic
libraries, two different libraries, one in each strain, were generated. To obtain similar
libraries the same DNA preparation from the Elbe river sediment (2.3.1.2) was used.
Also, the same protocol was used for both strains (2.15). Clone quantity after the infec-
tion was similar and the insert frequency was almost 100 % in each strain (Table 22) as
expected when using fosmids as vectors. The insert sizes were also comparable.
Table 22: Metagenomic libraries employed in the Epi300 and UHH01 with DNA material from
the Elbe river (2.3.1.2) and their insert sizes.
Host strain No. of clones Insert size (kb)
Epi300 10,000 26
UHH01 10,000 28
After constructing these two libraries, the study went on to verify if clones also showed
measurable enzyme activities. The first chosen screen was the TBT screen (2.17.3.1).
In screening 20,000 clones 20 active clones were identified in total. In each strain activ-
ities were detectable (Table 23). The developing halos were compared to each other
after 5 days of incubation at 37 °C and grouped into low, medium and high activities,
based on their size. The higher amount of positive clones was found in UHH01 with 12
positive screened clones Epi300 only expressed 8 putative positive esterases.
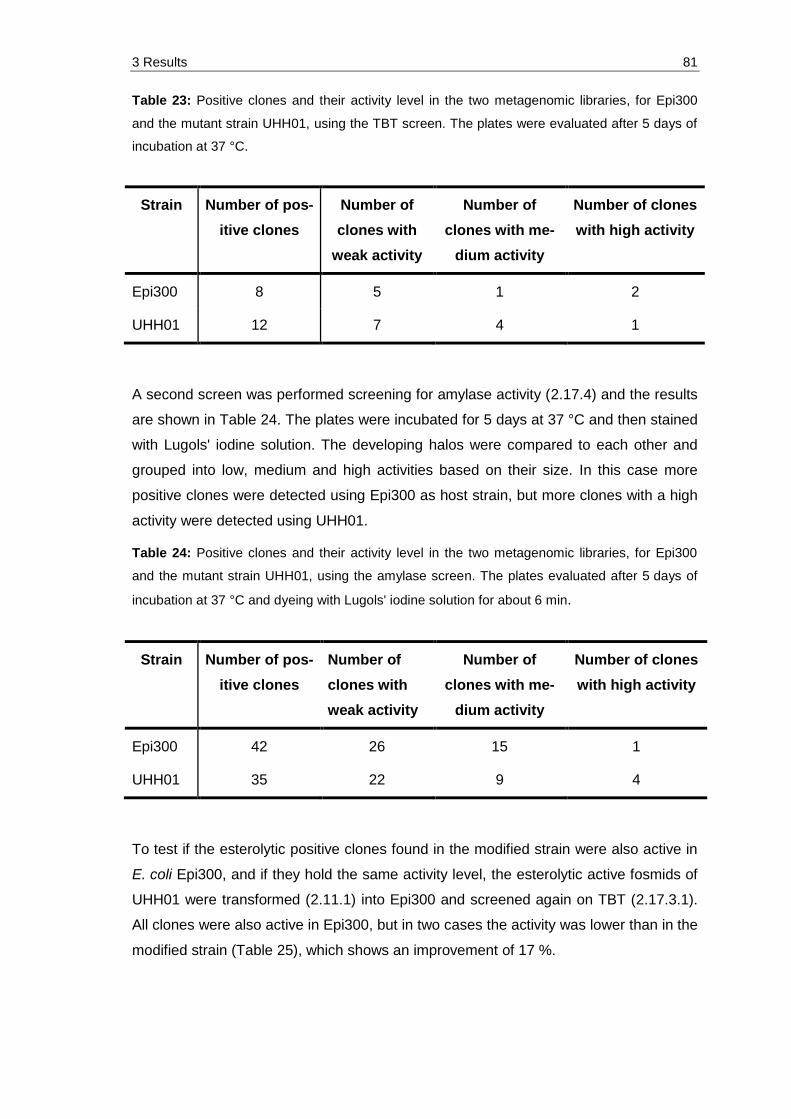
3 Results 81
Table 23: Positive clones and their activity level in the two metagenomic libraries, for Epi300
and the mutant strain UHH01, using the TBT screen. The plates were evaluated after 5 days of
incubation at 37 °C.
Strain Number of pos-
itive clones
Number of
clones with
weak activity
Number of
clones with me-
dium activity
Number of clones
with high activity
Epi300 8 5 1 2
UHH01 12 7 4 1
A second screen was performed screening for amylase activity (2.17.4) and the results
are shown in Table 24. The plates were incubated for 5 days at 37 °C and then stained
with Lugols' iodine solution. The developing halos were compared to each other and
grouped into low, medium and high activities based on their size. In this case more
positive clones were detected using Epi300 as host strain, but more clones with a high
activity were detected using UHH01.
Table 24: Positive clones and their activity level in the two metagenomic libraries, for Epi300
and the mutant strain UHH01, using the amylase screen. The plates evaluated after 5 days of
incubation at 37 °C and dyeing with Lugols' iodine solution for about 6 min.
Strain Number of pos-
itive clones
Number of
clones with
weak activity
Number of
clones with me-
dium activity
Number of clones
with high activity
Epi300 42 26 15 1
UHH01 35 22 9 4
To test if the esterolytic positive clones found in the modified strain were also active in
E. coli Epi300, and if they hold the same activity level, the esterolytic active fosmids of
UHH01 were transformed (2.11.1) into Epi300 and screened again on TBT (2.17.3.1).
All clones were also active in Epi300, but in two cases the activity was lower than in the
modified strain (Table 25), which shows an improvement of 17 %.

3 Results 82
Table 25: Change in activity level on TBT after transformation of the in UHH01 detected fosmid
clones into Epi300. The plates were evaluated after 5 days of incubation at 37 °C.
Strain No activity change Higher activity Improvement (%)
UHH01 10 2 17
4 Discussion 83
4 Discussion
This thesis contains two result parts, which are split into the detection and partial char-
acterization of the novel glycosyltransferase GtfC (3.1). It also contains a transcriptome
analysis of foreign DNA in E. coli, including the development of an optimized strain for
further research (3.2).
Due to the low hit rates using the recently published sensitive screening tool META
(Rabausch et al. 2013), this study analyzed the extent to which the lack of transcription
of foreign DNA in E. coli Epi300 is responsible for it and how these limitations can be
reduced by designing an E. coli mutant carrying an additional sigma factor from
C. cellulolyticum.
4.1 Glycosyltransferase
Flavonoids are in increasing demand among cosmetic and nutrition industries, due to
their various positive effects on human health (Ververidis 2007), such as offering pro-
tection against the effects of a high cholesterol diet (Sikder et al. 2014). They are diffi-
cult to synthesize chemically because of their complex structure and are also hard to
extract in adequate amounts (Manach et al. 2004) since they are exclusively produced
by plants on a rather low level. Recently one method was published using nanoharvest-
ing to isolate flavonoids from plant material (Kurepa et al. 2014), which reduces the use
of organic solvents during the extraction. But due to its low level production in plants, it
is not sufficient for industrial applications. Regio-specific modifications of flavonoids are
also difficult, as directed chemical modification mostly fail. Therefore, enzymes as spe-
cialists in regio-specific modifications are of great interest for the production of specific
glycosylated flavonoids. The specific glycosylation of flavonoids is desired, amongst
others, to influence water solubility and therefore the bioavailability of the flavonoids
(Graefe et al. 2001, Kren and Martinkova 2001). This is an important factor particularly
because low bioavailability can even hinder the health effects of flavonoids
(Thilakarathna and Rupasinghe 2013). White biotechnology depends on appropriate
microorganisms or, rather, their enzymes. However, there are still only a few of pro-
karyotic flavonoid-acting glycosyltransferases which are able to cover the market in
adequate amounts.
Metagenomics is a tool for discovering such novel enzymes (Schmeisser et al. 2007).
As a culture-independent technology it allows investigations into and the utilization of
the diversity of microorganisms in a habitat. Without this technology it is only possible

4 Discussion 84
to use cultivatable microorganisms, which cover about 0.1 to 1 % of the whole variety
(Amann et al. 1995).
In this study, a recently published functional screening method (Rabausch et al. 2013)
was used, called META (metagenome extract thin-layer chromatography analysis), to
detect new flavonoid modifying enzymes. Two metagenomic libraries were screened
and one detected glycosyltransferase was partially characterized for its substrate spec-
trum, glycosylation pattern and products.
4.1.1 Metagenomics and screening method
The construction and screening of metagenomic libraries is a powerful tool to discover
novel enzymes and secondary metabolites because it makes it possible to investigate
the whole microbial diversity of the selected habitat. It is therefore not limited to the
cultivatable microorganisms. In such metagenomic studies many interesting enzymes
have previously been detected, but until now no metagenomic glycosyltransferase is
known. To detect new enzymes, an adequate habitat should be sampled for the
screening, where such enzymes can be expected in wide diversity. This led to the se-
lection of elephant feces and an already existing library of Elbe sediment. Both libraries
have already been published (Rabausch et al. 2013). Only one highly active pool
(144b) has emerged, expressing a putative flavonoid modifying enzyme (Figure 4).
However, in a study performed by Ulrich Rabausch, an α-L-rhamnosidase (Rabausch
et al. 2014) was detected in the metagenomic library of the elephant feces, which leads
to the assumption that both habitats are useful for the detection of such novel flavonoid
modifying enzymes. Additionally, the recently developed screening method, META,
was confirmed for metagenomic approaches after detecting a putative positive flavon-
oid modifying pool.
4.1.2 Identification of the glycosyltransferase and purification of the
protein
The low similarities detected for GtfC indicates that a new glycosyltransferase was de-
tected. Fibrisoma lima, belonging to the Bacteroidetes and showing the highest similar-
ity to GtfC, was discovered in the North Sea and published recently (Filippini et al.
2011). The clone carrying the gene originated from the Elbe River sediment, only a
short distance upstream of the Elbe estuary of the North Sea. The next similar pre-
dicted glycosyltransferases to GtfC are from Dyadobacter fermentans (Lang et al.
2009) and Spirosoma linguale (Lail et al. 2010), both also belonging to the phylum Bac-
teroidetes, S. linguale was also isolated from an aqueous environment.

4 Discussion 85
Table 26: ORFs identified and analyzed on pSK144C11 using NCBI BLAST, gtfC is the active
ORF surrounded by the other ORFs, as shown in Figure 6 (Rabausch et al. 2013).
ORF AA Homolog Coverage
(%)
% Identity/
Similarity
esmA 80 putative UDP-NAc-muramate-L-alanin-
ligase
Niabella soli (ZP09632598)
99 69 / 80
gtfC 459 putative UDP-glucosyltransferase
Fibrisoma limi (CCH52088)
92 51 / 71
esmB 170 hypothetical protein
Niastella koreensis (YP005009630)
95 63 / 77
esmC 150 putative membrane protein
Solitalea canadensis (YP006258217)
98 68 / 81
The surrounding genes were most similar to a putative UDP-NAc-muramate-L-alanin-
ligase from Niabella soli, a hypothetical protein from Niastella koreensis and a putative
membrane protein from Solitalea canadensis (Table 26), all of which had an identity of
over 60 %. Niabella soli (Weon et al. 2008) and Niastella koreensis (Weon et al. 2006)
were both primarily isolated from soil in Korea. Solitalea canadensis (Weon et al. 2009)
was first isolated from greenhouse soil. All surrounding genes were assigned to the
phylum Bacteroidetes. Due to this fact, it is assumed that GtfC also derives from Gram-
negative Bacteroidetes. Only eight flavonoid-active glycosyltransferases are known so
far, originating from five different prokaryotes (Yang et al. 2005, Hyung Ko et al. 2006,
Kim et al. 2007, Ahn et al. 2009, Jeon et al. 2009, Rabausch et al. 2013); all of them
are Gram-positive, except for the protein XcGT-2 from Xanthomonas campestris ATCC
33913 (Kim et al. 2007).
Overall, three different products were observed in different combinations in the tested
subclones. Generally, a differing or mutated nucleotide sugar cycle of E. coli can influ-
ence the occurring products, as shown recently (Yoon et al. 2012). But having known
that pSK144C11 and pDgtfC showed different products, while both were analyzed in
the same host, this influence was excluded for this approach. All three products were
detected later after using the construct pET19gtfC in E. coli BL21.
4 Discussion 86
Purifying the protein yielded only up to 3 mg/g cell pellet. This amount is quite low in
comparison to other purified proteins using the His-tag method (Bijtenhoorn et al. 2011,
Chow et al. 2012). Also, for another glycosyltransferase (MgtB) from Ulrich Rabausch,
as indicated in the same publication as GtfC (Rabausch et al. 2013), a protein amount
of 5 mg protein/g cell pellet could be achieved with higher purity.
4.1.3 Biochemical characterization of GtfC
Purified GtfC did not convert quercetin in an enzymatic assay when given UDP-α-D-
glucose or UDP-α-D-galactose as donor. This was surprising because of previous suc-
cess with another glycosyltransferase, MgtB (Rabausch et al. 2013), and also because
the fact that UDP-glucose is the major sugar donor available in bacterial cells (Lim et
al. 2006). The failure of this analysis leads to the assumption that glucose and
galactose were not used at all or that the nucleotide part of the substrate was the rea-
son for the denial. The possibility that the nucleotide part is critical for exclusion was
rather high, especially considering that one of the products (P1) is similar to the gluco-
side of quercetin (isoquercitrin) in Rf and fluorescens. Due to the lack of further com-
mercial available nucleotide sugar substrates all further analyses were performed in a
whole cell biotransformation. This performance has been done before (Kren and Thiem
1997, Lim et al. 2006, Kim et al. 2007) and was earlier proven to be functional for GtfC
during the screening process. Aglycones added to the medium are taken up by the
bacterial cell and the formed glycosides are dispensed back into the medium and,
therefore, the recovery of the products is simple (Lim et al. 2004).
4.1.3.1 Substrates of GtfC
Quercetin possesses five hydroxyl-groups at which O-glycosylation is possible. This
glycosylation is typical for flavonoid glycosyltransferases, although C-glycosylation is
possible in plants (Brazier-Hicks et al. 2009, Chen et al. 2013). The common glycosyla-
tion pattern of hydroxyl groups performed by flavonoid glycosyltransferases are the C3,
C7 or C4' positions, in that order (Harborne 1986), of which microorganisms favor the
C3 and C7 positions (Xiao et al. 2014). All positions were glycosylated by GtfC if the
acceptor substrate presented only one accessible position. Additionally GtfC was able
to act on the C3' position and also the C5 position. The glycosylation of C5 was unex-
pected due to former publications declaring the lack of glycosylation at this position
(Hyung Ko et al. 2006, Kim et al. 2007, Ahn et al. 2009). This implies that GtfC is highly
promiscious considering all tested hydroxyl positions.

4 Discussion 87
As summarized in Table 27 all tested subgroups were converted by GtfC. The best
conversions were detected for flavonols and the poorest conversion, 52 %, for chal-
cones. A high amount of products was observed for most of the used substrates.
BcGT-3, an UPD-glycosyltransferase from Bacillus cereus, favored kaempferol as sub-
strate (Ahn et al. 2009), but also transformed quercetin and luteolin to more than one
product. Genestein and naringenin showed one product using this glycosyltransferase.
However, GtfC was able to generate more products and glycosylate more subgroups.
GtfC, therefore, presented a high promiscuousness, thereby availing itself of consider-
ing all tested subgroups. It also yielded a high range of different products.
Table 27: Representatives of flavonoid subgroups converted by GtfC and the conversion for the
examples, that were shown in Table 10.
Flavonoid
subgroup
Representative
examples
Conversion (%) Products
Flavonol Quercetin
Kaempferol
Fisetin
Rhamnetin
Galangin
~ 100
~ 100
3
3
4
3
3
Flavone Luteolin
Pratol
3',4'-dihydroxyflavone
86
4
1
3
Flavanone Naringenin
4'-hydroxyflavanone
Hesperetin
76 4
1
3
Isoflavone Genistein 68 3
Chalcone Xanthohumol 52 2
Stilbenoid t-Resveratrol 96 6

4 Discussion 88
4.1.3.2 Products of GtfC
GtfC converted eupatorin-5-methylether (C3' hydroxyl group only) and 7-
methoxyflavonol (C3 hydroxyl group only) by yielding each two products, although only
one hydroxyl group was given. This product quantity indicates that more than one
sugar donor is transferred by GtfC. Lacking further commercially available donor sub-
strates the final products were revealed.
Most of the flavonoids show two main absorbance maxima in the wavelength range of
220-600 nm, but the exact wavelength and magnitude differ (Mabry TJ 1970). Band I
reflects the substitution of the B-ring and Band II reflects the A-ring characteristics. Fla-
vonols that are substituted (O-sugar) at position C3 obtain their maximum Band I at a
shorter wavelength than the ones without this substitution (Bohm 1998). Considering
that Band I does not differ in the maximum, comparing P3 and isoquercitrin, P3 could
also be a quercetin-3-O-glycoside. For kaempferol, only one reference substance (as-
tragalin; kaempferol-3-O-glucoside), was used to compare the absorbance spectra. It
showed the same result as had been obtained for quercetin and isoquercitrin. The pat-
tern of kaempferol and quercetin products on a TLC plate both show high levels of
similarity, each have a conversion rate of about 100 %. It could, therefore, be supposed
that the glycolysation of quercetin and kaempferol is identical. But this could not be
proven due to the lack of reference substances. The data were confirmed by HPLC-
ESI-MS, showing that GtfC is truly able to transfer different sugar moieties as well. This
donor variety is in contrast to Gtf-like enzymes that normally have stringent donor
specificity: for example, GtfD (Mulichak et al. 2004). And while most known glycoconju-
gates made in E. coli whole-cell systems have been glucosides (Arend et al. 2001, Lim
et al. 2004, Xiao et al. 2014), isoquercitrin as only glucoside product does not present
the main product.
The data also prove that the favored hydroxy function is set at position C3. Lacking the
C3 position, as in naringenin (flavanone), the main product that occurred showed high
similarities in the Rf value and fluorescence to prunin (naringenin-7-O-glucoside),
which was confirmed by Ulrich Rabausch (Rabausch et al. 2013) with an absorbance
spectrum comparison. Two different glycosyltransferases from Bacillus cereus glycosy-
lated the C3 position as well (Rao and Weisner 1981) and one was able to glycosylate
C7 (Ahn et al. 2009). MgtB, a macroside glycosyltransferase from Bacillus HH1500
(Rabausch et al. 2013) and BcGt-1 (Hyung Ko et al. 2006), also favored the C3 posi-
tion, followed by the C7 position. GtfC is a highly tolerant enzyme compared to other
glycosyltransferases, considering all given hydroxy-groups when they were exclusive.
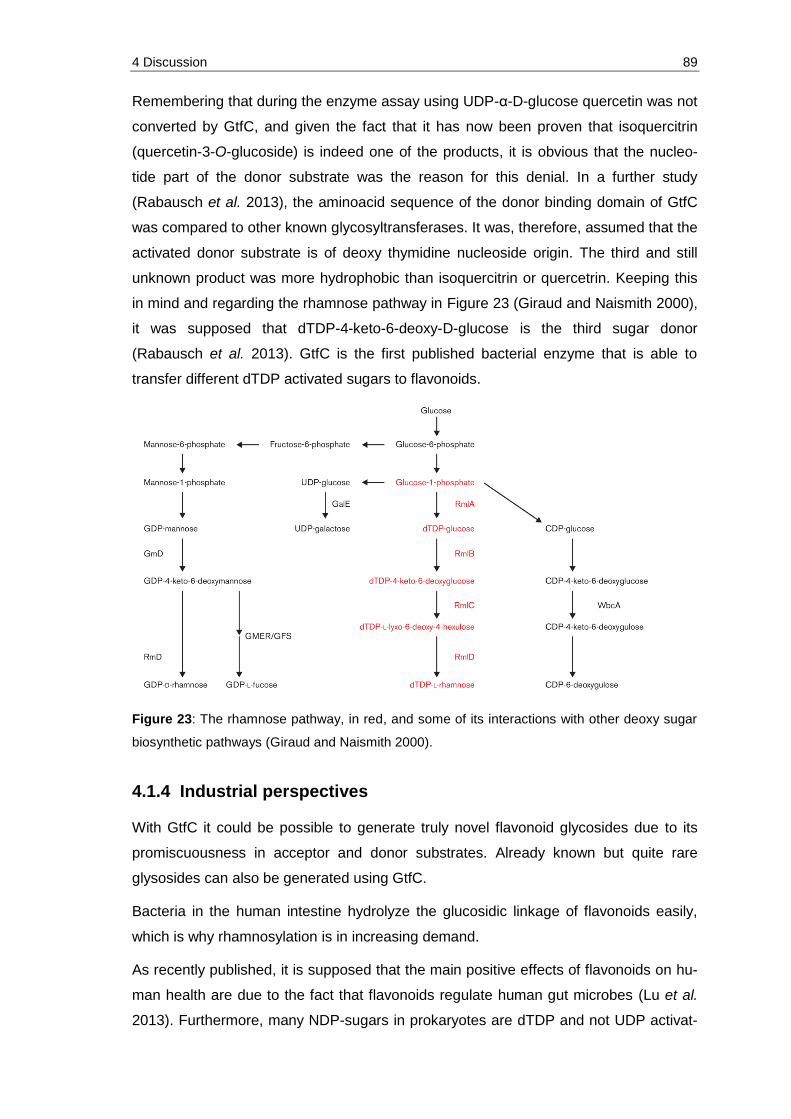
4 Discussion 89
Remembering that during the enzyme assay using UDP-α-D-glucose quercetin was not
converted by GtfC, and given the fact that it has now been proven that isoquercitrin
(quercetin-3-O-glucoside) is indeed one of the products, it is obvious that the nucleo-
tide part of the donor substrate was the reason for this denial. In a further study
(Rabausch et al. 2013), the aminoacid sequence of the donor binding domain of GtfC
was compared to other known glycosyltransferases. It was, therefore, assumed that the
activated donor substrate is of deoxy thymidine nucleoside origin. The third and still
unknown product was more hydrophobic than isoquercitrin or quercetrin. Keeping this
in mind and regarding the rhamnose pathway in Figure 23 (Giraud and Naismith 2000),
it was supposed that dTDP-4-keto-6-deoxy-D-glucose is the third sugar donor
(Rabausch et al. 2013). GtfC is the first published bacterial enzyme that is able to
transfer different dTDP activated sugars to flavonoids.
Figure 23: The rhamnose pathway, in red, and some of its interactions with other deoxy sugar
biosynthetic pathways (Giraud and Naismith 2000).
4.1.4 Industrial perspectives
With GtfC it could be possible to generate truly novel flavonoid glycosides due to its
promiscuousness in acceptor and donor substrates. Already known but quite rare
glysosides can also be generated using GtfC.
Bacteria in the human intestine hydrolyze the glucosidic linkage of flavonoids easily,
which is why rhamnosylation is in increasing demand.
As recently published, it is supposed that the main positive effects of flavonoids on hu-
man health are due to the fact that flavonoids regulate human gut microbes (Lu et al.
2013). Furthermore, many NDP-sugars in prokaryotes are dTDP and not UDP activat-
4 Discussion 90
ed, which makes a glycosyltransferase like GtfC using these sugars as donor sub-
strates a promising biocatalyst for glyco-diversification approaches (Lim et al. 2006,
Williams et al. 2008, Yoon et al. 2012).
4.1.5 Conclusions and outlook
To our knowledge, the first metagenome-derived glycosyltransferase acting on flavon-
oids could be detected and partially characterized in this study. It is also the first pub-
lished bacterial enzyme that transfers various dTDP-activated hexose sugars to flavon-
oids and shows high promiscuousness for the flavonoid substrates and their given hy-
droxyl positions. Moreover, it proves to be a completely new enzyme.
Furthermore, there has been a publication recently which offers a strategy for generat-
ing unnatural glycosides by mutating the nucleotide sugar cycle of E. coli. The new
strain was able to produce dTDP-6-deoxytalose and transform quercetin to quercetin-3-
O-(6-deoxytalose) (Yoon et al. 2012). Transforming these E. coli cells with pET19gtfC
could be interesting to increase the already high product variety of GtfC.
Also, it may be possible to further enhance the capabilities of GtfC by mutations. The
success of semi-rational generations of mutants, e.g. random mutations in the ligand
binding pocket, has already been shown for a bacterial glycosyltransferase involved in
the urdamycin biosynthesis (Hoffmeister et al. 2002).
Due to the similarity of GtfC to the UGTs from Fibrosomi limi and Dyadobacter fermen-
tans it could be interesting to further analyze their activity.
A protein crystallization would be informative concerning the difference of the amino
acid sequence of GtfC compared to other glycosyltransferases (Rabausch et al. 2013).
4.2 Metatranscriptomics
Metagenomics is a popular method for detecting truly novel enzymes by sequencing or
functional screening methods (Streit and Schmitz 2004, Ferrer et al. 2009, Iqbal et al.
2012). But it has known limitations, such as the expression rate of foreign DNA in the
used host strains (Perner et al. 2011, Taupp et al. 2011). The most frequently used
host strain is E. coli (Handelsman et al. 1998), but it is generally assumed that E. coli
can only express about 40 % of foreign DNA (Gabor et al. 2004). Many other host
strains have been developed to overcome this problem, but E. coli is still the easiest
strain to construct DNA libraries in, due to, e.g., the many vector systems developed for
E. coli and its short generation time. It has been published before that phylogenetic
4 Discussion 91
distance is a factor for the promoter recognition performed by E. coli sigma factors
(Warren et al. 2008), but this was never analyzed with respect to metagenome library
screening using DNA of non-cultivated microorganisms. It is also unknown to which
extent metagenome-derived promoters are functional and active on fosmids.
4.2.1 Transcriptome analysis of fosmids in E. coli
In a previous study (Ilmberger et al. 2012), the metagenomic library of the elephant
feces had been analyzed to reveal the frequency of phyla of 198 16S rRNA clones.
Many of the 16S rRNA genes clustered with 16S rRNA sequences from so far unculti-
vated organisms and many sequences were also far from their closest related known
sequence. However, the data gathered for the 19 fosmids, that were analyzed for their
transcription, and the phyla frequency based on 16S rRNA were rather similar, in that
they showed the same major groups of phyla.
The induction of the fosmids may give rise to the sometimes major differences found
between the two biological parallels. The autoinduction solution used to raise the fos-
mid copy numbers in the cell, from single copy to higher copy, provides no guarantee
for an exact amount of fosmids per cell. Some factors are critical for the effectiveness
of the induction, like, for example, the aeration of the culture during induction (procotol
for metagenome library construction). This sensitivity may lead to differences in small
conditional degrees, such as the frequent switching on and off of the used culture
shakers. The induction also affects the comparison between E. coli and fosmid genes
within this analysis, due to the fact that, with 24 E. coli genomes in the pool for tran-
scription analysis up to 50 fosmids per cell would occur, which is the double amount.
The five fosmids excluded for transcriptional analysis were distributed over the different
phyla.
4.2.1.1 Transcription rate in E. coli regarding the phlya of the
fosmids
Considering the statement of a former publication (Warren et al. 2008), it was expected
that the further the phylogenetic distance, the weaker the promoter recognition and
transcription. Expecting the transcription rate to reduce with increasing phylogenetic
distance, it was supposed that Proteobacteria would be the best transcribed phylum.
This aberration may be due to the high diversity of this phylum (Stackebrandt et al.
1988). Just regarding the weakest transcribed clone per phylum, Proteobacterium does
not show poorer transcription than Bacteroidetes, which may also be explained by the
lower amount of analyzed clones assigned to Proteobacteria. With Firmicutes repre-

4 Discussion 92
senting the Gram-positive bacteria, it is surprising that this phylum is transcribed at an
average level, expecting the distance between Proteobacteria and Firmicutes to reduce
the transcription level. It was also unexpected that Bacteroidetes would be the best
transcribed phylum, particularly in comparison to Fibrobacteres in the weaker tran-
scribed area. There is only a small phylogenetic distance between these two phyla
(Montgomery et al. 1988), each sharing a common ancestor exclusive of all other bac-
teria (Gupta 2004). Belonging to the PVC superphylum (Wagner and Horn 2006) it was
no suprise that Verrucomicrobia's transcription level was low, because of the higher
phylogenetic distance to the host. The phylum is rather new (Hedlund et al. 1997) and
is regarded as hardly cultivatable (Miskin et al. 1999). But Verrucomicrobia is the only
analyzed phylum represented by one fosmid.
Although the amount of analyzed fosmids was not large, it was the first time a trend
could be shown, indicating that the phylum of the metagenomic DNA is actually a factor
for transcription level in E. coli. However, the assumption of the influence of phyloge-
netic distance (Gabor et al. 2004) could not be confirmed. Possible operon structures
on the fosmid inserts could contort the comparability between the constructed heat
map and the promoter recognition.
The investigation of the transcription of metagenomic DNA was never performed before
and therefore no data could be used for direct comparison. But these data show that
E. coli is indeed able to transcribe metagenomic DNA on fosmids in an unexpected
high amount.
4.2.2 Overcoming the limitations
To overcome limitations in the expression rate of E. coli, primarily alternative hosts
have been established, such as Pseudomonas putida (Martinez et al. 2004), Strepto-
myces lividans (Courtois et al. 2003, McMahon et al. 2012), Sinorhizobium meliloti
(Wang et al. 2006, Schallmey et al. 2011) and Rhizobium leguminosarum (Li et al.
2005, Wexler et al. 2005), Desulfovibiro sp. (Rousset et al. 1998) and Streptomyces
sp.. Nevertheless E. coli remains the easiest host to construct metagenome libraries in,
considering the variety of existing vector systems and the generation time.
4.2.2.1 Mutation of E. coli Epi300, constructing UHH01
Knowing that the phylum of the foreign DNA actually influences the transcription rate in
E. coli Epi300 the study attempted to optimize the strain to overcome one of the limita-
tions of the still expandable transcription rate. Not only is the promoter recognition per-
formed by sigma factors, they are also involved in all aspects of transcription initiation,
4 Discussion 93
including promoter melting and promoter escape (Borukhov and Severinov 2002). Al-
ready published analyses, performed with genes from Pseudomonas aeruginosa and
Haemophilus influenza, showed that the sigma factors of E. coli were limited in pro-
moter recognition (Warren et al. 2008). Because of these limitations a strain was de-
signed carrying an additional foreign sigma factor in its genome. Considering the distri-
bution of phyla in the elephant feces library a sigma factor from Clostridium cellulolyti-
cum (Petitdemange et al. 1984) was selected, since Firmicutes is one of the main
groups in the phylum frequency, yet does not belong to the best transcribed phyla in
the transcriptomic study. Also, it is Gram-positive in constrast to E. coli and Bacteroide-
tes. It is the best transcribed phylum and the sequence of its housekeeping sigma fac-
tor is known and thus could easily be cloned using the PCR method.
Comparing growth curves for E. coli Epi300 and the mutant UHH01 with induced
(Figure 19) and uninduced (Figure 18) Plac promoter, revealed that their growth behav-
iour is rather identical for both conditions. Therefore, the mutant is not limited and could
be used as an alternative host for further analyses without losing the important E. coli
ability of a short generation time. Hence, the housekeeping sigma factors did not com-
pete for the polymerase in a negative way. Maybe the polymerases that had the foreign
sigma factor were also able to recognize some of the E. coli promoters and supported
the polymerases carrying its own sigma factors. It was published earlier for a unique
sigma factor from Bacteroidetes that this special sigma factor could bind to the poly-
merase of E. coli but did not support transcription initiation for any promoters
(Vingadassalom et al. 2005), which indicates that there are limitations to the addition of
foreign sigma factors to the E. coli genome. This lack of support transcription could be
excluded for the C. cellulolyticum sigma factor, considering the identical growth rate.
With a sigma factor binding the RNA polymerase, but not supporting transcription initia-
tion, less transcription could take place with less polymerases carrying the needed
sigma factor.
4.2.2.2 Activity analyses
After revealing that there were no obvious limitations to the mutant UHH01, it was
transformed with the previously analyzed 24 fosmids to compare directly the expres-
sion differences between E. coli Epi300 and UHH01. The esterolytic and cellulolytic
screens were selected for their simplicity (Taupp et al. 2011), which perhaps is also
responsible for the fact that the majority of biocatalysts that have been identified
through functional approaches are hydrolytic enzymes, mainly esterases and glycoside
hydrolases (Simon and Daniel 2009, Steele et al. 2009).

4 Discussion 94
The liquid screening methods were done in three parallels. They showed high standard
deviations and their average values were grouped into activity levels from low (+) to
very high (++++). This high level of deviations could be explained by the usage of a
sonicator to crack the cells. The efficiency of the cracking differs and could also dam-
age the proteins in different proportions. Also, the standard deviations for esterolytic
activities were higher than those for the cellulolytic. E. coli itself shows esterolytic activi-
ties and their activity was deducted as an average value from the activities of the fos-
mids. These standard deviations were already mentioned in relation to the transcription
levels, which were probably a result of the induction of the fosmids. The increase of
heterologous expression was already shown for an over-expressed alternative E. coli
σ54sigma factor (Stevens et al. 2013), which shows that the amount of the introduced
sigma factor is also of importance. Due to identical screening methods the Plac pro-
moter was not induced, which may reduce the effect.
Considering the fact that for both screening techniques the improved enzymes showed
an FPKM value from low to medium and no high transcription (red) in Epi300, there is
still room for higher transcription levels by using UHH01. The improved activities are
limited to esterolytic and cellulolytic but may show that the use of the modified strain
carrying the additional sigma factor could enhance the activity of fosmids of different
phyla. Only Verrucomicrobia, which was only represented by one fosmid, showed no
activity at all, which is most likely due to the lack of any active ORFs (Table 28). Bac-
teroidetes which were already highly transcribed by E. coli showed higher activity in
80 %, as well as Proteobacteria, the phylum in which E. coli itself is grouped into, with
about 100 %. Interestingly, Firmicutes which harbors C. cellulolyticum, whose house-
keeping sigma factor was used for mutation, showed an improvement in only 3 of 4
cases and one reduction of activity (Table 21). This may be due to the not absolutely
definitive classification using NCBI BLASTN for highest similarities. Also a variation
within the phylum is not to be eliminated, which was already shown for representatives
of the Gamma-Proteobacteria (Warren et al. 2008), considering their promoter recogni-
tion. Overall, for 13 of 24 fosmids it was possible to compare activity levels, and for 10
the activity was increased or appeared only when using UHH01, which is an improve-
ment of about 77 %. It was expected that few new activities would be detected, given
the low number of tested fosmids that did not show activity right from the start. As it
was already shown for the transcription levels in E. coli for different phyla, it is obvious
that the phylum of the foreign DNA influences the transcription rate but does not de-
pend on the phylogenetic distance.
4 Discussion 95
Knowing that the sigma factor of E. coli provides limited promoter recognition (Warren
et al. 2008), it was expected that an additional sigma factor enhances the transcription
and therefore the activity. This expectation was verified by this study.
4.2.2.3 Metagenomic libraries in the standard strain Epi300 and the
modified strain UHH01
After discovering that the new host can indeed improve activities and may improve the
detection of new enzymes via screening methods new metagenomic libraries, each
with 10,000 clones, were designed in both hosts using the same DNA. First of all it was
important that the modification did not disturb the construction at all. Libraries could
only be used as an overview, considering that the DNA used for the construction was
the same. But the libraries were not identical and the average insert size in UHH01 was
slightly larger (Table 22).
Both libraries were screened for two different activities, esterolytic, using TBT, and
amylolytic, using soluble starch as substrate. Using the amylase screen more active
clones were found in the standard strain Epi300 (Table 24), but more clones with high
activity were found in UHH01. Using UHH01 resulted in finding more esterolytic active
clones (Table 23) during the screening. After a transformation of E. coli Epi300 with
these fosmids, the clones remained activebut showed less activity afterwards, at a rate
of 17 % (Table 25).
It is, therefore, possible to construct metagenomic libraries in a strain with an additional
sigma factor without any difficulties, although the activity using this modified strain
could be improved in some of the cases. There was less detection of an increase in
activity in the Elbe library than in the elephant feces library, although the amount of
clones was considerably higher. Because of the different DNA used for the two librar-
ies, elephant feces and Elbe sediment, it is important to consider that the distribution of
phyla is different and could influence the improvement rate of the designed mutant.
4.2.3 Perspectives
By using different mutants that carry different sigma factors adapted to the phyla of the
screened library, the pool of detectable enzymes may rise and provide enzymes that
can not be detected using standard methods.
Also the fact that already high activities could be further enhanced using the modified
strain is an important factor for industrial applications, always looking for higher yields.
4 Discussion 96
4.2.4 Conclusions and outlook
In this study the transcriptomic level of fosmid DNA in E. coli was shown for the first
time and it was revealed that the phylum providing the DNA influences the transcription
level. Using this knowledge, a mutant was designed that carried an additional sigma
factor from C. cellulolyticum to improve this rate. It could be shown that the construc-
tion of metagenomic libraries in this strain was straightforward as the construction in
the standard strain Epi300. Also, an improvement of enzyme activities was observed
using the modified strain, showing a new possible way for detecting novel enzymes or
improving the yield of known proteins.
It may be interesting to perform a new transcriptional analysis comparing the FPKM
values of Epi300 and UHH01, if they confirm the improved activities, and to reveal and
analyze the promoters on the fosmid inserts which showed higher activity in the mu-
tated strain.
Another study showed that the overexpression of an alternative E. coli sigma factor
(σ54) could enhance the heterologous expression (Stevens et al. 2013). The field of
manipulating the expression rate of E. coli using alternative or foreign sigma factors is
therefore promising. Promoter melting is an important factor in transcription initiation
and is normally done via strand separation at the -10 region; but, as published recently,
for alternative sigma factors the promoter melting is different (Darst et al. 2014, Du Toit
2014). It might be interesting to design mutants carrying alternative sigma factors of
other phyla and not only their housekeeping sigma factors.

5 Abstract 97
5 Abstract
Metagenomics is a popular and well functioning method used to detect novel enzymes.
It was utilized and further analyzed in this study. The first aim of the study was to detect
a metagenomic glycosyltransferase acting on flavonoids, to confirm the recently devel-
oped screening technique called META. The second aim was to analyze the degree to
which the transcription of fosmid genes is responsible for expression limitation in
E. coli. In addition, an approach was undertaken to improve the standard host strain
E. coli Epi300 by modifying the strain.
Flavonoids are part of our daily nutrition and are well known for having positive effects
on human health, such as anticancerogenic and antibacterial effects. They, therefore,
are increasingly demanded by many industries, including pharmaceuticals and cosmet-
ics. The difficulty is that flavonoids are produced in plants only at low levels, are tedious
to extract and the chemical synthesis often fails due to their complex structure. To
solve this problem a specific modification of flavonoids can be catalyzed by
glycosyltransferases, but until now only few prokaryotic ones have been identified and
characterized, which mostly originate from Gram-positive bacteria. Two metagenome
libraries, and all together about 38,000 clones, were screened, discovering one flavo-
noid modifying glycosyltransferase. This gene of 1380 bp designated gtfC encoded a
52 kDa protein. Its amino acid sequence was faintly similar to sequences of putative
glycosyltransferases from Gram-negative Dyadobacter fermentans and Fibrisoma limi,
using a homology search. GtfC is therefore the first metagenomic glycosyltransferase
acting on flavonoids and originating from a Gram-negative bacterium. It was further
elucidated by characterization that GtfC was able to mediate the transfer of different
hexose moieties, not accepting the usual UDP as nucleotide part of the sugar, and was
highly promiscuous relating to the flavonoid substrates. GtfC showed activity on
flavonols, flavones, flavanones, isoflavones and even on chalcones and stilbenes. By
this diversity of both substrates, donor and acceptor, a huge variety of different prod-
ucts can be achieved using GtfC.
It was detected that the transcription level of foreign DNA carried on 19 analyzed
fosmids in E. coli was dependent on the phylum, although the phylogenetic distance
seems not to have been responsible. E. coli was able to transcribe more genes than
expected, albeit at a low rate for most genes. Bacteroidetes, as the highest transcribed
phylum using the standard host strain Epi300, was underlined by the only detected
glycosyltransferase of the first part of this study, which belonged to this phylum. After
the detection of the phylum dependence for transcription, E. coli was mutated introduc-
ing an additional sigma factor into its genome. This procedure shows an alternative
5 Abstract 98
way for raising the expression, instead of using different host strains, which had been
used several times before. The new strain, designated UHH01, contained the house-
keeping sigma factor rpoD of Clostridium cellulolyticum downstream of a Plac promot-
er. The construction of metagenome libraries in this strain was as straightforward as
using the parental strain and the mutation did not affect the strain in generation time,
which sets UHH01 apart from alternative hosts. The new strain was able to improve
enzymatic activities, shown for esterolytic and cellulolytic activity. In a few cases new
positive clones could be detected, in other cases, the activity of those that were already
detected using Epi300 was improved. Two enzymes that had previously shown very
high activity were improved as well. Considering the low amount of analyzed fosmids,
24, adding an additional sigma factor provides a promising approach to detect novel
enzymes in metagenomic libraries and may also enhance already highly active enzyme
activities.

6 References 99
6 References
Ahn, B. C., B. G. Kim, Y. M. Jeon, E. J. Lee, Y. Lim and J. H. Ahn (2009). "Formation of flavone di-O-glucosides using a glycosyltransferase from Bacillus cereus." J Microbiol Biotechnol 19(4): 387-390.
Amann, R. I., W. Ludwig and K. H. Schleifer (1995). "Phylogenetic identification and in situ detection of individual microbial cells without cultivation." Microbiol Rev 59(1): 143-169.
Arend, J., H. Warzecha, T. Hefner and J. Stockigt (2001). "Utilizing genetically engineered bacteria to produce plant-specific glucosides." Biotechnol Bioeng 76(2): 126-131.
Bijtenhoorn, P., C. Schipper, C. Hornung, M. Quitschau, S. Grond, N. Weiland and W. R. Streit (2011). "BpiB05, a novel metagenome-derived hydrolase acting on N-acylhomoserine lactones." J Biotechnol 155(1): 86-94.
Bohm, B. A. (1998). Introduction to flavonoids. Amsterdam, The Netherlands, harwood academic publishers.
Bors, W. and M. Saran (1987). "Radical scavenging by flavonoid antioxidants." Free Radic Res Commun 2(4-6): 289-294.
Borukhov, S. and K. Severinov (2002). "Role of the RNA polymerase sigma subunit in transcription initiation." Res Microbiol 153(9): 557-562.
Bowles, D., E. K. Lim, B. Poppenberger and F. E. Vaistij (2006). "Glycosyltransferases of lipophilic small molecules." Annu Rev Plant Biol 57: 567-597.
Brazier-Hicks, M., K. M. Evans, M. C. Gershater, H. Puschmann, P. G. Steel and R. Edwards (2009). "The C-glycosylation of flavonoids in cereals." J Biol Chem 284(27): 17926-17934.
Breton, C., L. Snajdrova, C. Jeanneau, J. Koca and A. Imberty (2006). "Structures and mechanisms of glycosyltransferases." Glycobiology 16(2): 29R-37R.
Cassidy, A., E. B. Rimm, E. J. O'Reilly, G. Logroscino, C. Kay, S. E. Chiuve and K. M. Rexrode (2012). "Dietary flavonoids and risk of stroke in women." Stroke 43(4): 946-951.
Chen, J. M., L. B. Wei, C. L. Lu and G. X. Zhou (2013). "A flavonoid 8-C-glycoside and a triterpenoid cinnamate from Nervilia fordii." J Asian Nat Prod Res 15(10): 1088-1093.
Chester, N. and D. R. Marshak (1993). "Dimethyl sulfoxide-mediated primer Tm reduction: a method for analyzing the role of renaturation temperature in the polymerase chain reaction." Anal Biochem 209(2): 284-290.
Chow, J., F. Kovacic, Y. Dall Antonia, U. Krauss, F. Fersini, C. Schmeisser, B. Lauinger, P. Bongen, J. Pietruszka, M. Schmidt, I. Menyes, U. T. Bornscheuer, M. Eckstein, O. Thum, A. Liese, J. Mueller-Dieckmann, K. E. Jaeger and W. R. Streit (2012). "The metagenome-derived enzymes LipS and LipT increase the diversity of known lipases." PLoS One 7(10): e47665.
Christensen, K. Y., A. Naidu, M. E. Parent, J. Pintos, M. Abrahamowicz, J. Siemiatycki and A. Koushik (2012). "The risk of lung cancer related to dietary intake of flavonoids." Nutr Cancer 64(7): 964-974.
Courtois, S., C. M. Cappellano, M. Ball, F. X. Francou, P. Normand, G. Helynck, A. Martinez, S. J. Kolvek, J. Hopke, M. S. Osburne, P. R. August, R. Nalin, M. Guerineau, P. Jeannin, P. Simonet and J. L. Pernodet (2003). "Recombinant environmental libraries provide access to microbial diversity for drug discovery from natural products." Appl Environ Microbiol 69(1): 49-55.
6 References 100
Coutinho, P. M., E. Deleury, G. J. Davies and B. Henrissat (2003). "An evolving hierarchical family classification for glycosyltransferases." J Mol Biol 328(2): 307-317.
Cushnie, T. P. and A. J. Lamb (2005). "Antimicrobial activity of flavonoids." Int J Antimicrob Agents 26(5): 343-356.
Daniel, R. (2005). "The metagenomics of soil." Nat Rev Microbiol 3(6): 470-478.
Darst, S. A., A. Feklistov and C. A. Gross (2014). "Promoter melting by an alternative sigma, one base at a time." Nat Struct Mol Biol 21(4): 350-351.
Das, S. and J. P. Rosazza (2006). "Microbial and enzymatic transformations of flavonoids." J Nat Prod 69(3): 499-508.
Donovan, R. S., C. W. Robinson and B. R. Glick (1996). "Review: optimizing inducer and culture conditions for expression of foreign proteins under the control of the lac promoter." J Ind Microbiol 16(3): 145-154.
Du Toit, A. (2014). "Bacterial transcription: Promoter melting by alternative sigma factors." Nat Rev Microbiol 12(4): 235.
Ferrer, M., A. Beloqui, K. N. Timmis and P. N. Golyshin (2009). "Metagenomics for mining new genetic resources of microbial communities." J Mol Microbiol Biotechnol 16(1-2): 109-123.
Filippini, M., M. Svercel, E. Laczko, A. Kaech, U. Ziegler and H. C. Bagheri (2011). "Fibrella aestuarina gen. nov., sp. nov., a filamentous bacterium of the family Cytophagaceae isolated from a tidal flat, and emended description of the genus Rudanella Weon et al. 2008." Int J Syst Evol Microbiol 61(Pt 1): 184-189.
Frazzetto, G. (2003). "White biotechnology." EMBO Rep 4(9): 835-837.
Gabor, E. M., W. B. Alkema and D. B. Janssen (2004). "Quantifying the accessibility of the metagenome by random expression cloning techniques." Environ Microbiol 6(9): 879-886.
Giallo, J., C. Gaudin, J. P. Belaich, E. Petitdemange and F. Caillet-Mangin (1983). "Metabolism of glucose and cellobiose by cellulolytic mesophilic Clostridium sp. strain H10." Appl Environ Microbiol 45(3): 843-849.
Giraud, M. F. and J. H. Naismith (2000). "The rhamnose pathway." Curr Opin Struct Biol 10(6): 687-696.
Graefe, E. U., J. Wittig, S. Mueller, A. K. Riethling, B. Uehleke, B. Drewelow, H. Pforte, G. Jacobasch, H. Derendorf and M. Veit (2001). "Pharmacokinetics and bioavailability of quercetin glycosides in humans." J Clin Pharmacol 41(5): 492-499.
Gruber, T. M. and C. A. Gross (2003). "Multiple sigma subunits and the partitioning of bacterial transcription space." Annu. Rev. Microbiol. 57(1): 441-466.
Gupta, R. S. (2004). "The phylogeny and signature sequences characteristics of Fibrobacteres, Chlorobi, and Bacteroidetes." Crit Rev Microbiol 30(2): 123-143.
Handelsman, J., M. R. Rondon, S. F. Brady, J. Clardy and R. M. Goodman (1998). "Molecular biological access to the chemistry of unknown soil microbes: a new frontier for natural products." Chem Biol 5(10): R245-249.
Harborne, J. B. (1986). "Nature, distribution and function of plant flavonoids." Prog Clin Biol Res 213: 15-24.
Hedlund, B. P., J. J. Gosink and J. T. Staley (1997). "Verrucomicrobia div. nov., a new division of the bacteria containing three new species of Prosthecobacter." Antonie Van Leeuwenhoek 72(1): 29-38.
6 References 101
Hoffmeister, D., B. Wilkinson, G. Foster, P. J. Sidebottom, K. Ichinose and A. Bechthold (2002). "Engineered urdamycin glycosyltransferases are broadened and altered in substrate specificity." Chem Biol 9(3): 287-295.
Hyung Ko, J., B. Gyu Kim and A. Joong-Hoon (2006). "Glycosylation of flavonoids with a glycosyltransferase from Bacillus cereus." FEMS Microbiol Lett 258(2): 263-268.
Ilmberger, N., D. Meske, J. Juergensen, M. Schulte, P. Barthen, U. Rabausch, A. Angelov, M. Mientus, W. Liebl, R. A. Schmitz and W. R. Streit (2012). "Metagenomic cellulases highly tolerant towards the presence of ionic liquids--linking thermostability and halotolerance." Appl Microbiol Biotechnol 95(1): 135-146.
Iqbal, H. A., Z. Feng and S. F. Brady (2012). "Biocatalysts and small molecule products from metagenomic studies." Curr Opin Chem Biol 16(1-2): 109-116.
Jeon, Y. M., B. G. Kim, J. H. Kim, Y. Cheong and J. H. Ahn (2009). "Enzymatic Glycosylation of Phenolic Compounds Using BsGT-3 Based on Molecular Docking Simulation." Journal of the Korean Society for Applied Biological Chemistry 52(1): 98-101.
Jin, H., Q. Leng and C. Li (2012). "Dietary flavonoid for preventing colorectal neoplasms." Cochrane Database Syst Rev 8: CD009350.
Kapanidis, A. N., E. Margeat, T. A. Laurence, S. Doose, S. O. Ho, J. Mukhopadhyay, E. Kortkhonjia, V. Mekler, R. H. Ebright and S. Weiss (2005). "Retention of transcription initiation factor sigma70 in transcription elongation: single-molecule analysis." Mol Cell 20(3): 347-356.
Kim, H. J., B. G. Kim, J. A. Kim, Y. Park, Y. J. Lee, Y. Lim and J. H. Ahn (2007). "Glycosylation of flavonoids with E. coli expressing glycosyltransferase from Xanthomonas campestris." J Microbiol Biotechnol 17(3): 539-542.
Kirk, O., T. V. Borchert and C. C. Fuglsang (2002). "Industrial enzyme applications." Curr Opin Biotechnol 13(4): 345-351.
Konate, K., K. Yomalan, O. Sytar, P. Zerbo, M. Brestic, V. D. Patrick, P. Gagniuc and N. Barro (2014). "Free Radicals Scavenging Capacity, Antidiabetic and Antihypertensive Activities of Flavonoid-Rich Fractions from Leaves of Trichilia emetica and Opilia amentacea in an Animal Model of Type 2 Diabetes Mellitus." Evid Based Complement Alternat Med 2014: 867075.
Kovach, M. E., P. H. Elzer, D. S. Hill, G. T. Robertson, M. A. Farris, R. M. Roop, 2nd and K. M. Peterson (1995). "Four new derivatives of the broad-host-range cloning vector pBBR1MCS, carrying different antibiotic-resistance cassettes." Gene 166(1): 175-176.
Kren, V. and L. Martinkova (2001). "Glycosides in medicine: "The role of glycosidic residue in biological activity"." Curr Med Chem 8(11): 1303-1328.
Kren, V. and J. Thiem (1997). " Glycosylation employing bio-systems: from enzymes to whole cells." Chem. Soc. Rev. 26: 463-473.
Kurepa, J., R. Nakabayashi, T. Paunesku, M. Suzuki, K. Saito, G. E. Woloschak and J. A. Smalle (2014). "Direct isolation of flavonoids from plants using ultra-small anatase TiO(2) nanoparticles." Plant J 77(3): 443-453.
Lail, K., J. Sikorski, E. Saunders, A. Lapidus, T. Glavina Del Rio, A. Copeland, H. Tice, J. F. Cheng, S. Lucas, M. Nolan, D. Bruce, L. Goodwin, S. Pitluck, N. Ivanova, K. Mavromatis, G. Ovchinnikova, A. Pati, A. Chen, K. Palaniappan, M. Land, L. Hauser, Y. J. Chang, C. D. Jeffries, P. Chain, T. Brettin, J. C. Detter, A. Schutze, M. Rohde, B. J. Tindall, M. Goker, J. Bristow, J. A. Eisen, V. Markowitz, P. Hugenholtz, N. C. Kyrpides, H. P. Klenk and F. Chen (2010). "Complete genome sequence of Spirosoma linguale type strain (1)." Stand Genomic Sci 2(2): 176-185.
6 References 102
Lairson, L. L., B. Henrissat, G. J. Davies and S. G. Withers (2008). "Glycosyltransferases: structures, functions, and mechanisms." Annu Rev Biochem 77: 521-555.
Lang, E., A. Lapidus, O. Chertkov, T. Brettin, J. C. Detter, C. Han, A. Copeland, T. Glavina Del Rio, M. Nolan, F. Chen, S. Lucas, H. Tice, J. F. Cheng, M. Land, L. Hauser, Y. J. Chang, C. D. Jeffries, M. Kopitz, D. Bruce, L. Goodwin, S. Pitluck, G. Ovchinnikova, A. Pati, N. Ivanova, K. Mavrommatis, A. Chen, K. Palaniappan, P. Chain, J. Bristow, J. A. Eisen, V. Markowitz, P. Hugenholtz, M. Goker, M. Rohde, N. C. Kyrpides and H. P. Klenk (2009). "Complete genome sequence of Dyadobacter fermentans type strain (NS114)." Stand Genomic Sci 1(2): 133-140.
Langmead, B. and S. L. Salzberg (2012). "Fast gapped-read alignment with Bowtie 2." Nat Methods 9(4): 357-359.
Larbig, K. D., A. Christmann, A. Johann, J. Klockgether, T. Hartsch, R. Merkl, L. Wiehlmann, H. J. Fritz and B. Tummler (2002). "Gene islands integrated into tRNA(Gly) genes confer genome diversity on a Pseudomonas aeruginosa clone." J Bacteriol 184(23): 6665-6680.
Leggewie, C., H. Henning, C. Schmeisser, W. R. Streit and K. E. Jaeger (2006). "A novel transposon for functional expression of DNA libraries." J Biotechnol 123(3): 281-287.
Leonard, E., Y. Yan, Z. L. Fowler, Z. Li, C. G. Lim, K. H. Lim and M. A. Koffas (2008). "Strain improvement of recombinant Escherichia coli for efficient production of plant flavonoids." Mol Pharm 5(2): 257-265.
Li, Y., M. Wexler, D. J. Richardson, P. L. Bond and A. W. Johnston (2005). "Screening a wide host-range, waste-water metagenomic library in tryptophan auxotrophs of Rhizobium leguminosarum and of Escherichia coli reveals different classes of cloned trp genes." Environ Microbiol 7(12): 1927-1936.
Lim, E. K., D. A. Ashford and D. J. Bowles (2006). "The synthesis of small-molecule rhamnosides through the rational design of a whole-cell biocatalysis system." Chembiochem 7(8): 1181-1185.
Lim, E. K., D. A. Ashford, B. Hou, R. G. Jackson and D. J. Bowles (2004). "Arabidopsis glycosyltransferases as biocatalysts in fermentation for regioselective synthesis of diverse quercetin glucosides." Biotechnol Bioeng 87(5): 623-631.
Lu, M. F., Z. T. Xiao and H. Y. Zhang (2013). "Where do health benefits of flavonoids come from? Insights from flavonoid targets and their evolutionary history." Biochem Biophys Res Commun 434(4): 701-704.
Mabry TJ, M. K., Thomas MB (1970). The systematic identification of flavonoids. New York, NY, Springer-Verlag.
Mackenzie, P. I., I. S. Owens, B. Burchell, K. W. Bock, A. Bairoch, A. Belanger, S. Fournel-Gigleux, M. Green, D. W. Hum, T. Iyanagi, D. Lancet, P. Louisot, J. Magdalou, J. R. Chowdhury, J. K. Ritter, H. Schachter, T. R. Tephly, K. F. Tipton and D. W. Nebert (1997). "The UDP glycosyltransferase gene superfamily: recommended nomenclature update based on evolutionary divergence." Pharmacogenetics 7(4): 255-269.
Macready, A. L., T. W. George, M. F. Chong, D. S. Alimbetov, Y. Jin, A. Vidal, J. P. Spencer, O. B. Kennedy, K. M. Tuohy, A. M. Minihane, M. H. Gordon, J. A. Lovegrove and F. S. Group (2014). "Flavonoid-rich fruit and vegetables improve microvascular reactivity and inflammatory status in men at risk of cardiovascular disease-FLAVURS: a randomized controlled trial." Am J Clin Nutr 99(3): 479-489.

6 References 103
Manach, C., A. Scalbert, C. Morand, C. Remesy and L. Jimenez (2004). "Polyphenols: food sources and bioavailability." Am J Clin Nutr 79(5): 727-747.
Martinez, A., S. J. Kolvek, C. L. Yip, J. Hopke, K. A. Brown, I. A. MacNeil and M. S. Osburne (2004). "Genetically modified bacterial strains and novel bacterial artificial chromosome shuttle vectors for constructing environmental libraries and detecting heterologous natural products in multiple expression hosts." Appl Environ Microbiol 70(4): 2452-2463.
McMahon, M. D., C. Guan, J. Handelsman and M. G. Thomas (2012). "Metagenomic analysis of Streptomyces lividans reveals host-dependent functional expression." Appl Environ Microbiol 78(10): 3622-3629.
Miskin, I. P., P. Farrimond and I. M. Head (1999). "Identification of novel bacterial lineages as active members of microbial populations in a freshwater sediment using a rapid RNA extraction procedure and RT-PCR." Microbiology 145 ( Pt 8): 1977-1987.
Montgomery, L., B. Flesher and D. Stahl (1988). "Transfer of Bacteroides succinogenes (Hungate) to Fibrobacter gen. nov. as Fibrobacter succinogenes comb. nov. and Description of Fibrobacter intestinalis sp. nov." Int. J. Syst. Bacteriol. 38(4): 430-435.
Mulichak, A. M., W. Lu, H. C. Losey, C. T. Walsh and R. M. Garavito (2004). "Crystal structure of vancosaminyltransferase GtfD from the vancomycin biosynthetic pathway: interactions with acceptor and nucleotide ligands." Biochemistry 43(18): 5170-5180.
Nakano, Y., Y. Yoshida, Y. Yamashita and T. Koga (1995). "Construction of a series of pACYC-derived plasmid vectors." Gene 162(1): 157-158.
Neu, R. (1957). "Chelate von Diarylborsäuren mit aliphatischen Oxyalkylaminen als Reagenzien für den Nachweis von Oxyphenyl-benzo-γ-pyronen." Naturwissenschaften 44(6): 181-182.
Osmani, S. A., S. Bak and B. L. Moller (2009). "Substrate specificity of plant UDP-dependent glycosyltransferases predicted from crystal structures and homology modeling." Phytochemistry 70(3): 325-347.
Osterberg, S., T. del Peso-Santos and V. Shingler (2011). "Regulation of alternative sigma factor use." Annu Rev Microbiol 65: 37-55.
Perner, M., N. Ilmberger, H. U. Köhler, J. Chow and W. R. Streit (2011). Emerging fields in functional metagenomics and its industrial relevance: overcoming limitations and redirecting the search for novel biocatalysts. Handbook of molecular microbial ecology II: metagenomics in different habitats. Hoboken, NJ, John Wiley & Sons, Inc., : 481-498.
Petitdemange, E., F. Caillet, J. Giallo and C. Gaudin (1984). "Clostridium-Cellulolyticum Sp-Nov, a Cellulolytic, Mesophilic Species from Decayed Grass." International Journal of Systematic Bacteriology 34(2): 155-159.
Rabausch, U., N. Ilmberger and W. R. Streit (2014). "The metagenome-derived enzyme RhaB opens a new subclass of bacterial B type alpha-l-rhamnosidases." J Biotechnol.
Rabausch, U., J. Juergensen, N. Ilmberger, S. Bohnke, S. Fischer, B. Schubach, M. Schulte and W. R. Streit (2013). "Functional screening of metagenome and genome libraries for detection of novel flavonoid-modifying enzymes." Appl Environ Microbiol 79(15): 4551-4563.
Rao, K. V. and N. T. Weisner (1981). "Microbial Transformation of Quercetin by Bacillus cereus." Appl Environ Microbiol 42(3): 450-452.
Rappe, M. S. and S. J. Giovannoni (2003). "The uncultured microbial majority." Annu Rev Microbiol 57: 369-394.
6 References 104
Ronaghi, M., M. Uhlen and P. Nyren (1998). "A sequencing method based on real-time pyrophosphate." Science 281(5375): 363, 365.
Rousset, M., L. Casalot, B. J. Rapp-Giles, Z. Dermoun, P. de Philip, J. P. Belaich and J. D. Wall (1998). "New shuttle vectors for the introduction of cloned DNA in Desulfovibrio." Plasmid 39(2): 114-122.
Sambrook, J., D.W. Russel, Ed. (2001). Molecular cloning, a laboratory manual. New York, USA, Cold Spring Harbor Laboratory Press.
Sanger, F., S. Nicklen and A. R. Coulson (1977). "DNA sequencing with chain-terminating inhibitors." Proc Natl Acad Sci U S A 74(12): 5463-5467.
Schallmey, M., A. Ly, C. Wang, G. Meglei, S. Voget, W. R. Streit, B. T. Driscoll and T. C. Charles (2011). "Harvesting of novel polyhydroxyalkanaote (PHA) synthase encoding genes from a soil metagenome library using phenotypic screening." FEMS Microbiol Lett 321(2): 150-156.
Schmeisser, C., H. Steele and W. R. Streit (2007). "Metagenomics, biotechnology with non-culturable microbes." Appl Microbiol Biotechnol 75(5): 955-962.
Schutz, K., E. Muks, R. Carle and A. Schieber (2006). "Quantitative determination of phenolic compounds in artichoke-based dietary supplements and pharmaceuticals by high-performance liquid chromatography." J Agric Food Chem 54(23): 8812-8817.
Sikder, K., S. B. Kesh, N. Das, K. Manna and S. Dey (2014). "The high antioxidative power of quercetin (aglycone flavonoid) and its glycone (rutin) avert high cholesterol diet induced hepatotoxicity and inflammation in Swiss albino mice." Food Funct.
Simon, C. and R. Daniel (2009). "Achievements and new knowledge unraveled by metagenomic approaches." Appl Microbiol Biotechnol 85(2): 265-276.
Simon, C. and R. Daniel (2011). "Metagenomic analyses: past and future trends." Appl Environ Microbiol 77(4): 1153-1161.
Soetaert, W. and E. Vandamme (2006). "The impact of industrial biotechnology." Biotechnol J 1(7-8): 756-769.
Stackebrandt, E., R. G. E. Murray and H. G. Trüper (1988). "Proteobacteria classis nov., a Name for the Phylogenetic Taxon That Includes the “Purple Bacteria and Their Relatives." Int J Syst Bacteriol 38(3): 321-325.
Steele, H. L., K. E. Jaeger, R. Daniel and W. R. Streit (2009). "Advances in recovery of novel biocatalysts from metagenomes." J Mol Microbiol Biotechnol 16(1-2): 25-37.
Stevens, D. C., K. R. Conway, N. Pearce, L. R. Villegas-Penaranda, A. G. Garza and C. N. Boddy (2013). "Alternative sigma factor over-expression enables heterologous expression of a type II polyketide biosynthetic pathway in Escherichia coli." PLoS One 8(5): e64858.
Streit, W. R., R. Daniel and K. E. Jaeger (2004). "Prospecting for biocatalysts and drugs in the genomes of non-cultured microorganisms." Curr Opin Biotechnol 15(4): 285-290.
Streit, W. R. and R. A. Schmitz (2004). "Metagenomics--the key to the uncultured microbes." Curr Opin Microbiol 7(5): 492-498.
Tahara, S. (2007). "A journey of twenty-five years through the ecological biochemistry of flavonoids." Biosci Biotechnol Biochem 71(6): 1387-1404.
Taupp, M., K. Mewis and S. J. Hallam (2011). "The art and design of functional metagenomic screens." Curr Opin Biotechnol 22(3): 465-472.
Thilakarathna, S. H. and H. P. Rupasinghe (2013). "Flavonoid bioavailability and attempts for bioavailability enhancement." Nutrients 5(9): 3367-3387.
6 References 105
Troeschel, S. C., T. Drepper, C. Leggewie, W. R. Streit and K. E. Jaeger (2010). "Novel tools for the functional expression of metagenomic DNA." Methods Mol Biol 668: 117-139.
Tuffin, M., D. Anderson, C. Heath and D. A. Cowan (2009). "Metagenomic gene discovery: how far have we moved into novel sequence space?" Biotechnol J 4(12): 1671-1683.
Uchiyama, T. and K. Miyazaki (2009). "Functional metagenomics for enzyme discovery: challenges to efficient screening." Curr Opin Biotechnol 20(6): 616-622.
Ververidis, F., E. Trantas, C. Douglas, G. Vollmer, G. Kretzschmar and N. Panopoulos (2007). "Biotechnology of flavonoids and other phenylpropanoid-derived natural products. Part II: Reconstruction of multienzyme pathways in plants and microbes." Biotechnol J 2(10): 1235-1249.
Ververidis, F. T., E; Douglas, C.; Vollmer, G.; Ketzschmar, G; Panapoulos, N. (2007). "Biotechnology of flavonoids and other phenylpropanoid-derived natural products. Part I: Chemical diversity, impacts on plant biology and human health." Biotechnology Journal 1214-1234.
Vingadassalom, D., A. Kolb, C. Mayer, T. Rybkine, E. Collatz and I. Podglajen (2005). "An unusual primary sigma factor in the Bacteroidetes phylum." Mol Microbiol 56(4): 888-902.
Wagner, H., Bladt, S., Zgainski, E. M. (1983). Drogenanalyse, Dünnschichtchromatographische Analyse von Arzneidrogen. Berlin - Heidelberg - New York, Springer-Verlag.
Wagner, M. and M. Horn (2006). "The Planctomycetes, Verrucomicrobia, Chlamydiae and sister phyla comprise a superphylum with biotechnological and medical relevance." Curr Opin Biotechnol 17(3): 241-249.
Wang, C., D. J. Meek, P. Panchal, N. Boruvka, F. S. Archibald, B. T. Driscoll and T. C. Charles (2006). "Isolation of poly-3-hydroxybutyrate metabolism genes from complex microbial communities by phenotypic complementation of bacterial mutants." Appl Environ Microbiol 72(1): 384-391.
Warnecke, F., R. Amann and J. Pernthaler (2004). "Actinobacterial 16S rRNA genes from freshwater habitats cluster in four distinct lineages." Environ Microbiol 6(3): 242-253.
Warren, R. L., J. D. Freeman, R. C. Levesque, D. E. Smailus, S. Flibotte and R. A. Holt (2008). "Transcription of foreign DNA in Escherichia coli." Genome Res 18(11): 1798-1805.
Weon, H. Y., B. Y. Kim, J. H. Joa, S. W. Kwon, W. G. Kim and B. S. Koo (2008). "Niabella soli sp. nov., isolated from soil from Jeju Island, Korea." Int J Syst Evol Microbiol 58(Pt 2): 467-469.
Weon, H. Y., B. Y. Kim, C. M. Lee, S. B. Hong, Y. A. Jeon, B. S. Koo and S. W. Kwon (2009). "Solitalea koreensis gen. nov., sp. nov. and the reclassification of [Flexibacter] canadensis as Solitalea canadensis comb. nov." Int J Syst Evol Microbiol 59(Pt 8): 1969-1975.
Weon, H. Y., B. Y. Kim, S. H. Yoo, S. Y. Lee, S. W. Kwon, S. J. Go and E. Stackebrandt (2006). "Niastella koreensis gen. nov., sp. nov. and Niastella yeongjuensis sp. nov., novel members of the phylum Bacteroidetes, isolated from soil cultivated with Korean ginseng." Int J Syst Evol Microbiol 56(Pt 8): 1777-1782.
Wexler, M., P. L. Bond, D. J. Richardson and A. W. Johnston (2005). "A wide host-range metagenomic library from a waste water treatment plant yields a novel alcohol/aldehyde dehydrogenase." Environ Microbiol 7(12): 1917-1926.
6 References 106
Williams, G. J., R. W. Gantt and J. S. Thorson (2008). "The impact of enzyme engineering upon natural product glycodiversification." Curr Opin Chem Biol 12(5): 556-564.
Wösten, M. M. S. M. (1998). "Eubacterial sigma-factors." FEMS Microbiol. Rev. 22(3): 127-150.
Xiao, J., T. S. Muzashvili and M. I. Georgiev (2014). "Advances in the biotechnological glycosylation of valuable flavonoids." Biotechnol Adv.
Yang, M., M. R. Proctor, D. N. Bolam, J. C. Errey, R. A. Field, H. J. Gilbert and B. G. Davis (2005). "Probing the breadth of macrolide glycosyltransferases: in vitro remodeling of a polyketide antibiotic creates active bacterial uptake and enhances potency." J Am Chem Soc 127(26): 9336-9337.
Yoon, J. A., B. G. Kim, W. J. Lee, Y. Lim, Y. Chong and J. H. Ahn (2012). "Production of a novel quercetin glycoside through metabolic engineering of Escherichia coli." Appl Environ Microbiol 78(12): 4256-4262.
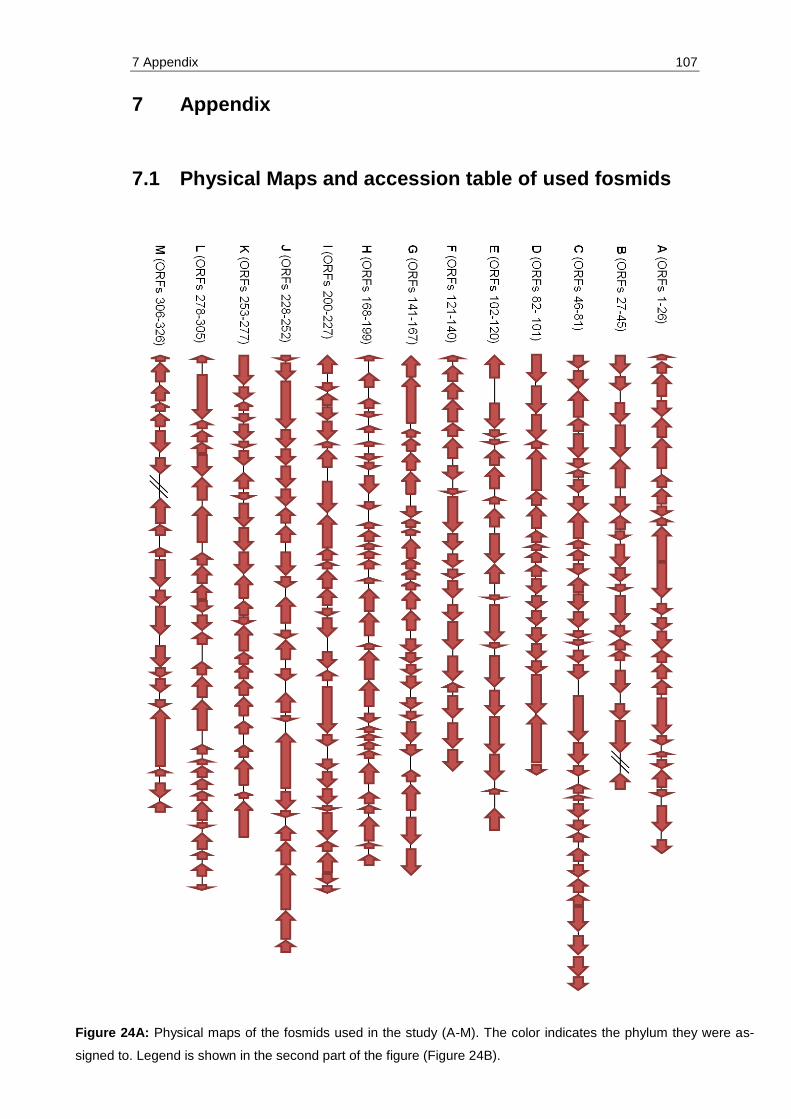
7 Appendix 107
7 Appendix
7.1 Physical Maps and accession table of used fosmids
Figure 24A: Physical maps of the fosmids used in the study (A-M). The color indicates the phylum they were as-
signed to. Legend is shown in the second part of the figure (Figure 24B).

7 Appendix 108
Figure 24B: Physical maps of the fosmids used in the study (N-X). The color indicates the phylum they were as-
signed to as shown in the legend.
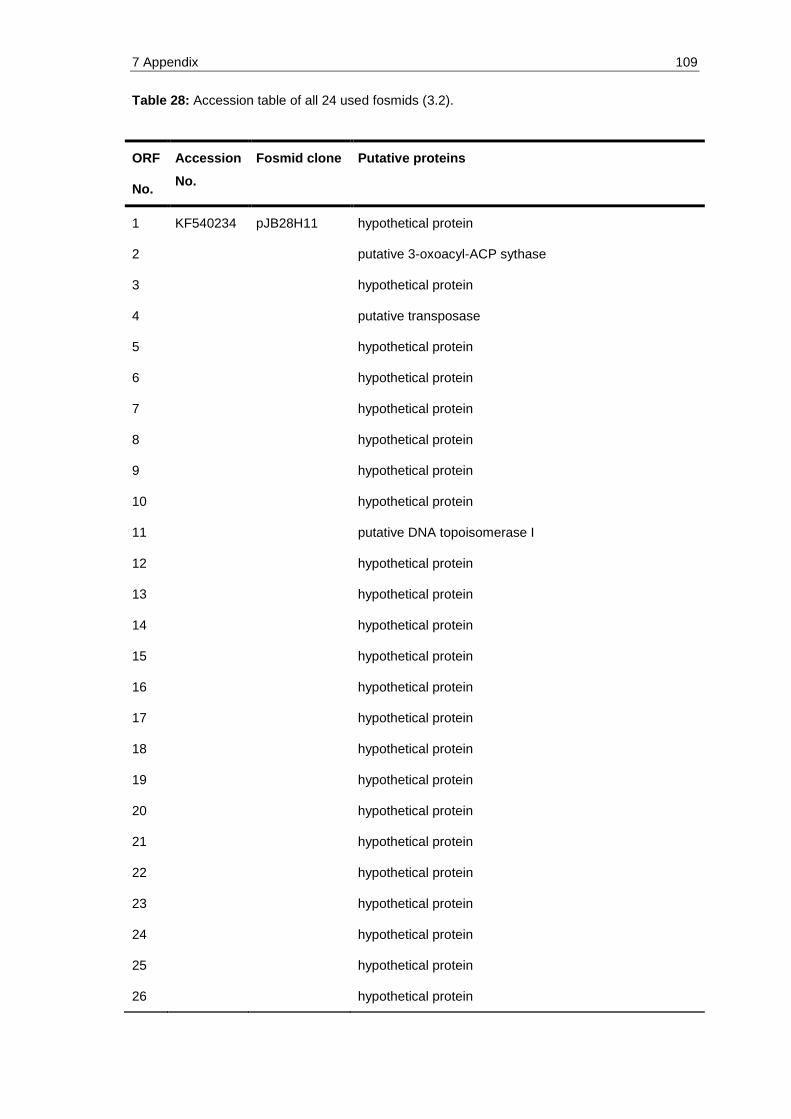
7 Appendix 109
Table 28: Accession table of all 24 used fosmids (3.2).
ORF
No.
Accession
No.
Fosmid clone Putative proteins
1 KF540234 pJB28H11 hypothetical protein
2 putative 3-oxoacyl-ACP sythase
3 hypothetical protein
4 putative transposase
5 hypothetical protein
6 hypothetical protein
7 hypothetical protein
8 hypothetical protein
9 hypothetical protein
10 hypothetical protein
11 putative DNA topoisomerase I
12 hypothetical protein
13 hypothetical protein
14 hypothetical protein
15 hypothetical protein
16 hypothetical protein
17 hypothetical protein
18 hypothetical protein
19 hypothetical protein
20 hypothetical protein
21 hypothetical protein
22 hypothetical protein
23 hypothetical protein
24 hypothetical protein
25 hypothetical protein
26 hypothetical protein
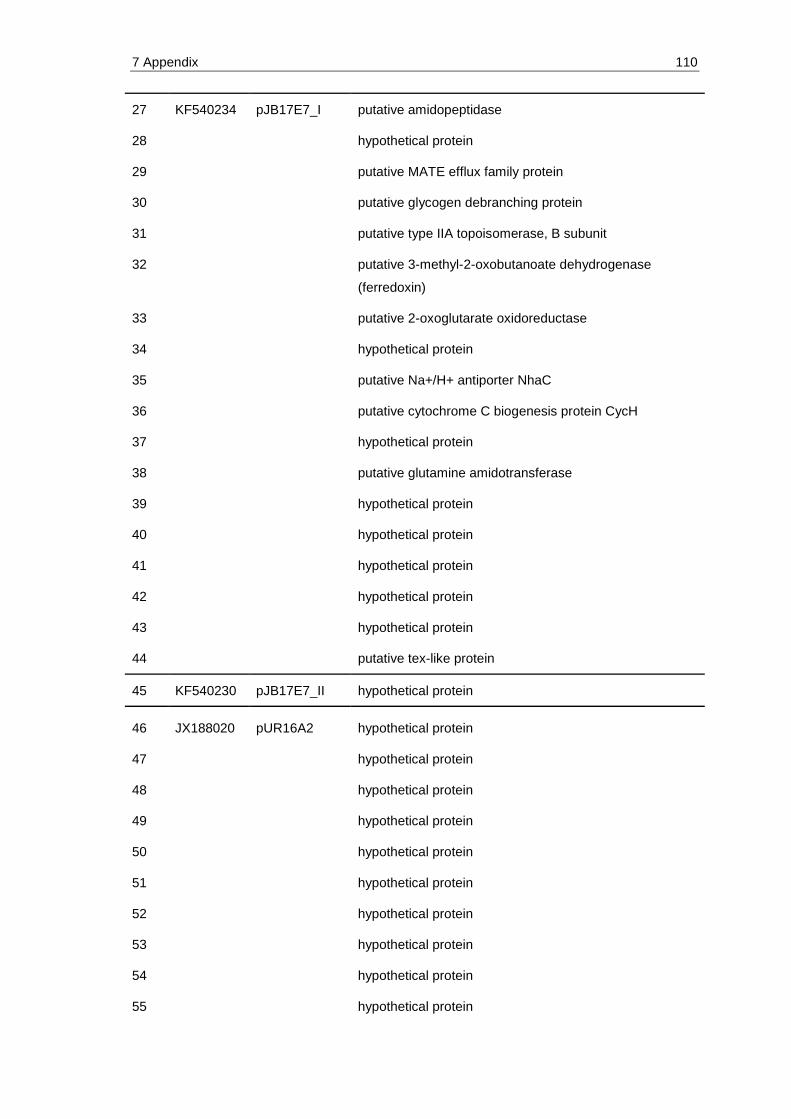
7 Appendix 110
27 KF540234 pJB17E7_I putative amidopeptidase
28 hypothetical protein
29 putative MATE efflux family protein
30 putative glycogen debranching protein
31 putative type IIA topoisomerase, B subunit
32 putative 3-methyl-2-oxobutanoate dehydrogenase
(ferredoxin)
33 putative 2-oxoglutarate oxidoreductase
34 hypothetical protein
35 putative Na+/H+ antiporter NhaC
36 putative cytochrome C biogenesis protein CycH
37 hypothetical protein
38 putative glutamine amidotransferase
39 hypothetical protein
40 hypothetical protein
41 hypothetical protein
42 hypothetical protein
43 hypothetical protein
44 putative tex-like protein
45 KF540230 pJB17E7_II hypothetical protein
46 JX188020 pUR16A2 hypothetical protein
47 hypothetical protein
48 hypothetical protein
49 hypothetical protein
50 hypothetical protein
51 hypothetical protein
52 hypothetical protein
53 hypothetical protein
54 hypothetical protein
55 hypothetical protein
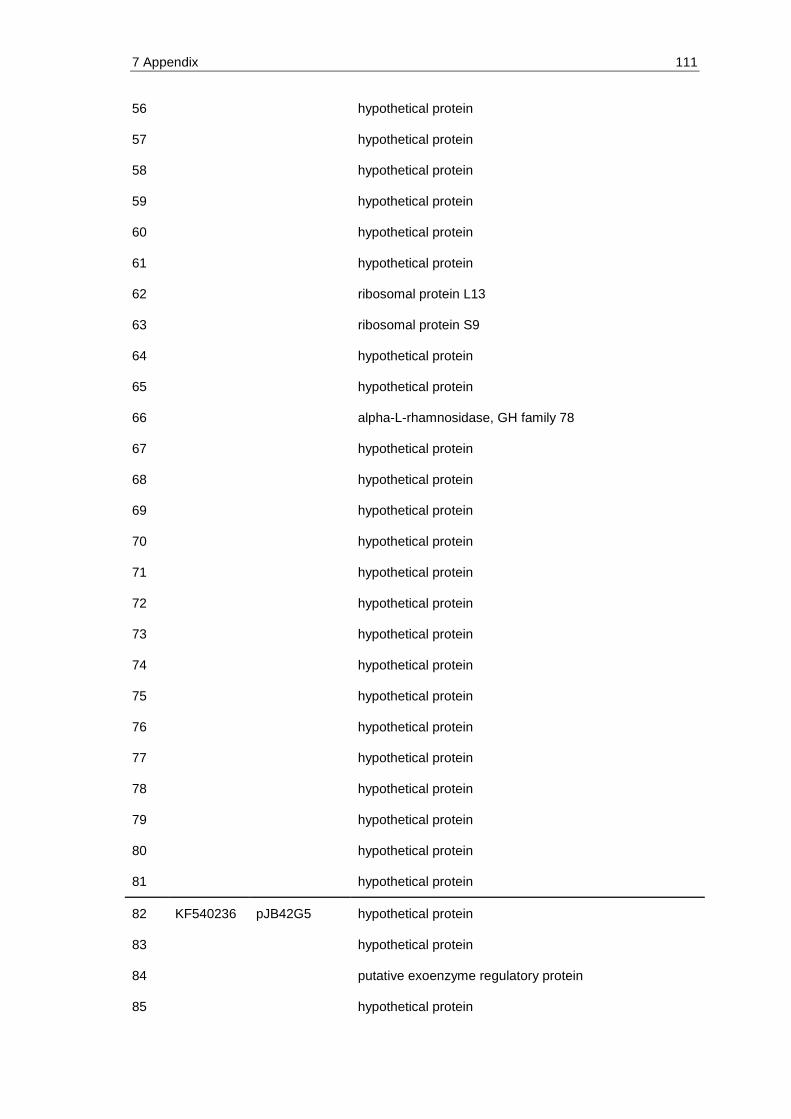
7 Appendix 111
56 hypothetical protein
57 hypothetical protein
58 hypothetical protein
59 hypothetical protein
60 hypothetical protein
61 hypothetical protein
62 ribosomal protein L13
63 ribosomal protein S9
64 hypothetical protein
65 hypothetical protein
66 alpha-L-rhamnosidase, GH family 78
67 hypothetical protein
68 hypothetical protein
69 hypothetical protein
70 hypothetical protein
71 hypothetical protein
72 hypothetical protein
73 hypothetical protein
74 hypothetical protein
75 hypothetical protein
76 hypothetical protein
77 hypothetical protein
78 hypothetical protein
79 hypothetical protein
80 hypothetical protein
81 hypothetical protein
82 KF540236 pJB42G5 hypothetical protein
83 hypothetical protein
84 putative exoenzyme regulatory protein
85 hypothetical protein
7 Appendix 112
86 putative DNA topoisomerase IV subunit A
87 hypothetical protein
88 putative ribosomal large subunit pseudouridine synthase
B
89 hypothetical protein
90 hypothetical protein
91 hypothetical protein
92 hypothetical protein
93 putative ATPase associated with various cellular activities
94 hypothetical protein
95 hypothetical protein
96 putative N-terminal double-transmembrane domain-
containing protein
97 hypothetical protein
98 hypothetical protein
99 hypothetical protein
100 hypothetical protein
101 hypothetical protein
102 KF540238 pJB65E1 hypothetical protein
103 hypothetical protein
104 hypothetical protein
105 hypothetical protein
106 putative chitinase
107 hypothetical protein
108 hypothetical protein
109 putative beta-ketoacyl-acyl-carrier-protein synthase
110 hypothetical protein
111 putative GDSL family lipase
112 hypothetical protein
113 putative ATP-dependent helicase
114 hypothetical protein

7 Appendix 113
115 putative carbohydrate-active enzyme
116 putative carboxylesterase type B
117 putative family 3 glycosyl hydrolase
118 hypothetical protein
119 hypothetical protein
120 putative ragB/SusB domain protein
121 KF540239 pJB69A5 hypothetical protein
122 hypothetical protein
123 hypothetical protein
124 putative ABC transport ATP-binding protein
125 putative membrane protein
126 putative transporter
127 hypothetical protein
128 hypothetical protein
129 putative beta-glucosidase
130 Putative
hydroxymethylpyrimidine/phosphomethylpyrimidine ki-
nase
131 putative pyridoxal biosynthesis lyase
132 hypothetical protein
133 hypothetical protein
134 hypothetical protein
135 putative beta-glucoronidase
136 putative long-chain fatty acid-CoA ligase
137 hypothetical protein
138 putative iron-sulfur cluster-binding protein
139 hypothetical protein
140 putative aldo/keto reductase family oxidoreductase
141 KF540240 pJB71G8 hypothetical protein
142 putative penicillin-binding protein 2
7 Appendix 114
143 hypothetical protein
144 putative rod-shape-determining protein MreC
145 putative phosphoribosylaminoimidazolecarboxamide
formyltransferase
146 putative phosphoribosylaminoimidazolecarboxamide
formyltransferase
147 hypothetical protein
148 hypothetical protein
149 hypothetical protein
150 putative NADH:ubiquinone oxidoreductase subunit F
151 putative Na(+)-translocating NADH-guinone reductase
subunit E
152 putative NADH:ubiquinone oxidoreductase subunit D
153 hypothetical protein
154 hypothetical protein
155 putative Na(+)-translocating reductase subunit A
156 putative motA/TolQ/ExbB proton channel
157 hypothetical protein
158 hypothetical protein
159 hypothetical protein
160 hypothetical protein
161 hypothetical protein
162 hypothetical protein
163 putative triosephosphate isomerase
164 hypothetical protein
165 hypothetical protein
166 putative DNA polymerase III subunit gamma/tau
167 putative cobalamin biosynthesis protein CbiG
168 KF540242 pJB83B9 hypothetical protein
169 hypothetical protein
170 hypothetical protein
7 Appendix 115
171 hypothetical protein
172 hypothetical protein
173 hypothetical protein
174 hypothetical protein
175 hypothetical protein
176 hypothetical protein
177 hypothetical protein
178 hypothetical protein
179 hypothetical protein
180 hypothetical protein
181 hypothetical protein
182 hypothetical protein
183 hypothetical protein
184 hypothetical protein
185 hypothetical protein
186 hypothetical protein
187 hypothetical protein
188 hypothetical protein
189 hypothetical protein
190 hypothetical protein
191 hypothetical protein
192 hypothetical protein
193 hypothetical protein
194 hypothetical protein
195 putative phage portal protein
196 hypothetical protein
197 hypothetical protein
198 hypothetical protein
199 hypothetical protein
200 KF540245 pJB89E1 hypothetical protein
7 Appendix 116
201 hypothetical protein
202 hypothetical protein
203 hypothetical protein
204 hypothetical protein
205 hypothetical protein
206 hypothetical protein
207 hypothetical protein
208 putative beta-D-glucoside glucohydrolase
209 hypothetical protein
210 hypothetical protein
211 putative CelEx-BR12
212 hypothetical protein
213 hypothetical protein
214 hypothetical protein
215 putative transposase
216 hypothetical protein
217 putative hydrolase
218 hypothetical protein
219 hypothetical protein
220 hypothetical protein
221 hypothetical protein
222 hypothetical protein
223 putative Fe-S oxidoreductase
224 hypothetical protein
225 hypothetical protein
226 hypothetical protein
227 hypothetical protein
228 KF540246 pJB92C9 hypothetical protein
229 hypothetical protein
230 hypothetical protein
7 Appendix 117
231 hypothetical protein
232 hypothetical protein
233 putative beta-N-acetylhexosaminidase
234 hypothetical protein
235 hypothetical protein
236 putative ATPase
237 putative transposase IS21
238 putative ATP-binding protein
239 putative transposase
240 hypothetical protein
241 hypothetical protein
242 hypothetical protein
243 hypothetical protein
244 hypothetical protein
245 hypothetical protein
246 hypothetical protein
247 hypothetical protein
248 hypothetical protein
249 putative glycyl-tRNA synthetase
250 hypothetical protein
251 putative 4-alpha-glucanotransferase
252 hypothetical protein
253 KF540248 pJB102C1 hypothetical protein
254 hypothetical protein
255 putative elongation factor P
256 hypothetical protein
257 hypothetical protein
258 hypothetical protein
259 hypothetical protein
260 putative 3-dehydroguinate synthase
7 Appendix 118
261 hypothetical protein
262 putative potassium transporter CPA
263 putative epimerase
264 putative dead/deah box helicase domain-containing pro-
tein
265 hypothetical protein
266 putative phoh family protein
267 hypothetical protein
268 putative glutaminyl-tRNA synthetase
269 putative acyl-(acyl-carrier-protein)-UDP-N-
acetylglucosamine O-acyltransferase
270 hypothetical protein
271 putative UDP-3-O-acylglucosamine N-acyltransferase
272 putative metal dependent phosphohydrolase
273 putative RNA polymerase sigma factor rpoD
274 hypothetical protein
275 putative adenine deaminase
276 hypothetical protein
277 putative ATP-dependent Clp protease ClpC
278 KF540249 pJB135F11 hypothetical protein
279 hypothetical protein
280 hypothetical protein
281 hypothetical protein
282 hypothetical protein
283 putative ATP-dependent endonuclease
284 putative acetyl-CoA hydrolase
285 putative membrane protein
286 hypothetical protein
287 putative group 1 glycosyl transferase
288 hypothetical protein
289 hypothetical protein

7 Appendix 119
290 putative polysaccharide biosynthesis protein
291 putative lipopolysaccharide biosynthesis protein LicD
292 hypothetical protein
293 putative lipopolysaccharide biosynthesis protein
294 putative methionyl-tRNA-synthetase
295 hypothetical protein
296 hypothetical protein
297 putative uroporphyrinogen-III synthase
298 hypothetical protein
299 hypothetical protein
300 putative S-adenosylmethionine synthetase
301 hypothetical protein
302 putative S-adenosylmethionine tRNA ribosyltransferase
303 hypothetical protein
304 putative UDP-diphosphatase
305 hypothetical protein
306 KF540251 pJB154B8_I hypothetical protein
307 putative nuclease SbcCD, subunit D
308 putative membrane protein
309 hypothetical protein
310 hypothetical protein
311 putative major facilitator transporter
312 putative uracil permease
313 KF540252 pJB154B8_II hypothetical protein
314 putative uracil-DNA glycosylase
315 hypothetical protein
316 putative ABC-transporter
317 hypothetical protein
318 hypothetical protein
319 putative tRNA nucleotidyltransferase/poly(A) polymerase
7 Appendix 120
family protein
320 hypothetical protein
321 putative permease
322 hypothetical protein
323 putative DNA polymerase III, subunit alpha
324 hypothetical protein
325 hypothetical protein
326 hypothetical protein
327 KF540250 pJB148G3 hypothetical protein
328 putative hydrolase
329 putative helix-turn-helix protein
330 hypothetical protein
331 hypothetical protein
332 hypothetical protein
333 hypothetical protein
334 putative galactonate dehydratase
335 hypothetical protein
336 hypothetical protein
337 hypothetical protein
338 hypothetical protein
339 hypothetical protein
340 hypothetical protein
341 hypothetical protein
342 hypothetical protein
343 hypothetical protein
344 hypothetical protein
345 hypothetical protein
346 hypothetical protein
347 hypothetical protein
348 hypothetical protein
7 Appendix 121
349 hypothetical protein
350 KF540253 190D12_I putative acridine efflux pump protein
351 putative aldehyde dehydrogenase
352 hypothetical protein
353 putative transcriptional regulator, AraC family
354 putative nitrate/sulfonate/bicarbonate family ABC trans-
porter substrate-binding protein
355 hypothetical protein
356 hypothetical protein
357 putative acyltransferase
358 KF540227 pJB190D12_II putative aminoglycoside/multidrug efflux pump
359 putative outer membrane transport protein involved toxic
tolerance
360 hypothetical protein
361 putative fumarase
362 hypothetical protein
363 putative HRS1-like GTP-binding protein
364 hypothetical protein
365 hypothetical protein
366 hypothetical protein
367 putative ATP-dependent DNA helicase
368 putative mandelate racemase
369 putative ABC-type transport system, periplasmic compo-
nent/surface lipoprotein
370 hypothetical protein
371 hypothetical protein
372 hypothetical protein
373 hypothetical protein
374 hypothetical protein
375 hypothetical protein
376 KF540228 pJB16B1 hypothetical protein
7 Appendix 122
377 hypothetical protein
378 hypothetical protein
379 hypothetical protein
380 hypothetical protein
381 hypothetical protein
382 hypothetical protein
383 hypothetical protein
384 hypothetical protein
385 hypothetical protein
386 hypothetical protein
387 hypothetical protein
388 hypothetical protein
389 hypothetical protein
390 hypothetical protein
391 hypothetical protein
392 hypothetical protein
393 hypothetical protein
394 hypothetical protein
395 hypothetical protein
396 hypothetical protein
397 hypothetical protein
398 hypothetical protein
399 hypothetical protein
400 hypothetical protein
401 hypothetical protein
402 hypothetical protein
403 hypothetical protein
404 hypothetical protein
405 KF540235 pJB39A3 hypothetical protein
406 hypothetical protein
7 Appendix 123
407 hypothetical protein
408 hypothetical protein
409 hypothetical protein
410 hypothetical protein
411 hypothetical protein
412 hypothetical protein
413 hypothetical protein
414 hypothetical protein
415 hypothetical protein
416 hypothetical protein
417 putative transposase
418 hypothetical protein
419 hypothetical protein
420 hypothetical protein
421 putative FAD dependent oxidoreductase
422 hypothetical protein
423 hypothetical protein
424 hypothetical protein
425 hypothetical protein
426 hypothetical protein
427 hypothetical protein
428 KF540237 pJB45G2 hypothetical protein
429 putative hemagglutinin
430 putative iron dicitrate transport regulator FecR
431 hypothetical protein
432 hypothetical protein
433 hypothetical protein
434 hypothetical protein
435 putative DNA-binding protein
436 putative aldolase
7 Appendix 124
437 putative twin-argenine translocation pathway signal pro-
tein
438 hypothetical protein
439 hypothetical protein
440 putative alpha-L-rhamnosidase
441 putative esterase/lipase like protein
442 putative glucocerebrosidase
443 putative oxidoreductase
444 hypothetical protein
445 hypothetical protein
446 hypothetical protein
447 hypothetical protein
448 hypothetical protein
449 putative ArsS family transcriptional regulator
450 putative class V aminotransferase
451 putative major facilitator superfamily protein
452 hypothetical protein
453 hypothetical protein
454 putative thimanine synthesis protein ThiJ
455 putative transcriptional regulator
456 putative histidine kinase
457 putative fructose-1,6-biphosphate aldolase
458 KF540241 pJB77G10 putative hydrolase
459 hypothetical protein
460 putative phosphatidylinositol kinase
461 hypothetical protein
462 putative chloramphenicol acetyltransferase
463 hypothetical protein
464 hypothetical protein
465 hypothetical protein

7 Appendix 125
466 hypothetical protein
467 putative esterase
468 hypothetical protein
469 hypothetical protein
470 hypothetical protein
471 hypothetical protein
472 hypothetical protein
473 putative isomerase
474 putative radical SAM additional 4Fe4S-binding SPASM
domain-containing protein
475 hypothetical protein
476 putative ABC-transporter permease
477 putative ABC transporter ATP-binding protein
478 hypothetical protein
479 hypothetical protein
480 putative aminotransferase class I/II
481 hypothetical protein
482 putative 4-aminobutyrate aminotransferase
483 putative cation diffusion facilitator family transporter
484 hypothetical protein
485 hypothetical protein
486 KF540244 pJB84G2 hypothetical protein
487 hypothetical protein
488 hypothetical protein
489 hypothetical protein
490 hypothetical protein
491 hypothetical protein
492 hypothetical protein
493 hypothetical protein
494 hypothetical protein
7 Appendix 126
495 putative hydrolase
496 hypothetical protein
497 hypothetical protein
498 hypothetical protein
499 hypothetical protein
500 hypothetical protein
501 putative FAD-dependent oxidoreductase
502 hypothetical protein
503 hypothetical protein
504 hypothetical protein
505 putative ribose-phosphate pyrophosphokinase
506 hypothetical protein
507 hypothetical protein
508 hypothetical protein
509 hypothetical protein
510 hypothetical protein
511 hypothetical protein
512 hypothetical protein
513 hypothetical protein
514 hypothetical protein
515 KF540231 pJB18DI_I putative RNA methyltransferase
516 hypothetical protein
517 putative lipoprotein
518 hypothetical protein
519 hypothetical protein
520 hypothetical protein
521 putative endoglucanase 3
522 hypothetical protein
523 hypothetical protein
524 hypothetical protein

7 Appendix 127
525 hypothetical protein
526 hypothetical protein
527 putative methionyl-tRNA-formyltransferase
528 putative Fmu (Sun) domain-containing protein
529 hypothetical protein
530 hypothetical protein
531 putative HhH-GDP family protein
532 putative glycosyl transferase, group 1
533 putative phosphoribosylformimino-5-aminoimidazole
carboxamide ribotide isomerase
534 hypothetical protein
535 putative NAD-dependent epimerase/dehydratase
536 putative 3-dehydroguinate synthase
537 KF540232 pJB18DI_II hypothetical protein
538 hypothetical protein
539 putative oxygen-independent coproporphyrinogen III oxi-
dase
540 hypothetical protein
541 putative type III restriction protein res subunit
542 hypothetical protein
543 KF540233 pJB23D10 putative biotin-(acetyl-CoA-carboxylase) ligase
544 putative ornithine carbamoyltransferase
545 hypothetical protein
546 putative LL-diaminopimelate aminotransferase
547 putative diaminopimelate epimerase
548 hypothetical protein
549 putative glutamine synthetase
550 putative molecular chaperone Hsp33
551 hypothetical protein
552 hypothetical protein
7 Appendix 128
553 putative histidinol-phosphate aminotransferase
554 hypothetical protein
555 hypothetical protein
556 hypothetical protein
557 hypothetical protein
558 hypothetical protein
559 hypothetical protein
560 hypothetical protein
561 hypothetical protein
562 putative beta-lactamase
563 putative spermidine/putrescine ABC transporter sub-
strate-binding protein
564 putative spermidine/putrescine transport permease pro-
tein
565 putative spermidine/putrescine transport system
permease protein
566 putative spermidine/putrescine transport system ATP-
binding protein
567 hypothetical protein
568 putative cystathionine beta-lyase
569 putative threonyl-tRNA synthetase ThrS
570 hypothetical protein
571 hypothetical protein
572 hypothetical protein
573 hypothetical protein
574 hypothetical protein
575 KF540243 pJB84D8 hypothetical protein
576 hypothetical protein
577 putative metallophosphoesterase
578 hypothetical protein
579 putative deoxyguanosinetriphosphate

7 Appendix 129
triphosphohydrolase
580 hypothetical protein
581 putative ABC-transporter
582 hypothetical protein
583 hypothetical protein
584 putative organic solvent tolerance protein OstA-like pro-
tein
585 putative RdgB/HAM1 family non-canonical purine NTP
pyrophosphatase
586 hypothetical protein
587 hypothetical protein
588 hypothetical protein
589 hypothetical protein
590 hypothetical protein
591 hypothetical protein
592 hypothetical protein
593 CelA84
594 hypothetical protein
595 putative tRNA/rRNA methyltransferase SpoU
596 hypothetical protein
597 KF540247 pJB95A1 hypothetical protein
598 putative carboxylyase-related protein
599 hypothetical protein
600 hypothetical protein
601 hypothetical protein
602 putative group 1 glycosyltransferase
603 putative zinc finger CHC2-family protein
604 hypothetical protein
605 putative peptidase M15B DD-carboxypeptidase
VanY/endolysin
606 putative murein peptide amidase A
7 Appendix 130
607 putative CDP-alcohol phosphatidyltransferase
608 putative family 5 extracellular solute-binding protein
609 hypothetical protein
610 hypothetical protein
611 putative integral membrane sensor signal transduction
histidine kinase
612 putative peptidoglycan-binding lysin domain protein
613 hypothetical protein
614 hypothetical protein
615 putative glutaminyl-tRNA synthetase
616 hypothetical protein
617 hypothetical protein
618 hypothetical protein
619 hypothetical protein
620 hypothetical protein
621 hypothetical protein
622 hypothetical protein
623 hypothetical protein

7 Appendix 131
7.2 Acknowledgements
Prof. W.R. Streit for providing me with these interesting topics, having confidence and
giving me the opportunity to work self-dependently in his working group and of course
all the support in the last years.
Prof. B. Bisping for being the second accessor of this thesis.
Christian Utpatel, Mariita Rodriguez, Jessica Grote, Frederike Haack, Andreas Bonge,
Ulrich Rabausch, Sascha Horn and Nicolas Rychlik for proofreading my thesis.
Nicolas Rychlik and Christian Utpatel for their help concerning computer "problems".
Angela, Christiane, Uschi and Martina for their help with organizational matters and lab
and material problems.
Ulrich Rabausch for sharing his experience concerning glycosyltransferases and flavo-
noids with me.
Laura Radtke, "my" bachelor student, for her contribution to this PhD thesis.
And thanks to the whole group of the last years for the fun, help and for some good
advices: Mariita, Christian, Nico, Moritz, Frederike, Jessica, Jenny C., Jenny H., Dag-
mar, Steffi, Nine, Sascha, Uli, Gesche, Mirjam, Nele, Anddreas, Angela, Christel, Ines,
Gao, Boris, Patrick, Claudia, Ebrahim, Katja, Arek, Birhanu and Regina.
And last but not least I want to thank my family and friends for the support, always
listining to my complaints and for the motivation I just needed sometimes...