Self-Assembled Bionanoparticle-Polymer-Conjugates for...
165
"Self-Assembled Bionanoparticle-Polymer-Conjugates for Building Soft Composite Membranes" Von der Fakultät für Mathematik, Informatik und Naturwissenschaften der RWTH Aachen University zur Erlangung des akademischen Grades einer Doktorin der Naturwissenschaften genehmigte Dissertation vorgelegt von Dipl. -Ing. Nathalie Céline Mougin, aus Belfort/Frankreich Berichter: Prof. Dr. Alexander Böker Prof. Dr. Axel H. E. Müller Tag der mündlichen Prüfung: 10.05.2010 Diese Dissertation ist auf den Internetseiten der Hochschulbibliothek online verfügbar.
Transcript of Self-Assembled Bionanoparticle-Polymer-Conjugates for...
"Self-AssembledBionanoparticle-Polymer-Conjugates for Building
Soft Composite Membranes"
Von der Fakultät für Mathematik, Informatik undNaturwissenschaften der RWTH Aachen University zur
Erlangung des akademischen Grades einer Doktorin derNaturwissenschaften genehmigte Dissertation vorgelegt
von Dipl. -Ing. Nathalie Céline Mougin,aus Belfort/Frankreich
Berichter: Prof. Dr. Alexander Böker
Prof. Dr. Axel H. E. Müller
Tag der mündlichen Prüfung: 10.05.2010
Diese Dissertation ist auf den Internetseiten der Hochschulbibliothek onlineverfügbar.

The only limitation is our imagination.
J. -C. Nièpce
Die vorliegende Arbeit wurde in der Zeit von Oktober 2005 bis Dezember 2009 amLehrstuhl für Physikalische Chemie der Universität Bayreuth und am Lehrstuhlfür Makromolekulare Materialen und Oberflächen der RWTH Aachen in der Ar-beitsgruppe von Herrn Prof. Dr. Alexander Böker angefertigt.
Amtierender Dekan: Prof. Dr. U. Simon
Prüfungsausschuß: Prof. Dr. A. Böker (Erstgutachter)

A ma famille
Parts of this thesis are published, in preparation or presented at conferences:
Articles
Millard, P. -E., Mougin, N. C., Böker, A. and Müller, A. H. E.,"Fast ATRP of N-isopropylacrylamide in water and its application to bioconjugates", Polymer Pre-prints (American Chemical Society, Division of Polymer Chemistry), vol.49, p. 121,2008.
Mougin, N. C., Müller, A. H. E. and Böker, A.,"Towards a self-assembled mem-brane made of bionanoparticle-polymer conjugates",PMSE Preprints (AmericanChemical Society, Division of Polymeric Materials Science and Engineering), vol.99,p. 99, 2008.
Müller, A. H. E., Millard, P. -E., Mougin N. C. and Böker, A., "Controlling the FastATRP of N-Isopropylacrylamide in Water", K. Matyjaszewski, Ed.: Controlled/liv-ing radical polymerization: progress in ATRP, ACS Symp. Ser., American ChemicalSociety, Washington, D.C., pp. 127-139, 2009.
Mougin, N. C., Müller, A. H. E. and Böker, A., "In Situ Synthesis of smart Thermo-Responsive Bionanoparticle-Polymer Conjugates via ATRP in Water", in prepara-tion.
Presentations
"Towards a self-assembled membrane made of bionanoparticle-polymer conju-gates", Mougin, N. C., Müller, A. H. E. and Böker, A., American Chemical Societymeeting in Philadelphia, 2008.
"Towards a self-assembled membrane made of bionanoparticle-polymer conju-gates", Mougin, N. C., Müller, A. H. E. and Böker, A., ECIS meeting in Antalya,2009.
Posters
Bionanoparticles polymer-conjugate via surface-initiated polymerization in aque-ous solution", Mougin, N. C., Millard, P. -E., Müller, A. H. E. and Böker, A., EuChemin Budapest, 2006.
Contents
1 Summary 1
2 Zusammenfassung 3
3 Introduction 5
4 Fundamentals 94.1 Horse Spleen Ferritin . . . . . . . . . . . . . . . . . . . . . . . . . . . . . 9
4.1.1 From Primary to Quaternary Structure . . . . . . . . . . . . . . 94.1.2 Function: Iron Storage Protein . . . . . . . . . . . . . . . . . . . 134.1.3 Denaturation of Horse Spleen Ferritin . . . . . . . . . . . . . . . 154.1.4 Chemistry & Materials Science Involving Horse Spleen Ferritin 15
4.2 Atom Transfer Radical Polymerization . . . . . . . . . . . . . . . . . . . 184.2.1 Controlled/Living Radical Polymerization . . . . . . . . . . . . 194.2.2 Grafting Approaches . . . . . . . . . . . . . . . . . . . . . . . . . 224.2.3 Thermoresponsive Polymers: PNIPAAm and PEGMA . . . . . . 23
4.3 Bioconjugation and (Thermoresponsive) Polymer-Bioconjugates . . 254.3.1 Bioconjugation of Ferritin . . . . . . . . . . . . . . . . . . . . . . 254.3.2 Design of Polymer-Bioconjugates . . . . . . . . . . . . . . . . . 27
4.4 Assembly of Nanoparticles at Solid-Liquid Interfaces . . . . . . . . . . 294.4.1 Adsorption Process . . . . . . . . . . . . . . . . . . . . . . . . . . 294.4.2 Capillary Forces between Colloidal Particles . . . . . . . . . . . 324.4.3 Self-Assembly of Colloidal Particles . . . . . . . . . . . . . . . . 344.4.4 Adsorption of Ferritin at Solid-Liquid Interfaces . . . . . . . . . 35
4.5 Nanoporous Membranes . . . . . . . . . . . . . . . . . . . . . . . . . . 37
5 Characterization Methods 415.1 Characterization in Solution . . . . . . . . . . . . . . . . . . . . . . . . 41
5.1.1 Light Scattering Technique . . . . . . . . . . . . . . . . . . . . . 425.1.2 UV-Vis Spectroscopy . . . . . . . . . . . . . . . . . . . . . . . . . 50
iii
Contents
5.2 Characterization by Microscopic Techniques . . . . . . . . . . . . . . . 525.2.1 Transmission Electron Microscopy (TEM) . . . . . . . . . . . . 525.2.2 Scanning Electron Microscopy (SEM) . . . . . . . . . . . . . . . 575.2.3 Atomic Force Microscopy (AFM) . . . . . . . . . . . . . . . . . . 59
5.3 Characterization in Denaturated State by MALDI-ToF MS & SDS-PAGE 615.3.1 Matrix-Assisted Laser Desorption Ionization-Time of Flight
Mass Spectrometry (MALDI-ToF MS) . . . . . . . . . . . . . . . 625.3.2 Sodium Dodecyl Sulfate PolyAcrylamide Gel Electrophoresis
(SDS-PAGE) . . . . . . . . . . . . . . . . . . . . . . . . . . . . . . 64
6 Controlling the Fast ATRP of N-Isopropylacrylamide in Water 676.1 Introduction . . . . . . . . . . . . . . . . . . . . . . . . . . . . . . . . . . 676.2 Experimental . . . . . . . . . . . . . . . . . . . . . . . . . . . . . . . . . 69
6.2.1 Materials . . . . . . . . . . . . . . . . . . . . . . . . . . . . . . . . 696.2.2 Polymerization Procedure . . . . . . . . . . . . . . . . . . . . . . 696.2.3 Characterization . . . . . . . . . . . . . . . . . . . . . . . . . . . 70
6.3 Results and Discussion . . . . . . . . . . . . . . . . . . . . . . . . . . . . 706.3.1 Homopolymerization of N-isopropylacrylamide . . . . . . . . 706.3.2 Chain Extension Experiments . . . . . . . . . . . . . . . . . . . 75
6.4 Conclusion . . . . . . . . . . . . . . . . . . . . . . . . . . . . . . . . . . . 76
7 Synthesis & ATRP of the Photocrosslinker DMIAAm 797.1 Introduction . . . . . . . . . . . . . . . . . . . . . . . . . . . . . . . . . . 797.2 Experimental . . . . . . . . . . . . . . . . . . . . . . . . . . . . . . . . . 79
7.2.1 Materials . . . . . . . . . . . . . . . . . . . . . . . . . . . . . . . . 797.2.2 Characterization . . . . . . . . . . . . . . . . . . . . . . . . . . . 807.2.3 Synthesis and Characterization of DMIAAm . . . . . . . . . . . 827.2.4 Copolymerization of NIPAAm-DMIAAm . . . . . . . . . . . . . 84
7.3 Results and Discussion . . . . . . . . . . . . . . . . . . . . . . . . . . . . 847.3.1 Characterization of Polymer Properties . . . . . . . . . . . . . . 847.3.2 Photocrosslinking of Copolymers under UV Irradiation . . . . 87
8 Synthesis of Ferritin-P(NIPAAm-DMIAAm) Conjugates 918.1 Modification of Horse Spleen Ferritin into a Macro-Initiator . . . . . . 91
8.1.1 Conjugation of ATRP Initiator BIBA using a Zero Length CrosslinkerCarbodiimide . . . . . . . . . . . . . . . . . . . . . . . . . . . . . 92
8.1.2 Protection of Carboxylate Groups of the Protein . . . . . . . . . 958.1.3 Synthesis and Conjugation of the ATRP Initiator: N-Hydroxy-
succinimide-2-bromo-2-methylpropionate . . . . . . . . . . . 98
iv
Contents
8.2 Grafting from Horse Spleen Ferritin: ATRP of NIPAAm and OEGMA . 1028.2.1 Materials . . . . . . . . . . . . . . . . . . . . . . . . . . . . . . . . 1028.2.2 Experimental Part . . . . . . . . . . . . . . . . . . . . . . . . . . . 1028.2.3 Results . . . . . . . . . . . . . . . . . . . . . . . . . . . . . . . . . 104
9 Towards the Building of the Membrane 1119.1 Adsorption at Solid-Liquid Interfaces & Supported Membrane For-
mation . . . . . . . . . . . . . . . . . . . . . . . . . . . . . . . . . . . . . 1119.1.1 Experimental Part . . . . . . . . . . . . . . . . . . . . . . . . . . . 1129.1.2 Results . . . . . . . . . . . . . . . . . . . . . . . . . . . . . . . . . 112
9.2 Adsorption at Liquid-Liquid Interfaces & Capsule Formation . . . . . 1189.2.1 Pendant Drop . . . . . . . . . . . . . . . . . . . . . . . . . . . . . 1189.2.2 Pickering Emulsions . . . . . . . . . . . . . . . . . . . . . . . . . 121
Bibliography 123
List of Figures 145
List of Tables 151
v
List of abbreviations
Chemicals and bionanoparticles
BIBA 2-Bromo isobutyric acidCPMV Cowpea mosaic virusDCC 1,3-Dicyclohexal carbodiimideDCM DichloromethaneDMAc DimethylacetamideDMF DimethylformamideDMIAAm 2-(dimethyl maleimido)-N-ethylacrylamideDMSO DimethylsulphoxideDNA Deoxyribonucleic acidDOMA Dioctadecyldimethyl ammonium bromideDTT DithreitolEDC (1-ethyl-3-(3-dimethylaminopropyl)carbodiimide
hydrochloride)ELP Elastin-like polymerHABA 2,5-dihydroxybenzoic acidHMTETA HexamethyltriethylenetetramineHPMA N-(2-hydroxypropyl)methacrylateHSF Horse spleen ferritinMe6TREN Tris(2-dimethylaminoethyl)amineMPC 2-Methylacryloyloxyethyl phosphorylcholineNaTFA Sodium trifluoroacetateNHS-BIBA N-Hydroxysuccinimide-2-bromo-2-methylpropionateOEGMA Oligo(ethylen glycol) methacrylatePCF Polycationic ferritinPEG Poly(ethylen glycol)PMDETA Pentamethyldiethylene triaminePNAS Poly(N-acryloxysuccinimide)PNIPAAm Poly(N-isopropylacrylamide)PNMS Poly(methacryloyloxysuccinimide)PVDF Polyvinylidene fluorideRNA Ribonucleic acidSDS Sodium dodecyl sulfateSulfo-NHS N-hydroxysulfosuccinimideTHF TetrahydrofuranTNBS 2, 4, 6,-Trinitrobenzenesulfonate or Picrylsulfonate acid
Technical terms
AFM Atomic force microscopyATRP Atom transfer radical polymerizationBAM Brewster angle microscopyCEVS Controlled-environment vitrification systemCryo-TEM Cryo-transmission electron microscopyCRP Controlled/living radical polymerizationDLS Dynamic Light ScatteringLBL Layer-by-layerLCST Lower critical solution transitionLTM-AFM Liquid tapping mode-atomic force microscopyLRP Living radical polymerizationLS Light scatteringMALDI-ToF Matrix-assisted laser desorption ionization time-of-flightMS Mass spectrometryMWD Molecular Weight DistributionNMP Nitroxide-mediated polymerizationOWLS Optical waveguide lightmode spectroscopyPDI Polydispersity indexpH Negative common logarithm of proton concentration (-lg[H+])pI Isoelectric pointPRE Persistent radical effectQCM Quartz crystal microbalanceRAFT Reversible addition-fragmentation transferRI Refractive indexRSA Random sequential adsorptionSAM Self-assembled monolayerSDS-PAGE Sodium dodecyl sulfate-poly(acrylamide) gel electrophoresisSEC Size exclusion chromatographySEM Scanning electron microscopySPR Surface plasmon resonanceTEM Transmission electron microscopyTIRE Total internal reflection ellipsometryTIRF Total internal reflection fluorescenceUV-Vis Ultraviolet-visiblewt% weight percentXPS X-ray photoelectron spectroscopyXRD X-ray diffraction

Physical symbols
Symbols that are generally used and not explained within the equations:
T absolute temperature [K]R molar gas constant: 8.314510 J·mol−1·K−1
NA Avogadro constant: 6.0221367 1023 mol−1
kB Boltzmann constant: 1.380658 10−23 J·K−1
g gravitational acceleration: 9.80665 m·s−2
1 Summary
This project was focused on building a smart nanoporous membrane based onan assembly of bionanoconjugates. Horse spleen ferritin was chosen as a modelprotein scaffold to graft thermoresponsive polymers as Poly(N-isopropylacrylami-de) (PNIPAAm) to it using the grafting from approach. PNIPAAm is a well knownthermo-responsive polymer exhibiting a LCST of 32◦C. After developing the wellcontrolled atom transfer radical polymerization (ATRP) of NIPAAm in water at lowtemperature, the in-situ grafting of PNIPAAm from the ferritin was achieved.
The grafting from approach consisted of two steps: the modification of ferritininto a macro-initiator by coupling the N-hydroxysuccinimide activated 2-bromoisobutyric acid ATRP initiator to the 72 addressable ε-amino end groups aroundferritin polypeptide chains. It allows the modification of the majority of the aminosites of ferritin and induces a polymerization resulting in a higher grafting density.The condition of this chemistry has to be mild to prevent the denaturation of theproteins.
The challenge was the preparation of monomeric conjugates with low polydis-persity as ferritin aggregates in solution and perturbs the polymerization process.The resulting conjugates are well defined and show a thermo-responsive behaviorwith a Tc of about 31.5 ◦C.
The building of the membrane requires the crosslinking of the polymer matrix.The crosslinking was realized by a random copolymerization of NIPAAm with themonomer DMIAAm, (2-(dimethyl maleimido)-N-ethylacrylamide), a photocross-linker. This photocrosslinker hosts a maleimide group able to form cyclobutanerings activated of UV irradiation and a sensitizer thioxanthone. The photocrosslin-ker is fully assimilated in the copolymer and decreases the lower critical solutiontemperature depending on its ratio.
The assembly of the ferritin-P(NIPAAm-DMIAAm) conjugates at the solid-liquid
1
1 Summary
interfaces on a mica sheet or silicon wafer creates a homogeneous thin polymer-protein film. After crosslinking under UV irradiation while cooling the sample, thepolymer matrix undergoes protein denaturation by the use of chaotropic agentsand temperature to create nanopores in the membrane. The final membrane is athin polymer film with monodisperse pores of about 16 nm of diameter and 2 nmdepth carrying different functional groups.Such conjugates can also be assembled at the liquid-liquid interfaces formingporous micro-capsules as they reduce the interfacial tension and are able to sta-bilize oil droplets in solution. The ferritin-P(NIPAAm-DMIAAm) conjugates areinteresting building blocks with adjustable properties able to produce functionaland switchable nanoporous membranes and capsules.
2
2 Zusammenfassung
Dieses Projekt konzentrierte sich auf den Aufbau intelligenter, nanoporöser Mem-branen durch die Anordnung von Bionanokonjugaten. Horse Spleen Ferritin wur-de als Modellprotein gewählt, um an dessen Gerüst thermo-responsive Polymerewie Poly-(N-isopropylacrylamid) (PNIPAAm) mittels grafting from-Technik aufzu-polymerisieren. PNIPAAm ist als thermo-sensitives Polymer hinreichend bekanntund zeigt eine LCST von 32◦C. Nach der Entwicklung einer kontrollierten AtomTransfer Radical Polymerization (ATRP)-Methode von NIPAAm in Wasser bei nie-driger Temperatur, konnte die Polymerisation von NIPAAm ausgehend von derFerritinoberfläche (grafting from-Technik) verwirklicht werden.
Die grafting from-Methode setzt sich aus zwei Schritten zusammen: Ferritin wirddurch die Kupplung des ATRP Initiators (N-hydroxysuccinimid-aktivierte 2-Brom-isobuttersäure) an die 72 zugänglichen ε-Amino-Endgruppen entlang der Ferritin-Polypeptidketten in einen Makroinitiator umgewandelt. Anschließend erfolgt diePolymerisation von NIPAAm ausgehend von der Ferritin-Oberfläche. Das graft-ing from erlaubt die Modifikation einer Mehrzahl der Amino-Funktionalitäten desFerritins, so dass die anschließende Polymerisation zu einer höheren Dichte derKetten an der Oberfläche führt. Die Bedingungen für diese Reaktionen müssenaufgrund der Anwesenheit des Proteins sehr mild sein.
Da Ferritin Aggregate bildet und diese den Polymerisationsprozess negativ beein-flussen, bestand die Herausforderung darin, monomere Konjugate mit niedrigerPolydispersität herzustellen. Die resultierenden Konjugate sind genau definiertund zeigen thermo-responsives Verhalten mit einer Tc von 31.5◦C.
Der Aufbau von Membranen erfordert eine Vernetzung der Polymermatrix. DieseVernetzung konnte durch eine statistische Copolymerisation von NIPAAm mitDMIAAm (2-(Dimethylmaleimido)-N-ethylacrylamid), einem Photovernetzer, er-möglicht werden. Der erwähnte Vernetzer besitzt eine Maleimid-Funktionalität,die, aktiviert durch UV-Bestrahlung in Gegenwart eines Thioxanthones als Sen-
3
2 Zusammenfassung
sibilisator, in der Lage ist, Cyclobutanringe zu bilden. Der Photovernetzer wirdvollständig in das Copolymer eingebunden und verringert die Phasenübergang-stemperatur in Abhängigkeit von seinem Einbauverhältnis.
Die Anordnung der Ferritin-P(NIPAAm-DMIAAm)-Konjugate an einer Fest-Flüs-sig-Grenzfläche auf einem Glimmerplättchen oder Silizium-Wafer führt zur Aus-bildung eines dünnen, homogenen Polymer-Protein-Films. Nach Vernetzungenmittels UV-Strahlung können die Proteine im Polymerfilm chemisch denaturiertwerden und ergeben monodisperse Poren von 2nm Tiefe. Solche Konjugate kön-nen auch an flüssigen Grenzflächen angeordnet werden. Oberflächenspannungs-messungen haben hierbei eine dramatische Erniedrigung der Grenzflächenspan-nung ergeben. Anschließende Vernetzung der Aggregate liefert robuste, poröseMikrokapseln.
Ferritin-P(NIPAAm-DMIAAm)-Konjugaten sind interessante Bausteine, die durchihre schaltbaren Eigenschaften zum Aufbau von funktionalen und variablen nano-porösen Membranen und Kapseln beitragen.
4
3 Introduction
At the dawn of the 21st century, it was recognized that reducing the size to thenanometer scale enabled the creation of novel materials. Great technologicalachievements were possible due to newly discovered mechanical, optical and elec-tronic properties of nanosized and nanostructured materials. In the traditionaltop-down approach, materials are structured by physical or chemical means frominitially unpatterned materials. The bottom-up approach uses the self-assemblyproperties of nanosized (macro)molecular and colloidal building blocks to buildfunctional nanodevices with medical applications, as the devices can enter thecells and treat them specifically. Currently, technological limitations of the top-down approach indicate that bottom-up approaches are very promising, support-ed by great achievements1 in the synthesis of novel nanoparticle building blocks.
Water solubility, biocompatibility, non toxicity and bioactivity represent the re-quirements for smart materials and devices for medical applications. Thus nu-cleic acids and proteins are wonderful tools for materials science. They have manyfacets, which make them very useful to create any kind of hybrids with specificproperties required for future bionanotechnology fields such as novel materialsfor sensing, diagnostic and therapeutics applications. Proteins can be consideredas macromolecules as they consist of repeating amino acids. Modern microbiolog-ical and biochemical methods like recombinant DNA make possible the preciselydefined synthesis of novel proteins, such as the natural polymer Elastin-Like Poly-mer (ELP), with predefined specific properties2,3.
Proteins have nanometric size and that is why they can be considered as well de-fined nanoparticles. It is then normal to conjugate them to inorganic nanoparti-cles. Proteins have different types of structure, such as globular or tubular. Theycan be used as template for creation of perfectly defined hybrids, scaffolds or sur-faces4,5. Another positive feature is their perfect monodispersity in shape butalso in addressable chemical groups. The conjugation of proteins to inorganicnanoparticles combines the best of two worlds: valuable optical, electronic and
5
3 Introduction
magnetic properties of inorganic nanoparticles with biocompatibility and specificbiological functions of proteins. The reaction tool set onto proteins is called bio-conjugation that enables conjugation to dye labels, gold nanoparticles, enzymesor the grafting of polymers.
Numerous polymer based nanodevices for drug delivery were developed. Todaychallenges lie in increasing the efficiency of the drug carrier to reach the target sitein order to avoid side effects of cancer treatments for example. In the beginning,low molecular weight drugs were conjugated to water soluble, non toxic, nonimmunogenic and degradable polymers through exhibiting side groups. Inten-sive studies were led on N-(2-hydroxypropyl)methacrylate (HPMA) copolymersand many different structural and architectural variations such as star-like or den-dritic polymers. The control of structure allows a better transport as well as slowerand more controlled release of the drug. Polymers were also conjugated to pro-teins in order to stabilize them and prolong their biological half-life, resulting inless frequent administration to the patient. Conjugation of linear or branchedpoly(ethylene glycol) (PEG) to side-specific amino acids such as the amino or car-boxy end of a protein dramatically changes the properties and biological behavior.This technology called pegylation has become an important tool for synthesis ofnovel pharmaceuticals e. g. in cancer treatment6. A further step is the utilizationof polymers whose properties can be non-invasively triggered by external stim-uli7 such as magnetic field8, glucose concentration9, pH10 or temperature11 forpulsatile drug release systems.
The synthesis of protein-polymer conjugates through the reaction of defined grou-ps remains a challenge. Reaction statistics are highly unfavorable for the reactionof the very few functional groups compared to the large polymeric chain. Manypolymers cannot be used, as they are not water soluble and adopt conformationsthat bury the functional groups. Some problems can be solved with the adventof extremely efficient crosslinking reactions like click-chemistry 12. Bovin SerumAlbumin proteins were coupled by azide-alkyne chemistry reactions to poly(N-isopropylacrylamide)13. The goal of this thesis is to graft various water solublepolymers on bionanoparticles such as viruses or proteins and to create a mem-brane with well-defined pores. Horse spleen ferritin was chosen as a model pro-tein because of its shape, size, stability and commercial availability. The tech-niques of grafting to and grafting from have been investigated. The polymers cho-sen have to be thermoresponsive and biocompatible, so N-Isopropylacrylamide(NIPAAm) and Oligo(Ethylenglycol) Methacrylate (OEGMA) are polymerized inwater by Atom Transfer Radical Polymerization (ATRP). The composite polymer-
6
protein materials are then employed in the construction of a nanoporous respon-sive membrane with hydrophilic monodisperse pores suitable for drug deliveryapplications. In order to do so, the obtained conjugates are then assembled at thesolid-liquid interface. Crosslinking is achieved by photocrosslinking of the poly-mer film which is a copolymer of PNIPAAm or PEGMA and a photocrosslinker.The used photo-crosslinker is 2-(dimethyl maleimido)-N-ethylacrylamide (DMI-AAm). It is copolymerized in a small ratio with NIPAAm and OEGMA to form apolymer matrix. The proteins are then denaturated using a chaotropic reagentallowing the formation of the membrane, which may still contain chemical func-tions that are left over by the protein shell and can furthermore be modified chem-ically. The construction of nanoporous membranes by self-assembly processes isefficient and scalable not only to large areas but also to various scaffolds or inter-faces. An assembly around nanoparticles and mesoporous colloids can serve asbiocompatible and porous coating14, thus novel theranostics (therapeutics anddiagnostic at the same time) can be developed. An assembly and crosslinking atoil-water interfaces are efficient means to trap water or oil soluble drugs.
The content of this thesis:
• Characterization and purification of horse spleen ferritin
• ATRP of NIPAAm in water
• ATRP of NIPAAm-DMIAAm in water
• Transformation of horse spleen ferritin into a macro-initiator
• Grafting PNIPAAm/PEGMA from horse spleen ferritin
• Assembly of the conjugates at the solid-liquid interface
• Crosslinking of the self-assembled film by UV irradiation
• Denaturation of the conjugates & formation of the membrane
7

4 Fundamentals
4.1 Horse Spleen Ferritin
Ferritin is a globular protein with an important metabolic function as an iron stor-age protein. Its ability to sequester iron provides it with a double function of detox-ification and iron supply. Ferritin is present in the monocytes-macrophages (typeof leukocyte, part of the immune system) of the liver, the spleen and in the bonemarrow. It is also present in the cytosol (internal fluid of the cell) of many cells:hepatocytes, heart, lung, testicle, kidney, placenta, red blood cells and leukocytes.The ferritin, used in this study, is the horse spleen ferritin (HSF), found in thespleen of horses.
4.1.1 From Primary to Quaternary Structure
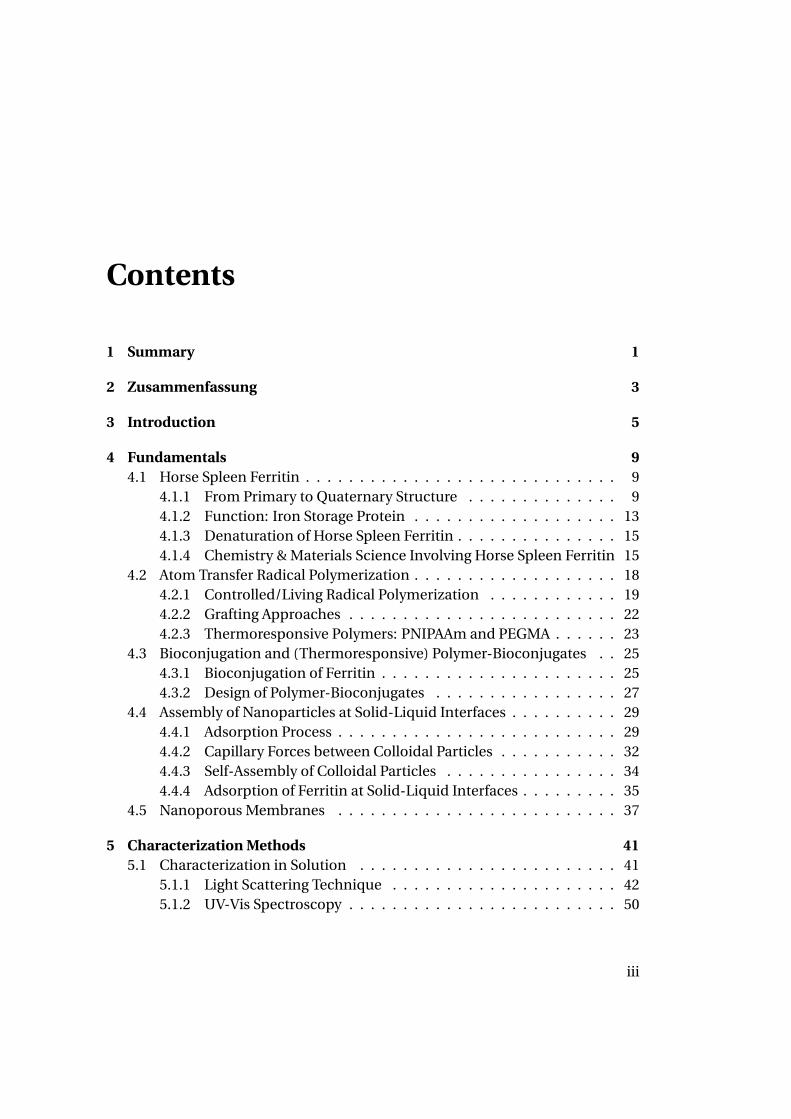
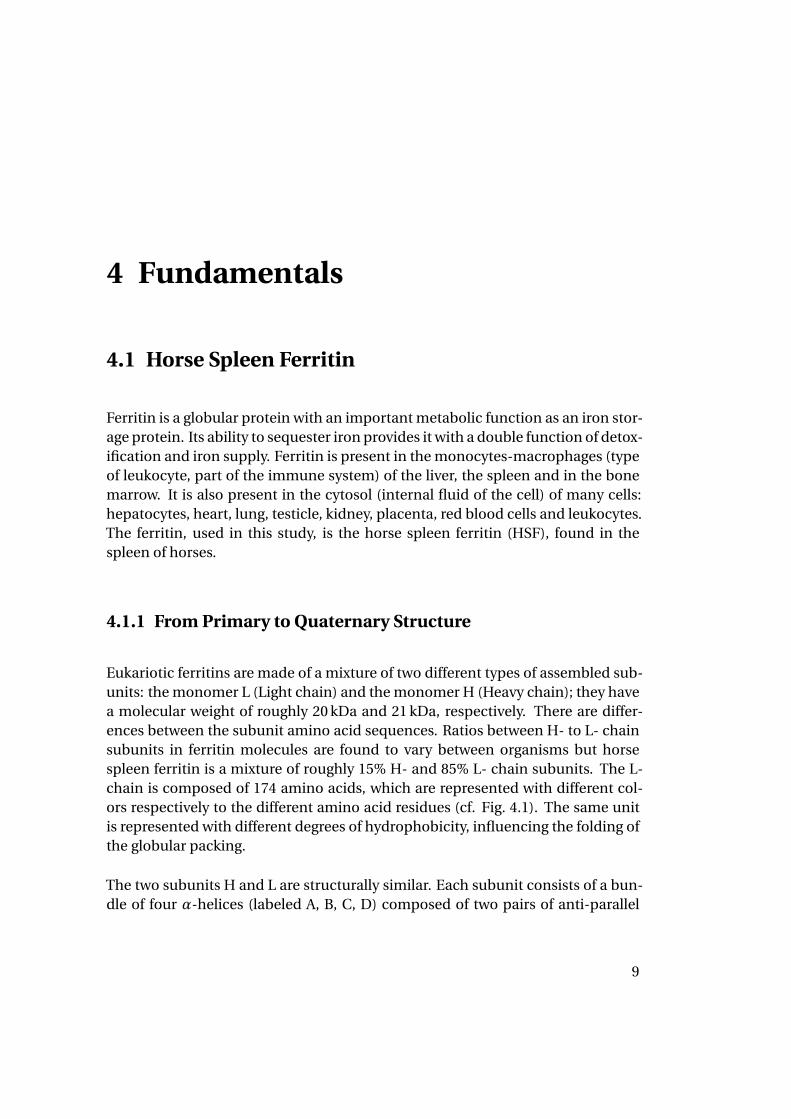
Eukariotic ferritins are made of a mixture of two different types of assembled sub-units: the monomer L (Light chain) and the monomer H (Heavy chain); they havea molecular weight of roughly 20 kDa and 21 kDa, respectively. There are differ-ences between the subunit amino acid sequences. Ratios between H- to L- chainsubunits in ferritin molecules are found to vary between organisms but horsespleen ferritin is a mixture of roughly 15% H- and 85% L- chain subunits. The L-chain is composed of 174 amino acids, which are represented with different col-ors respectively to the different amino acid residues (cf. Fig. 4.1). The same unitis represented with different degrees of hydrophobicity, influencing the folding ofthe globular packing.
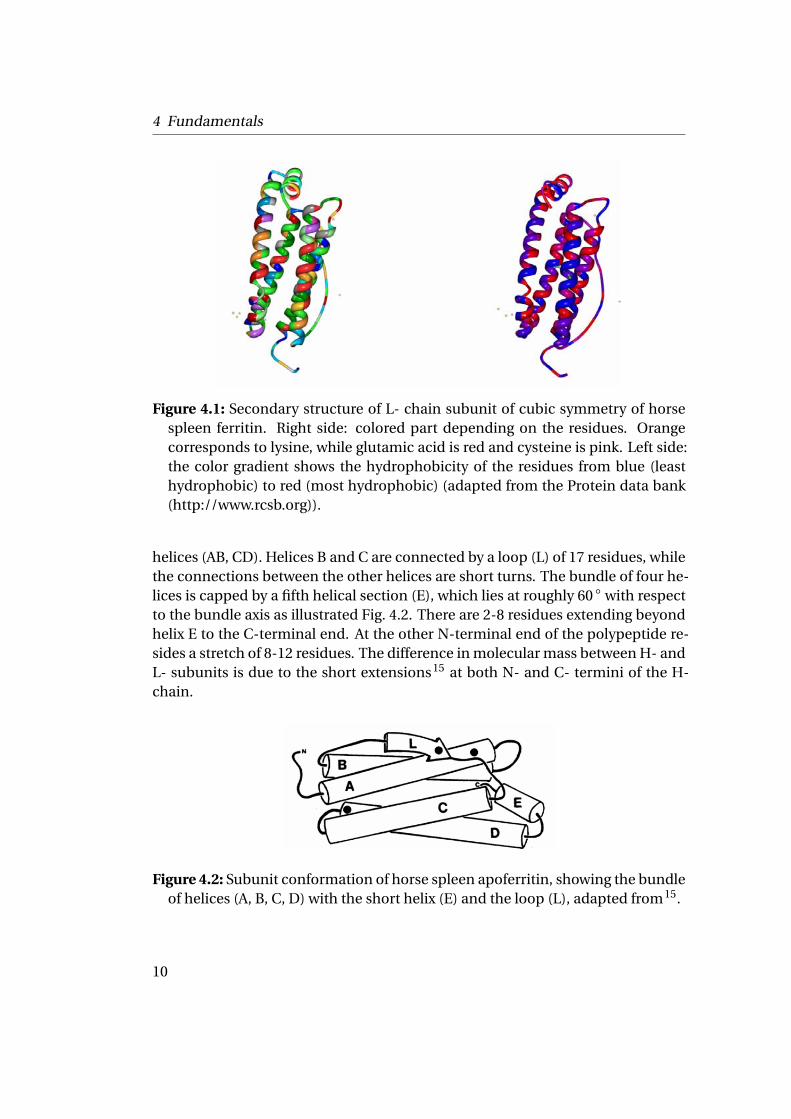
The two subunits H and L are structurally similar. Each subunit consists of a bun-dle of four α-helices (labeled A, B, C, D) composed of two pairs of anti-parallel
9
4 Fundamentals
Figure 4.1: Secondary structure of L- chain subunit of cubic symmetry of horsespleen ferritin. Right side: colored part depending on the residues. Orangecorresponds to lysine, while glutamic acid is red and cysteine is pink. Left side:the color gradient shows the hydrophobicity of the residues from blue (leasthydrophobic) to red (most hydrophobic) (adapted from the Protein data bank(http://www.rcsb.org)).
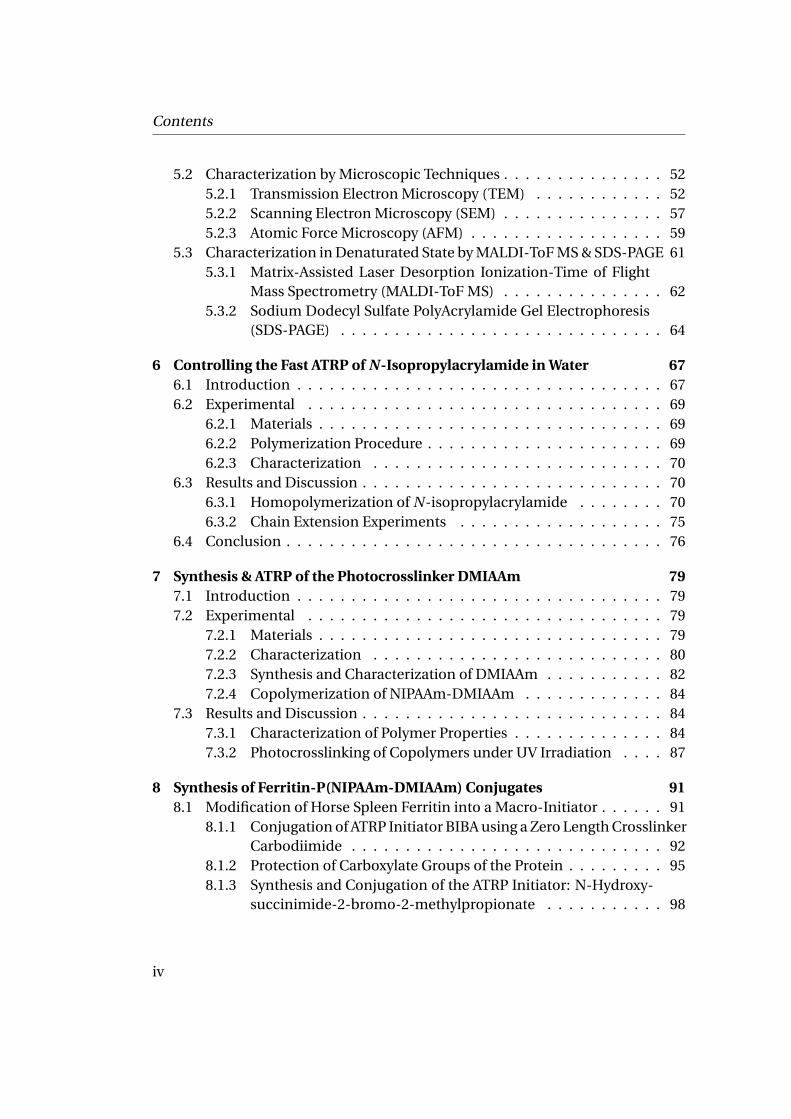
helices (AB, CD). Helices B and C are connected by a loop (L) of 17 residues, whilethe connections between the other helices are short turns. The bundle of four he-lices is capped by a fifth helical section (E), which lies at roughly 60 ◦ with respectto the bundle axis as illustrated Fig. 4.2. There are 2-8 residues extending beyondhelix E to the C-terminal end. At the other N-terminal end of the polypeptide re-sides a stretch of 8-12 residues. The difference in molecular mass between H- andL- subunits is due to the short extensions15 at both N- and C- termini of the H-chain.
Figure 4.2: Subunit conformation of horse spleen apoferritin, showing the bundleof helices (A, B, C, D) with the short helix (E) and the loop (L), adapted from15.
10
4.1 Horse Spleen Ferritin
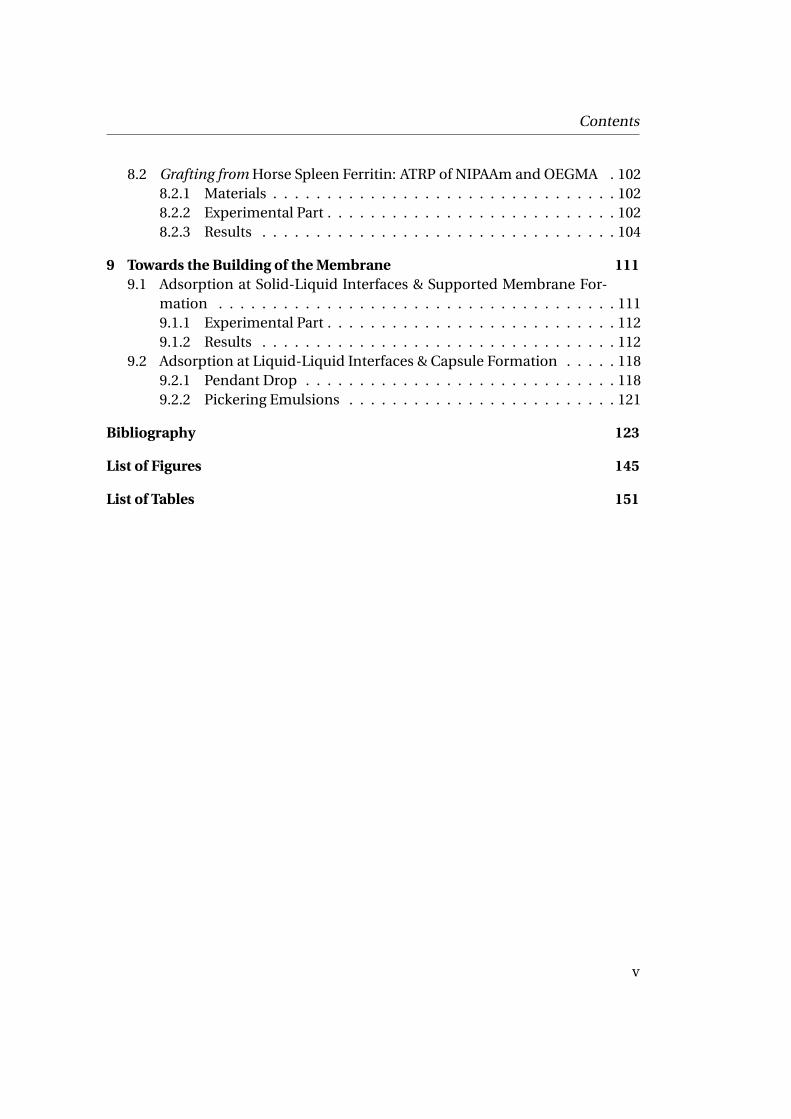
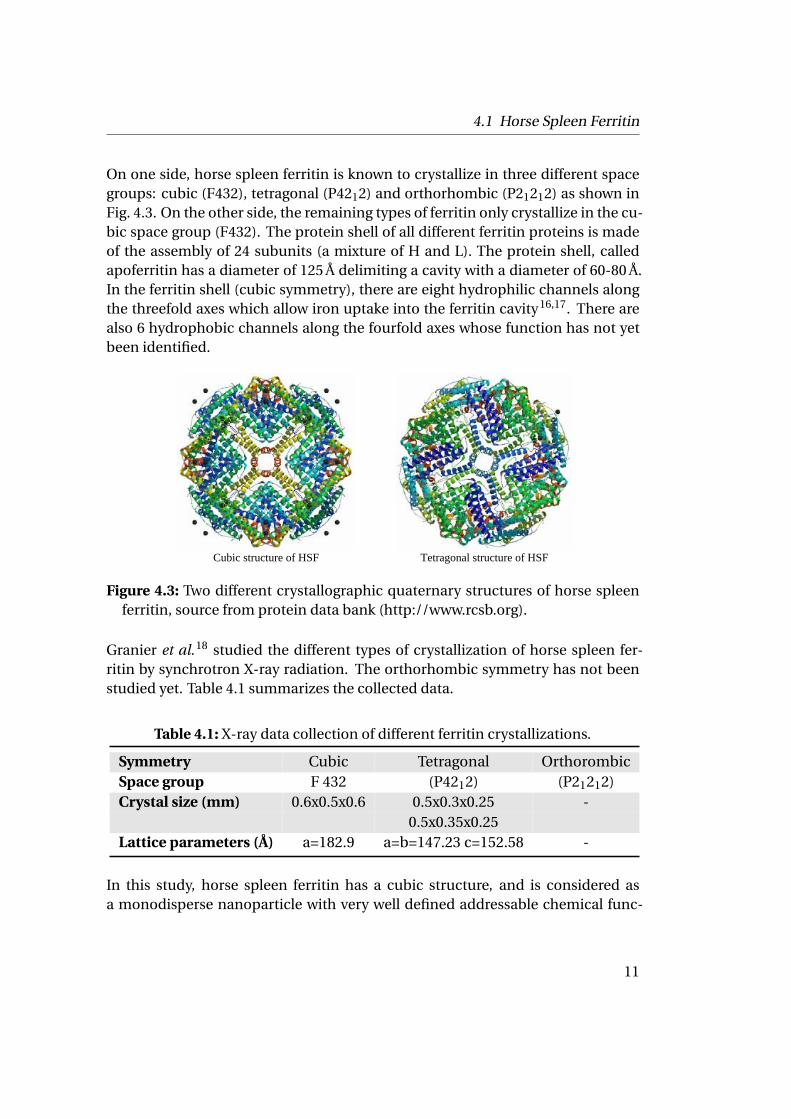
On one side, horse spleen ferritin is known to crystallize in three different spacegroups: cubic (F432), tetragonal (P4212) and orthorhombic (P21212) as shown inFig. 4.3. On the other side, the remaining types of ferritin only crystallize in the cu-bic space group (F432). The protein shell of all different ferritin proteins is madeof the assembly of 24 subunits (a mixture of H and L). The protein shell, calledapoferritin has a diameter of 125 Å delimiting a cavity with a diameter of 60-80 Å.In the ferritin shell (cubic symmetry), there are eight hydrophilic channels alongthe threefold axes which allow iron uptake into the ferritin cavity16,17. There arealso 6 hydrophobic channels along the fourfold axes whose function has not yetbeen identified.
Cubic structure of HSF Tetragonal structure of HSF
Figure 4.3: Two different crystallographic quaternary structures of horse spleenferritin, source from protein data bank (http://www.rcsb.org).
Granier et al.18 studied the different types of crystallization of horse spleen fer-ritin by synchrotron X-ray radiation. The orthorhombic symmetry has not beenstudied yet. Table 4.1 summarizes the collected data.
Table 4.1: X-ray data collection of different ferritin crystallizations.
Symmetry Cubic Tetragonal OrthorombicSpace group F 432 (P4212) (P21212)Crystal size (mm) 0.6x0.5x0.6 0.5x0.3x0.25 -
0.5x0.35x0.25Lattice parameters (Å) a=182.9 a=b=147.23 c=152.58 -
In this study, horse spleen ferritin has a cubic structure, and is considered asa monodisperse nanoparticle with very well defined addressable chemical func-
11
4 Fundamentals
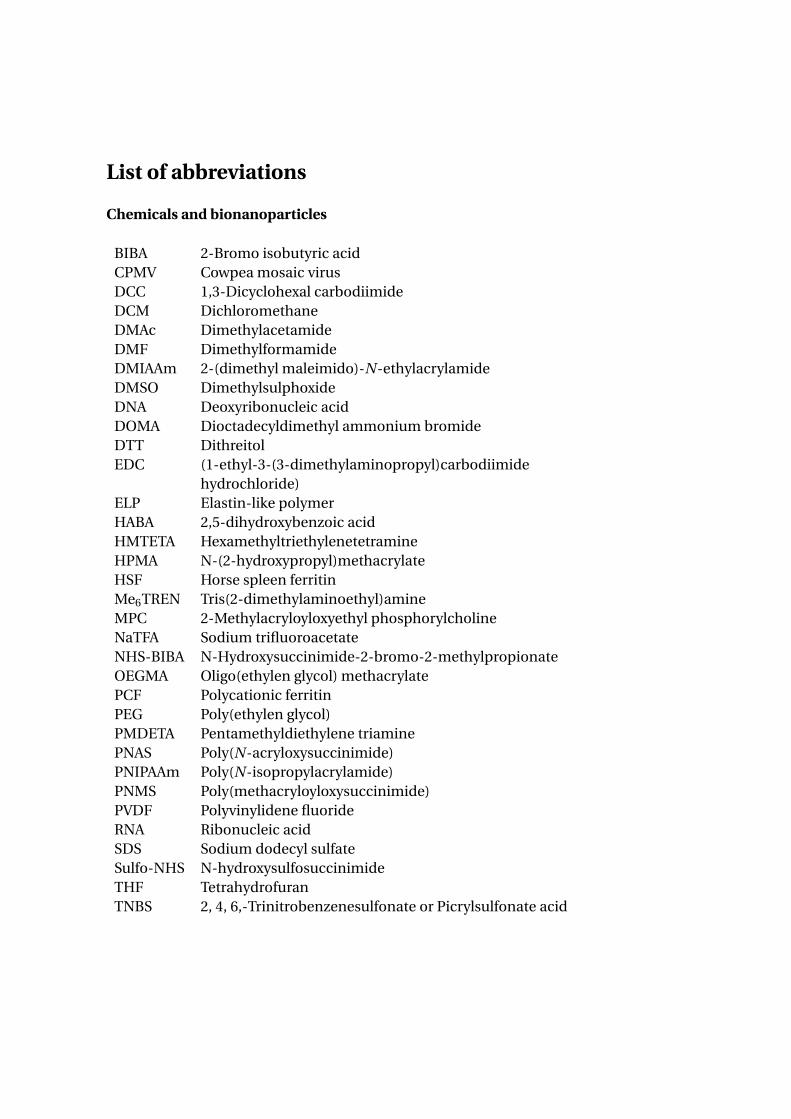
tions: ε-amino groups from lysine residues, carboxylate groups from glutamicacid residues and sulphydryl groups from cysteine residues are available all aroundthe apoferritin shell. Many studies tried to determine the number of the address-able groups depending on the type of ferritin19,20. After denaturation from horsespleen apoferritin with guanidine hydrochloride, Wetz and Crichton determined1.0±0.1 cystein residue per subunit, 4.4±0.4 lysine residues and 11±0.4 carboxylgroups per subunit (7.0± 0.7 per subunit on its exterior surface which gives 168surface COOH groups)21. Those numbers do not correspond to the numbers avail-able for the addressable groups because they are estimated while the apoferritinis denaturated into subunits, so the unavailable groups (residing at the interior)are also counted while the apoferritin is reassociated.
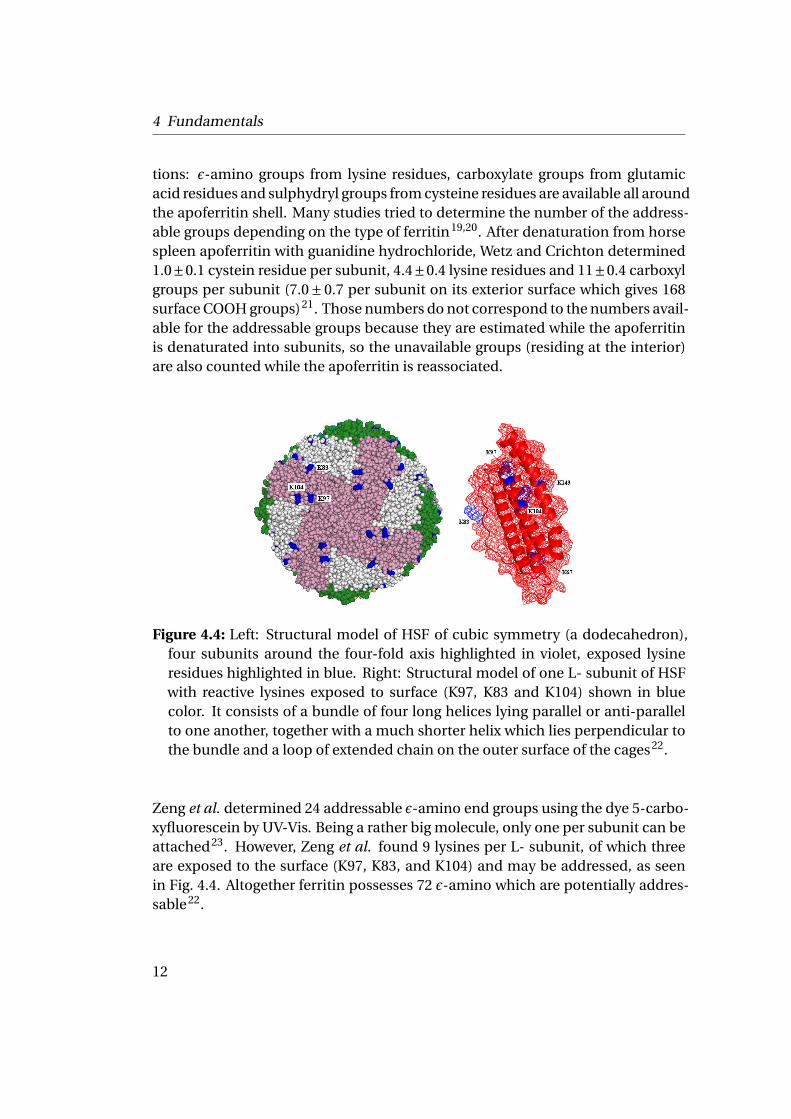
Figure 4.4: Left: Structural model of HSF of cubic symmetry (a dodecahedron),four subunits around the four-fold axis highlighted in violet, exposed lysineresidues highlighted in blue. Right: Structural model of one L- subunit of HSFwith reactive lysines exposed to surface (K97, K83 and K104) shown in bluecolor. It consists of a bundle of four long helices lying parallel or anti-parallelto one another, together with a much shorter helix which lies perpendicular tothe bundle and a loop of extended chain on the outer surface of the cages22.
Zeng et al. determined 24 addressable ε-amino end groups using the dye 5-carbo-xyfluorescein by UV-Vis. Being a rather big molecule, only one per subunit can beattached23. However, Zeng et al. found 9 lysines per L- subunit, of which threeare exposed to the surface (K97, K83, and K104) and may be addressed, as seenin Fig. 4.4. Altogether ferritin possesses 72 ε-amino which are potentially addres-sable22.
12
4.1 Horse Spleen Ferritin
4.1.2 Function: Iron Storage Protein
Iron is an essential nutrient for the synthesis of iron-porphyrin proteins, such ashemoglobin. The iron molecules are insoluble in their native form under physio-logical conditions. They are encapsulated as a ferrihydrite core by ferritin. Ferritinplays a significant role in iron detoxification and acts as a large reservoir for ironin a bioavailable form24,25.
Iron is localized inside apoferritin, a spherical macromolecule with a central cav-ity able to stock iron as a micelle of iron oxide hydroxide-phosphate of an approx-imate composition (FeOOH)8(FeOPO3H2). Ferritin can contain a maximum of4500 atoms of iron per molecule26. Hydrophilic and hydrophobic pores penetratethe capsid at the eight threefold and the six fourfold axes. Iron enters the capsidvia the hydrophilic and hydrophobic pores located at the threefold axes of the cap-sid and oxygen enters through the hydrophobic pores at the fourfold axes.
The iron uptake depends on the composition of L- chain and H- chain subunits ofthe ferritin. The ratio can vary between the different types of ferritin from 2 : 22 to20 : 4 of L- and H- chain respectively27,28. H- rich ferritins catalyze the oxidationof iron (II), while L- rich ferritins promote the nucleation and storage of iron (III).Iso-ferritins rich in H- chain are associated with a rapid iron uptake, and have aprotecting role in H rich tissues such as the heart, the brain and the red blood cells.L- rich ferritins have a slower iron uptake and have larger mineralized cores andare found in the liver, spleen or plasma. Generally, L- rich ferritins are more stableagainst chemical and heat denaturation29.
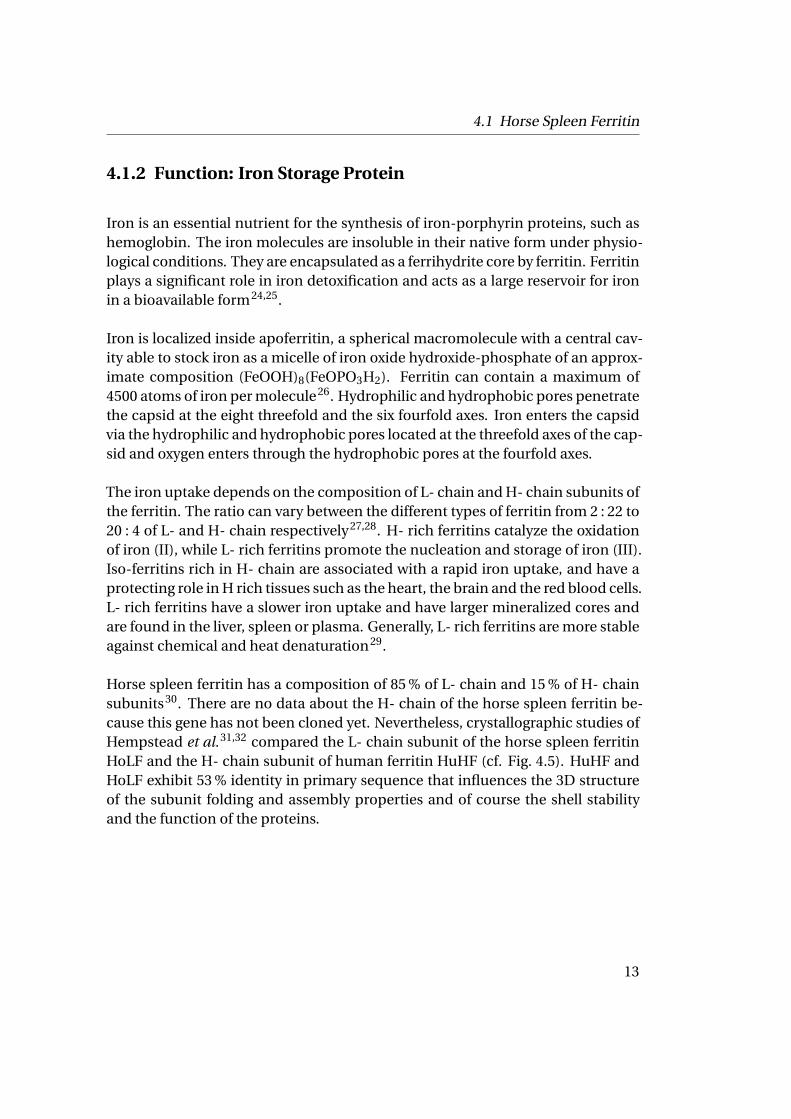
Horse spleen ferritin has a composition of 85 % of L- chain and 15 % of H- chainsubunits30. There are no data about the H- chain of the horse spleen ferritin be-cause this gene has not been cloned yet. Nevertheless, crystallographic studies ofHempstead et al.31,32 compared the L- chain subunit of the horse spleen ferritinHoLF and the H- chain subunit of human ferritin HuHF (cf. Fig. 4.5). HuHF andHoLF exhibit 53 % identity in primary sequence that influences the 3D structureof the subunit folding and assembly properties and of course the shell stabilityand the function of the proteins.
13
4 Fundamentals
HoLF subunit structure HuHF subunit structure
Figure 4.5: Difference in the secondary structure of the subunits HoLF (L- chain)and HuHF (H- chain), adapted from protein data bank.
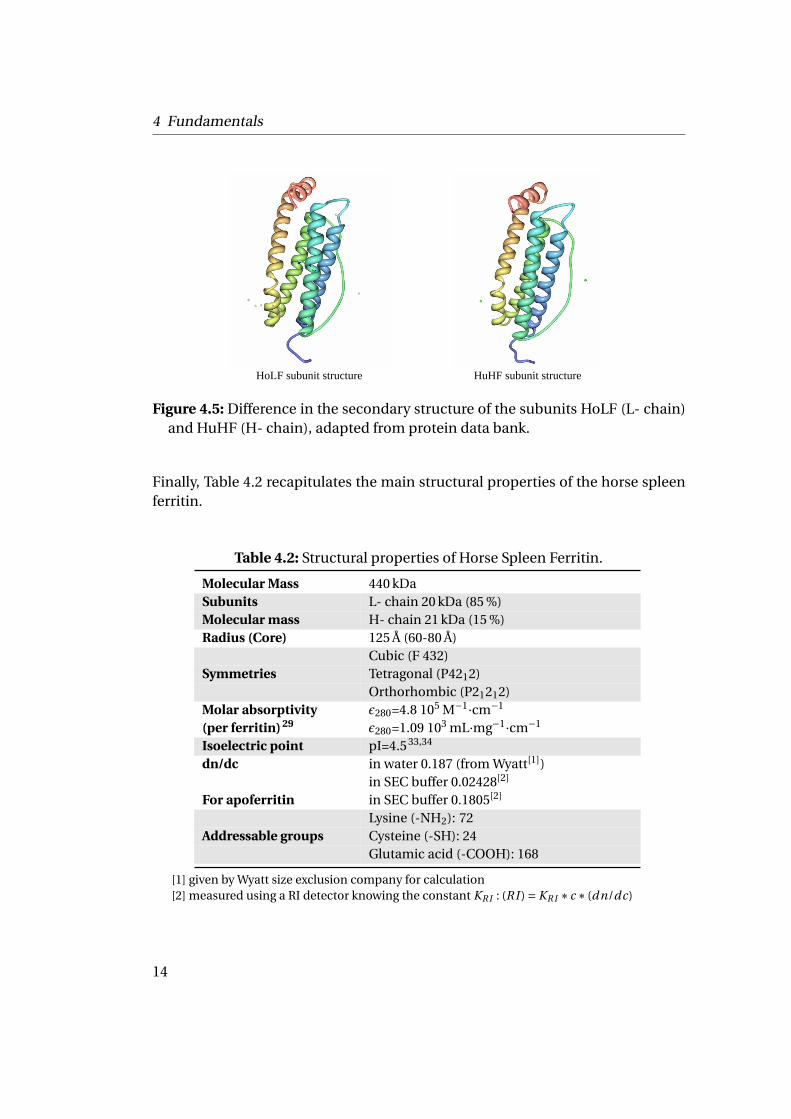
Finally, Table 4.2 recapitulates the main structural properties of the horse spleenferritin.
Table 4.2: Structural properties of Horse Spleen Ferritin.
Molecular Mass 440 kDaSubunits L- chain 20 kDa (85 %)Molecular mass H- chain 21 kDa (15 %)Radius (Core) 125 Å (60-80 Å)
Cubic (F 432)Symmetries Tetragonal (P4212)
Orthorhombic (P21212)Molar absorptivity ε280=4.8 105 M−1·cm−1
(per ferritin) 29 ε280=1.09 103 mL·mg−1·cm−1
Isoelectric point pI=4.5 33,34
dn/dc in water 0.187 (from Wyatt[1])in SEC buffer 0.02428[2]
For apoferritin in SEC buffer 0.1805[2]
Lysine (-NH2): 72Addressable groups Cysteine (-SH): 24
Glutamic acid (-COOH): 168
[1] given by Wyatt size exclusion company for calculation[2] measured using a RI detector knowing the constant KRI : (RI ) = KRI ∗ c ∗ (dn/dc)
14
4.1 Horse Spleen Ferritin
4.1.3 Denaturation of Horse Spleen Ferritin
The denaturation consists of breaking the quaternary structure so that the pro-tein is separated into tertiary structure subunits. The denaturated state is definedby a breakdown of its native conformation and is accompanied by the loss of bi-ological or biochemical activity. High temperatures break the weak non covalentinteractions, that stabilize the folded protein, and convert the folded structure toa largely unfolded one with remarkably different properties e.g. optical rotation,viscosity or UV absorption.
Another way to induce the denaturation of protein is the use of chemical denatu-rants (also called chaotropic agents) such as urea or guanidinium hydrochloridein high concentrations or detergents like sodium dodecyl sulfate (SDS). Thesecompounds are thought to unfold proteins in large part by competing for hydro-gen bonds with the polar groups of the backbone and of the side chains. Denatur-ing compounds can hydrophobically associate with the non polar residues andexpose them to the surface. Thus they lead to a breakdown of the native struc-ture by disrupting the optimized internal hydrophobic interactions. Listowskyet al.35 showed that HSF can be denaturated by addition of aqueous guanidinechloride at a concentration of 7 M at pH 7.5 and Zeng22 used urea (6 M) and ß-mercapto-ethanol (10 mM). This phenomenon is reversible upon removal of theguanidinium hydrochloride.
4.1.4 Chemistry & Materials Science Involving Horse SpleenFerritin
Horse spleen ferritin is a powerful tool for materials science. It is perfectly mo-nodisperse in size and in its composition of addressable chemical groups. It isrelatively cheap and easily accessible making it a perfect model protein. Moreover,horse spleen ferritin is highly stable regarding temperature (up to 85 ◦C) and pHrange (from 3 to 9). It is water soluble but can undergo a mixture of water andorganic solvent in minor quantity such as DMSO and DMF for a short time. HSFhas been used as a multivalent nanoplatform in a large number of hybridizationprocedures36.
15
4 Fundamentals
4.1.4.1 Self-Assembled Monolayers (SAM) & Two-Dimensional Array
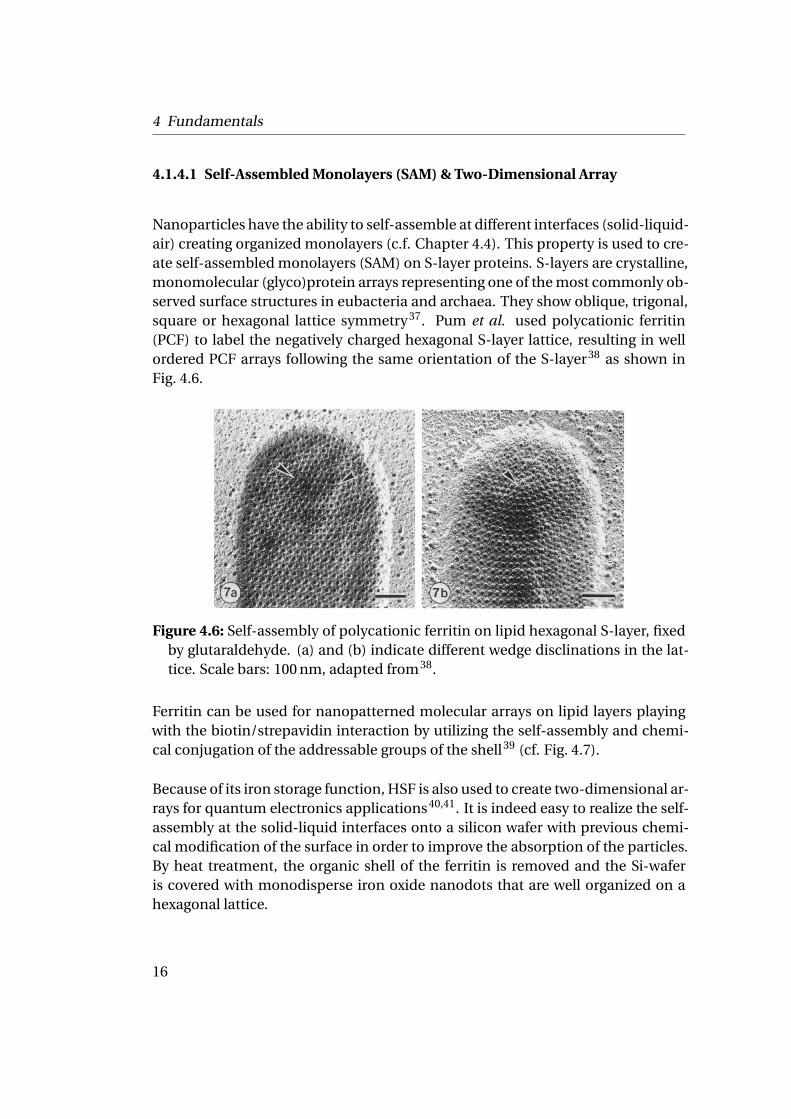
Nanoparticles have the ability to self-assemble at different interfaces (solid-liquid-air) creating organized monolayers (c.f. Chapter 4.4). This property is used to cre-ate self-assembled monolayers (SAM) on S-layer proteins. S-layers are crystalline,monomolecular (glyco)protein arrays representing one of the most commonly ob-served surface structures in eubacteria and archaea. They show oblique, trigonal,square or hexagonal lattice symmetry37. Pum et al. used polycationic ferritin(PCF) to label the negatively charged hexagonal S-layer lattice, resulting in wellordered PCF arrays following the same orientation of the S-layer38 as shown inFig. 4.6.
Figure 4.6: Self-assembly of polycationic ferritin on lipid hexagonal S-layer, fixedby glutaraldehyde. (a) and (b) indicate different wedge disclinations in the lat-tice. Scale bars: 100 nm, adapted from38.
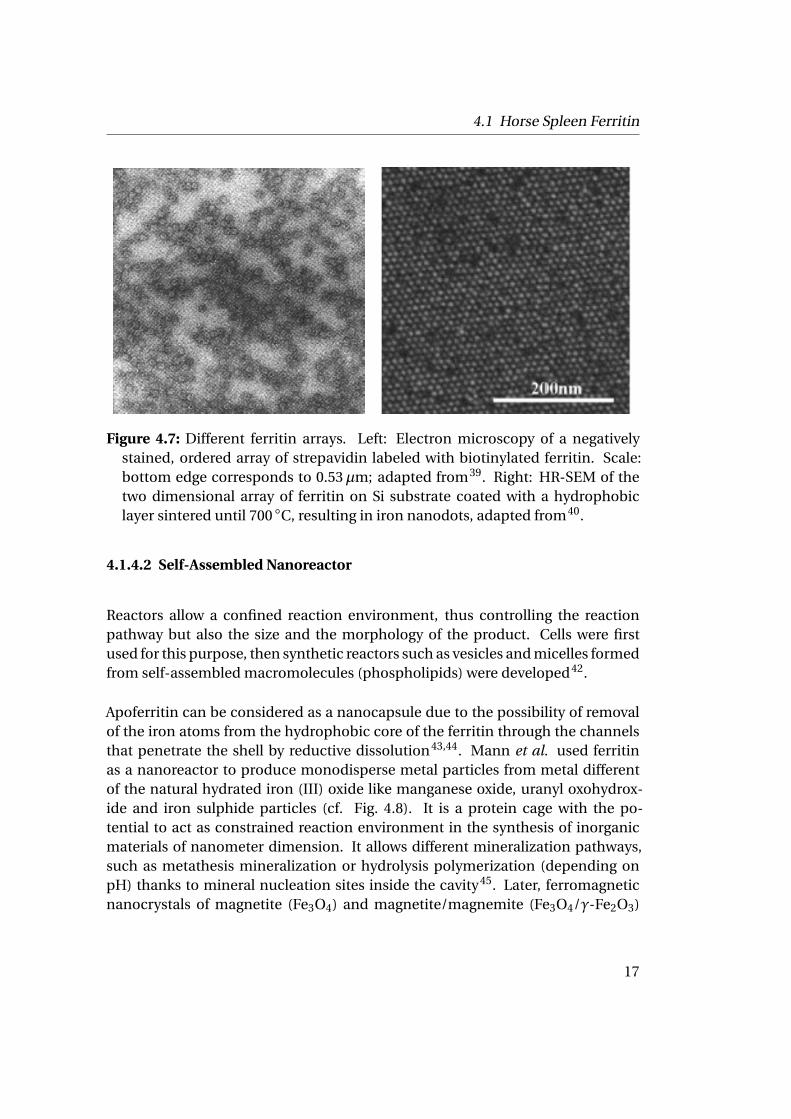
Ferritin can be used for nanopatterned molecular arrays on lipid layers playingwith the biotin/strepavidin interaction by utilizing the self-assembly and chemi-cal conjugation of the addressable groups of the shell39 (cf. Fig. 4.7).
Because of its iron storage function, HSF is also used to create two-dimensional ar-rays for quantum electronics applications40,41. It is indeed easy to realize the self-assembly at the solid-liquid interfaces onto a silicon wafer with previous chemi-cal modification of the surface in order to improve the absorption of the particles.By heat treatment, the organic shell of the ferritin is removed and the Si-waferis covered with monodisperse iron oxide nanodots that are well organized on ahexagonal lattice.
16
4.1 Horse Spleen Ferritin
Figure 4.7: Different ferritin arrays. Left: Electron microscopy of a negatively
stained, ordered array of strepavidin labeled with biotinylated ferritin. Scale:bottom edge corresponds to 0.53µm; adapted from39. Right: HR-SEM of thetwo dimensional array of ferritin on Si substrate coated with a hydrophobiclayer sintered until 700 ◦C, resulting in iron nanodots, adapted from40.
4.1.4.2 Self-Assembled Nanoreactor
Reactors allow a confined reaction environment, thus controlling the reactionpathway but also the size and the morphology of the product. Cells were firstused for this purpose, then synthetic reactors such as vesicles and micelles formedfrom self-assembled macromolecules (phospholipids) were developed42.
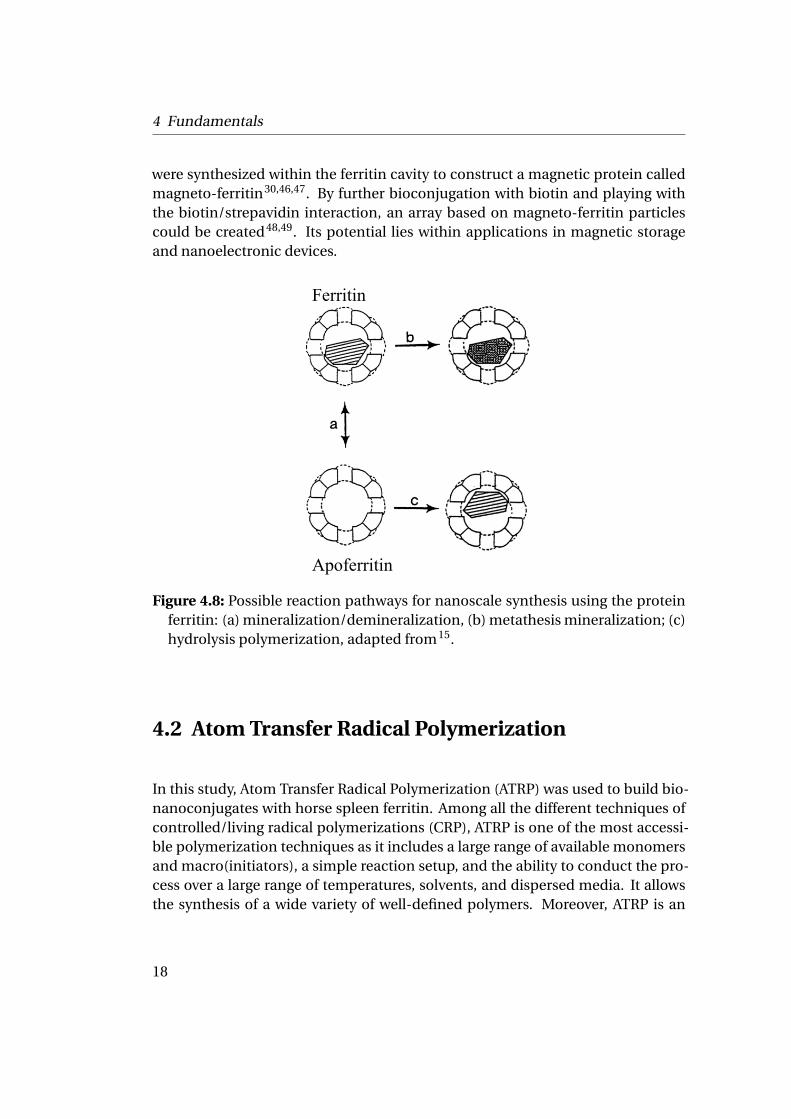
Apoferritin can be considered as a nanocapsule due to the possibility of removalof the iron atoms from the hydrophobic core of the ferritin through the channelsthat penetrate the shell by reductive dissolution43,44. Mann et al. used ferritinas a nanoreactor to produce monodisperse metal particles from metal differentof the natural hydrated iron (III) oxide like manganese oxide, uranyl oxohydrox-ide and iron sulphide particles (cf. Fig. 4.8). It is a protein cage with the po-tential to act as constrained reaction environment in the synthesis of inorganicmaterials of nanometer dimension. It allows different mineralization pathways,such as metathesis mineralization or hydrolysis polymerization (depending onpH) thanks to mineral nucleation sites inside the cavity45. Later, ferromagneticnanocrystals of magnetite (Fe3O4) and magnetite/magnemite (Fe3O4/γ-Fe2O3)
17
4 Fundamentals
were synthesized within the ferritin cavity to construct a magnetic protein calledmagneto-ferritin30,46,47. By further bioconjugation with biotin and playing withthe biotin/strepavidin interaction, an array based on magneto-ferritin particlescould be created48,49. Its potential lies within applications in magnetic storageand nanoelectronic devices.
Apoferritin
Ferritin
Figure 4.8: Possible reaction pathways for nanoscale synthesis using the proteinferritin: (a) mineralization/demineralization, (b) metathesis mineralization; (c)hydrolysis polymerization, adapted from15.
4.2 Atom Transfer Radical Polymerization
In this study, Atom Transfer Radical Polymerization (ATRP) was used to build bio-nanoconjugates with horse spleen ferritin. Among all the different techniques ofcontrolled/living radical polymerizations (CRP), ATRP is one of the most accessi-ble polymerization techniques as it includes a large range of available monomersand macro(initiators), a simple reaction setup, and the ability to conduct the pro-cess over a large range of temperatures, solvents, and dispersed media. It allowsthe synthesis of a wide variety of well-defined polymers. Moreover, ATRP is an
18
4.2 Atom Transfer Radical Polymerization
adequate technique for the grafting approaches allowing the synthesis of manydifferent structures and applications50–58.
4.2.1 Controlled/Living Radical Polymerization
A polymerization is described as "living" when the formed macromolecular chainsare able to grow further if some extra amount of monomer is added to the sys-tem, i.e. the active species are stable and the transfer reactions or terminationare negligible. The molecular mass increases linearly with the conversion and thedistribution of the mass of the chains is narrow.
4.2.1.1 ATRP
Principle
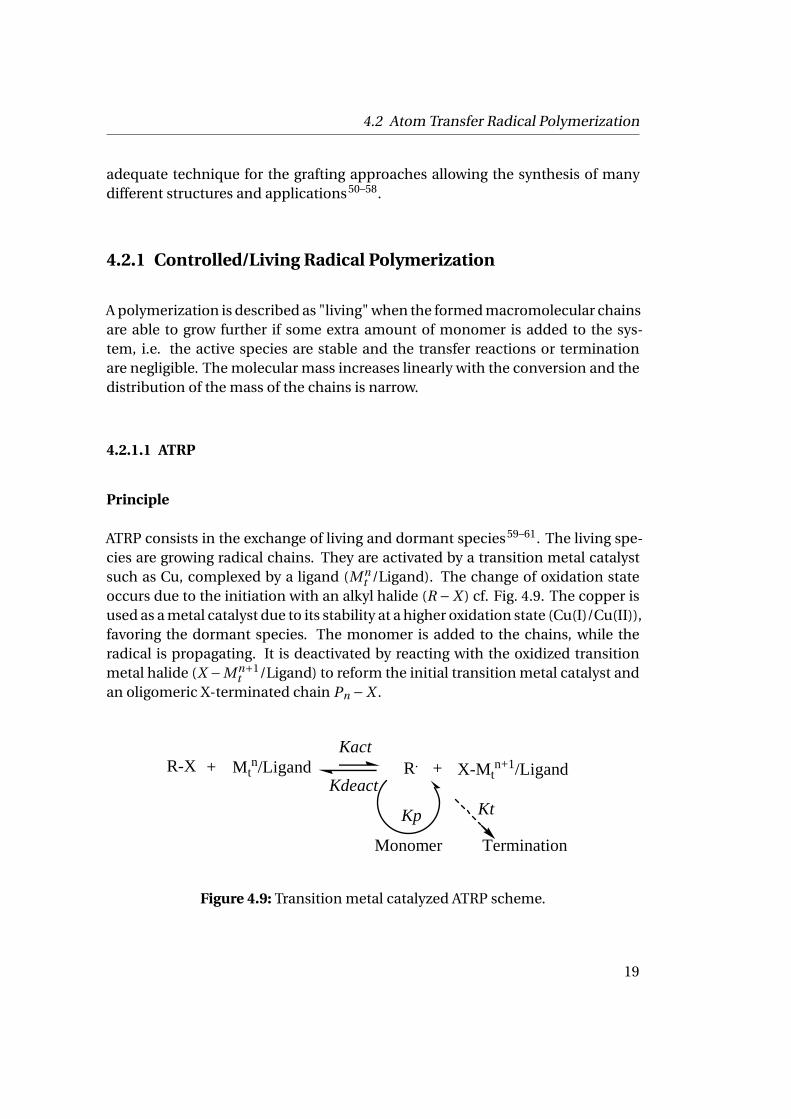
ATRP consists in the exchange of living and dormant species59–61. The living spe-cies are growing radical chains. They are activated by a transition metal catalystsuch as Cu, complexed by a ligand (M n
t /Ligand). The change of oxidation stateoccurs due to the initiation with an alkyl halide (R − X ) cf. Fig. 4.9. The copper isused as a metal catalyst due to its stability at a higher oxidation state (Cu(I)/Cu(II)),favoring the dormant species. The monomer is added to the chains, while theradical is propagating. It is deactivated by reacting with the oxidized transitionmetal halide (X −M n+1
t /Ligand) to reform the initial transition metal catalyst andan oligomeric X-terminated chain Pn −X .
+ Mtn/Ligand R. + X-Mt
n+1/Ligand
Monomer
R-XKact
Kdeact
Kp Kt
Termination
Figure 4.9: Transition metal catalyzed ATRP scheme.
19
4 Fundamentals
This process occurs with a rate constant of activation Kact and deactivation Kdeact .Polymer chains grow at a rate constant of propagation Kp of the radicals. Termi-nation reactions (Kt ) also occur in ATRP through radical coupling and dispropor-tionation but to a smaller degree than other techniques.
In summary the ATRP system is composed of a monomer, an initiator with a trans-ferable halogen, and a catalyst system with a ligand. The solvent and the temper-ature are also important elements to control the system.
Mechanism
A large variety of monomers has been polymerized by ATRP such as styrenes, (me-th)acrylates, (meth)acrylamides and acrylonitrile. Each monomer has its ownatom transfer equilibrium constant for its living and dormant species. In the ab-sence of side reactions, the equilibrium constant Keq determines the polymeriza-tion rate:
Keq = Kact /Kdeact (4.1)
ATRP will not occur if Keq is too small, whereas a large Keq will lead to a largeamount of termination. For every monomer the concentration of propagatingradicals has to be adjusted in order to control the polymerization. The initiatorconcentration determines the number of growing polymer chains. If the initia-tion is fast and the side reactions are negligible, the number of chains is constantand equal to the initial concentration of the initiator. The theoretical molecularweight or degree of polymerization (DP ) increases reciprocally with the initial con-centration of initiator in a living polymerization:
DP = [M ]o/[I ]o ·conversion (4.2)
Simultaneously the molecular weight of the polymer chains increases linearly fol-lowing the conversion while the polydispersity (Mw /Mn) decreases. The alkylhalide (R − X ) must rapidly and selectively migrate between the growing chainand the transition metal complex. In ATRP, when X is a bromide or a chloride,the molecular weight control is at its optimum. When the initiating moiety R isattached to macromolecular species or proteins, macro-initiators are formed and
20
4.2 Atom Transfer Radical Polymerization
can be used to synthesize block/graft copolymers. The catalyst system composedof the transition metal complexed by a ligand is the key of control over polymerchains, as it determines the position of the atom transfer equilibrium and the dy-namics of exchange between the dormant and living species. The metal centermust possess at least two accessible oxidation states separated by one electron,and it should have a reasonable affinity towards the halide. The ligand shouldcomplex the metal strongly and quickly. ATRP can be carried out in solution, inbulk or in heterogeneous systems (emulsion, suspension). Chain transfer to thesolvent should be minimal. Interactions between the solvent and the catalyticsystem should be considered due to the fact that the structure of the catalyst canchange in dependence of the solvents. Polymerizations in polar media, such aswater are accelerated. It is possible to add an amount of transition metal com-plex at the higher oxidation state to shift the equilibrium towards the dormantspecies. The temperature also plays an important role as the rate of polymeriza-tion increases with increase in temperature. Moreover at higher temperature thetermination is more pronounced and the catalyst can be decomposed. Prolongedreaction time leads to nearly complete monomer conversion. This may not in-crease the polydispersity but will induce loss of end groups. To obtain polymerswith an end group functionality, the conversion should not exceed 95 %.
Kinetics
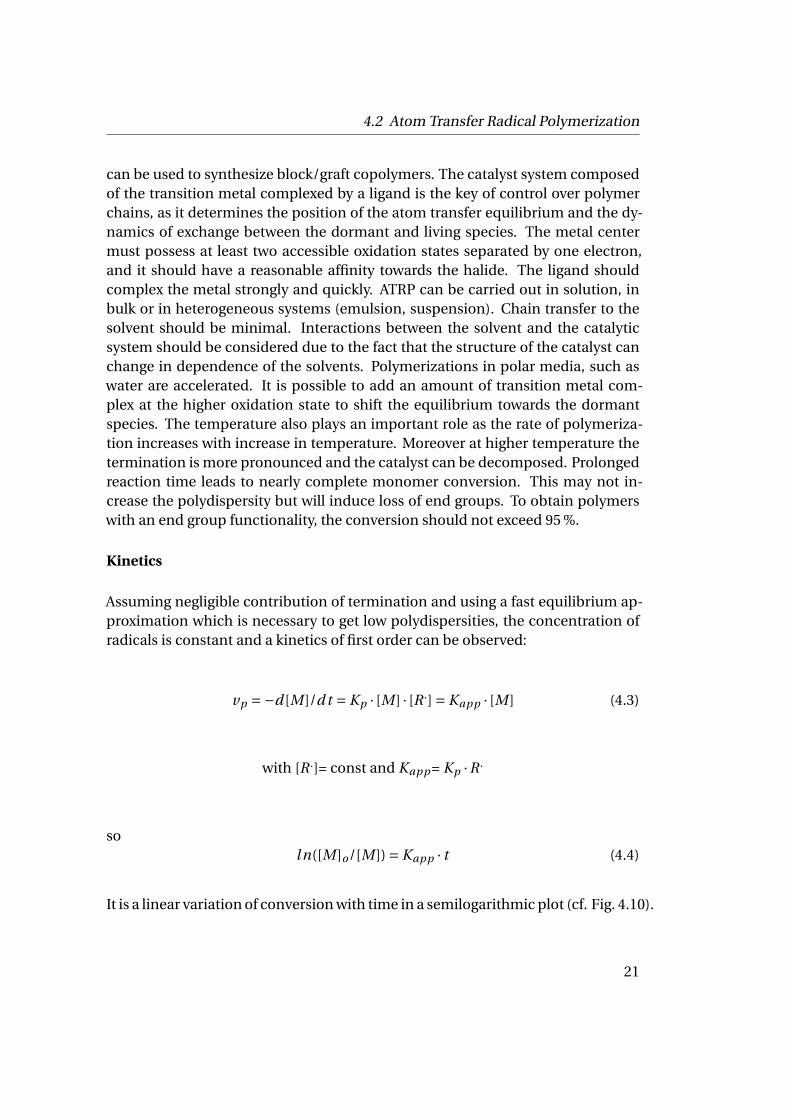
Assuming negligible contribution of termination and using a fast equilibrium ap-proximation which is necessary to get low polydispersities, the concentration ofradicals is constant and a kinetics of first order can be observed:
vp =−d [M ]/d t = Kp · [M ] · [R .] = Kapp · [M ] (4.3)
with [R .]= const and Kapp = Kp ·R .
sol n([M ]o/[M ]) = Kapp · t (4.4)
It is a linear variation of conversion with time in a semilogarithmic plot (cf. Fig. 4.10).
21
4 Fundamentals
Time
Ln ([M]o /[M
]t ) Con
vers
ion
Figure 4.10: Scheme of the time-dependence of the conversion in linear and semi-logarithmic coordinates.
In reality the kinetics laws are more complicated at the beginning of the polymer-ization due to the spontaneous formation of the complex of the catalyst systemvia the persistent radical effect (PRE). Indeed, if the initial amount of oxidizedtransition metal halide (X −M n+1
t /Ligand) is not sufficient to deactivate the livingspecies rapidly, its concentration is increasing due to the irreversible terminationof the small amount of chains in the first instant of the polymerization. The persis-tent radical effect allows the regulation of the transfer equilibrium: if this equilib-rium is shifted far towards the living species, the concentration of radicals is toohigh. This leads to termination reactions, which increase the concentration of theoxidized complex and the deactivation rate and shifts the equilibrium towards thedormant species and allows the control of the polymerization.
4.2.2 Grafting Approaches
ATRP is well known to be one of the most suitable techniques for the grafting ofblock copolymers, gradient polymers, and brushes. The grafting techniques62
have two different approaches: the grafting to and the grafting from strategies (cf.Fig. 4.11). The grafting to strategy includes polymerization of free polymer chainsand use of some functional groups to attach them to another polymer chain, tosurfaces or to nanoparticles. The functional group can be at the end of the chainas it comes from the initiator, (R −Pn − X ) in ATRP, but it can also be part of the
22
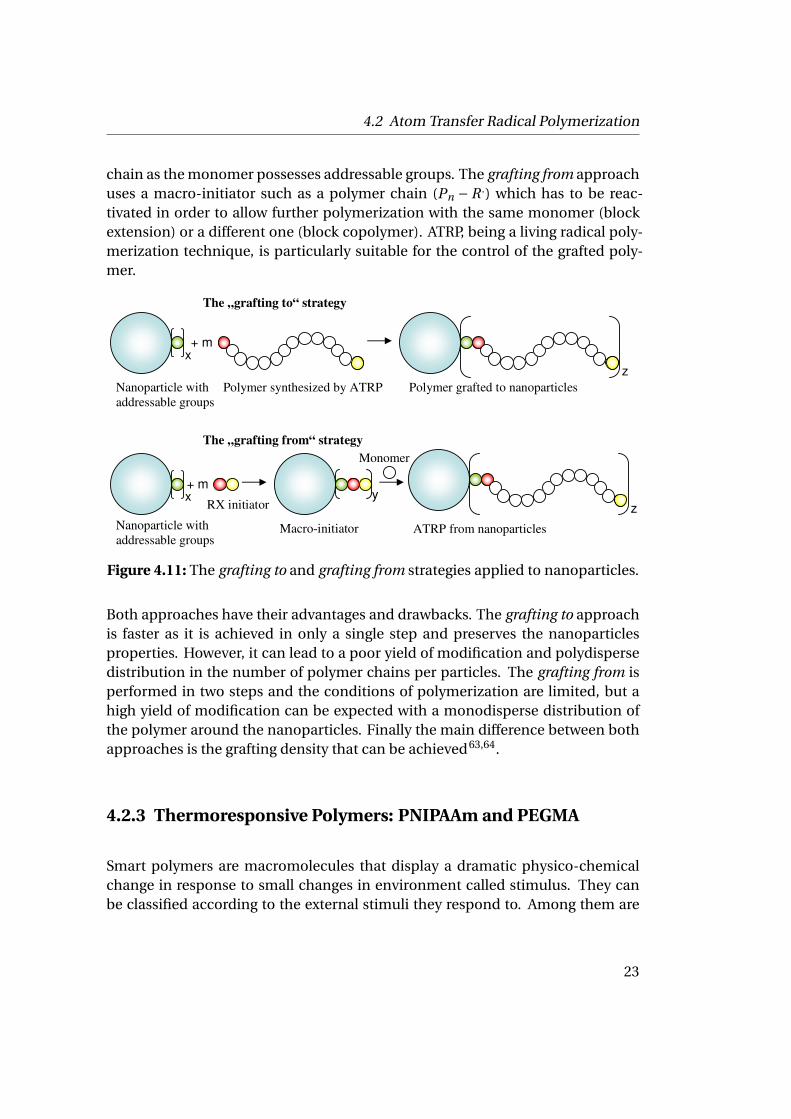
4.2 Atom Transfer Radical Polymerization
chain as the monomer possesses addressable groups. The grafting from approachuses a macro-initiator such as a polymer chain (Pn − R .) which has to be reac-tivated in order to allow further polymerization with the same monomer (blockextension) or a different one (block copolymer). ATRP, being a living radical poly-merization technique, is particularly suitable for the control of the grafted poly-mer.
+ m
+ m
The „grafting to“ strategy
The „grafting from“ strategy
RX initiator
Macro-initiator ATRP from nanoparticles
Polymer synthesized by ATRP Nanoparticle with
addressable groups
Polymer grafted to nanoparticles
Nanoparticle with
addressable groups
z
x
x z
Monomer
y
Figure 4.11: The grafting to and grafting from strategies applied to nanoparticles.
Both approaches have their advantages and drawbacks. The grafting to approachis faster as it is achieved in only a single step and preserves the nanoparticlesproperties. However, it can lead to a poor yield of modification and polydispersedistribution in the number of polymer chains per particles. The grafting from isperformed in two steps and the conditions of polymerization are limited, but ahigh yield of modification can be expected with a monodisperse distribution ofthe polymer around the nanoparticles. Finally the main difference between bothapproaches is the grafting density that can be achieved63,64.
4.2.3 Thermoresponsive Polymers: PNIPAAm and PEGMA
Smart polymers are macromolecules that display a dramatic physico-chemicalchange in response to small changes in environment called stimulus. They canbe classified according to the external stimuli they respond to. Among them are
23
4 Fundamentals
Fraction of polymer
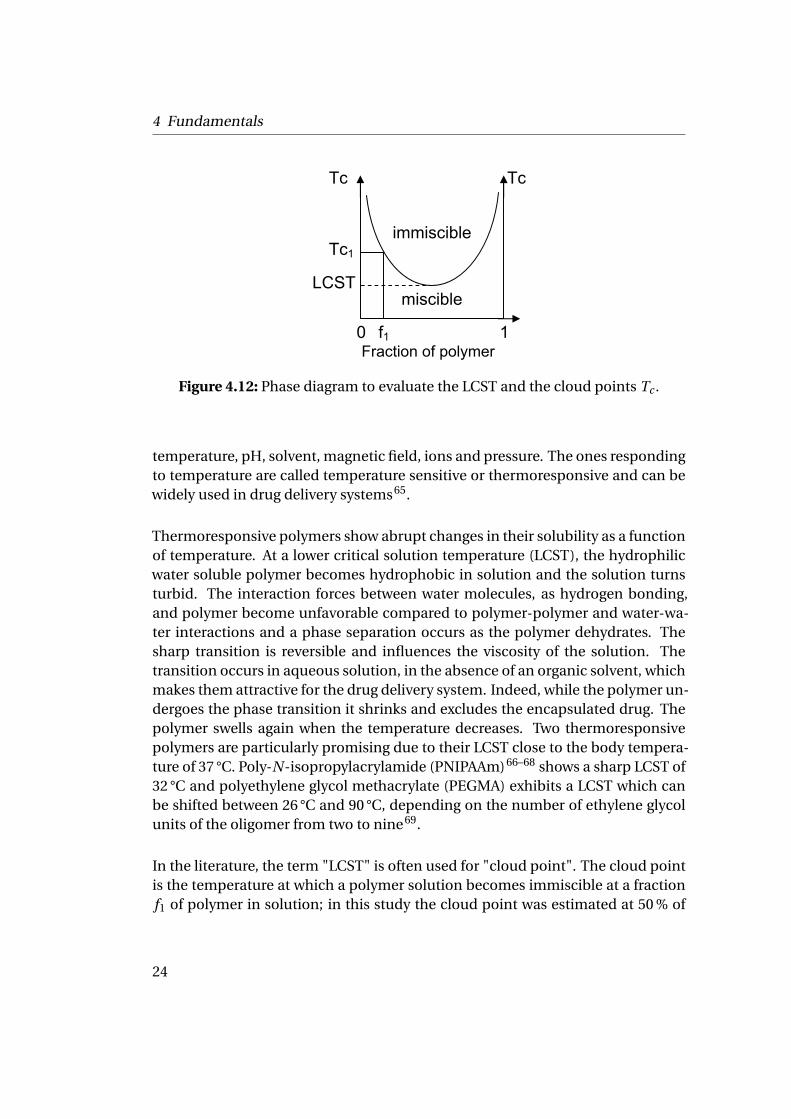
Tc
f1
Tc1 LCST
Tc
0 1
immiscible
miscible
Figure 4.12: Phase diagram to evaluate the LCST and the cloud points Tc .
temperature, pH, solvent, magnetic field, ions and pressure. The ones respondingto temperature are called temperature sensitive or thermoresponsive and can bewidely used in drug delivery systems65.
Thermoresponsive polymers show abrupt changes in their solubility as a functionof temperature. At a lower critical solution temperature (LCST), the hydrophilicwater soluble polymer becomes hydrophobic in solution and the solution turnsturbid. The interaction forces between water molecules, as hydrogen bonding,and polymer become unfavorable compared to polymer-polymer and water-wa-ter interactions and a phase separation occurs as the polymer dehydrates. Thesharp transition is reversible and influences the viscosity of the solution. Thetransition occurs in aqueous solution, in the absence of an organic solvent, whichmakes them attractive for the drug delivery system. Indeed, while the polymer un-dergoes the phase transition it shrinks and excludes the encapsulated drug. Thepolymer swells again when the temperature decreases. Two thermoresponsivepolymers are particularly promising due to their LCST close to the body tempera-ture of 37 °C. Poly-N-isopropylacrylamide (PNIPAAm)66–68 shows a sharp LCST of32 °C and polyethylene glycol methacrylate (PEGMA) exhibits a LCST which canbe shifted between 26 °C and 90 °C, depending on the number of ethylene glycolunits of the oligomer from two to nine69.
In the literature, the term "LCST" is often used for "cloud point". The cloud pointis the temperature at which a polymer solution becomes immiscible at a fractionf1 of polymer in solution; in this study the cloud point was estimated at 50 % of
24
4.3 Bioconjugation and (Thermoresponsive) Polymer-Bioconjugates
the normalized absorbance abrupt shift. The cloud point depends on the molec-ular weight of the polymer but also on its polydispersity. The LCST is the lowesttemperature of the limit miscible/immiscible of the phase diagram as shown inFig. 4.12.
4.3 Bioconjugation and (Thermoresponsive)Polymer-Bioconjugates
4.3.1 Bioconjugation of Ferritin
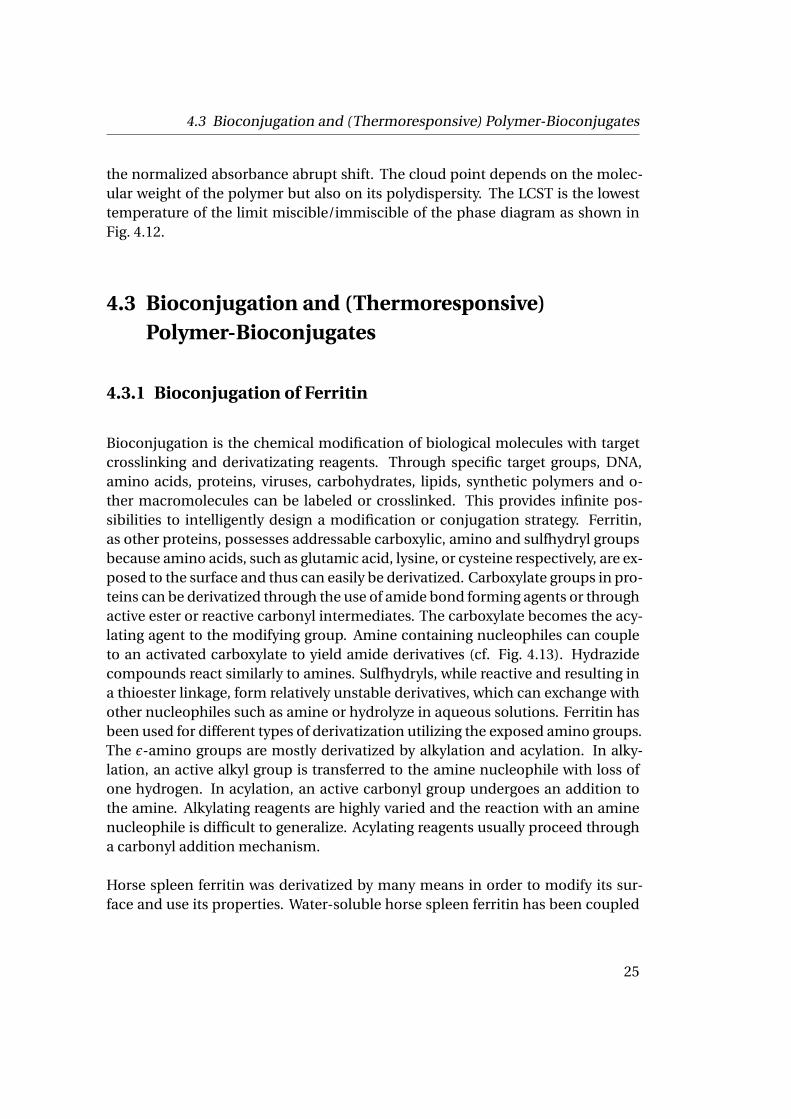
Bioconjugation is the chemical modification of biological molecules with targetcrosslinking and derivatizating reagents. Through specific target groups, DNA,amino acids, proteins, viruses, carbohydrates, lipids, synthetic polymers and o-ther macromolecules can be labeled or crosslinked. This provides infinite pos-sibilities to intelligently design a modification or conjugation strategy. Ferritin,as other proteins, possesses addressable carboxylic, amino and sulfhydryl groupsbecause amino acids, such as glutamic acid, lysine, or cysteine respectively, are ex-posed to the surface and thus can easily be derivatized. Carboxylate groups in pro-teins can be derivatized through the use of amide bond forming agents or throughactive ester or reactive carbonyl intermediates. The carboxylate becomes the acy-lating agent to the modifying group. Amine containing nucleophiles can coupleto an activated carboxylate to yield amide derivatives (cf. Fig. 4.13). Hydrazidecompounds react similarly to amines. Sulfhydryls, while reactive and resulting ina thioester linkage, form relatively unstable derivatives, which can exchange withother nucleophiles such as amine or hydrolyze in aqueous solutions. Ferritin hasbeen used for different types of derivatization utilizing the exposed amino groups.The ε-amino groups are mostly derivatized by alkylation and acylation. In alky-lation, an active alkyl group is transferred to the amine nucleophile with loss ofone hydrogen. In acylation, an active carbonyl group undergoes an addition tothe amine. Alkylating reagents are highly varied and the reaction with an aminenucleophile is difficult to generalize. Acylating reagents usually proceed througha carbonyl addition mechanism.
Horse spleen ferritin was derivatized by many means in order to modify its sur-face and use its properties. Water-soluble horse spleen ferritin has been coupled
25
4 Fundamentals
N
N
N
R' O
Cl
Cl
R-NH2
N
N
N
R' O
Cl
NH-R
R' O SO2 CH2CF3
R-NH2R'
HN R
R-NH2
R-NH2
R'
NNN
O O
O
R'O O
O
N
O
O
R'O O
NO2
R'O O
OCl Cl
Cl
R'O O
O
N
N
CH2
O
O
N
O
O
H2CR'
O O
R'O
O
NH
R
CH2
O
HN
H2CR'
O O
O
R
O O
O
Figure 4.13: Different amine reactive molecules used for bioconjugation reactionstowards ε-amino groups from lysine, R’ can also represent polymers such asPEG70.
26
4.3 Bioconjugation and (Thermoresponsive) Polymer-Bioconjugates
to alkyl chains (hexyl, nonyl, lauryl chains) through its addressable carboxylic acidgroup using EDC, a zero length crosslinker, in a mixture of water/THF. The result-ing ferritin was hydrophobic and soluble in dichloromethane (DCM) without dis-ruption of its quaternary structure71.
4.3.2 Design of Polymer-Bioconjugates
Polymer-bioconjugates are a new trend to design drug delivery systems. Nucleicacids, oligopeptides, proteins, enzymes, carbohydrates, viruses or cells are conju-gated to polymers using their targeting sites through grafting to and newly graft-ing from approaches. With different strategies, living radical polymerization tech-niques were exploited for the synthesis of a new generation of polymer-bioconju-gates. Using different living radical polymerization (LRP) such as RAFT or ATRP,very well defined conjugates were obtained. Tables 4.3 and 4.4 give an overviewof the work already done.
Table 4.3: Different syntheses of polymer-bioconjugates by grafting to strategy.
Bio-template Target groups Polymer LRP RefsLysozyme amine/cystein NHS-PEGMA ATRP 72
BSA cystein P(HEMA) ATRP 57
Papain amine MPC inifer mediated LRP 73
Peptide (GGR) and BSA Click chemistry PS-N3 ATRP 74
Peptide (GGRGDG) Click chemistry Branched PEG-N3 ATRP 75
Glycine methyl ester amine PNMS ATRP 76
Glycine leucine amine PVO-block-PNIPAAm RAFT 77
Galactoamine amine PNAS ATRP 78
CPMV amine PEG ATRP 79
Ferritin amine PEG - 80
Different investigations have been already performed on the synthesis of protein-polymer conjugates or hybrids and in case of the temperature sensitive polymers,the thermoresponsive behavior of the hybrids was proven81. Lele et al. were thefirst to assay the grafting from approach to synthesize uniform protein-polymerconjugates using chymotrypsin and poly(MPEG-MA) by ATRP64. At first an ATRPinitiator was attached to the lysine groups of the protein and the polymer suc-cessfully grew from the protein. In order to compare both strategies, the conven-tional grafting to was also assayed; MPEG-SPA was grafted to chymotrypsin by
27
4 Fundamentals
ester chemistry. As a result, it was shown that grafting to leads to broader distribu-tion of the conjugates than grafting from approach. Maynard et al. were the first touse the grafting from approach to synthesize thermoresponsive hybrids. Bovineserum albumine (BSA) and strepavidin were both modified into macro-initiatorusing the amino end groups of both proteins and then NIPAAm was polymerizedby ATRP in DMSO as those proteins are stable in the organic solvent. Turbiditymeasurements showed thermoresponsive behavior of the hybrids82,83.
Table 4.4: Different syntheses of polymer-bioconjugates by grafting from strategy.
Bio-template Initiator Monomer LRP Refsα-chymotrypsin 2-bromoisobutyryl bromide OEGMA ATRP 64
BSA and lysozyme pyridyl disulfide initiator NIPAAm ATRP 84
BSA maleimide initiator OEGMA ATRP 85
Lysozyme N-hydroxysuccinimide initiator DMAEMA ATRP 85
Peptide N-hydroxysuccinimide initiator tert-butyl acrylate ATRP 86
Ferritin N-hydroxysuccinimide initiator OEGMA ATRP 23
Peptide CTA nBA RAFT 87
BSA pyridyl disulfide CTA (EO)A RAFT 88
Horse spleen ferritin was pegylated in different studies to change its solubilityor incorporate the resulting particles into polymer matrices. Polyethylene gly-col (PEG) was prepared with a functional NHS-ester end group with a molecularweight of 2000 g·mol−1 and was grafted to the ferritin using its ε-amino groups.PEG is extensively used to modify proteins because of its solubility in water andin organic solvents, its lack of toxicity and biocompatibility. Pegylated-ferritin ismore stable and soluble and prevents denaturation in organic solvent80. Lin et al.demonstrated the effect of incorporated nanoparticles5 on the crystallization ofpoly(ethylene oxide) domains of a block-co-polymer by using pegylated ferritin.There are other ways to bind ferritin to polymer. One is to use biotinylated ferritinand to add it to a non compressed monolayer of strepavidin-polystyrene conju-gates89. Zeng et al. used successfully click chemistry 90 to address selectively theε-amino groups of the horse spleen ferritin. It could be derivatized with alkylchains but also with a dye reagent fluorescein-NHS. His work was dedicated toshow how many amino groups are addressable but also to prove that the MALDI-ToF MS technique is suitable to study the reactivity and regioselectivity of biologi-cal nanoparticles towards chemical modification22,23.
28
4.4 Assembly of Nanoparticles at Solid-Liquid Interfaces
4.4 Assembly of Nanoparticles at Solid-LiquidInterfaces
When a protein solution is spread on a charged surface, the particles adsorb on thesurface instantaneously. The process of protein adsorption depends on the prop-erties of the surface, the nature of the proteins and the solution properties. Thesurface of a protein is complex due to the exposed amino acid residues that influ-ence the protein hydrophobicity and charges91. Most of proteins are amphiphilicand therefore highly surface active. Globular proteins are more hydrophilic asthe apolar residues are located in the inside shell. A major factor influencing theadsorption is the surface energy and it has been reported that the hydrophobicsurface adsorbs more proteins than hydrophilic ones92. Proteins are still able tochange their conformation to bind to the surface. The driving force of the bind-ing reaction described by Norde93,94 is an increase of the entropy, due to confor-mational changes of the protein resulting in the loss of the secondary structure.Adsorption is electrostatically controlled at charged surfaces and the maximumof adsorbed amount is often found at the isoelectric point of the protein, it is dueto a minimum of the intramolecular and/or lateral repulsion95. Capillary forcealso influences the binding of proteins at solid-liquid interfaces. It is resulting ina closed packed monolayer of protein96.
4.4.1 Adsorption Process
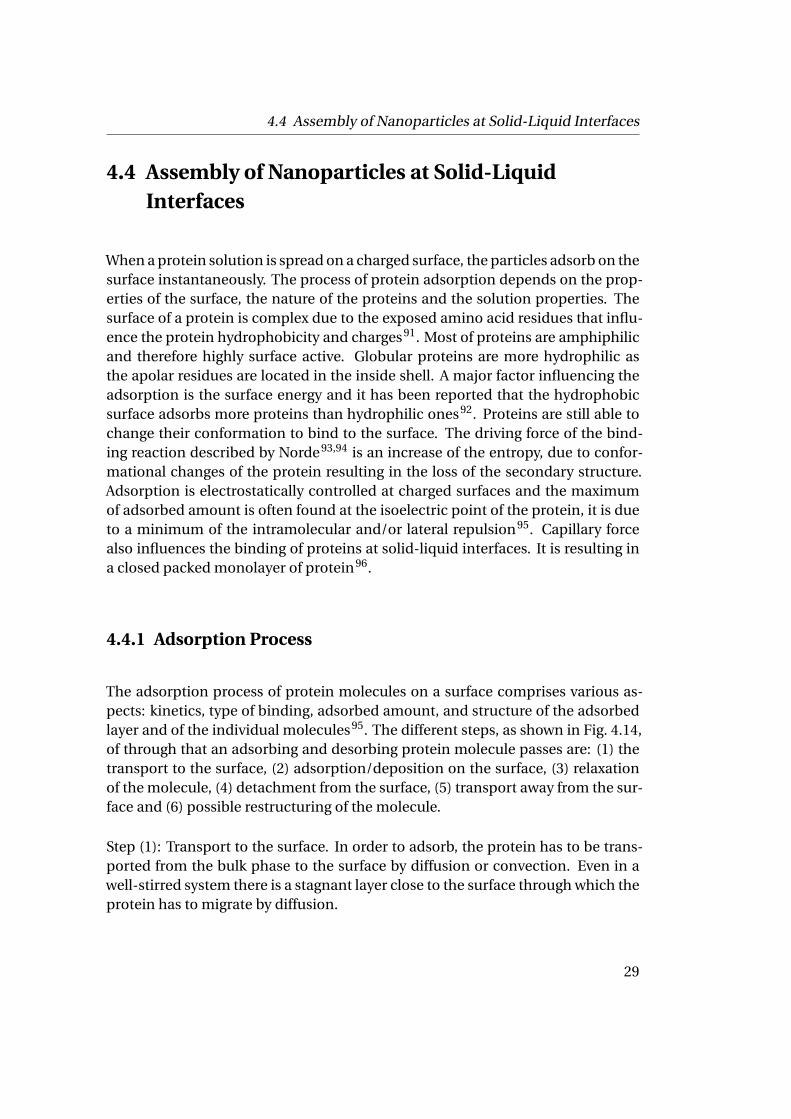
The adsorption process of protein molecules on a surface comprises various as-pects: kinetics, type of binding, adsorbed amount, and structure of the adsorbedlayer and of the individual molecules95. The different steps, as shown in Fig. 4.14,of through that an adsorbing and desorbing protein molecule passes are: (1) thetransport to the surface, (2) adsorption/deposition on the surface, (3) relaxationof the molecule, (4) detachment from the surface, (5) transport away from the sur-face and (6) possible restructuring of the molecule.
Step (1): Transport to the surface. In order to adsorb, the protein has to be trans-ported from the bulk phase to the surface by diffusion or convection. Even in awell-stirred system there is a stagnant layer close to the surface through which theprotein has to migrate by diffusion.
29
4 Fundamentals
1
2
5
4
3
2* 4*
1* 5*
6
Figure 4.14: Adsorption/desorption process of a protein molecule.
Step (2): Adsorption. The adsorption reaction at the surface can be the rate-deter-mining step. As the surface fills with adsorbed proteins, the adsorption rate be-comes a function of surface coverage and decreases below the rate of diffusionand thereby becomes a controlled surface-reaction.
Step(3): Time dependent structural changes. The conformation of the adsorbedprotein can be vitally important for its function. Changes in conformation can oc-cur immediately upon adsorption, but time-dependent conformational changesare also evident. Conformational changes have been suggested to be greater atlow surface coverage where other molecules impose a negligible influence on theability of a protein to adopt different conformations. Once the protein moleculehas been attached, it relaxed towards its equilibrium structure because of the al-tered environment that in general is different from the native structure in solution.But the relaxation is slow because of the strong internal coherence of the protein.Structural relaxation implies optimization of protein-surface interactions and in-volves a certain degree of spreading of the protein molecule over the sorbent sur-face, developing larger number of protein-surface contacts. As a consequence,after relaxation the detachment of the protein from the sorbent is more difficult.When the spreading occurs more quickly the adsorbed molecules are flattened. Ifthe flux of particles to the surface increases, the conformation of proteins is moreglobular and the adsorbed mass per unit surface area is higher.
Step(4): Desorption of adsorbed protein or exchange. Protein adsorption is of-ten irreversible or partially irreversible. However, the protein can be desorbedby changing the pH, or increasing the ionic strength. The effect of pH and saltconcentration are usually more pronounced with hydrophilic surfaces than hy-
30
4.4 Assembly of Nanoparticles at Solid-Liquid Interfaces
drophobic ones92. The absorption reaches a saturation after a certain time, anddepends strongly on the flux. Adsorption isotherms (Adsorbed mass per unitsorbent surface γ versus c for globular proteins display well defined plateau val-ues that are reached at γ(ceq )(concentration at the equilibrium). The plateau iscomparable to the absorbed amount in a closely packed monolayer of molecules.There is a hysteresis between the adsorption and desorption isotherms, manifest-ing an almost irreversible protein adsorption process. This can be explained bythe fact that the protein is bound to the surface by several weak bonds. Althoughthe formation and breakage of such bonds is a dynamic process the likelihoodof all bonds between the protein and its binding sites on the surface breaking atthe same time is low. However, the energy needed to disrupt one of these bondswill be quite small and another protein may then bind to the surface, replacing it.The desorbed molecules can re-adsorb at a slightly different location, leading tosurface mobility of a particular molecule.
Step(5): Transport away from the surface. This is the reverse of step (1) althoughthe protein may be conformationally altered compared to the native state. Theprotein is less prone to absorb a second time.
The 3D structure of globular protein molecules is only marginally stable, so inter-action with a sorbent surface may induce rearrangements in the protein structure.The thickness of the monolayer of adsorbed protein is comparable to the dimen-sions of the native protein molecule, which proves that the structure undergoessmall rearrangements. After adsorption, at one side of the protein molecule theaqueous environment is replaced by the sorbent material. As a consequence, in-tramolecular hydrophobic interactions become less important as a structure sta-bilizing factor, as apolar parts of the protein that are buried in the interior of thedissolved molecule may become exposed to the sorbent surface without makingcontact with water. Hydrophobic interactions between amino acid residues sup-port the formation of α-helices and β-sheets. A destabilization of the secondarystructure may form hydrogen bonds with the sorbent surface. Then a decrease inordered secondary structure would result in an increased conformational entropyof the protein and hence an increased adsorption affinity.
31
4 Fundamentals
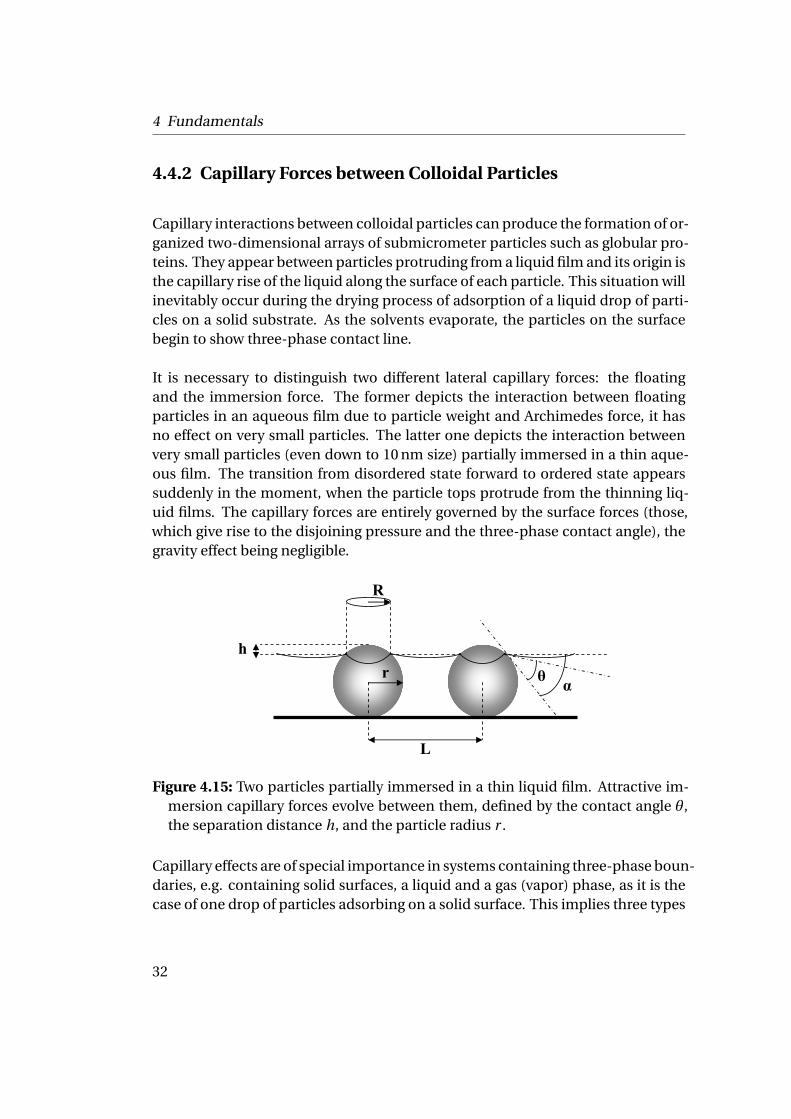
4.4.2 Capillary Forces between Colloidal Particles
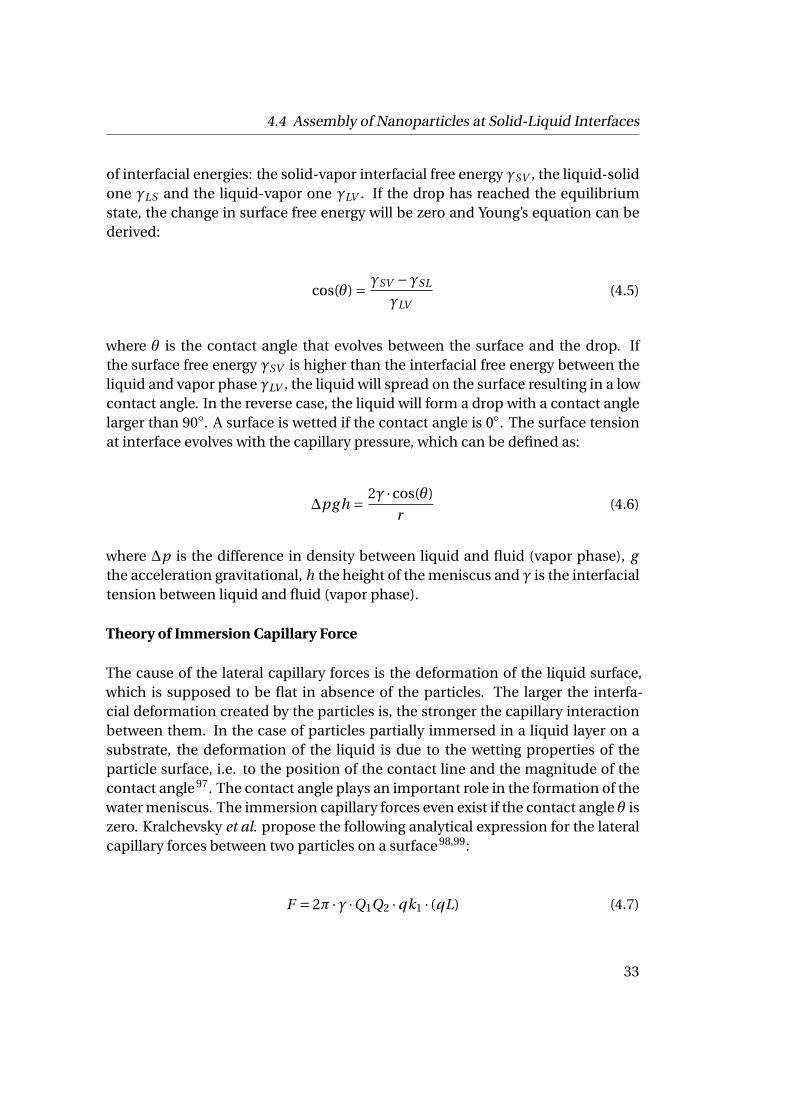
Capillary interactions between colloidal particles can produce the formation of or-ganized two-dimensional arrays of submicrometer particles such as globular pro-teins. They appear between particles protruding from a liquid film and its origin isthe capillary rise of the liquid along the surface of each particle. This situation willinevitably occur during the drying process of adsorption of a liquid drop of parti-cles on a solid substrate. As the solvents evaporate, the particles on the surfacebegin to show three-phase contact line.
It is necessary to distinguish two different lateral capillary forces: the floatingand the immersion force. The former depicts the interaction between floatingparticles in an aqueous film due to particle weight and Archimedes force, it hasno effect on very small particles. The latter one depicts the interaction betweenvery small particles (even down to 10 nm size) partially immersed in a thin aque-ous film. The transition from disordered state forward to ordered state appearssuddenly in the moment, when the particle tops protrude from the thinning liq-uid films. The capillary forces are entirely governed by the surface forces (those,which give rise to the disjoining pressure and the three-phase contact angle), thegravity effect being negligible.
L
R
r h
θ α
Figure 4.15: Two particles partially immersed in a thin liquid film. Attractive im-mersion capillary forces evolve between them, defined by the contact angle θ,the separation distance h, and the particle radius r .
Capillary effects are of special importance in systems containing three-phase boun-daries, e.g. containing solid surfaces, a liquid and a gas (vapor) phase, as it is thecase of one drop of particles adsorbing on a solid surface. This implies three types
32
4.4 Assembly of Nanoparticles at Solid-Liquid Interfaces
of interfacial energies: the solid-vapor interfacial free energy γSV , the liquid-solidone γLS and the liquid-vapor one γLV . If the drop has reached the equilibriumstate, the change in surface free energy will be zero and Young’s equation can bederived:
cos(θ) = γSV −γSL
γLV(4.5)
where θ is the contact angle that evolves between the surface and the drop. Ifthe surface free energy γSV is higher than the interfacial free energy between theliquid and vapor phase γLV , the liquid will spread on the surface resulting in a lowcontact angle. In the reverse case, the liquid will form a drop with a contact anglelarger than 90◦. A surface is wetted if the contact angle is 0◦. The surface tensionat interface evolves with the capillary pressure, which can be defined as:
∆pg h = 2γ ·cos(θ)
r(4.6)
where ∆p is the difference in density between liquid and fluid (vapor phase), gthe acceleration gravitational, h the height of the meniscus and γ is the interfacialtension between liquid and fluid (vapor phase).
Theory of Immersion Capillary Force
The cause of the lateral capillary forces is the deformation of the liquid surface,which is supposed to be flat in absence of the particles. The larger the interfa-cial deformation created by the particles is, the stronger the capillary interactionbetween them. In the case of particles partially immersed in a liquid layer on asubstrate, the deformation of the liquid is due to the wetting properties of theparticle surface, i.e. to the position of the contact line and the magnitude of thecontact angle97. The contact angle plays an important role in the formation of thewater meniscus. The immersion capillary forces even exist if the contact angle θ iszero. Kralchevsky et al. propose the following analytical expression for the lateralcapillary forces between two particles on a surface98,99:
F = 2π ·γ ·Q1Q2 ·qk1 · (qL) (4.7)
33
4 Fundamentals
where L is the separation distance of the particles, γ is the surface tension betweenliquid and fluid (vapor) and k1 is a modified Bessel function of first order and Qi
is defined as followed:
Qi = Ri sin(αi ) (4.8)
where R is the radius of contact line (of particle 1 and 2) and α is the meniscusslope angle as shown in Fig. 4.15. q−1 is the Debye length defined as:
q−1 =(
γ
∆p · g
)1/2
(4.9)
Under the assumption that R << L << q−1, Eq. 4.7 simplifies to:
F = 2π ·γ · Q1Q2
L(4.10)
4.4.3 Self-Assembly of Colloidal Particles
If particles absorb on a surface (e.g. by electrostatic interactions), capillary forcesare present during the drying step and tend to influence the particle array pro-duced in suspension. The adsorption parameters can be tuned (e.g. concentra-tion of particles, temperature, hydrophilicity of the surface, pH (addition of salt),rate of evaporation) and affect the interparticle distance such that it suddenly islow enough for capillary forces to start acting on clustering the particles100,101.
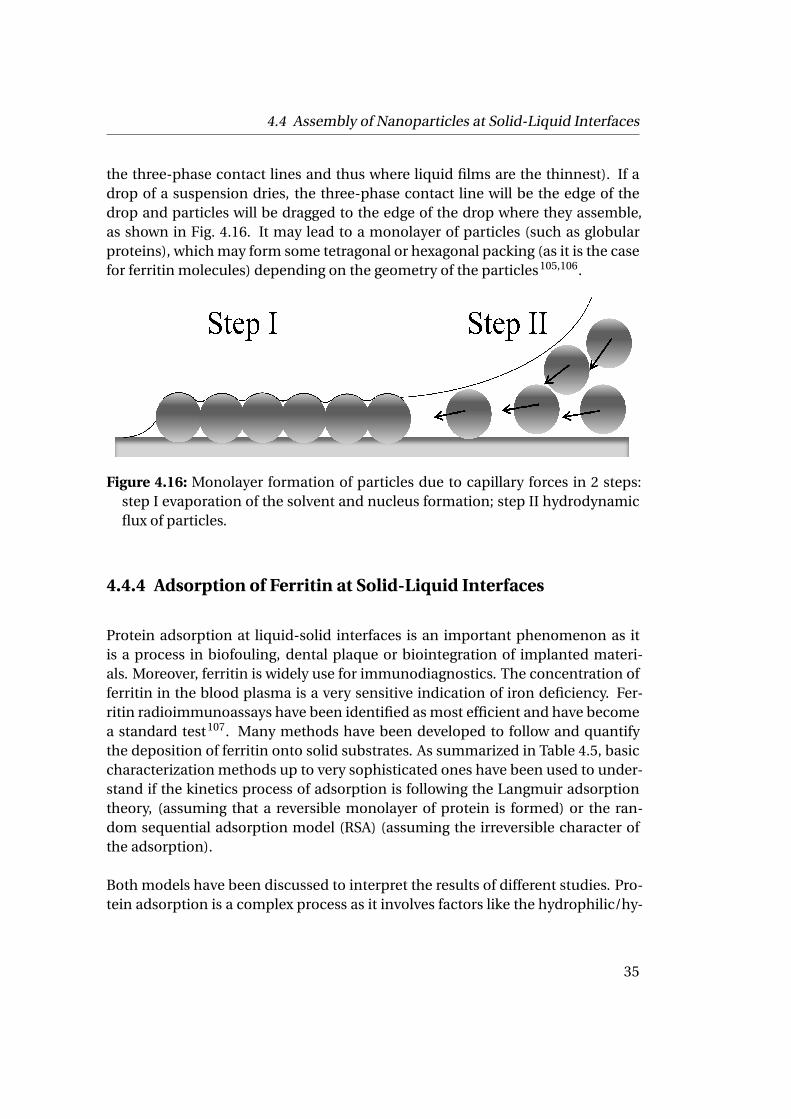
Capillary forces occur in all particle self-assembly processes as soon as the evap-orating solvent layer is thinner than the particle diameter102,103. The mechanismgoverning their 2D colloidal assembly is in two steps: first, the immersion of cap-illary forces attract nearby particles and start to form the nucleus of the mono-layer. The second step of that process is the formation of a colloidal monolayer orcrystal due to the hydrodynamic force which drags particles to regions of thinnerliquid layers104. The reason for that particle flux is a hydrodynamic flux, whichtransports matter to regions where evaporation rates are the highest (which is at
34
4.4 Assembly of Nanoparticles at Solid-Liquid Interfaces
the three-phase contact lines and thus where liquid films are the thinnest). If adrop of a suspension dries, the three-phase contact line will be the edge of thedrop and particles will be dragged to the edge of the drop where they assemble,as shown in Fig. 4.16. It may lead to a monolayer of particles (such as globularproteins), which may form some tetragonal or hexagonal packing (as it is the casefor ferritin molecules) depending on the geometry of the particles105,106.
Figure 4.16: Monolayer formation of particles due to capillary forces in 2 steps:step I evaporation of the solvent and nucleus formation; step II hydrodynamicflux of particles.
4.4.4 Adsorption of Ferritin at Solid-Liquid Interfaces
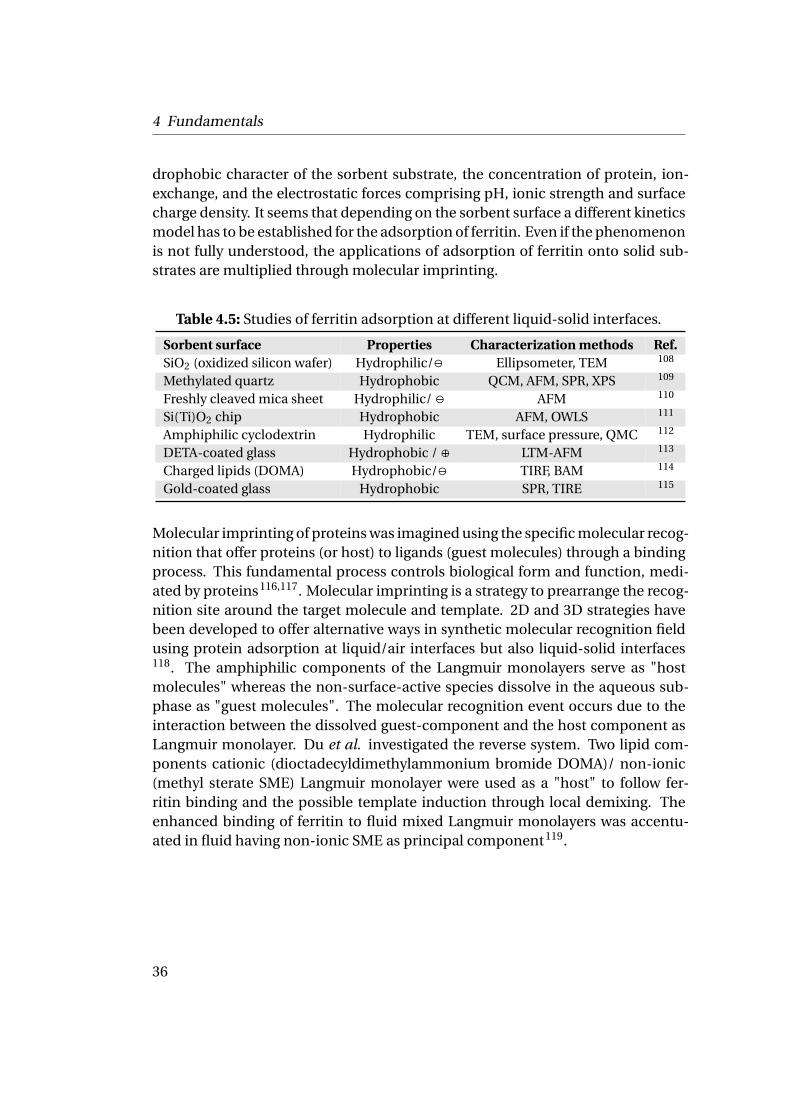
Protein adsorption at liquid-solid interfaces is an important phenomenon as itis a process in biofouling, dental plaque or biointegration of implanted materi-als. Moreover, ferritin is widely use for immunodiagnostics. The concentration offerritin in the blood plasma is a very sensitive indication of iron deficiency. Fer-ritin radioimmunoassays have been identified as most efficient and have becomea standard test107. Many methods have been developed to follow and quantifythe deposition of ferritin onto solid substrates. As summarized in Table 4.5, basiccharacterization methods up to very sophisticated ones have been used to under-stand if the kinetics process of adsorption is following the Langmuir adsorptiontheory, (assuming that a reversible monolayer of protein is formed) or the ran-dom sequential adsorption model (RSA) (assuming the irreversible character ofthe adsorption).
Both models have been discussed to interpret the results of different studies. Pro-tein adsorption is a complex process as it involves factors like the hydrophilic/hy-
35
4 Fundamentals
drophobic character of the sorbent substrate, the concentration of protein, ion-exchange, and the electrostatic forces comprising pH, ionic strength and surfacecharge density. It seems that depending on the sorbent surface a different kineticsmodel has to be established for the adsorption of ferritin. Even if the phenomenonis not fully understood, the applications of adsorption of ferritin onto solid sub-strates are multiplied through molecular imprinting.
Table 4.5: Studies of ferritin adsorption at different liquid-solid interfaces.
Sorbent surface Properties Characterization methods Ref.SiO2 (oxidized silicon wafer) Hydrophilic/ª Ellipsometer, TEM 108
Methylated quartz Hydrophobic QCM, AFM, SPR, XPS 109
Freshly cleaved mica sheet Hydrophilic/ ª AFM 110
Si(Ti)O2 chip Hydrophobic AFM, OWLS 111
Amphiphilic cyclodextrin Hydrophilic TEM, surface pressure, QMC 112
DETA-coated glass Hydrophobic / ⊕ LTM-AFM 113
Charged lipids (DOMA) Hydrophobic/ª TIRF, BAM 114
Gold-coated glass Hydrophobic SPR, TIRE 115
Molecular imprinting of proteins was imagined using the specific molecular recog-nition that offer proteins (or host) to ligands (guest molecules) through a bindingprocess. This fundamental process controls biological form and function, medi-ated by proteins116,117. Molecular imprinting is a strategy to prearrange the recog-nition site around the target molecule and template. 2D and 3D strategies havebeen developed to offer alternative ways in synthetic molecular recognition fieldusing protein adsorption at liquid/air interfaces but also liquid-solid interfaces118. The amphiphilic components of the Langmuir monolayers serve as "hostmolecules" whereas the non-surface-active species dissolve in the aqueous sub-phase as "guest molecules". The molecular recognition event occurs due to theinteraction between the dissolved guest-component and the host component asLangmuir monolayer. Du et al. investigated the reverse system. Two lipid com-ponents cationic (dioctadecyldimethylammonium bromide DOMA)/ non-ionic(methyl sterate SME) Langmuir monolayer were used as a "host" to follow fer-ritin binding and the possible template induction through local demixing. Theenhanced binding of ferritin to fluid mixed Langmuir monolayers was accentu-ated in fluid having non-ionic SME as principal component119.
36
4.5 Nanoporous Membranes
4.5 Nanoporous Membranes
Membranes are interphases between two adjacent phases acting as a selectivebarrier, regulating the transport of substances between the two compartments.They are low energy consumption devices for separation processes and can beperformed isothermally at low temperature. Depending on the pore size and poredensity, membranes offer different separation processes such as dialysis, gas sepa-ration, reverse osmosis, nanofiltration, ultrafiltration, microfiltration and electro-dialysis. Through all different membrane applications such as water treatment orblood detoxification, many approaches have been developed and the industrialmarket of membrane is growing. After producing the first membrane made ofmetal (aluminium oxide), ceramics or liquid membrane, some greater attention isfocused onto polymer membranes which allow a wide variability of barrier struc-tures and properties. The first generation of membrane made of biopolymers (cel-lulose) tried to mimic the kidney function (hemodialysis). Since then great effortshave been made to improve selective transport through biological membranesenabled by highly specialized macromolecular and supramolecular assemblies,based on molecular recognition. It was focused on the synthesis of novel poly-mers with well-defined structure as "tailored" membrane materials, advanced sur-face functionalization, use of templates, preparation of composite membranes forthe synergetic combination of different functions and novel processing of poly-mers for membranes120.
In the case of porous membranes, the transport rate and selectivity are mainlyinfluenced by viscous flow and sieving or size exclusion. Interactions of soluteswith the membrane (pores) surface may alter the membrane performance. Withmeso- and microporous membranes, selective adsorption can be used for an al-ternative separation mechanism. In theory, porous barriers could be used for veryprecise continuous permselective separations based on subtle differences in size,shape, and/or functional groups. The permeability and selectivity can integrallybe controlled by concentration polarization or membrane fouling. The selectivitycan be switched by an external stimulus or can adapt to the environment/processcondition which opens new applications such as analytics, screening, membranereactor or bio-artificial membrane systems. One more essential challenge will bethe minimizing of the thickness of the membrane barrier layer and the upscalingproduction.
The polymer membrane technology involves different approaches resulting in dif-
37
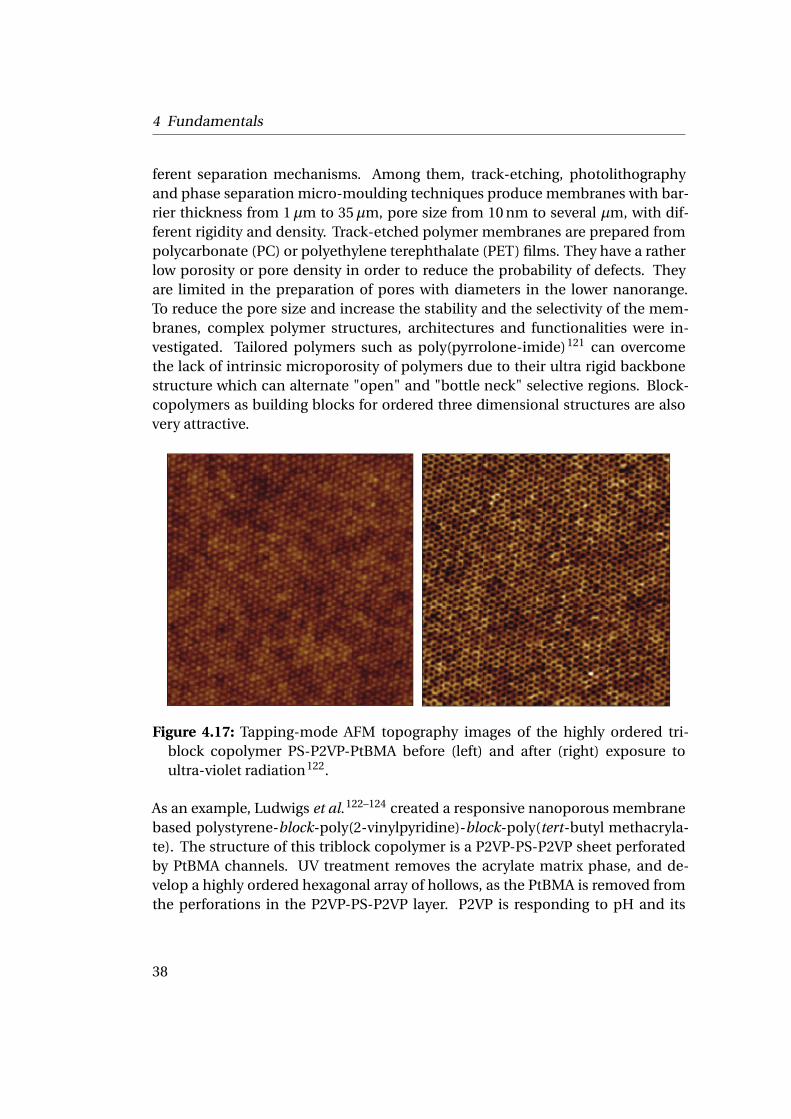
4 Fundamentals
ferent separation mechanisms. Among them, track-etching, photolithographyand phase separation micro-moulding techniques produce membranes with bar-rier thickness from 1µm to 35µm, pore size from 10 nm to several µm, with dif-ferent rigidity and density. Track-etched polymer membranes are prepared frompolycarbonate (PC) or polyethylene terephthalate (PET) films. They have a ratherlow porosity or pore density in order to reduce the probability of defects. Theyare limited in the preparation of pores with diameters in the lower nanorange.To reduce the pore size and increase the stability and the selectivity of the mem-branes, complex polymer structures, architectures and functionalities were in-vestigated. Tailored polymers such as poly(pyrrolone-imide)121 can overcomethe lack of intrinsic microporosity of polymers due to their ultra rigid backbonestructure which can alternate "open" and "bottle neck" selective regions. Block-copolymers as building blocks for ordered three dimensional structures are alsovery attractive.
Figure 4.17: Tapping-mode AFM topography images of the highly ordered tri-block copolymer PS-P2VP-PtBMA before (left) and after (right) exposure toultra-violet radiation122.
As an example, Ludwigs et al.122–124 created a responsive nanoporous membranebased polystyrene-block-poly(2-vinylpyridine)-block-poly(tert-butyl methacryla-te). The structure of this triblock copolymer is a P2VP-PS-P2VP sheet perforatedby PtBMA channels. UV treatment removes the acrylate matrix phase, and de-velop a highly ordered hexagonal array of hollows, as the PtBMA is removed fromthe perforations in the P2VP-PS-P2VP layer. P2VP is responding to pH and its
38
4.5 Nanoporous Membranes
quaternization can lead to a water-soluble coverage of PS-core. However, the wet-tability remains a challenge as the general problem of the block-copolymer basedmembrane is that they do not exhibit a sufficient permeability and required sur-face functionalization.
Indeed, surface properties can be triggered by using functional (responsive) poly-mer as a matrix or a blend in copolymer mixture during the membrane formation.Grafting to and from strategies are used to modify the surfaces but also the porewalls of the membrane. As an example, Hester et al. prepared block-copolymers,via ATRP graft copolymerization of PEG methacrylates onto the membrane poly-mer of PVDF. Such polymers are promising additives for surface modification125.However, the functionalization of nanopores is rarely achieved and despite theimpressive ordered porous morphologies based on di- or triblock copolymers, adirect demonstration of the membrane function, that is, permeability measure-ments or even a selective permeation controlled by the nanoporosity of the poly-mer film, is yet to be accomplished126. The use of "supramolecular" templates forthe preparation of materials with controlled pore size had been explored in manyvariations127. Beginn et al. reported the synthesis of supramolecular channelmembranes with pore mimicking biological ion-channels128,129. The approachwas based on the gelation of acrylate monomer solutions which form non-porousblocks and do not shrink upon polymerization-by string-like supramolecular as-semblies of functional gelator molecules, and the subsequent fixation of thesegels by an in-situ polymerization followed by removal of the gelator fibers thusfinally yielding pore channels predetermined by the size and the shape of the tem-plate.
Mechanical stability is also a weak point of polymer membrane but the crosslink-ing of polymer and polymer composite membrane can enhance it. Thin-filmcomposite membranes raise attention even if the preparation of defect-free se-lective membranes with thickness of less than 50 nm seems to be fundamentallydifficult. The attempt to use monolayers of functional amphiphilic molecules(Langmuir-Blodgett (LB) technique) as ultra-thin selective barriers were unsuc-cessful because of their instability and the non reproducibility of defect-free com-posite membrane130,131. The Layer-by-layer (LBL) technique based on assemblyof charged macromolecules in a vertical order with nanometer precision has anadvantage on the lateral one (assembly of small molecules in LB films) becausepossible defects can be healed within few layers132. Responsive and switchablemembranes also provide an interesting tool because they allow a reversible switch-ing of the permeability, by grafting of pH and thermoresponsive polymers such as
39
4 Fundamentals
polyacrylic acid and PNIPAAm133–135. For the function of such responsive mem-branes, the defined anchoring of grafted polymer chains or crosslinked polymersystems into the wall’s pores is very essential, even if it is still challenging.
Finally, it is important to optimize the biocompatibility of the membrane. Themain biomedical applications of the membrane technology are hemodialysis, plas-mapheresis and oxygenation. For the majority of current relevant processes, thebehavior of the membrane in contact with blood is crucial. Minimizing the nonspecific adsorption of proteins is important in order to preserve the performanceof the membrane. Surface modifications have to be performed in order to re-duce it and improve biocompatibility to suppress the pathophysiological defensemechanisms.
Our approach brings an alternative to block copolymer membrane to circumventwettability problems while controlling the pore size and selectivity. Ferritin is usedas a sacrificial template to control the size of the nanopores of the future mem-brane. After grafting P(NIPAAm-DMIAAm) from ferritin molecules, the obtainedbionanoconjugate ferritin-P(NIPAAm-DMIAAm) are used as building blocks togenerate the matrix by assembly on solid substrates. PNIPAAm is well-known forits biocompatibility and thermoresponsive behavior. The polymer matrix can becrosslinked by UV enhancing the mechanical stability. The subsequent denatu-ration of the proteins will create the aqueous pores. This approach allows thecontrol of the nanoporous pore size at about 10 nm and its functionality. The sub-sequent polypeptide chain left in the pore can lead to further modification of thepores for a better selectivity (attachment of responsive polymer) or constructionof a filter.
40
5 Characterization Methods
Horse spleen ferritin (HSF) was first characterized in its native state to learn aboutits properties, establish a standard protocol for each technique and use the re-sults as a reference. The protein was characterized in solution by UV-Vis and alight scattering technique (Dynamic light scattering (DLS) and size exclusion chro-matography (SEC) with online light scattering, ultraviolet (UV) and differentialrefractive index detection), onto substrates by transmission electron microscopy(TEM), scanning electron microscopy (SEM) and atomic force microscopy (AFM).The denaturated state was investigated by matrix-assisted laser desorption ion-ization time-of-flight mass spectrometry (MALDI-ToF MS) and sodium dodecylsulfate-poly(acrylamide) gel electrophoresis (SDS-PAGE) to learn about the sub-unit molecular weight.
5.1 Characterization in Solution
HSF is bought as a concentrated saline solution from Fluka. It has a high tendencyto aggregate, forming dimers, trimers and n-mers. The protein must be purifiedin order to separate those aggregates and collect the monomeric ferritin by sizeexclusion chromatography using only the UV detector (sodium phosphate buffer0.025 M at pH 7, flow of 0.25 mL·min−1). The concentration and the stability ofthe proteins were determined and followed by UV-Vis and DLS.
41
5 Characterization Methods
5.1.1 Light Scattering Technique
5.1.1.1 Dynamic Light Scattering (DLS)
Dynamic light scattering is also known as photon correlation spectroscopy136,137.It is used to determine the size of particles like proteins in the range of 1-1000 nm.Shining a monochromatic light beam, e.g. a laser, onto a solution with sphericalparticles in Brownian motion causes a Doppler shift when the light hits the mov-ing particle, which changes the wavelength of the incoming light. The measure-ment consists on following on the time scale of the molecular fluctuations. Thisscattering effect is related to the size of the particle and allows the description ofthe particle’s motion in the medium by measuring the diffusion coefficient of theparticle and using an autocorrelation function.
The set up is composed of a laser which passes through a collimator lens and hitsthe cell containing the solution. The light is scattered and detected by a photo-multiplier that transform a variation of intensity into a variation of voltage. Thephotomultiplier is usually positioned at a scattering angle of 90 ◦.
According to light scattering theory, when light impinges the matter, the electricfield of the light induces an oscillation polarization of electrons in the molecules.Hence, the molecules provide a secondary source of light and subsequently scat-tered light. The frequency shifts, the angular distribution, the polarization, andthe intensity of the scatter light are determined by the size, the shape and themolecular interactions in the scattering material.
The intensity of the scattered light is dependent of spatial arrangement of the scat-tering canters at any instant in time. The particles (macromolecules) are undergo-ing constant motion due to collisions with solvent molecules. The instantaneousvalue of It i l s fluctuates in time about the average intensity, where the rate at whichthese spontaneous fluctuations decay to the equilibrium value is directly depen-dent upon the dynamics of the molecules. The autocorrelation function C (t ) canbe defined as:
C (t ) = ⟨I (t )I (t +τ)⟩ = limT→∞
1
T
∫ T2
−T2
x(t ′)x(t ′+ t ) ·d t ′ = ⟨x(0)x(t )⟩ (5.1)
42
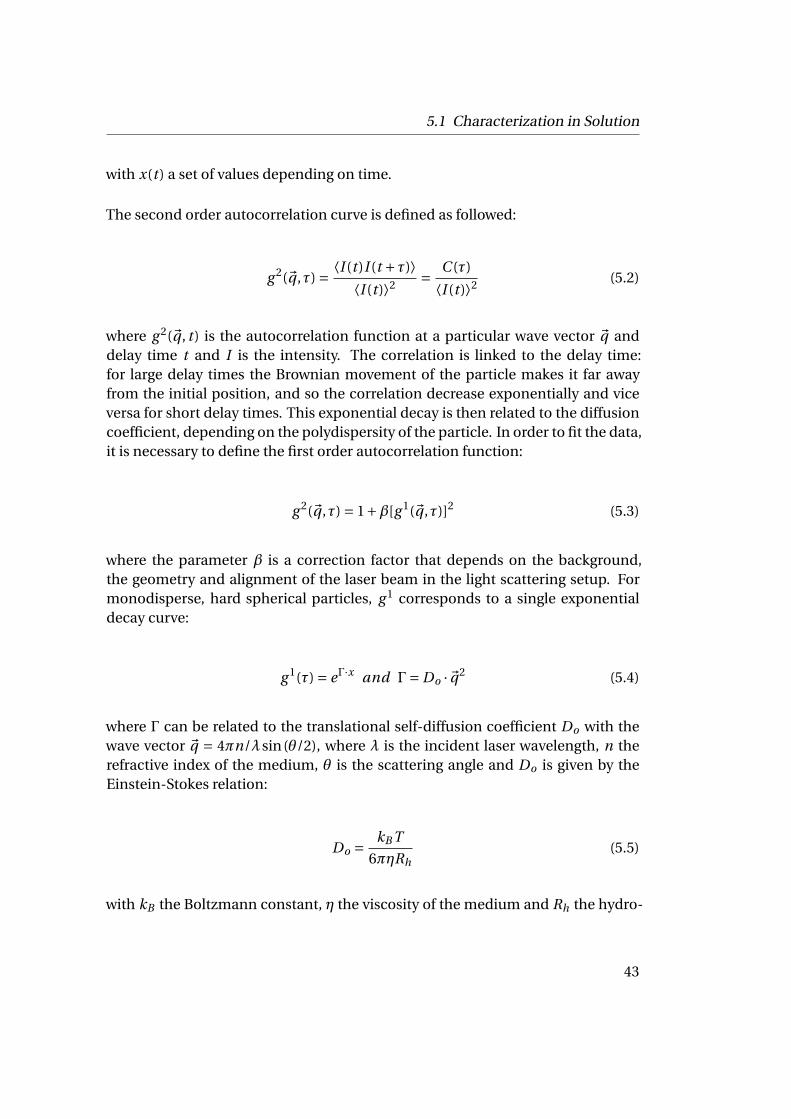
5.1 Characterization in Solution
with x(t ) a set of values depending on time.
The second order autocorrelation curve is defined as followed:
g 2(~q ,τ) = ⟨I (t )I (t +τ)⟩⟨I (t )⟩2 = C (τ)
⟨I (t )⟩2 (5.2)
where g 2(~q , t ) is the autocorrelation function at a particular wave vector ~q anddelay time t and I is the intensity. The correlation is linked to the delay time:for large delay times the Brownian movement of the particle makes it far awayfrom the initial position, and so the correlation decrease exponentially and viceversa for short delay times. This exponential decay is then related to the diffusioncoefficient, depending on the polydispersity of the particle. In order to fit the data,it is necessary to define the first order autocorrelation function:
g 2(~q ,τ) = 1+β[g 1(~q ,τ)]2 (5.3)
where the parameter β is a correction factor that depends on the background,the geometry and alignment of the laser beam in the light scattering setup. Formonodisperse, hard spherical particles, g 1 corresponds to a single exponentialdecay curve:
g 1(τ) = eΓ·x and Γ= Do ·~q2 (5.4)
where Γ can be related to the translational self-diffusion coefficient Do with thewave vector ~q = 4πn/λsin(θ/2), where λ is the incident laser wavelength, n therefractive index of the medium, θ is the scattering angle and Do is given by theEinstein-Stokes relation:
Do = kB T
6πηRh(5.5)
with kB the Boltzmann constant, η the viscosity of the medium and Rh the hydro-
43
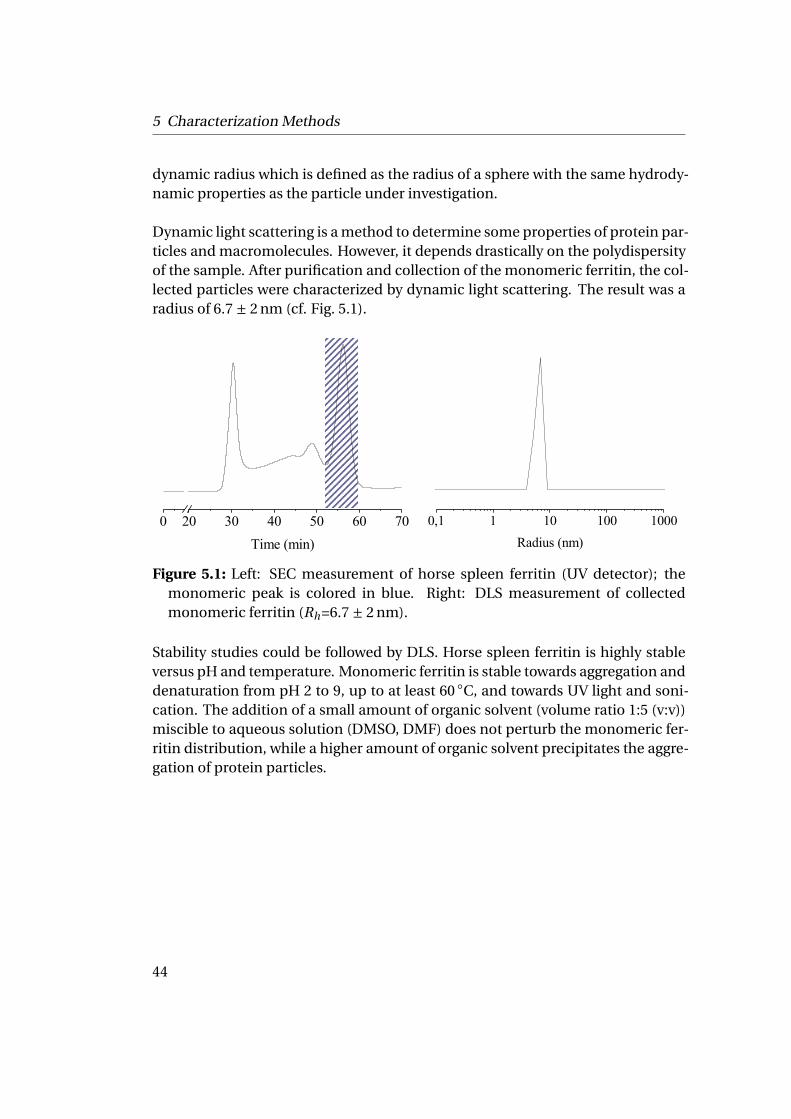
5 Characterization Methods
dynamic radius which is defined as the radius of a sphere with the same hydrody-namic properties as the particle under investigation.
Dynamic light scattering is a method to determine some properties of protein par-ticles and macromolecules. However, it depends drastically on the polydispersityof the sample. After purification and collection of the monomeric ferritin, the col-lected particles were characterized by dynamic light scattering. The result was aradius of 6.7 ± 2 nm (cf. Fig. 5.1).
0 20 30 40 50 60 70Time (min)
0,1 1 10 100 1000Radius (nm)
Figure 5.1: Left: SEC measurement of horse spleen ferritin (UV detector); themonomeric peak is colored in blue. Right: DLS measurement of collectedmonomeric ferritin (Rh=6.7 ± 2 nm).
Stability studies could be followed by DLS. Horse spleen ferritin is highly stableversus pH and temperature. Monomeric ferritin is stable towards aggregation anddenaturation from pH 2 to 9, up to at least 60 ◦C, and towards UV light and soni-cation. The addition of a small amount of organic solvent (volume ratio 1:5 (v:v))miscible to aqueous solution (DMSO, DMF) does not perturb the monomeric fer-ritin distribution, while a higher amount of organic solvent precipitates the aggre-gation of protein particles.
44
5.1 Characterization in Solution
5.1.1.2 Size Exclusion Chromatography with Online Light Scattering,Ultraviolet (UV) and Differential Refractive Index Detection
Size exclusion chromatography (SEC) coupled with online light scattering (LS),refractive index (RI) and ultraviolet (UV) detection provides a non destructivemethod to determine the molecular weights of proteins and their complexes insolution, as well as their sizes138,139. The sample passes through the porous sta-tionary phase in the column which is mostly a gel medium based on polyacry-lamide, dextran or aragose. Particles with different sizes elute through the station-ary phase at different rates. Large molecules cannot enter the pores of the columnand elute faster. Smaller molecules are retained by the pores of the gel and there-fore come later. Very large molecules, which cannot enter any pore but remainin the void volume between the gel particles, elute unresolved at the earliest elu-tion volume, the so-called upper exclusion limit. The properties of the stationaryphase determine the quality of separation, especially at low molecular weight.
The molecular weight Mw depends only on the downstream LS and RI detectorsand is independent of the elution position. The "two detectors" method (LS andRI) can be applied when the dn/dc is known. If this is not the case, the "threedetectors" method is used. For globular proteins a dn/dc value of 0.185 mL·g−1 isnormally used, but it can also be measured with a RI detector in batch mode.
The amount of light collected by the LS detector is proportional to the product ofthe weight average molar mass and the solute concentration LS ≈ Mw c. This rela-tionship is based on Zimm’s formalism of the Rayleigh-Debye-Gans light scatter-ing model for dilute polymer solutions. The relation between the excess scatteredlight and the molecular weight is given by the Equation:
K ∗c
R(θ)= 1
Mw ·P (θ)+2A2c (5.6)
where
• R(θ) is the excess intensity of scattered light at an angle θ (i.e. the excessRayleigh ratio of the solution as a function of θ and concentration of thesample. It is directly proportional to the intensity of the scattered light in
45
5 Characterization Methods
excess of the light scattered by the pure solvent.)
R(θ) = I (θ)r 2
I · f ·V (5.7)
with I the intensity of the incident light, I (θ) total intensity of scattered ra-diation observed at an angle θ an a distance r from the point of scattering,V the scattering volume and f a factor compensating polarization phenom-ena
• c is the sample concentration (g·mL−1)
• Mw is the weight average molecular weight (molar mass g·mol−1)
• A2 is the second virial coefficient (mL·mol·g−2)
• K ∗ is an optical parameter equal to 4π2n2(dn/dc)2/λ4o NA; with n being the
solvent refractive index and dn/dc being the refractive index increment. NA
is Avogrado’s number and λo is the wavelength of the scattered light in vac-uum (cm)
To solve the Equation 5.6, the second virial coefficient term (2A2c) can be ne-glected when 2A2c << 1. This condition is met at the relatively low concentration(0.1 mg· mL−1). The function P (θ) describes the angular dependence of scatteredlight. The expansion of 1/P (θ) to first order gives:
1/P (θ) = 1+ (16π2/3λ2)⟨
r 2g
⟩sin2(θ/2)+ ... (5.8)
The term [(16π2/3λ2)⟨
r 2g
⟩sin2(θ/2)] is neglected for protein with
⟨r 2
g
⟩smaller
than 15 nm (rg as the radius of gyration) which includes proteins and their com-plexes with Mw smaller than 5,000 kDa.
The "two detectors" method is based on the LS and the RI detection. It is neces-sary to introduce KLS , the calibration constant of the LS detector. The measuredintensity of scattered light at a given angle θ:
46
5.1 Characterization in Solution
(LS) = KLS · c ·Mw · (dn/dc)2 (5.9)
Similarly KRI can be introduced, the calibration constant of the RI detector:
(RI ) = KRI · c · (dn/dc) (5.10)
From the Equations 5.9 and 5.10, it results in the relationship:
Mw = (LS)KRI
KLS(RI )·(
dn
dc
)−1
= K ′ (LS)
(RI )(5.11)
with K ′ the instrument calibration constant, determined by analyzation of proteinstandards.
Alternatively, Mw can be determined directly from the absolute light scatteringmeasurements by solving the Rayleigh-Debye-Gans equation (cf. Eq 5.11), by in-dependently calculating the concentration of the eluting protein. The Astra soft-ware (Wyatt Technology Corporation, Santa Barbara, CA) package provides differ-ent fitting methods (including calculation of polynomial fitting): Zimm, Debyeand Berry fitting methods. The Zimm method is applied for mid-sized molecules(20-50 nm) and consists of plotting the curve K ∗c/R(θ) against sin2(θ) and yields
the determination of 1/Mw as the intersection and⟨
r 2g
⟩1/2as the slope at zero
angle. The Debye method consists of plotting the curve R(θ)/K ∗c against sin2(θ)
and yields the determination of Mw as the intersection and⟨
r 2g
⟩1/2as the slope at
zero angle. This method is applied for a wider range of Mw than the Zimm method.The Berry fitting method constructs a plot of the square root of [K ∗c/R(θ)] againstsin2(θ). It is useful for large macromolecules.
The "three detectors" method is used when the dn/dc is not known, introducingthe UV detection to determine the concentration. The extinction coefficient ε isthen needed.
47
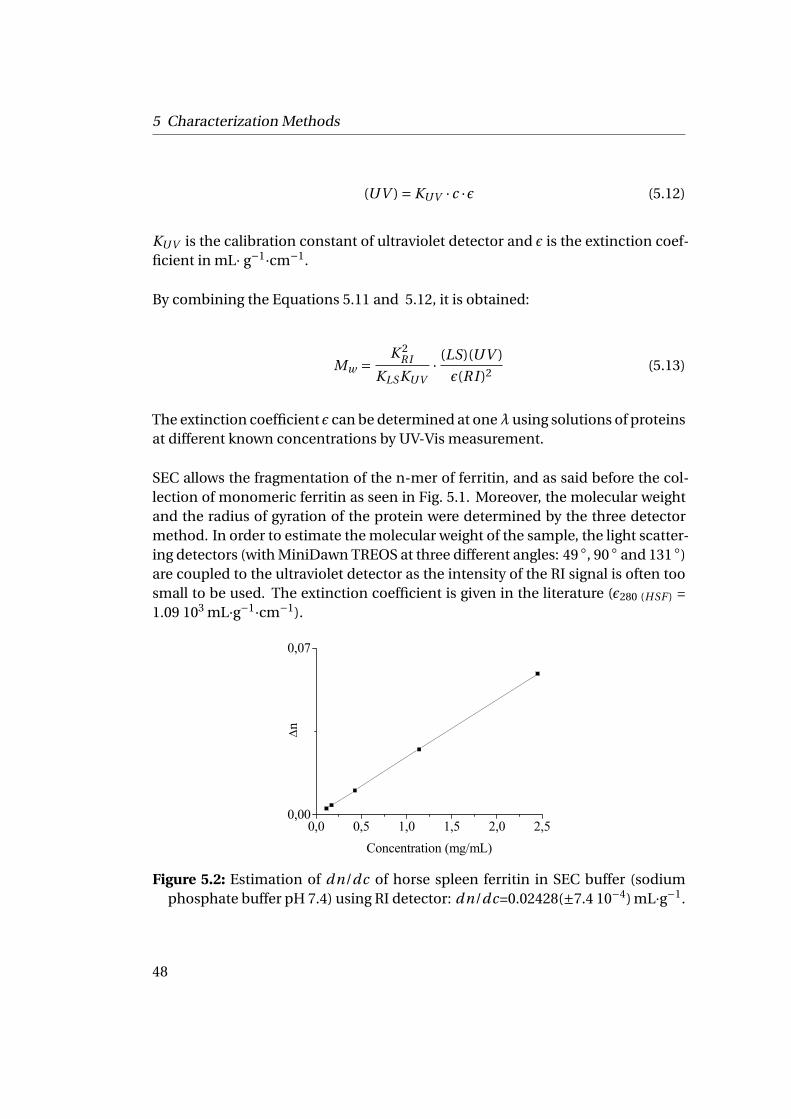
5 Characterization Methods
(UV ) = KUV · c ·ε (5.12)
KUV is the calibration constant of ultraviolet detector and ε is the extinction coef-ficient in mL· g−1·cm−1.
By combining the Equations 5.11 and 5.12, it is obtained:
Mw = K 2RI
KLSKUV· (LS)(UV )
ε(RI )2(5.13)
The extinction coefficient ε can be determined at oneλusing solutions of proteinsat different known concentrations by UV-Vis measurement.
SEC allows the fragmentation of the n-mer of ferritin, and as said before the col-lection of monomeric ferritin as seen in Fig. 5.1. Moreover, the molecular weightand the radius of gyration of the protein were determined by the three detectormethod. In order to estimate the molecular weight of the sample, the light scatter-ing detectors (with MiniDawn TREOS at three different angles: 49 ◦, 90 ◦ and 131 ◦)are coupled to the ultraviolet detector as the intensity of the RI signal is often toosmall to be used. The extinction coefficient is given in the literature (ε280 (HSF ) =1.09 103 mL·g−1·cm−1).
0,0 0,5 1,0 1,5 2,0 2,50,00
0,07
∆n
Concentration (mg/mL)
Figure 5.2: Estimation of dn/dc of horse spleen ferritin in SEC buffer (sodiumphosphate buffer pH 7.4) using RI detector: dn/dc=0.02428(±7.4 10−4) mL·g−1.
48
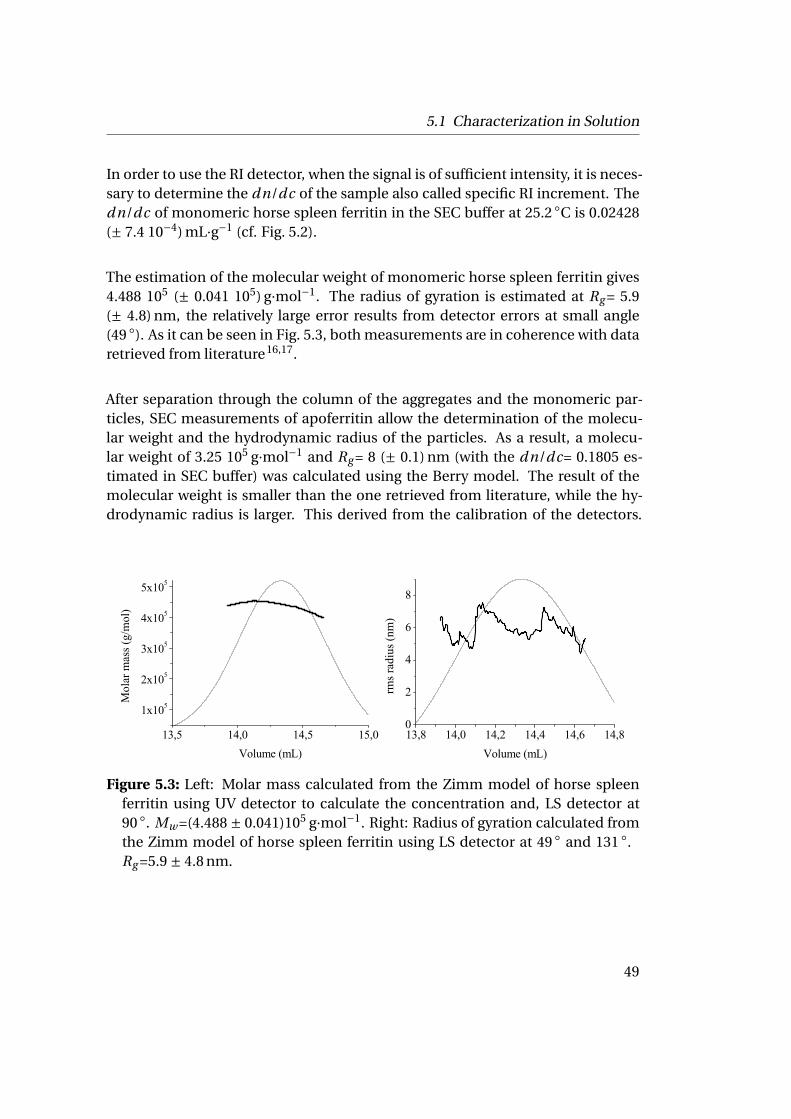
5.1 Characterization in Solution
In order to use the RI detector, when the signal is of sufficient intensity, it is neces-sary to determine the dn/dc of the sample also called specific RI increment. Thedn/dc of monomeric horse spleen ferritin in the SEC buffer at 25.2 ◦C is 0.02428(± 7.4 10−4) mL·g−1 (cf. Fig. 5.2).
The estimation of the molecular weight of monomeric horse spleen ferritin gives4.488 105 (± 0.041 105) g·mol−1. The radius of gyration is estimated at Rg = 5.9(± 4.8) nm, the relatively large error results from detector errors at small angle(49 ◦). As it can be seen in Fig. 5.3, both measurements are in coherence with dataretrieved from literature16,17.
After separation through the column of the aggregates and the monomeric par-ticles, SEC measurements of apoferritin allow the determination of the molecu-lar weight and the hydrodynamic radius of the particles. As a result, a molecu-lar weight of 3.25 105 g·mol−1 and Rg = 8 (± 0.1) nm (with the dn/dc= 0.1805 es-timated in SEC buffer) was calculated using the Berry model. The result of themolecular weight is smaller than the one retrieved from literature, while the hy-drodynamic radius is larger. This derived from the calibration of the detectors.
13,5 14,0 14,5 15,0
1x10⁵
2x10⁵
3x10⁵
4x10⁵
5x10⁵
Mol
ar m
ass (
g/m
ol)
Volume (mL)13,8 14,0 14,2 14,4 14,6 14,80
2
4
6
8
rms r
adiu
s (nm
)
Volume (mL)
Figure 5.3: Left: Molar mass calculated from the Zimm model of horse spleenferritin using UV detector to calculate the concentration and, LS detector at90 ◦. Mw =(4.488 ± 0.041)105 g·mol−1. Right: Radius of gyration calculated fromthe Zimm model of horse spleen ferritin using LS detector at 49 ◦ and 131 ◦.Rg =5.9 ± 4.8 nm.
49
5 Characterization Methods
5.1.2 UV-Vis Spectroscopy
UV-Vis is a molecular spectroscopic method, derived from the Bouguer-Lambert-Beer law, allowing the quantitative evaluation of absorption measurements140.
The Bouguer-Lambert-Beer law forms the basis of light absorption measurementson gases and solutions in the UV-Vis and IR region:
log(Io)
(I )ν= l g
(100
T (%)
)= Aν̃(λ) = εν̃ · c ·d (5.14)
where Aν̃(λ) = log (Io )(I )ν
is the absorbance and Tν̃= IoI ·100 in % is the transmittance,
εν (λ) (in L·mol−1·cm−1) is the molar extinction coefficient depending on the wa-velength. Io is the intensity of the monochromatic light entering the sample andI is the intensity of light emerging from the sample, c is the concentration of thelight-absorbing substance and d is the pathlength of the sample in centimeter.
The Bouguer-Lambert-Beer law is limited by dilution, as εν̃ is no longer constantfor concentrated solutions but depends on the refractive index of the sample. Ac-cording to Eq. 5.14, the application of the Bouguer-Lambeer-Beer law presup-poses a measurement of the relationship between the light intensities Io and I .However, when measuring in quartz cuvettes, part of the light is lost due to reflec-tion at the cuvette surfaces. In order to eliminate this source of error, a referencemeasurement is performed in an empty cuvette with the same path length. Usu-ally, the pure solvent is used as reference, and it should ideally not absorb in thespectral region under investigation.
As plant viruses consist of both nucleic acids (mostly RNA) and proteins, theirabsorption spectra consists of a superposition of the absorbance of both compo-nents: nucleic acid (minimum at 230 nm; maximum at 260 nm) and protein (min-imum at 250 nm; maximum at 280 nm). Nucleic acids absorb much stronger thanprotein. The peak maximum of a virus preparation is therefore typically at 260 nmand shifts to higher wavelengths with higher protein/nucleic acid ratio. The ra-tio A260nm/A280nm of the absorbances at the two wavelengths characterizes theprotein content (empty capsids or capsids with RNA) and is a measure for the pu-rity of the preparation (presence of plant protein contamination). UV-Vis can beapplied to proteins, since some of the aromatic amino acids such as tryptophan,
50
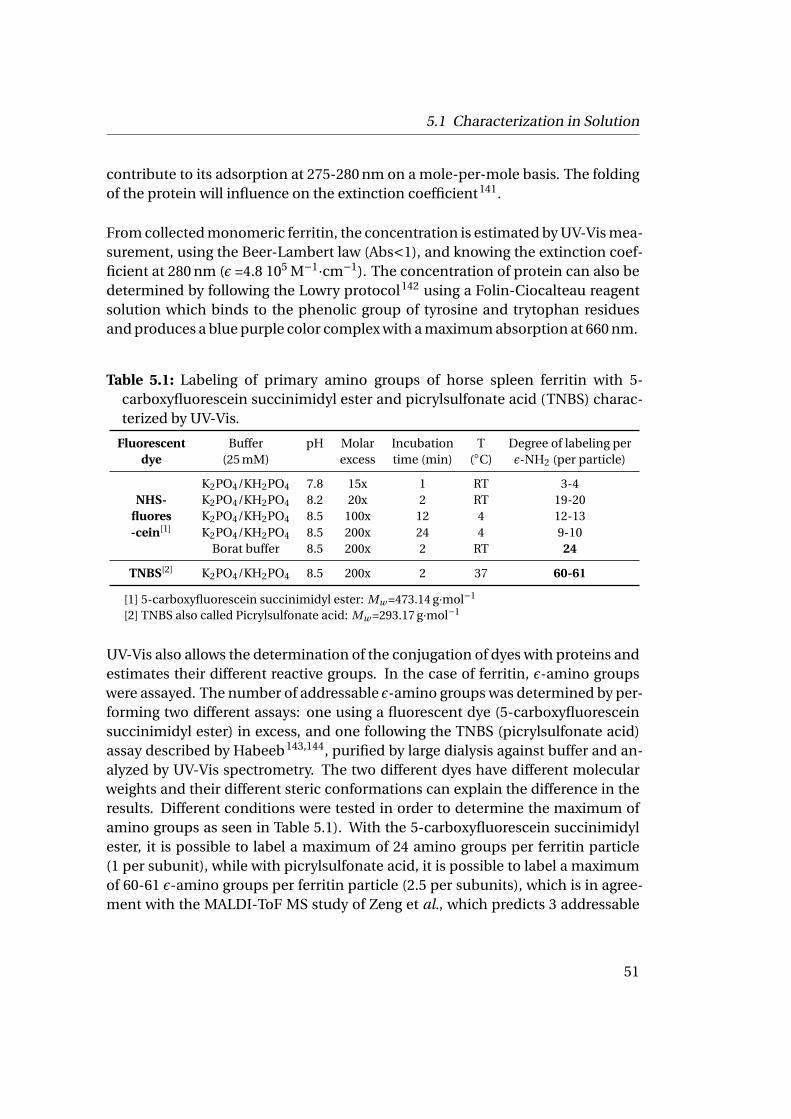
5.1 Characterization in Solution
contribute to its adsorption at 275-280 nm on a mole-per-mole basis. The foldingof the protein will influence on the extinction coefficient141.
From collected monomeric ferritin, the concentration is estimated by UV-Vis mea-surement, using the Beer-Lambert law (Abs<1), and knowing the extinction coef-ficient at 280 nm (ε =4.8 105 M−1·cm−1). The concentration of protein can also bedetermined by following the Lowry protocol142 using a Folin-Ciocalteau reagentsolution which binds to the phenolic group of tyrosine and trytophan residuesand produces a blue purple color complex with a maximum absorption at 660 nm.
Table 5.1: Labeling of primary amino groups of horse spleen ferritin with 5-carboxyfluorescein succinimidyl ester and picrylsulfonate acid (TNBS) charac-terized by UV-Vis.
Fluorescent Buffer pH Molar Incubation T Degree of labeling perdye (25 mM) excess time (min) (◦C) ε-NH2 (per particle)
K2PO4/KH2PO4 7.8 15x 1 RT 3-4NHS- K2PO4/KH2PO4 8.2 20x 2 RT 19-20
fluores K2PO4/KH2PO4 8.5 100x 12 4 12-13-cein[1] K2PO4/KH2PO4 8.5 200x 24 4 9-10
Borat buffer 8.5 200x 2 RT 24
TNBS[2] K2PO4/KH2PO4 8.5 200x 2 37 60-61
[1] 5-carboxyfluorescein succinimidyl ester: Mw =473.14 g·mol−1
[2] TNBS also called Picrylsulfonate acid: Mw =293.17 g·mol−1
UV-Vis also allows the determination of the conjugation of dyes with proteins andestimates their different reactive groups. In the case of ferritin, ε-amino groupswere assayed. The number of addressable ε-amino groups was determined by per-forming two different assays: one using a fluorescent dye (5-carboxyfluoresceinsuccinimidyl ester) in excess, and one following the TNBS (picrylsulfonate acid)assay described by Habeeb143,144, purified by large dialysis against buffer and an-alyzed by UV-Vis spectrometry. The two different dyes have different molecularweights and their different steric conformations can explain the difference in theresults. Different conditions were tested in order to determine the maximum ofamino groups as seen in Table 5.1). With the 5-carboxyfluorescein succinimidylester, it is possible to label a maximum of 24 amino groups per ferritin particle(1 per subunit), while with picrylsulfonate acid, it is possible to label a maximumof 60-61 ε-amino groups per ferritin particle (2.5 per subunits), which is in agree-ment with the MALDI-ToF MS study of Zeng et al., which predicts 3 addressable
51
5 Characterization Methods
ε-amino groups per subunit.
The labeling of primary amino groups of horse spleen ferritin with fluorescentdyes characterized by UV-Vis allows the determination of their number per fer-ritin. With 5-carboxyfluorescein succinimidyl ester, the maximum is at 494 nm.A correction factor CF of 0.3 at 280 nm is used to correct the absorption of fer-ritin. With a maximum at 494 nm, 5-carboxyfluorescein succinimidyl ester extinc-tion coefficient is ε494=7 104 M−1·cm−1. Picrylsulfonate acid (or 2, 4, 6,-trinitro-benzenesulfonate TNBS) has a maximum at 340 nm, the extinction coefficient isε340= 6.5 102 M−1·cm−1. The formula used to calculate the ε-amino groups is :
Moles fluor per mole protein = Amax of the labeled protein ·εprotein
εfluo · (A280 − (Amax ·C F ))(5.15)
5.2 Characterization by Microscopic Techniques
In order to control the ferritin adsorption onto solid substrates, zeta-potentialmeasurements need to determine the isoelectric point of ferritin, as the adsorp-tion is influenced by pH and leads to the adsorption of the particles on the solidsurface. It was investigated with horse spleen ferritin to confirm the literature data33,34. Solutions of different concentrations were prepared at different pH-valuesand the zeta potential was measured. The resulting isoelectric point of horsespleen ferritin is between 3.5 and 4.5, and is in coherence with the literature valueof 4.533,34. The structure of horse spleen ferritin was also investigated by TEM (cf.Fig. 5.5), SEM (cf. Fig. 5.7), and AFM (cf. Fig. 5.9).
5.2.1 Transmission Electron Microscopy (TEM)
The history of electron microscopy is well known and rewarded. In 1986, Ruskaet al. received the Nobel Prize for Physics for their work on electron optics andthe design of the transmission electron microscope. One of the earliest samplesinvestigated were virus suspensions145, and since then, TEM has become an in-dispensable method for the investigation of specimen in biology and soft matterscience146,147.
52
5.2 Characterization by Microscopic Techniques
5.2.1.1 Principle of TEM
The major advantage of using electrons rather than light is the resolution, whichcan be enhanced up to 0.2 nm. The electron beam is generated by thermo-ionicemission of electrons from a thungsten V-shape filament. A strong electric fieldof up to 200 kV, accelerates the electrons to high energies, while electromagneticlenses focus and direct the beam towards the anode. The so-called Wehnelt as-sembly, a metal surrounding the filament, has an additional focusing action onthe beam.
The image is generated by interaction of the electrons with the atoms of the sam-ple. While transmitting the specimen, some electrons are scattered. The inelasti-cally scattered ones are removed by apertures, while the elastically scattered pro-duce the adsorption contrast in the image on the fluorescent screen below thesample. The usual "bright field imaging" mode uses the directly transmitted elec-trons for image recording. The darker areas correspond to denser regions of thespecimen that scatter larger numbers of electrons. The intensities in the final im-age are closely connected to the thickness and the distribution of matter.
Biological samples can be spread as particles directly from aqueous solution oncarbon filmed copper or gold grids, which were previously made hydrophilic bya short glow discharge. Larger entities such as cells must be embedded and cutinto thin sections before deposition on a grid. As typical biological samples donot contain heavy atoms which can provide enough contrast, staining with solu-tions of heavy metal ions is necessary. Usually, uranyl acetate, tungsten or leadsolutions are used. The salt penetrates all accessible volumes and forms an amor-phous structure around the viruses. As a consequence, the sample appears brightagainst the background covered with salt (negative staining)148.
Ferritin has the unique property of having an iron core which makes it visible forTEM. The surrounding polypeptide shell however can not be imaged that simply,here it is necessary to apply a negative staining.
53
5 Characterization Methods
5.2.1.2 Cryo-TEM
The chemical reactions of the staining process and the drying of the sample candamage the structure of the specimen. To avoid preparative artifacts, the samplecan be flash-frozen, physically preserving the structure of the specimen, and mea-sured by Cryo-TEM149,150.
Biological solutions are usually aqueous. Water has, when in the solid state, a crys-talline (hexagonal or cubic) structure, called ice. Ice crystals are harmful for themicrostructure of specimen; they can damage tissue or capsid of viruses by per-foration. To avoid this problem, the specimen must be frozen sufficiently quickto preserve the water in a vitreous glass-like state, the cooling rate for vitrificationof water being about 100,000 K·s−1. Vitrification is a process of converting the sur-face area-to-volume ratio of the specimen to the maximum by using thin film. Aproper cryogen is required for successful vitrification. It has to be at a low temper-ature far above its boiling point, to avoid the formation of a gas film around thespecimen during the immersion. It should also have enough thermal conductiv-ity. Liquid nitrogen is a poor cryogen because of the narrow temperature betweenits freezing and boiling points. Liquid ethane or propane are good cryogens. Thecrust of ice that can be formed during the transfer would be sublimated once in-side the microscope.
The electron beam cannot be produced in a gas-filled environment. Even if it waspossible, the electron beam could not be stable because ionized gas moleculeswould create a random discharge. It would also burn out the filament if reactivegases, as oxygen, would interact with the heated electron emitter. Moreover, thetransmission into the column would be hindered by the presence of too manygas molecules. Vacuum should be strong enough to prevent the collision betweenelectrons and gas molecules. A typical vacuum in an electron microscope is about10−4 Pa.
Thin vitrified films are produced directly onto grids coated with a lacey carbonfilm. The cryogen, liquid ethane, has to be first cooled enough in its small metalvessel by the surrounding liquid nitrogen reaching -130 ◦C. A pair of tweezersabove the vessel of liquid ethane holds the grid. A droplet of the aqueous bio-logical solution, about 2-5µL is placed onto the grid to form a thin film of about200 nm. Then, after blotting for 1-2 s with a filter paper, it is directly plunged intothe cryogen. The blotting time depends on the viscosity of the sample and has
54
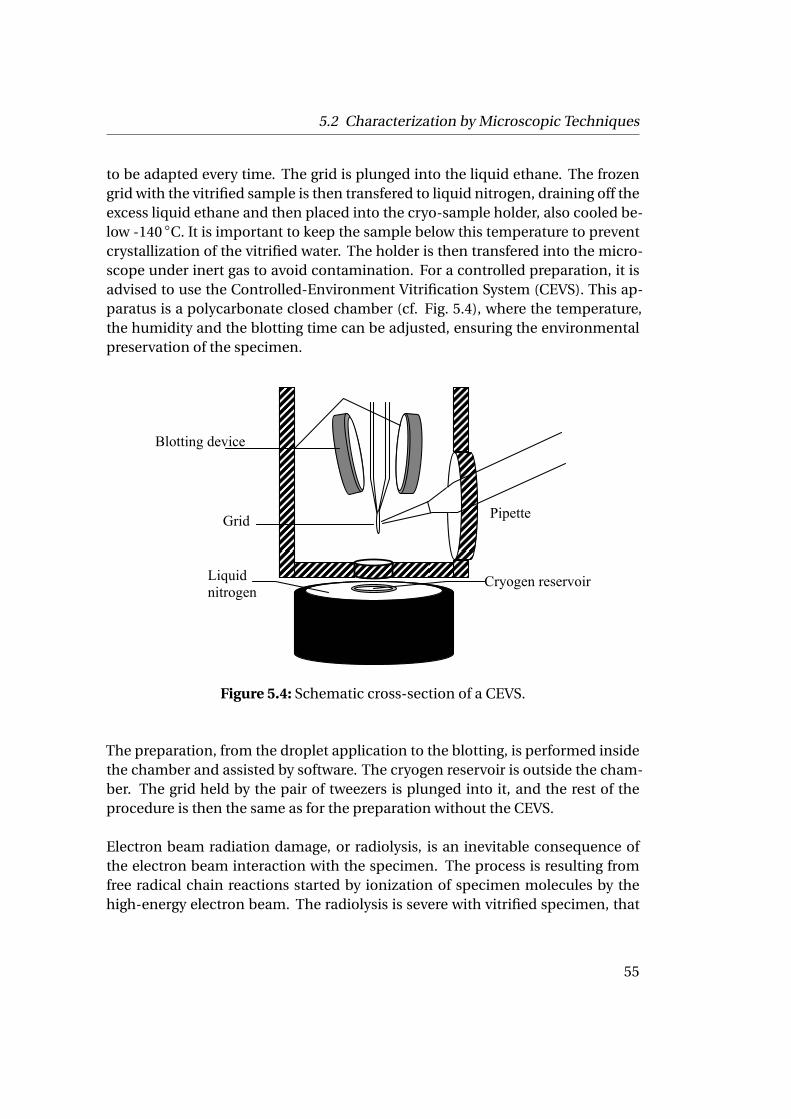
5.2 Characterization by Microscopic Techniques
to be adapted every time. The grid is plunged into the liquid ethane. The frozengrid with the vitrified sample is then transfered to liquid nitrogen, draining off theexcess liquid ethane and then placed into the cryo-sample holder, also cooled be-low -140 ◦C. It is important to keep the sample below this temperature to preventcrystallization of the vitrified water. The holder is then transfered into the micro-scope under inert gas to avoid contamination. For a controlled preparation, it isadvised to use the Controlled-Environment Vitrification System (CEVS). This ap-paratus is a polycarbonate closed chamber (cf. Fig. 5.4), where the temperature,the humidity and the blotting time can be adjusted, ensuring the environmentalpreservation of the specimen.
Blotting device
Grid Pipette
Cryogen reservoir Liquid nitrogen
Figure 5.4: Schematic cross-section of a CEVS.
The preparation, from the droplet application to the blotting, is performed insidethe chamber and assisted by software. The cryogen reservoir is outside the cham-ber. The grid held by the pair of tweezers is plunged into it, and the rest of theprocedure is then the same as for the preparation without the CEVS.
Electron beam radiation damage, or radiolysis, is an inevitable consequence ofthe electron beam interaction with the specimen. The process is resulting fromfree radical chain reactions started by ionization of specimen molecules by thehigh-energy electron beam. The radiolysis is severe with vitrified specimen, that
55
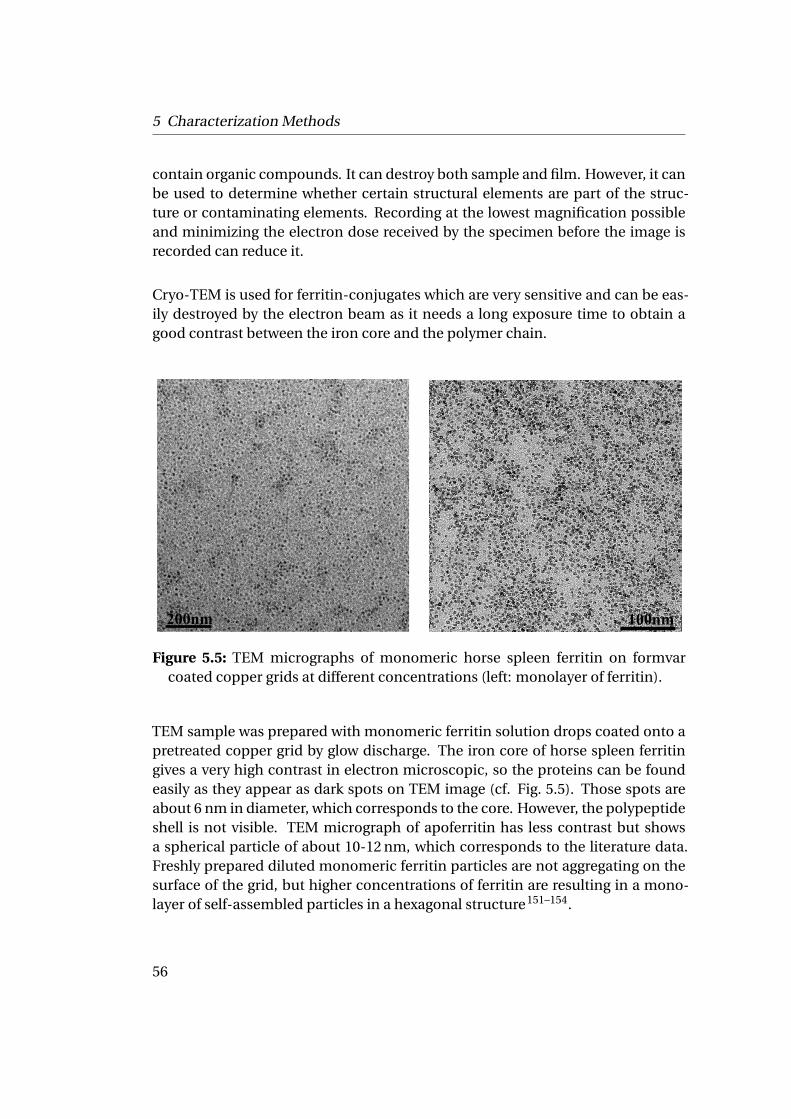
5 Characterization Methods
contain organic compounds. It can destroy both sample and film. However, it canbe used to determine whether certain structural elements are part of the struc-ture or contaminating elements. Recording at the lowest magnification possibleand minimizing the electron dose received by the specimen before the image isrecorded can reduce it.
Cryo-TEM is used for ferritin-conjugates which are very sensitive and can be eas-ily destroyed by the electron beam as it needs a long exposure time to obtain agood contrast between the iron core and the polymer chain.
200nm 100nm
Figure 5.5: TEM micrographs of monomeric horse spleen ferritin on formvarcoated copper grids at different concentrations (left: monolayer of ferritin).
TEM sample was prepared with monomeric ferritin solution drops coated onto apretreated copper grid by glow discharge. The iron core of horse spleen ferritingives a very high contrast in electron microscopic, so the proteins can be foundeasily as they appear as dark spots on TEM image (cf. Fig. 5.5). Those spots areabout 6 nm in diameter, which corresponds to the core. However, the polypeptideshell is not visible. TEM micrograph of apoferritin has less contrast but showsa spherical particle of about 10-12 nm, which corresponds to the literature data.Freshly prepared diluted monomeric ferritin particles are not aggregating on thesurface of the grid, but higher concentrations of ferritin are resulting in a mono-layer of self-assembled particles in a hexagonal structure151–154.
56
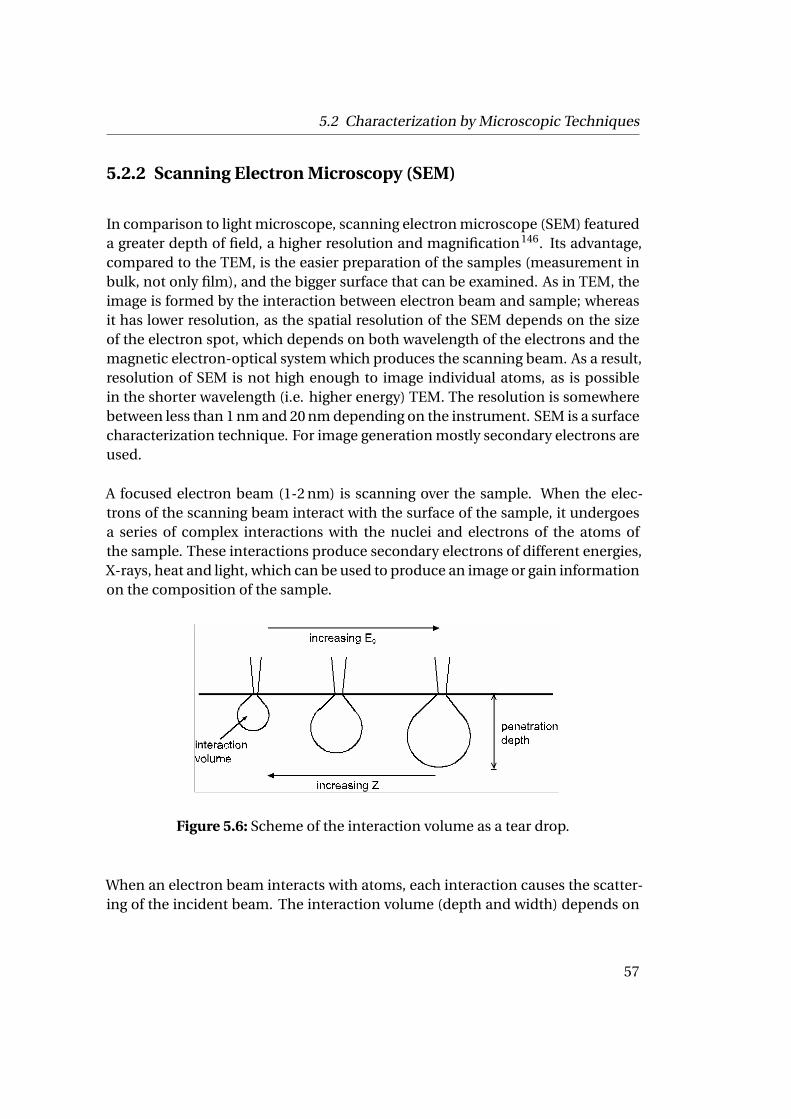
5.2 Characterization by Microscopic Techniques
5.2.2 Scanning Electron Microscopy (SEM)
In comparison to light microscope, scanning electron microscope (SEM) featureda greater depth of field, a higher resolution and magnification146. Its advantage,compared to the TEM, is the easier preparation of the samples (measurement inbulk, not only film), and the bigger surface that can be examined. As in TEM, theimage is formed by the interaction between electron beam and sample; whereasit has lower resolution, as the spatial resolution of the SEM depends on the sizeof the electron spot, which depends on both wavelength of the electrons and themagnetic electron-optical system which produces the scanning beam. As a result,resolution of SEM is not high enough to image individual atoms, as is possiblein the shorter wavelength (i.e. higher energy) TEM. The resolution is somewherebetween less than 1 nm and 20 nm depending on the instrument. SEM is a surfacecharacterization technique. For image generation mostly secondary electrons areused.
A focused electron beam (1-2 nm) is scanning over the sample. When the elec-trons of the scanning beam interact with the surface of the sample, it undergoesa series of complex interactions with the nuclei and electrons of the atoms ofthe sample. These interactions produce secondary electrons of different energies,X-rays, heat and light, which can be used to produce an image or gain informationon the composition of the sample.
Figure 5.6: Scheme of the interaction volume as a tear drop.
When an electron beam interacts with atoms, each interaction causes the scatter-ing of the incident beam. The interaction volume (depth and width) depends on
57
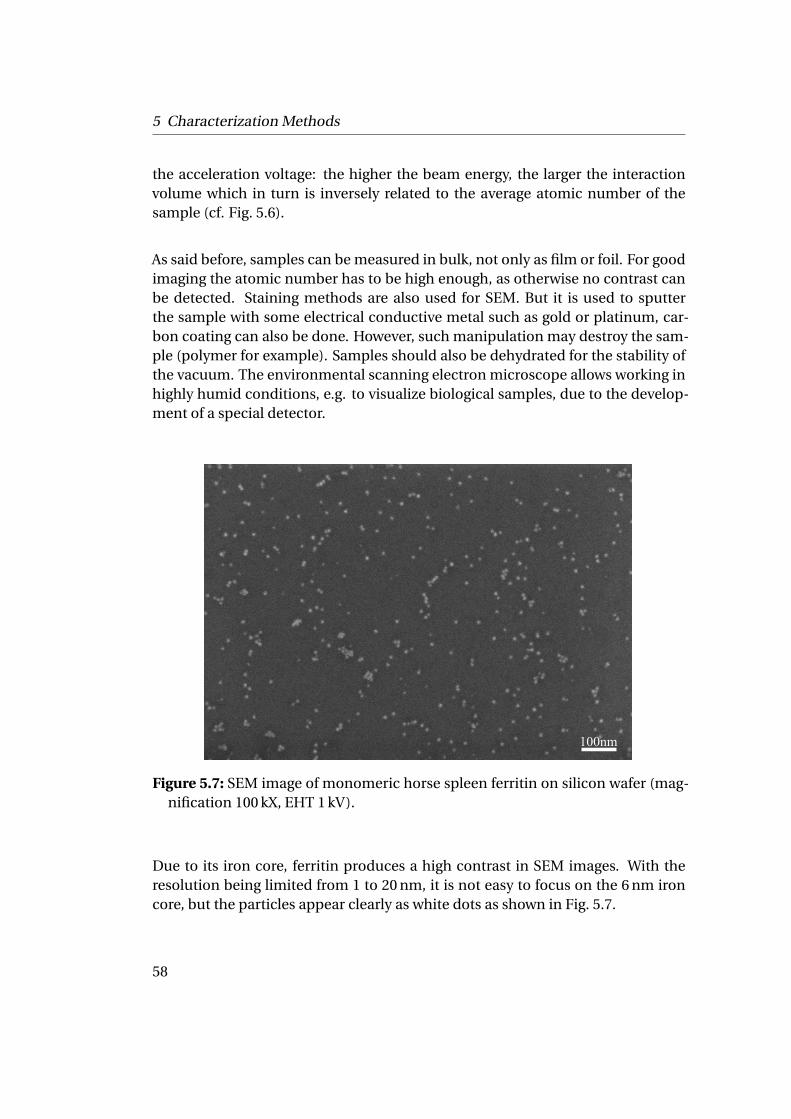
5 Characterization Methods
the acceleration voltage: the higher the beam energy, the larger the interactionvolume which in turn is inversely related to the average atomic number of thesample (cf. Fig. 5.6).
As said before, samples can be measured in bulk, not only as film or foil. For goodimaging the atomic number has to be high enough, as otherwise no contrast canbe detected. Staining methods are also used for SEM. But it is used to sputterthe sample with some electrical conductive metal such as gold or platinum, car-bon coating can also be done. However, such manipulation may destroy the sam-ple (polymer for example). Samples should also be dehydrated for the stability ofthe vacuum. The environmental scanning electron microscope allows working inhighly humid conditions, e.g. to visualize biological samples, due to the develop-ment of a special detector.
100nm
Figure 5.7: SEM image of monomeric horse spleen ferritin on silicon wafer (mag-nification 100 kX, EHT 1 kV).
Due to its iron core, ferritin produces a high contrast in SEM images. With theresolution being limited from 1 to 20 nm, it is not easy to focus on the 6 nm ironcore, but the particles appear clearly as white dots as shown in Fig. 5.7.
58
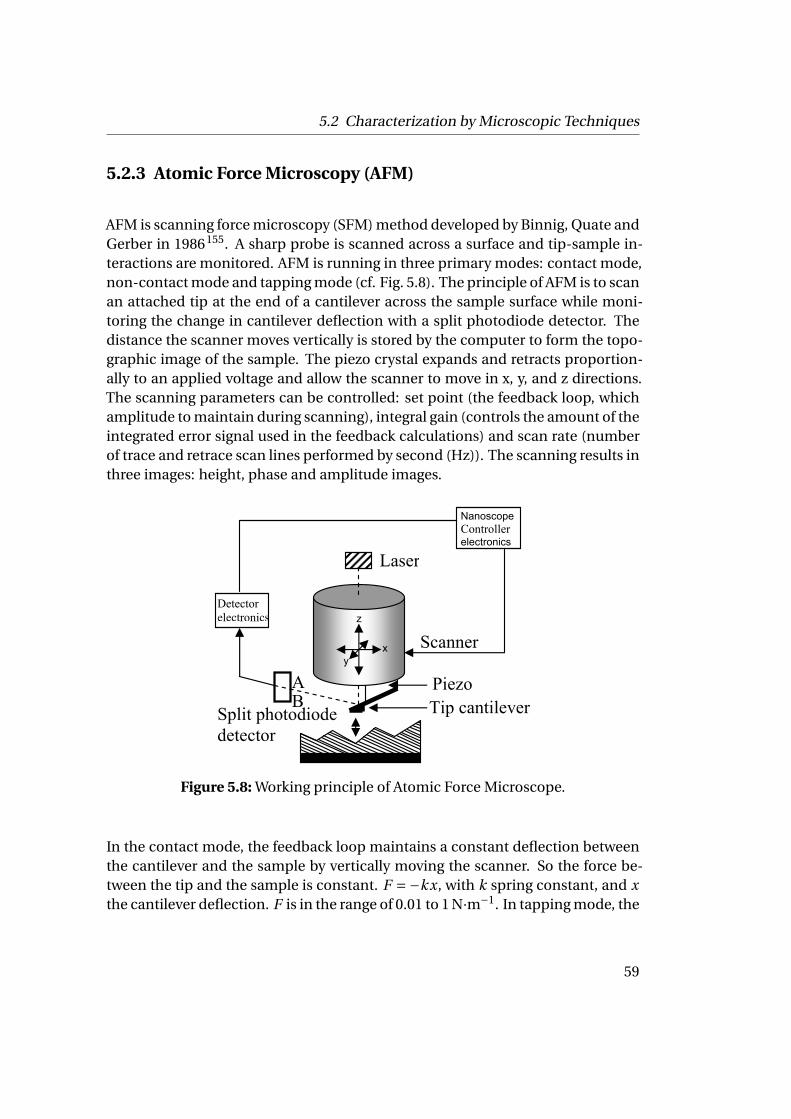
5.2 Characterization by Microscopic Techniques
5.2.3 Atomic Force Microscopy (AFM)
AFM is scanning force microscopy (SFM) method developed by Binnig, Quate andGerber in 1986155. A sharp probe is scanned across a surface and tip-sample in-teractions are monitored. AFM is running in three primary modes: contact mode,non-contact mode and tapping mode (cf. Fig. 5.8). The principle of AFM is to scanan attached tip at the end of a cantilever across the sample surface while moni-toring the change in cantilever deflection with a split photodiode detector. Thedistance the scanner moves vertically is stored by the computer to form the topo-graphic image of the sample. The piezo crystal expands and retracts proportion-ally to an applied voltage and allow the scanner to move in x, y, and z directions.The scanning parameters can be controlled: set point (the feedback loop, whichamplitude to maintain during scanning), integral gain (controls the amount of theintegrated error signal used in the feedback calculations) and scan rate (numberof trace and retrace scan lines performed by second (Hz)). The scanning results inthree images: height, phase and amplitude images.
z
x y
Nanoscope Controller electronics
Laser
Detector electronics
Split photodiode detector
Piezo Tip cantilever
Scanner
A B
Figure 5.8: Working principle of Atomic Force Microscope.
In the contact mode, the feedback loop maintains a constant deflection betweenthe cantilever and the sample by vertically moving the scanner. So the force be-tween the tip and the sample is constant. F =−kx, with k spring constant, and xthe cantilever deflection. F is in the range of 0.01 to 1 N·m−1. In tapping mode, the
59
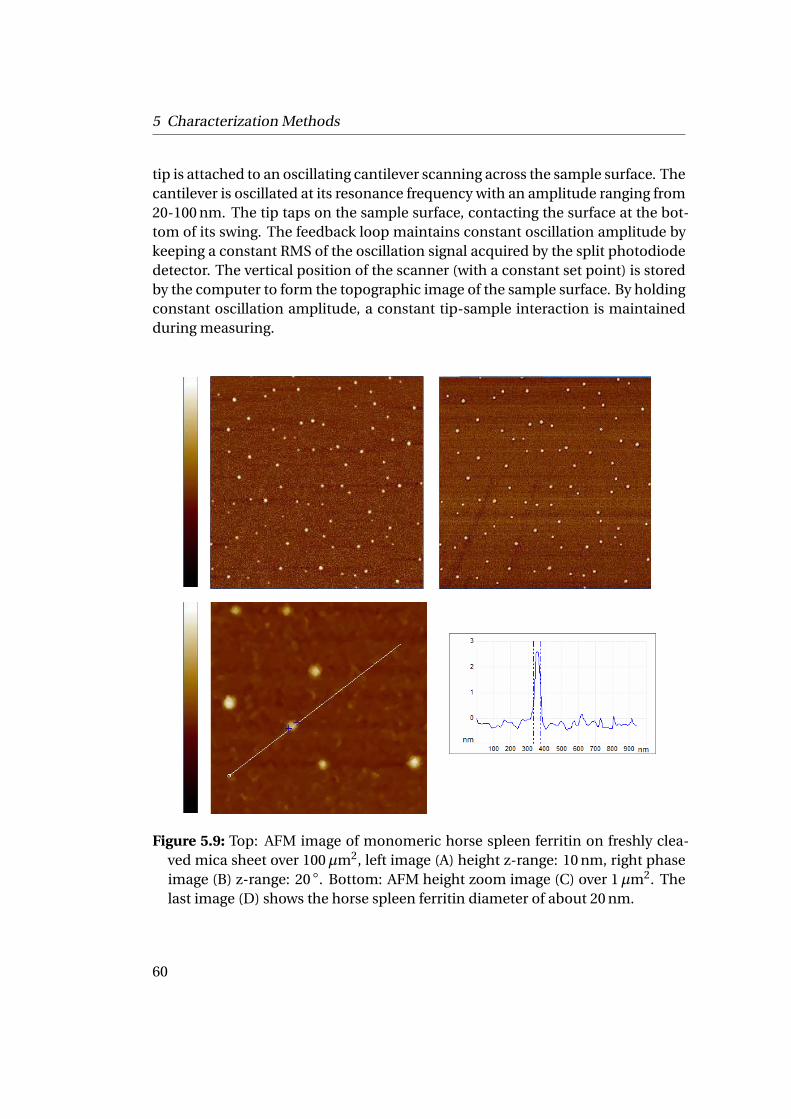
5 Characterization Methods
tip is attached to an oscillating cantilever scanning across the sample surface. Thecantilever is oscillated at its resonance frequency with an amplitude ranging from20-100 nm. The tip taps on the sample surface, contacting the surface at the bot-tom of its swing. The feedback loop maintains constant oscillation amplitude bykeeping a constant RMS of the oscillation signal acquired by the split photodiodedetector. The vertical position of the scanner (with a constant set point) is storedby the computer to form the topographic image of the sample surface. By holdingconstant oscillation amplitude, a constant tip-sample interaction is maintainedduring measuring.
Figure 5.9: Top: AFM image of monomeric horse spleen ferritin on freshly clea-ved mica sheet over 100µm2, left image (A) height z-range: 10 nm, right phaseimage (B) z-range: 20 ◦. Bottom: AFM height zoom image (C) over 1µm2. Thelast image (D) shows the horse spleen ferritin diameter of about 20 nm.
60
5.3 Characterization in Denaturated State by MALDI-ToF MS & SDS-PAGE
In the non constant mode, the feedback loop maintains a constant oscillation am-plitude or frequency by vertically moving the scanner until "setpoint" amplitudeor frequency is reached. The cantilever is oscillated at a frequency which is abovethe cantilever’s resonance with amplitude of a few nanometers to obtain an AC sig-nal from the cantilever. The tip does not contact the sample surface, but oscillatesabove the absorbed fluid layer on the surface during scanning. The cantilever’sresonance frequency is decreased by Van der Waals forces which extend from 1 to10 nm above the absorbed fluid layer.
The protein solution was spincoated onto a freshly cleaved mica sheet, washedwith water to dissolve the top-layer of salt. On the AFM phase picture, HSF par-ticles are homogeneously distributed as seen in Fig. 5.9. The iron core of ferritinallows a high contrast, while on the height phase, particles about 20-25 nm are ho-mogeneously spread. Protein particles are enlarged on the AFM image becausethe tip is flattening the proteins due to their soft nanoparticle character.
5.3 Characterization in Denaturated State byMALDI-ToF MS & SDS-PAGE
Ferritin containing a high percentage of L chains, as it is the case for horse spleenferritin, is more stable towards denaturation than other proteins. Indeed everyattempt to denaturate horse spleen ferritin, avoiding high temperature, failed sofar. Horse spleen ferritin is stable over 24 hours under UV-light, under sonica-tion. When dissolved into different solvents (methanol, acetone) the particles ag-gregate but are not denaturated. When mixed with 2-mercaptoethanol (a disul-fide bonds reducer), and chaotropic agents such as guanidine hydrochloride andurea, the protein does not defold neither. The method leading to the denaturationof the quaternary structure of horse spleen ferritin is to combine urea (7 M) and2-mercaptoethanol or dithiothreitol (10 mM). A further enzymatic digestion withtrypsin, chymotrypsin or V8 protease allows cleaving the subunit into smaller pep-tides22,156,157. Trypsin is a serine protease found in the digestive system, where itbreaks down proteins. It predominantly cleaves peptide chains at the carboxyl siteof the amino acids lysine and arginine. Chymotrypsin preferentially cleaves pep-tide chains at the carboxyl site of the amino acids phenylalanine, tyrosine, trypto-phan and methionine, V8 protease cleaves aspartic and glutamic acid. 100µL of
61
5 Characterization Methods
concentrated horse spleen ferritin or apoferritin was added to a 300µL solutionof urea at 7 M and 10µL of 2-mercaptoethanol. The digestion was achieved byadding 5 mg of trypsin to the solution, then incubated for 12 hours at 37 ◦C. Thedenaturated HSF was characterized by MALDI-ToF MS and SDS-PAGE.
5.3.1 Matrix-Assisted Laser Desorption Ionization-Time of FlightMass Spectrometry (MALDI-ToF MS)
MALDI-ToF mass spectrometry was especially developed for the analysis of largepolymers and proteins. It is a mass spectrometry method which is an analyti-cal technique to measure the mass-to-charge ratio of ions158. MALDI-ToF is asoft ionization technique which allows for the sensitive detection of large, nonvolatile and labile molecules such as biomolecules (proteins, peptides and sugars)and macromolecules (polymers and dendrimers) which are more fragile and frag-mented than when they are ionized by more conventional methods. Moleculesare vaporized, in the MALDI-ToF process, within a volatile light-absorbing matrix,composed mostly of small organic molecules, with the energy-input of a laser. Ide-ally, the analyte in the gas phase has acquired one or only few charges, and is thenaccelerated with an electrical field of known strength and thus the flight time ismeasured. Thus, molecules with the same mass to charge-ratio will be simultane-ously detected.
A mass spectrometer consists of three parts: an ion source, a mass analyzer anda detector. In the ion source, ions are produced by evaporation of the analyte,which was applied in a mixture with the matrix onto a steel target with the aid of alaser. Ideally, the sample is surrounded by the matrix, which forms a crystal lattice.Matrices have to be chosen according to the sample. To make ion formation eas-ier, alkaline salts are added to the matrix/sample mixture or acidic solutions areused. In most cases, the analyte molecules pick up a proton and turns into a posi-tively charged gas phase. Multiple peaks arise because an analyte can be multiplycharged (mass appears to be lower) or if it forms complexes but picks less thanone charge per molecule (masses appear to be larger). Usually the structures ofproteins stay intact and the proteins are charged after interaction with the laser.
The mass analyzer is separating ions with different mass-to-charge ratios. Thenthe numbers of different ions are detected by the detector. In the time of flight-
62
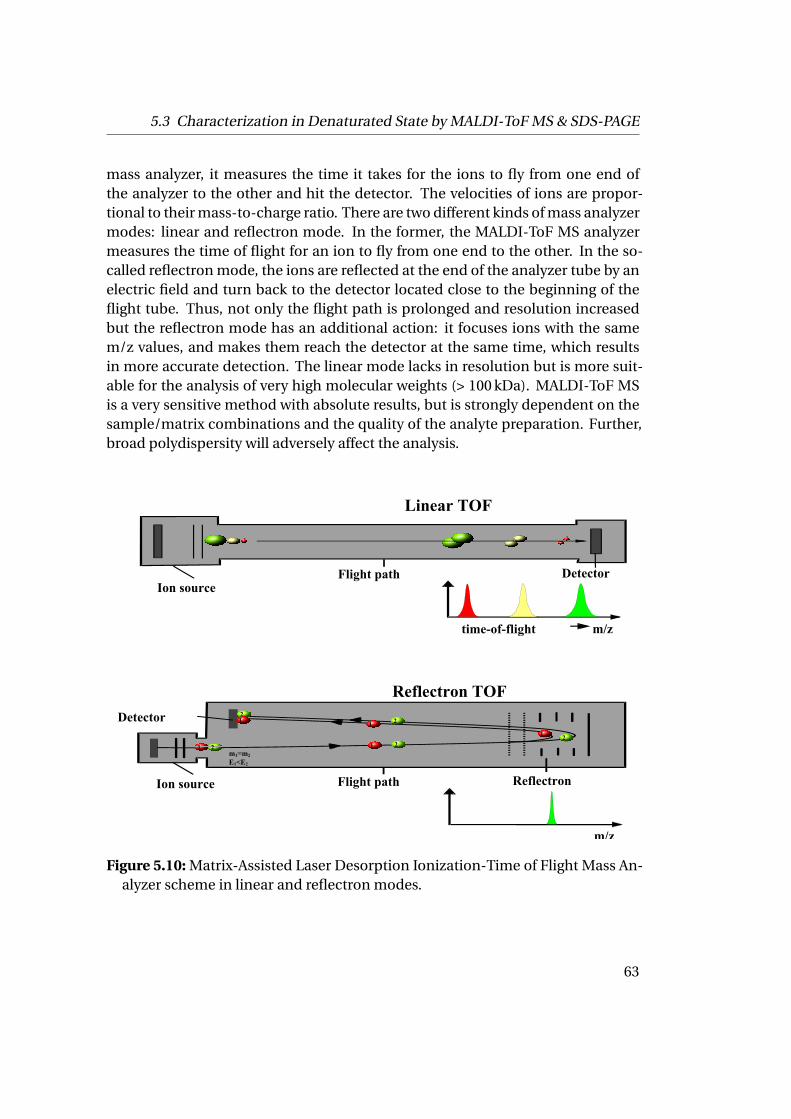
5.3 Characterization in Denaturated State by MALDI-ToF MS & SDS-PAGE
mass analyzer, it measures the time it takes for the ions to fly from one end ofthe analyzer to the other and hit the detector. The velocities of ions are propor-tional to their mass-to-charge ratio. There are two different kinds of mass analyzermodes: linear and reflectron mode. In the former, the MALDI-ToF MS analyzermeasures the time of flight for an ion to fly from one end to the other. In the so-called reflectron mode, the ions are reflected at the end of the analyzer tube by anelectric field and turn back to the detector located close to the beginning of theflight tube. Thus, not only the flight path is prolonged and resolution increasedbut the reflectron mode has an additional action: it focuses ions with the samem/z values, and makes them reach the detector at the same time, which resultsin more accurate detection. The linear mode lacks in resolution but is more suit-able for the analysis of very high molecular weights (> 100 kDa). MALDI-ToF MSis a very sensitive method with absolute results, but is strongly dependent on thesample/matrix combinations and the quality of the analyte preparation. Further,broad polydispersity will adversely affect the analysis.
1 2 2
2
2
2
1
1 11
Detector
Detector
Reflectron
Linear TOF
Reflectron TOF
Flight path Ion source
Flight path Ion source
time-of-flight m/z
m/z
m1=m2
E1<E2
Figure 5.10: Matrix-Assisted Laser Desorption Ionization-Time of Flight Mass An-alyzer scheme in linear and reflectron modes.
63
5 Characterization Methods
5.3.2 Sodium Dodecyl Sulfate PolyAcrylamide GelElectrophoresis (SDS-PAGE)
In electrophoresis, the migration of charged biomolecules in a matrix within anapplied electric field is used as separating principle, based on the size of the ana-lyte (principle of gel filtration) as well as the electrophoretic mobilities. As there isno solvent space in the gel beads, as analogously in between the gel beads of gelchromatography, the separation of proteins occurs reverse i.e. the movement oflarge molecules is impeded relatively to the small ones. SDS-PAGE is a high res-olution technique159,160 for the separation of proteins using their electrophoreticmobility. The SDS-PAGE of protein chains having identical charge-to-mass ratiosresults in fractionation by size. It is able to separate up to 100 components pergel.
The technique is a powerful and convenient method to separate complex andlarge mixtures of proteins of 1000 up to 200,000 Da. However, the determinationof molecular weights is usually performed by comparison with a protein standardmixture. A prerequisite to achieve high resolution is to reduce disulfide bonds byaddition of reducing agents (such as dithiothreitol, or 2-mercaptoethanol) and tocleave protein complexes completely into their polypeptide chains by preparationwith urea and SDS. The latter is an anionic detergent which denatures secondaryand non-disulfide-linked tertiary structures, and applies a negative charge to eachprotein in proportion to its mass. It allows to obtain approximately uniform mass-to-charge ratio for most proteins, so that the distance of migration through thegel can be assumed to be directly related to only the size of the protein. A trackingdye (bromophenol) may be added to the protein solution to allow tracking of theprogress of the protein solution through the gel during the electrophoretic run.
A polyacrylamide gel is used as it is chemically inert and easy to crosslink into gelwith different pore sizes and can withstand high voltage. A stacking gel with largepores polyacrylamide gel of 4 % is cast on the top of the resolving gel. The proteinsare then stacked at the same height starting zone. The resolving gel can be ofuniform pore size or have a gradient crosslinking density and is chosen accordingto the range of the interesting molecular weights.
The gel is then placed into an appropriate running buffer, and an electric cur-rent is applied across the gel, causing the negatively-charged proteins to migrateacross the gel towards the anode. Depending on their size, each protein will move
64
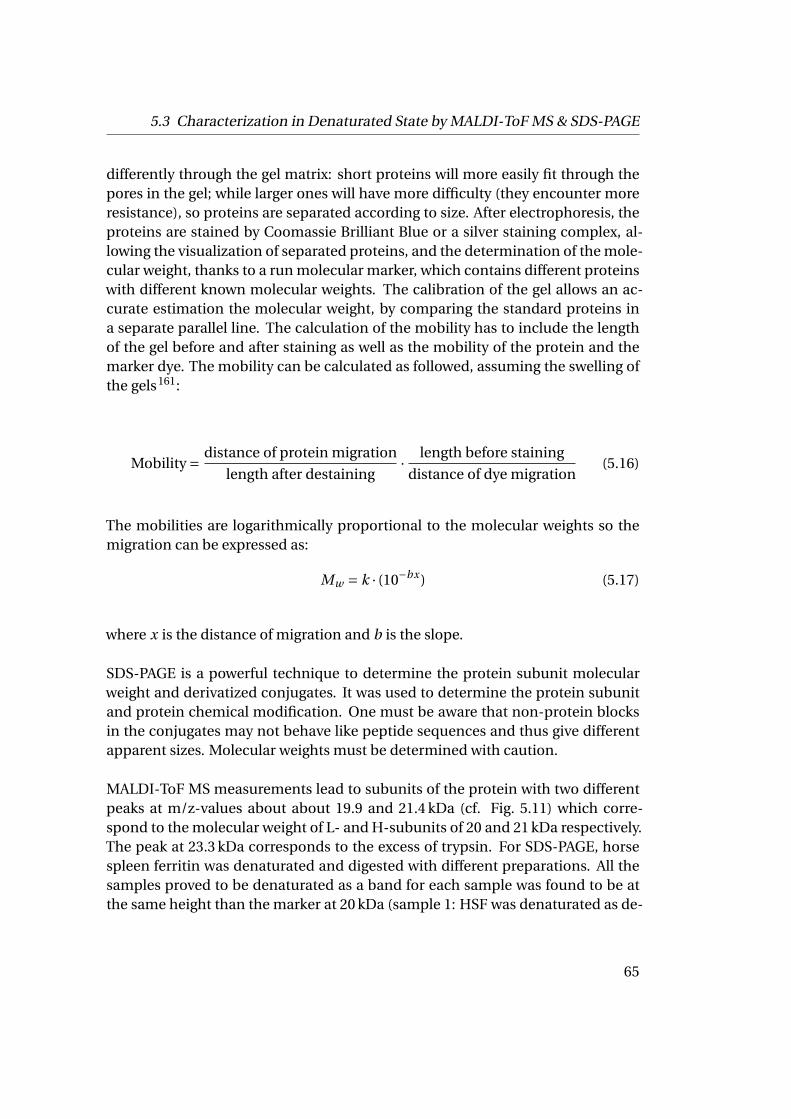
5.3 Characterization in Denaturated State by MALDI-ToF MS & SDS-PAGE
differently through the gel matrix: short proteins will more easily fit through thepores in the gel; while larger ones will have more difficulty (they encounter moreresistance), so proteins are separated according to size. After electrophoresis, theproteins are stained by Coomassie Brilliant Blue or a silver staining complex, al-lowing the visualization of separated proteins, and the determination of the mole-cular weight, thanks to a run molecular marker, which contains different proteinswith different known molecular weights. The calibration of the gel allows an ac-curate estimation the molecular weight, by comparing the standard proteins ina separate parallel line. The calculation of the mobility has to include the lengthof the gel before and after staining as well as the mobility of the protein and themarker dye. The mobility can be calculated as followed, assuming the swelling ofthe gels161:
Mobility = distance of protein migration
length after destaining· length before staining
distance of dye migration(5.16)
The mobilities are logarithmically proportional to the molecular weights so themigration can be expressed as:
Mw = k · (10−bx) (5.17)
where x is the distance of migration and b is the slope.
SDS-PAGE is a powerful technique to determine the protein subunit molecularweight and derivatized conjugates. It was used to determine the protein subunitand protein chemical modification. One must be aware that non-protein blocksin the conjugates may not behave like peptide sequences and thus give differentapparent sizes. Molecular weights must be determined with caution.
MALDI-ToF MS measurements lead to subunits of the protein with two differentpeaks at m/z-values about about 19.9 and 21.4 kDa (cf. Fig. 5.11) which corre-spond to the molecular weight of L- and H-subunits of 20 and 21 kDa respectively.The peak at 23.3 kDa corresponds to the excess of trypsin. For SDS-PAGE, horsespleen ferritin was denaturated and digested with different preparations. All thesamples proved to be denaturated as a band for each sample was found to be atthe same height than the marker at 20 kDa (sample 1: HSF was denaturated as de-
65
5 Characterization Methods
15000 20000 25000 30000 Mass (m/z) (Da)
19.9kDa 21.4kDa
Trypsin
Figure 5.11: MALDI-ToF MS measurement of apoferritin after denaturation anddigestion and SDS-PAGE of ferritin after denaturation, dyed with silver solution(1-4 are different preparations of denaturated ferritin solution. Mf is a standardprotein marker from 6.5 to 66 kDa).
scribed before; sample 2 was denaturated and boiled; sample 3 was denaturatedwith urea 8 M and 10µL of 10 mM solution of DTT; sample 4 was denaturated anddigested as described earlier).
66
6 Controlling the Fast ATRP ofN-Isopropylacrylamide in Water
6.1 Introduction
Poly(N-isopropylacrylamide) (PNIPAAm) is a well-known thermo-responsive po-lymer68 and exhibits a lower critical solution temperature (LCST) of 32 ◦C in wa-ter. It adopts a random coil structure (hydrophilic state) below the LCST and acollapsed globular structure (hydrophobic state) above. Because of this definedreversible transition, this polymer finds a vast array of applications, e.g. in the de-livery of therapeutics, bioseparations and biosensors162–164. NIPAAm is generallypolymerized via free radical polymerization. However, conventional free radicalpolymerization does not allow control of the molecular weight and to reach a nar-row molecular weight distribution (MWD). For sophisticated PNIPAAm-contai-ning materials, especially NIPAAm conjugation to biomacromolecules like ferritin,defined molecular weight and end-group but also low polydispersity index arehighly desirable.
Controlled free radical polymerization techniques have been intensively investi-gated during the past ten years. Nitroxide-mediated polymerization (NMP)165–167,reversible addition fragmentation chain transfer (RAFT) polymerization168–170 aswell as atom transfer radical polymerization (ATRP)56,171 are the main radical poly-merization techniques that allow the preparation of polymers with defined molec-ular weights and narrow polydispersities. Several groups have developed strate-gies to carry out NIPAAm polymerization with a good control. Schulte et al. per-formed this synthesis via NMP with a sterically hindered alkoxyamine and de-tailed mass spectrometry analysis166. In our laboratory RAFT polymerization wasemployed in pure water to obtain high molecular weight PNIPAAm with very goodcontrol and without irreversible termination even at high conversion172.
67
6 Controlling the Fast ATRP of N-Isopropylacrylamide in Water
Working in water is a great challenge and exhibits a high potential; it is an environ-mentally friendly solvent and also allows the presence of biological compoundslike viruses, polypeptides or proteins in the polymerization process84,173–175. Thesynthesis of well-defined bioconjugates for biomedical applications has been anactive area of research for many years. However, before investigating the synthesisof biohybrids based on PNIPAAm, the homopolymerization in pure water has tobe optimized to reach the best possible control. During the past few years, severalstudies have been realized in this field. Among them, Masci and co-workers werethe first to report the successful ATRP of NIPAAm using a DMF /water mixture.However the experiment performed in pure water failed, as a gel was formed im-mediately after the addition of the catalyst176. Due to the low solubility of usualATRP initiators like methyl 2-bromopropionate or ethyl 2-bromoisobutyrate inwater, a pure organic solvent or an aqueous mixture are commonly used yield-ing satisfactory results. Thus, Stöver and co-workers studied the influence of dif-ferent alcohols and demonstrated good polymerization control especially in iso-propanol by the use of CuCl/Me6TREN as catalyst system177. Nevertheless, to per-form the polymerization in pure water another applied strategy was to start froma macro-initiator, which is soluble in water. Kim et al. have succeeded to preparelinear PEG-b-PNIPAAm diblock copolymers and also hydrogel nanoparticles byATRP of NIPAAm in water at 25 ◦C and 50 ◦C using a PEG macro-initiator178. An-other example was recently described by Kizhakkedathu and co-workers. Theysynthesized mikto-arm star copolymers of poly(dimethylacrylamide) (PDMAAm)and PNIPAAm by sequential RAFT and ATRP from a multi-initiator-functionalizedpolyglycerol. The ATRP of NIPAAm was conducted after the RAFT polymerizationof DMAAm in the presence of CuCl/Me6TREN in pure water. Monomodal and nar-row MWD were achieved179. Additionally, several studies were performed to poly-merize NIPAAm from surfaces, like gold, carbon black, polystyrene (PS) or dextranparticles, directly in water180–184. Brooks et al. prepared PNIPAAm brushes bysurface-initiated ATRP from polystyrene particles. High molecular weights (up to800 kg·mol−1) and narrow MWD were obtained185,186. However, there is no knownreport on the polymerization of NIPAAm via ATRP in pure water with low molecu-lar weight water-soluble initiators. Therefore, in the current study, a novel strategyis described to obtain PNIPAAm via ATRP in pure water by using a fully soluble lowmolecular weight initiator. The influence of the ratio CuBr/CuBr2 or CuCl/CuCl2
and of the choice of the ligand are studied in details, to access this polymer withan excellent control, without irreversible termination even at high conversion anddemonstrate the livingness of the process by a successful chain extension.
68
6.2 Experimental
6.2 Experimental
6.2.1 Materials
All chemicals and solvents where purchased from Sigma-Aldrich, Acros and Flukaat the highest available purity and used as received unless otherwise noted. N-isopropylacrylamide (NIPAAm) (99 %, Acros) was purified by two successive re-crystallizations in a mixture of n-hexane and benzene (4:1 (v:v)). CuBr (98 %, Al-drich) and CuCl (97 %, Aldrich) were purified by stirring with acetic acid overnight.After filtration, they were washed with ethanol and ether and then dried in vaccuo.N,N,N’,N”,N”-pentamethyldiethylene-triamine (PMDETA; 99 %, Aldrich) and 1,1,-4,7,10,10-hexamethyltriethylenetetramine (HMTETA; 97%, Aldrich) were distilledbefore use. Tris(2-dimethylaminoethyl)amine (Me6TREN) was prepared as de-scribed in the literature187.
6.2.2 Polymerization Procedure
NIPAAm and 2-bromo-isobutyric acid (BIBA) were dissolved in 19 mL of pure wa-ter. Then CuBr/CuBr2 or CuCl/CuCl2, respectively were added. Monomer con-centrations and monomer/BIBA/Cu(I)/Cu(II)/Ligand ratios are given in Table 6.1and Table 6.2. The vial was capped with a rubber stopper to allow addition of theligand and placed in an ice bath. In a second small flask, 2 mL of aqueous ligandsolution was prepared. Then both were deoxygenated by purging with nitrogengas for 15 min. Afterwards 1 mL of ligand solution was withdrawn with a degassedsyringe and placed in the polymerization flask to start the reaction, which wasstopped after a pre-selected time and quenched with air. PNIPAAm samples werepurified by freeze-drying to remove the solvent. Then the solid was dissolved indichloromethane and passed through a silica gel column to remove the ATRP cat-alyst. Finally, PNIPAAm was precipitated from this solution into a 20-fold excessof diethyl ether before further analysis. The conversion of each sample was deter-mined directly after freeze-drying by 1H-NMR (in CDCl3) from the relative integra-tion of peaks associated with the monomer in relation to those associated with thepolymer. For NIPAAm, the monomer peak chosen as reference was its vinyl peakat δ = 5.72-5.8 ppm (dd, CH(H)=), which was compared to the proton peak of theisopropyl group at 4.1-3.8 ppm (m, CH(CH3)2) of the polymer and monomer.
69
6 Controlling the Fast ATRP of N-Isopropylacrylamide in Water
6.2.3 Characterization
Polymers were characterized by size exclusion chromatography (SEC) using a so-lution at 0.05 M of LiBr in 2-N-methylpyrrolidone (NMP) as eluent. PSS GRAMcolumns (300 mm·8 mm, 7µm): 103, 102 Å (PSS, Mainz, Germany) were thermo-stated at 70 ◦C. A 0.4 wt% (20µL) polymer solution was injected at an elution rateof 0.72 mL·min−1. RI and UV (λ=270 nm) were used for detection. Polystyrenestandards were used to calibrate the columns, and methyl benzoate was used asan internal standard. 1H-NMR spectra were recorded on a Bruker AC-25 spectrom-eter in CDCl3 (reference peak δ =7.26 ppm) at room temperature.
6.3 Results and Discussion
6.3.1 Homopolymerization of N-isopropylacrylamide
N-isopropylacrylamide (NIPAAm) was polymerized in the presence of 2-bromo-isobutyric acid (BIBA). This initiator was mainly chosen due to its high solubilityin water. In addition, it has the advantage to introduce a carboxylic group to al-low protein modification by active ester chemistry or post-polymerization mod-ification174. Common ATRP initiators like methyl 2-bromopropionate and ethyl2-bromoisobutyrate were also used but the resulting polymers always exhibiteda high polydispersity index (PDI < 1.7) and a multimodal distribution (results notshown). This absence of control can be explained by the very poor solubility ofthese initiators in water, which leads to a slow initiation. BIBA, as a weak acid,can partially protonate the tertiary amines used as ligands, which are weak bases188 and thus destabilize a part of the copper complexes189. However the quantifi-cation of this phenomenon, which may affect the activation equilibrium of ATRP,is not investigated here due to the very efficient activity of the copper species in-volved in this polymerization. Another important parameter allowing for a suc-cessful polymerization is the reaction temperature. When polymerizations werecarried out at room temperature with Cu(I) or with a high ratio Cu(I)/Cu(II), kinet-ics were extremely fast, typically less than a minute for full conversion. This veryhigh rate of polymerization was also observed by Narumi et al. in DMF/water at20 ◦C. In this less polar solvent mixture, conversions of 98 % where obtained af-ter only 30 min190. Moreover, due to the exothermic character of the propagation,
70
6.3 Results and Discussion
the temperature in the medium increased drastically which accelerated the rateof polymerization but more importantly, the temperature raised at least abovethe LCST of PNIPAAm, leading at the polymer collapse and a total loss of control.This increase in temperature during the polymerization of NIPAAm via ATRP wasalready described by Kuckling and co-workers for a DMF/water system. Howeverfor this solvent mixture, an increase of 5-10 K was observed which was not suf-ficient to observe the collapse of PNIPAAm191. To avoid this problem, a ratherlow monomer concentration, typically [M]0=0.5 M and an ice bath were used tocontrol the heat evolution. Under these conditions all polymerizations were suc-cessfully achieved even in the absence of Cu(II).
A suitable selection of the ligand is crucial to reach a good control of NIPAAmpolymerization192. Inspection of the data given in Table 6.1 clearly indicates thatN , N , N ′, N ′′, N ′′-pentamethyldiethylenetriamine (PMDETA) and 1,1,4,7,10,10-hexamethyltriethylenetetramine (HMTETA) are not the right choice to obtain apolymer with a low polydispersity when CuCl2 is not present in the media. TheSEC profiles of the polymers made in the presence of PMDETA and HMTETA withCuCl only is strongly skewed towards low molecular weights, which might indi-cate a slow initiation step. Moreover, the polymers have a higher molecular weightcompared to those made in presence of Me6TREN. A reasonable explanation is alow efficiency of this initiator in the presence of these two former ligands. Thisproblem was already described in the case of BIBA193. By adding Cu(II) to thesystem, for PMDETA and HMTETA, kinetics slow down and the molecular weightdistributions of the resulting polymers become sharper but still not below 1.2 (re-sults not shown). Under these conditions, these two ligands do not seem to besuitable to obtain a well controlled PNIPAAm. Me6TREN globally yields the bestresults for the different ratios of [CuCl]0/[CuCl2]0 employed and was the ligand ofchoice for the continuation of the study. This ligand is known to be very activefor ATRP compared to HMTETA and PMDETA192. Unfortunately it is also highlysensitive to oxygen which can drastically slow down the kinetics. Hence, kineticreproducibility was difficult to achieve. However, the ATRP of NIPAAm in waterdid not exhibit any or less than few percents of termination even at full conver-sion. This property allowed us to solve the reproducibility problem. Therefore thereactions were always carried out at longer times than normally required to followthe kinetics, and then well defined polymers with narrow molecular weight distri-bution at full conversion were obtained. The complex of Cu(I) with Me6TREN isalso known to disproportionate in aqueous media into Cu(0) and Cu(II)194. Thisreaction generally leads to a loss of control of the overall process. In all our exper-iments with this ligand, Cu(0) particles were not observed. Thus this reaction is
71
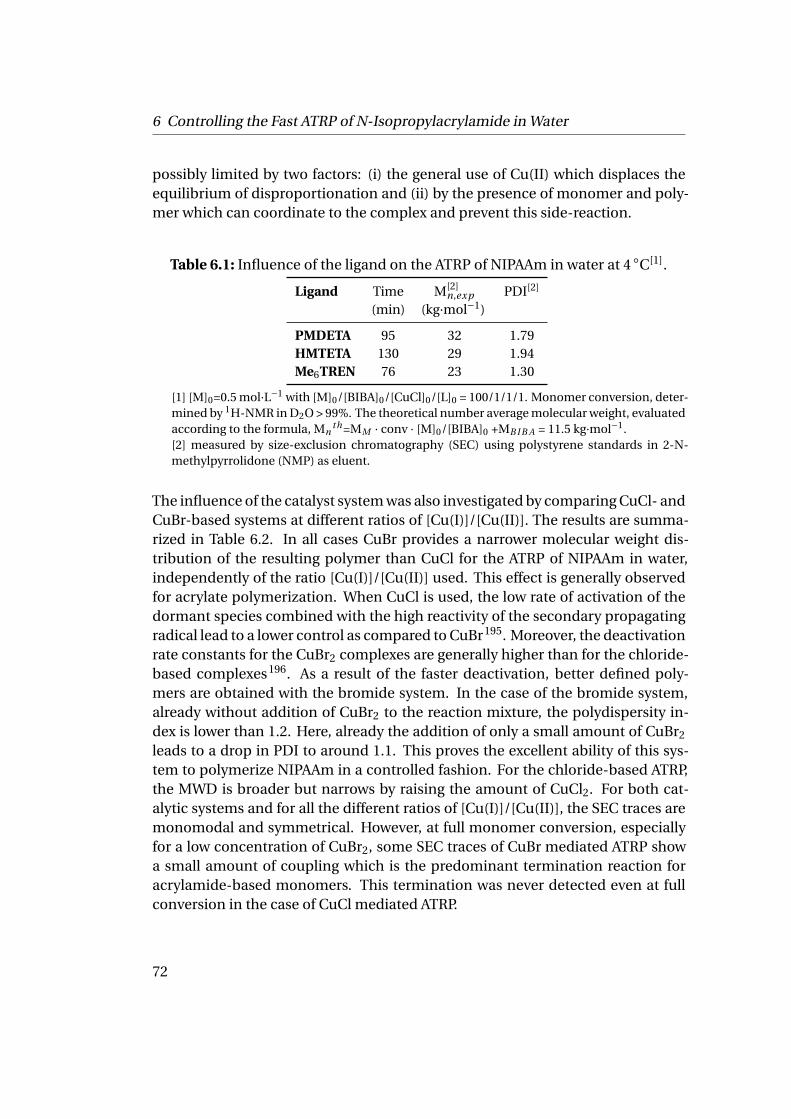
6 Controlling the Fast ATRP of N-Isopropylacrylamide in Water
possibly limited by two factors: (i) the general use of Cu(II) which displaces theequilibrium of disproportionation and (ii) by the presence of monomer and poly-mer which can coordinate to the complex and prevent this side-reaction.
Table 6.1: Influence of the ligand on the ATRP of NIPAAm in water at 4 ◦C[1].
Ligand Time M[2]n,exp PDI[2]
(min) (kg·mol−1)
PMDETA 95 32 1.79HMTETA 130 29 1.94Me6TREN 76 23 1.30
[1] [M]0=0.5 mol·L−1 with [M]0/[BIBA]0/[CuCl]0/[L]0 = 100/1/1/1. Monomer conversion, deter-mined by 1H-NMR in D2O > 99%. The theoretical number average molecular weight, evaluatedaccording to the formula, Mn
th=MM · conv · [M]0/[BIBA]0 +MB I B A = 11.5 kg·mol−1.[2] measured by size-exclusion chromatography (SEC) using polystyrene standards in 2-N-methylpyrrolidone (NMP) as eluent.
The influence of the catalyst system was also investigated by comparing CuCl- andCuBr-based systems at different ratios of [Cu(I)]/[Cu(II)]. The results are summa-rized in Table 6.2. In all cases CuBr provides a narrower molecular weight dis-tribution of the resulting polymer than CuCl for the ATRP of NIPAAm in water,independently of the ratio [Cu(I)]/[Cu(II)] used. This effect is generally observedfor acrylate polymerization. When CuCl is used, the low rate of activation of thedormant species combined with the high reactivity of the secondary propagatingradical lead to a lower control as compared to CuBr195. Moreover, the deactivationrate constants for the CuBr2 complexes are generally higher than for the chloride-based complexes196. As a result of the faster deactivation, better defined poly-mers are obtained with the bromide system. In the case of the bromide system,already without addition of CuBr2 to the reaction mixture, the polydispersity in-dex is lower than 1.2. Here, already the addition of only a small amount of CuBr2
leads to a drop in PDI to around 1.1. This proves the excellent ability of this sys-tem to polymerize NIPAAm in a controlled fashion. For the chloride-based ATRP,the MWD is broader but narrows by raising the amount of CuCl2. For both cat-alytic systems and for all the different ratios of [Cu(I)]/[Cu(II)], the SEC traces aremonomodal and symmetrical. However, at full monomer conversion, especiallyfor a low concentration of CuBr2, some SEC traces of CuBr mediated ATRP showa small amount of coupling which is the predominant termination reaction foracrylamide-based monomers. This termination was never detected even at fullconversion in the case of CuCl mediated ATRP.
72
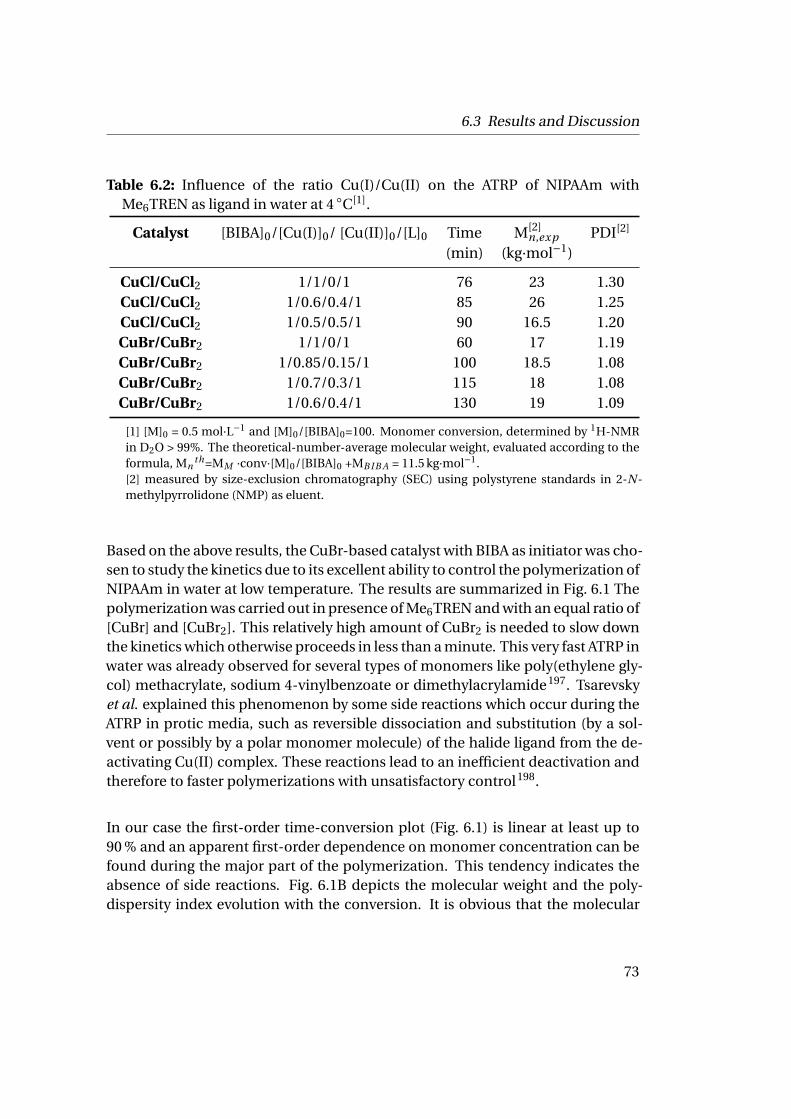
6.3 Results and Discussion
Table 6.2: Influence of the ratio Cu(I)/Cu(II) on the ATRP of NIPAAm withMe6TREN as ligand in water at 4 ◦C[1].
Catalyst [BIBA]0/[Cu(I)]0/ [Cu(II)]0/[L]0 Time M[2]n,exp PDI[2]
(min) (kg·mol−1)
CuCl/CuCl2 1/1/0/1 76 23 1.30CuCl/CuCl2 1/0.6/0.4/1 85 26 1.25CuCl/CuCl2 1/0.5/0.5/1 90 16.5 1.20CuBr/CuBr2 1/1/0/1 60 17 1.19CuBr/CuBr2 1/0.85/0.15/1 100 18.5 1.08CuBr/CuBr2 1/0.7/0.3/1 115 18 1.08CuBr/CuBr2 1/0.6/0.4/1 130 19 1.09
[1] [M]0 = 0.5 mol·L−1 and [M]0/[BIBA]0=100. Monomer conversion, determined by 1H-NMRin D2O > 99%. The theoretical-number-average molecular weight, evaluated according to theformula, Mn
th=MM ·conv·[M]0/[BIBA]0 +MB I B A = 11.5 kg·mol−1.[2] measured by size-exclusion chromatography (SEC) using polystyrene standards in 2-N-methylpyrrolidone (NMP) as eluent.
Based on the above results, the CuBr-based catalyst with BIBA as initiator was cho-sen to study the kinetics due to its excellent ability to control the polymerization ofNIPAAm in water at low temperature. The results are summarized in Fig. 6.1 Thepolymerization was carried out in presence of Me6TREN and with an equal ratio of[CuBr] and [CuBr2]. This relatively high amount of CuBr2 is needed to slow downthe kinetics which otherwise proceeds in less than a minute. This very fast ATRP inwater was already observed for several types of monomers like poly(ethylene gly-col) methacrylate, sodium 4-vinylbenzoate or dimethylacrylamide197. Tsarevskyet al. explained this phenomenon by some side reactions which occur during theATRP in protic media, such as reversible dissociation and substitution (by a sol-vent or possibly by a polar monomer molecule) of the halide ligand from the de-activating Cu(II) complex. These reactions lead to an inefficient deactivation andtherefore to faster polymerizations with unsatisfactory control198.
In our case the first-order time-conversion plot (Fig. 6.1) is linear at least up to90 % and an apparent first-order dependence on monomer concentration can befound during the major part of the polymerization. This tendency indicates theabsence of side reactions. Fig. 6.1B depicts the molecular weight and the poly-dispersity index evolution with the conversion. It is obvious that the molecular
73
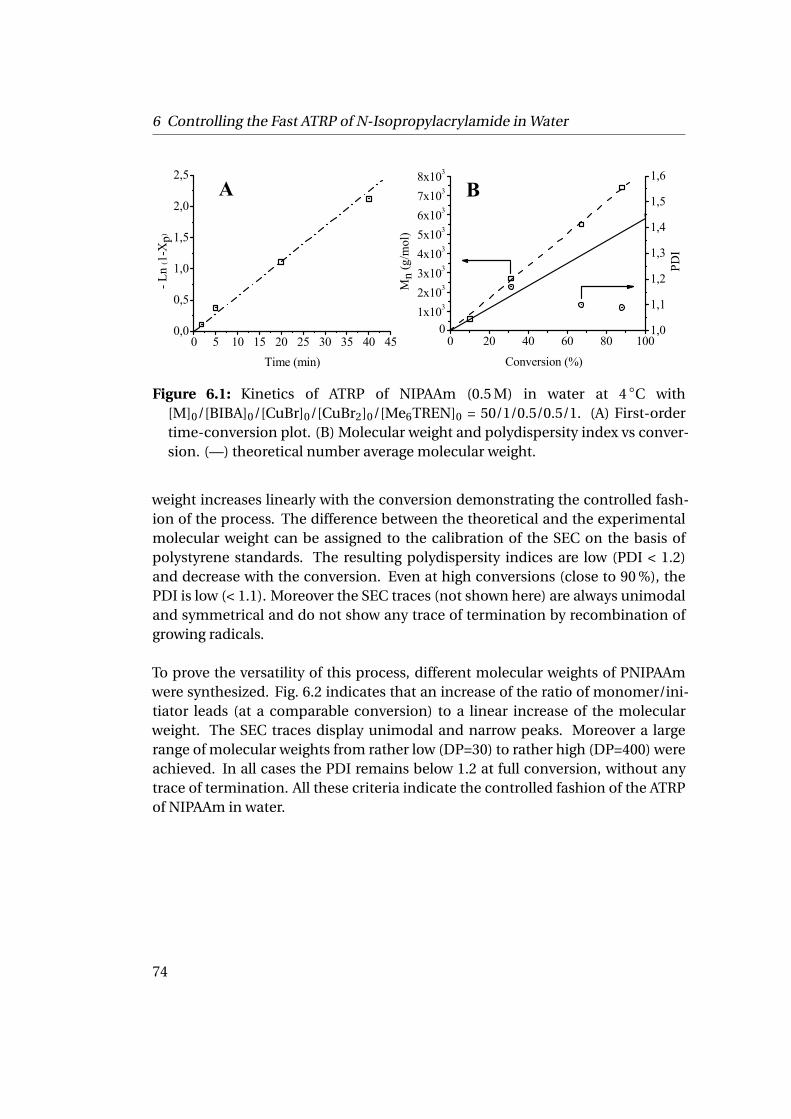
6 Controlling the Fast ATRP of N-Isopropylacrylamide in Water
0 5 10 15 20 25 30 35 40 450,0
0,5
1,0
1,5
2,0
2,5- L
n (1
-Xp)
Time (min)
A
0 20 40 60 80 1000
1x10³
2x10³
3x10³
4x10³
5x10³
6x10³
7x10³
8x10³
Conversion (%)
Mn
(g/m
ol)
B
1,0
1,1
1,2
1,3
1,4
1,5
1,6
PDI
Figure 6.1: Kinetics of ATRP of NIPAAm (0.5 M) in water at 4 ◦C with[M]0/[BIBA]0/[CuBr]0/[CuBr2]0/[Me6TREN]0 = 50/1/0.5/0.5/1. (A) First-ordertime-conversion plot. (B) Molecular weight and polydispersity index vs conver-sion. (—) theoretical number average molecular weight.
weight increases linearly with the conversion demonstrating the controlled fash-ion of the process. The difference between the theoretical and the experimentalmolecular weight can be assigned to the calibration of the SEC on the basis ofpolystyrene standards. The resulting polydispersity indices are low (PDI < 1.2)and decrease with the conversion. Even at high conversions (close to 90 %), thePDI is low (< 1.1). Moreover the SEC traces (not shown here) are always unimodaland symmetrical and do not show any trace of termination by recombination ofgrowing radicals.
To prove the versatility of this process, different molecular weights of PNIPAAmwere synthesized. Fig. 6.2 indicates that an increase of the ratio of monomer/ini-tiator leads (at a comparable conversion) to a linear increase of the molecularweight. The SEC traces display unimodal and narrow peaks. Moreover a largerange of molecular weights from rather low (DP=30) to rather high (DP=400) wereachieved. In all cases the PDI remains below 1.2 at full conversion, without anytrace of termination. All these criteria indicate the controlled fashion of the ATRPof NIPAAm in water.
74
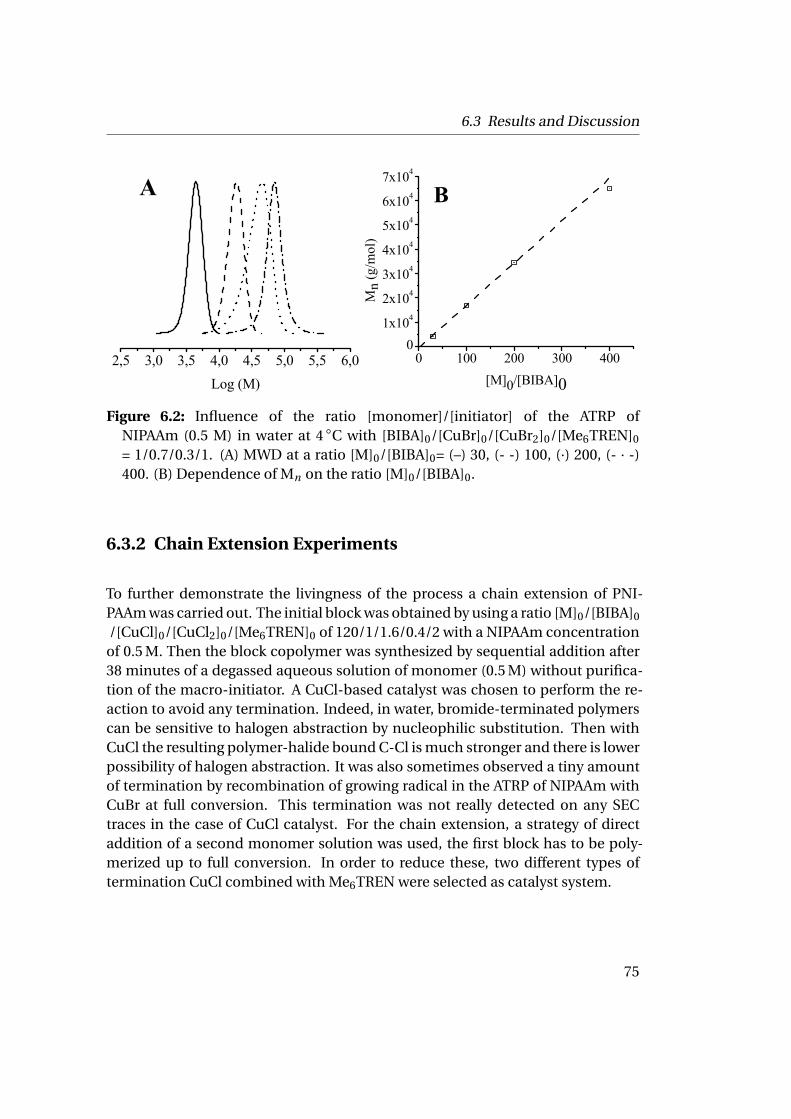
6.3 Results and Discussion
2,5 3,0 3,5 4,0 4,5 5,0 5,5 6,0Log (M)
A
0 100 200 300 4000
1x10⁴
2x10⁴
3x10⁴
4x10⁴
5x10⁴
6x10⁴
7x10⁴
Mn
(g/m
ol)
[M]0/[BIBA]0
B
Figure 6.2: Influence of the ratio [monomer]/[initiator] of the ATRP ofNIPAAm (0.5 M) in water at 4 ◦C with [BIBA]0/[CuBr]0/[CuBr2]0/[Me6TREN]0
= 1/0.7/0.3/1. (A) MWD at a ratio [M]0/[BIBA]0= (–) 30, (- -) 100, (·) 200, (- · -)400. (B) Dependence of Mn on the ratio [M]0/[BIBA]0.
6.3.2 Chain Extension Experiments
To further demonstrate the livingness of the process a chain extension of PNI-PAAm was carried out. The initial block was obtained by using a ratio [M]0/[BIBA]0
/[CuCl]0/[CuCl2]0/[Me6TREN]0 of 120/1/1.6/0.4/2 with a NIPAAm concentrationof 0.5 M. Then the block copolymer was synthesized by sequential addition after38 minutes of a degassed aqueous solution of monomer (0.5 M) without purifica-tion of the macro-initiator. A CuCl-based catalyst was chosen to perform the re-action to avoid any termination. Indeed, in water, bromide-terminated polymerscan be sensitive to halogen abstraction by nucleophilic substitution. Then withCuCl the resulting polymer-halide bound C-Cl is much stronger and there is lowerpossibility of halogen abstraction. It was also sometimes observed a tiny amountof termination by recombination of growing radical in the ATRP of NIPAAm withCuBr at full conversion. This termination was not really detected on any SECtraces in the case of CuCl catalyst. For the chain extension, a strategy of directaddition of a second monomer solution was used, the first block has to be poly-merized up to full conversion. In order to reduce these, two different types oftermination CuCl combined with Me6TREN were selected as catalyst system.
75
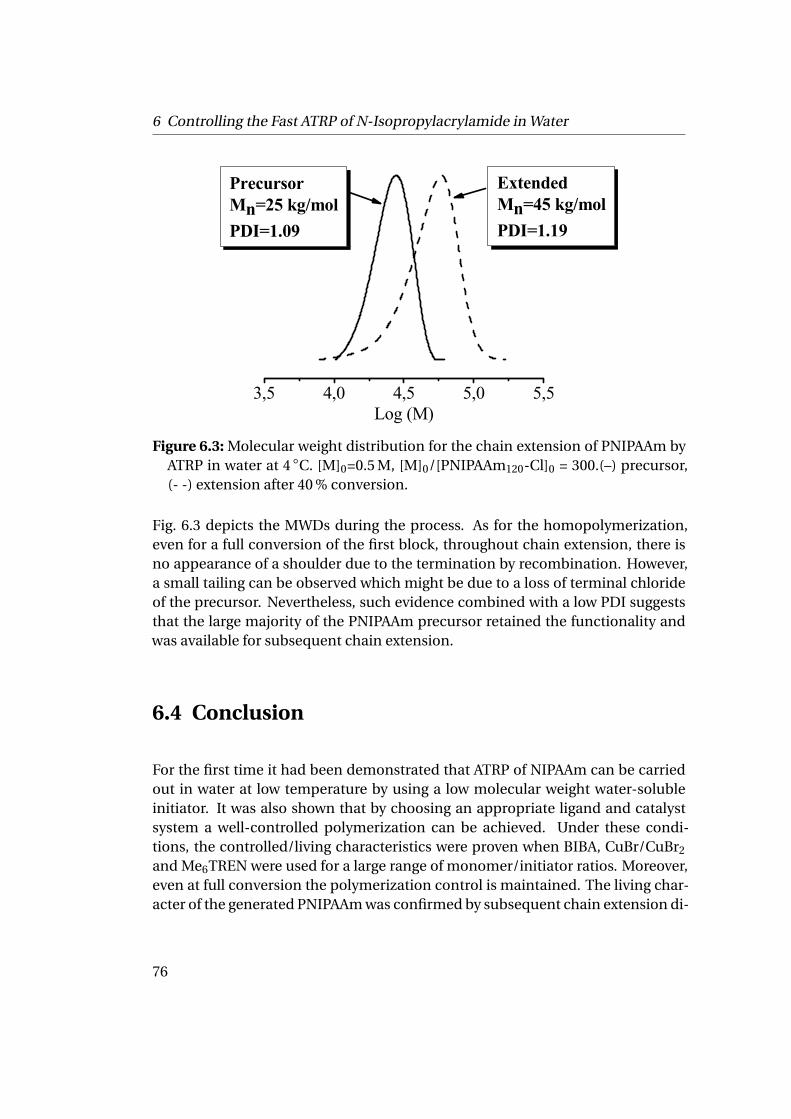
6 Controlling the Fast ATRP of N-Isopropylacrylamide in Water
3,5 4,0 4,5 5,0 5,5Log (M)
PrecursorMn=25 kg/molPDI=1.09
ExtendedMn=45 kg/molPDI=1.19
Figure 6.3: Molecular weight distribution for the chain extension of PNIPAAm byATRP in water at 4 ◦C. [M]0=0.5 M, [M]0/[PNIPAAm120-Cl]0 = 300.(–) precursor,(- -) extension after 40 % conversion.
Fig. 6.3 depicts the MWDs during the process. As for the homopolymerization,even for a full conversion of the first block, throughout chain extension, there isno appearance of a shoulder due to the termination by recombination. However,a small tailing can be observed which might be due to a loss of terminal chlorideof the precursor. Nevertheless, such evidence combined with a low PDI suggeststhat the large majority of the PNIPAAm precursor retained the functionality andwas available for subsequent chain extension.
6.4 Conclusion
For the first time it had been demonstrated that ATRP of NIPAAm can be carriedout in water at low temperature by using a low molecular weight water-solubleinitiator. It was also shown that by choosing an appropriate ligand and catalystsystem a well-controlled polymerization can be achieved. Under these condi-tions, the controlled/living characteristics were proven when BIBA, CuBr/CuBr2
and Me6TREN were used for a large range of monomer/initiator ratios. Moreover,even at full conversion the polymerization control is maintained. The living char-acter of the generated PNIPAAm was confirmed by subsequent chain extension di-
76
6.4 Conclusion
rectly by addition of a second portion of the degassed monomer solution. Duringchain extension, no side reactions were observed and the polydispersity remainedlow throughout the polymerization. Finally, due to the terminal carboxylic endgroup present on the polymer, post polymerization treatments like protein con-jugation are possible. Given the environmental benefits associated with aqueouspolymerizations at low temperature and the possibility to tailor a large variety ofblock lengths, it is believed that the method reported in the present study repre-sents a significant advance in the ability to prepare complex architectures basedon this smart polymer.
77

7 Synthesis & ATRP of thePhotocrosslinker DMIAAm
7.1 Introduction
As the aim of this thesis is to build a polymer membrane, it is necessary to cross-link the polymer chains to create a matrix embedding the proteins. The cho-sen way is the copolymerization of NIPAAm and 2-(dimethyl maleimido)-N-ethyl-acrylamide (DMIAAm). Poly(DMIAAm) is a polymer-analogous to PNIPAAm buthas a dimethyl maleimido function able to photocrosslink the polymer chains un-der UV light. The monomer was synthesized following the protocol of Vo et al.and the random ATRP of NIPAAm and DMIAAm was realized without ferritin inthis chapter. This approach allows the formation of the film before crosslinkingand a better control of the conjugates layer, and hence also of the future mem-brane. Kuckling et al. were able to synthesize photocrosslinked thermoresponsivePNIPAAm nanogels following this approach199,200.
7.2 Experimental
7.2.1 Materials
Synthesis of DMIAAm. Diaminoethane (Fluka), dimethyl maleic anhydride (98%,Aldrich), acryloyl chloride (97%, Aldrich), di-tert-butyl dicarbonate (98%, Aldrich),trifluoroacetic acid (98%, Aldrich), and diethylamine (99,5%, Aldrich) were usedas received.ATRP. NIPAAm (99%, Acros) was purified by two successive recrystallizations in
79
7 Synthesis & ATRP of the Photocrosslinker DMIAAm
a mixture of n-hexane and benzene (4:1 (v:v)). 2-bromo-isobutyric acid (BIBA)(98%, Aldrich) and CuBr2 (98%, Aldrich) were used as purchased. CuBr (98%,Aldrich) was purified by stirring it with acetic acid overnight. After filtration, theywere washed with ethanol and ether and then dried in vacuo. Tris(2-dimethyl-aminoethyl)amine (Me6TREN) was prepared as described in the literature187. Wa-ter was obtained from a Sartorius apparatus.Crosslinking procedure. The polymer solution contained 20 wt% polymer and2 wt% thioxanthone with respect to the polymer dissolved in butanone or chloro-form. The polymer films were prepared by spin coating onto silicon wafers afterplasma treatment. Films were placed under UV-light. The UV irradiation was car-ried out with a 400 W UV lamp (Panacol 400F), at a wavelength of λ>315 nm at 20cm from the sample.
7.2.2 Characterization
Polymers were characterized by size exclusion chromatography (SEC) using a solu-tion at 0.05 M of LiBr in dimethylacetamide (DMAc) as eluent. PSS GRAM columns(300 mm·8 mm, 7µm): 103, 102 Å (PSS, Mainz, Germany) were thermostated at70 ◦C. A 0.4 wt% (20µL) polymer solution was injected at an elution rate of about0.72 mL·min−1. RI and UV (λ=270 nm) were used for detection. Polystyrene stan-dards were used to calibrate the columns, and methyl benzoate was used as aninternal standard.1H-NMR spectra were recorded on a Bruker AC-25 spectrometer in CDCl3 (refer-ence peak δ = 7.26 ppm) at room temperature and for conversion purpose DMSOwas used as the internal standard (δ = 2.7 ppm).DSC measurements were carried out with a DSC Q1000 instrument to determinethe glass transition temperature (Tg ) of the polymers (Tg at ∆C p/2) and the Tc
of the polymer solutions. The Tg values were measured with a heating rate of10 K·min−1 from 20 to 200 ◦C and back, and the DSC thermograms of the poly-mer solutions were recorded at a heating rate of 5 ◦C·min−1 from 20 to 200 ◦C andback. The polymer concentration was 50 mg·mL−1 in deionized water, and the on-set value of the transition was taken as Tc .Turbidity was measured on 1 mg·mL−1 polymer samples by UV-Vis spectroscopyat 600 nm.MALDI-ToF mass spectra were recorded on a Bruker Reflex III spectrometer in alinear mode using a 337 nm nitrogen laser and an accelerating potential of 20 kV inpositive ion mode. For P(NIPAAm-DMIAAm) characterization, 2,5-dihydroxyben-
80
7.2 Experimental
zoic acid (20 mg·mL−1) was used as a matrix, and polymer samples were dissolvedin THF (10 mg·mL−1). A droplet of 5µL of this mixture was spotted on the steel tar-get plate, and it was dried in vacuo.FT-IR measurements were recorded on a Bruker Tensor 27 instrument with a ran-ge of 1000 to 700 cm−1. Polymer solutions with 0, 3, 5, 7 mol% crosslinker wereprepared in 1 mL of chloroform, with 2 wt% thioxanthone and 20 wt% polymer, re-spectively. Each solution was crosslinked under UV-light over the time and char-acterized by FT-IR.A spectroscopic ellipsometer SE850 (SENTECH) with a UV-Vis lamp was used tomeasure the thickness of the different polymer films with different mol% of cross-linker to estimate the influence of the crosslinking (at an angle of 70 ◦). The re-fractive index of the dry PNIPAAm films is assumed to be 1.46 for films less than50 nm thick. For thicker films, ellipsometer measurements yield a refractive in-dex of 1.47 to 1.49201. Measurements were fitted using a model: silicon Jellison(100) wafer with a 2 nm layer of SiO2 and the polymer layer is to estimate. Polymersolutions with 0, 3, 5, 7 mol% crosslinker were prepared in 1 mL butanone, withrespectively 2 wt% thioxanthone and 20 wt% polymer. Large silicon wafers werecleaned with the help of CO2 snowjet. 100µL of polymer solution was spin coatedon them. Silicon wafers were placed into a chamber under the ellipsometer inorder to control the humidity and the temperature.
81
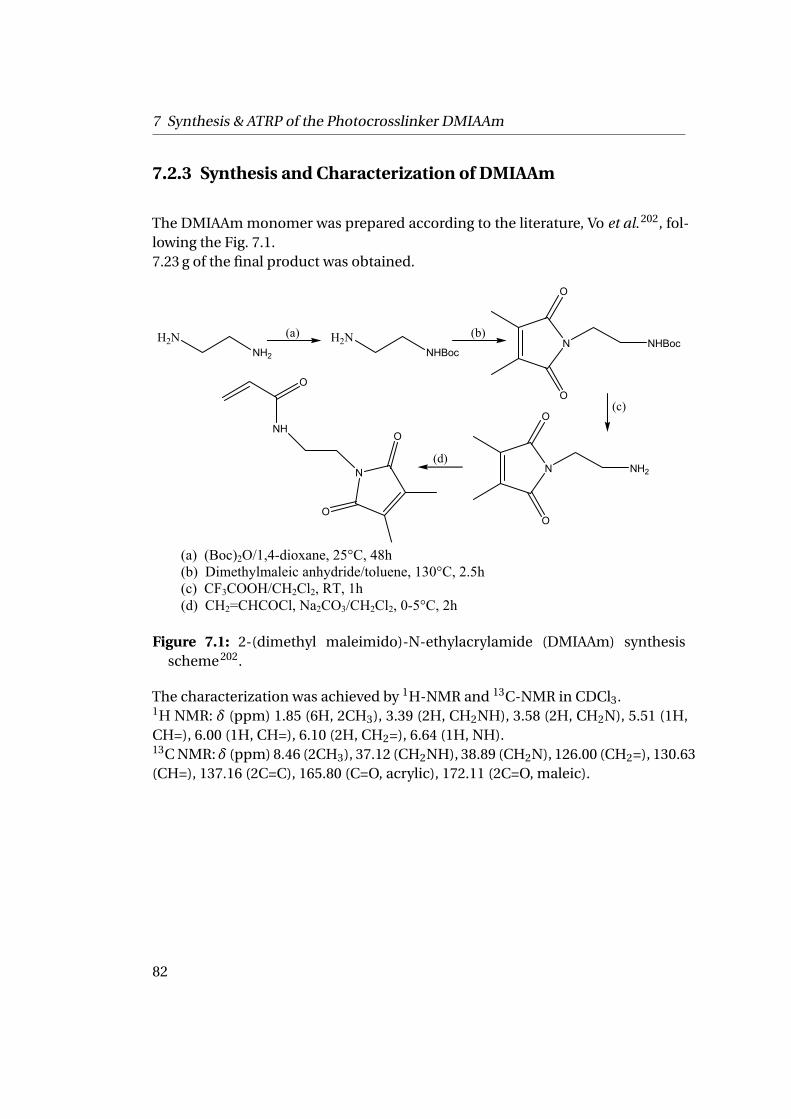
7 Synthesis & ATRP of the Photocrosslinker DMIAAm
7.2.3 Synthesis and Characterization of DMIAAm
The DMIAAm monomer was prepared according to the literature, Vo et al.202, fol-lowing the Fig. 7.1.7.23 g of the final product was obtained.
H2NNH2
(a) H2NNHBoc
(b)N
O
O
NHBoc
N
O
O
NH2
(c)
(d)N
O
O
NH
O
(a) (Boc)2O/1,4-dioxane, 25°C, 48h (b) Dimethylmaleic anhydride/toluene, 130°C, 2.5h (c) CF3COOH/CH2Cl2, RT, 1h (d) CH2=CHCOCl, Na2CO3/CH2Cl2, 0-5°C, 2h
Figure 7.1: 2-(dimethyl maleimido)-N-ethylacrylamide (DMIAAm) synthesisscheme202.
The characterization was achieved by 1H-NMR and 13C-NMR in CDCl3.1H NMR: δ (ppm) 1.85 (6H, 2CH3), 3.39 (2H, CH2NH), 3.58 (2H, CH2N), 5.51 (1H,CH=), 6.00 (1H, CH=), 6.10 (2H, CH2=), 6.64 (1H, NH).13C NMR:δ (ppm) 8.46 (2CH3), 37.12 (CH2NH), 38.89 (CH2N), 126.00 (CH2=), 130.63(CH=), 137.16 (2C=C), 165.80 (C=O, acrylic), 172.11 (2C=O, maleic).
82
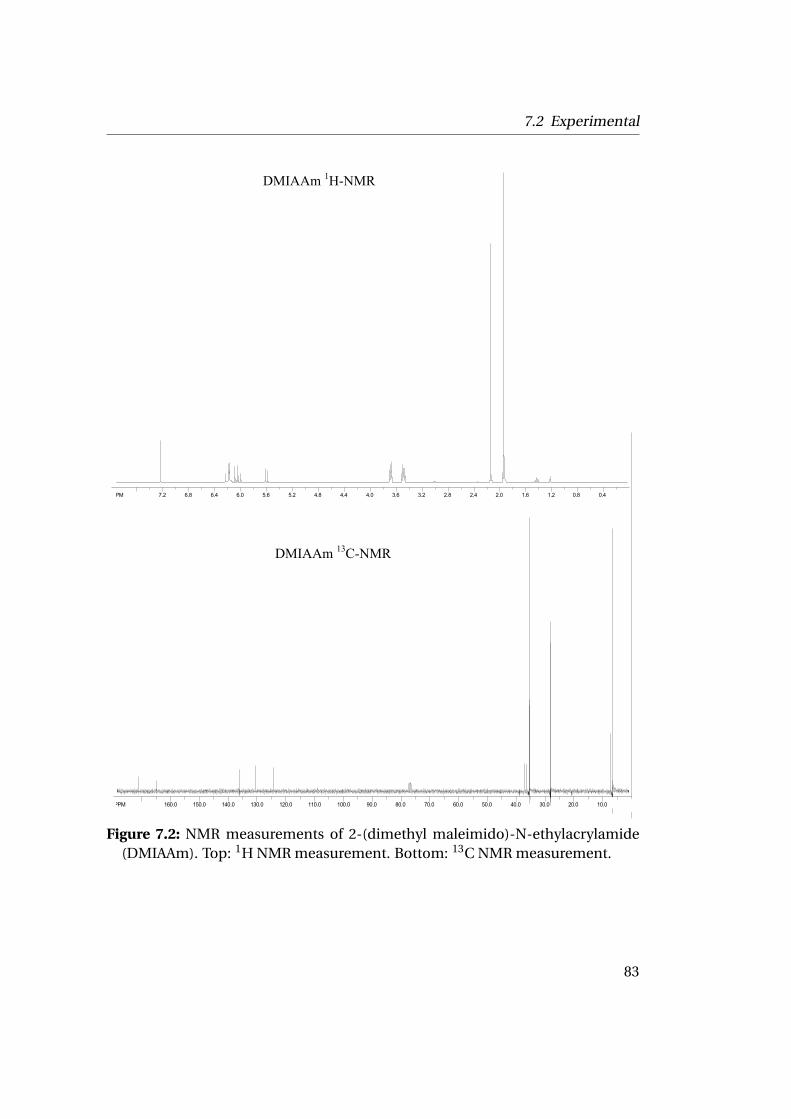
7.2 Experimental
PM 7.2 6.8 6.4 6.0 5.6 5.2 4.8 4.4 4.0 3.6 3.2 2.8 2.4 2.0 1.6 1.2 0.8 0.4
PPM 160.0 150.0 140.0 130.0 120.0 110.0 100.0 90.0 80.0 70.0 60.0 50.0 40.0 30.0 20.0 10.0
DMIAAm 13C-NMR
DMIAAm 1H-NMR
Figure 7.2: NMR measurements of 2-(dimethyl maleimido)-N-ethylacrylamide(DMIAAm). Top: 1H NMR measurement. Bottom: 13C NMR measurement.
83
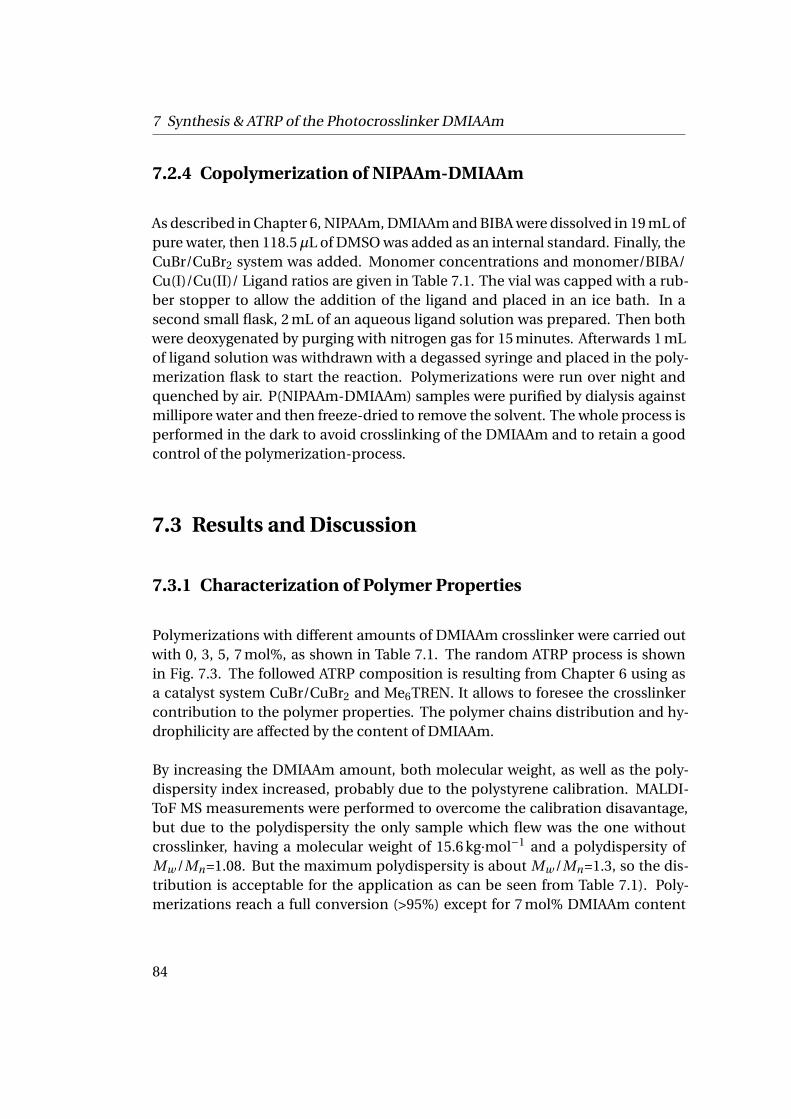
7 Synthesis & ATRP of the Photocrosslinker DMIAAm
7.2.4 Copolymerization of NIPAAm-DMIAAm
As described in Chapter 6, NIPAAm, DMIAAm and BIBA were dissolved in 19 mL ofpure water, then 118.5µL of DMSO was added as an internal standard. Finally, theCuBr/CuBr2 system was added. Monomer concentrations and monomer/BIBA/Cu(I)/Cu(II)/ Ligand ratios are given in Table 7.1. The vial was capped with a rub-ber stopper to allow the addition of the ligand and placed in an ice bath. In asecond small flask, 2 mL of an aqueous ligand solution was prepared. Then bothwere deoxygenated by purging with nitrogen gas for 15 minutes. Afterwards 1 mLof ligand solution was withdrawn with a degassed syringe and placed in the poly-merization flask to start the reaction. Polymerizations were run over night andquenched by air. P(NIPAAm-DMIAAm) samples were purified by dialysis againstmillipore water and then freeze-dried to remove the solvent. The whole process isperformed in the dark to avoid crosslinking of the DMIAAm and to retain a goodcontrol of the polymerization-process.
7.3 Results and Discussion
7.3.1 Characterization of Polymer Properties
Polymerizations with different amounts of DMIAAm crosslinker were carried outwith 0, 3, 5, 7 mol%, as shown in Table 7.1. The random ATRP process is shownin Fig. 7.3. The followed ATRP composition is resulting from Chapter 6 using asa catalyst system CuBr/CuBr2 and Me6TREN. It allows to foresee the crosslinkercontribution to the polymer properties. The polymer chains distribution and hy-drophilicity are affected by the content of DMIAAm.
By increasing the DMIAAm amount, both molecular weight, as well as the poly-dispersity index increased, probably due to the polystyrene calibration. MALDI-ToF MS measurements were performed to overcome the calibration disavantage,but due to the polydispersity the only sample which flew was the one withoutcrosslinker, having a molecular weight of 15.6 kg·mol−1 and a polydispersity ofMw /Mn=1.08. But the maximum polydispersity is about Mw /Mn=1.3, so the dis-tribution is acceptable for the application as can be seen from Table 7.1). Poly-merizations reach a full conversion (>95%) except for 7 mol% DMIAAm content
84
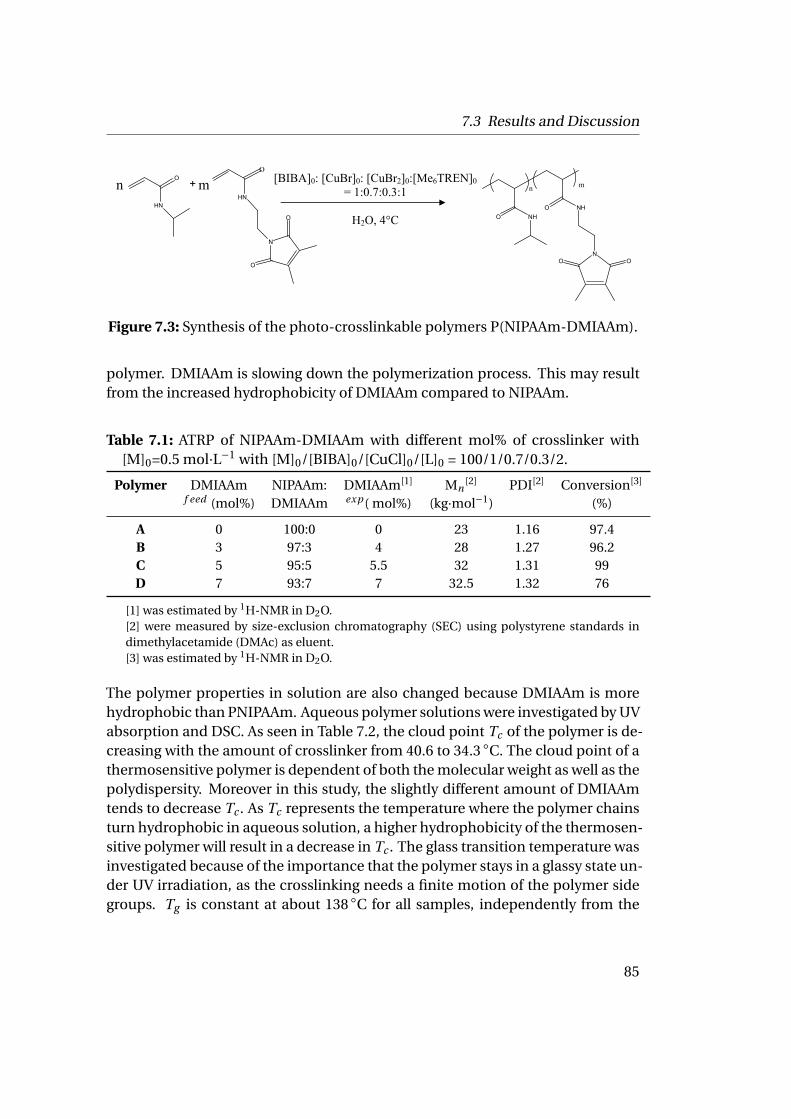
7.3 Results and Discussion
[BIBA]0: [CuBr]0: [CuBr2]0:[Me6TREN]0
= 1:0.7:0.3:1
H2O, 4°C O NHO NH
NOO
n mO
HN
N
O
O
HN
O
m + n
Figure 7.3: Synthesis of the photo-crosslinkable polymers P(NIPAAm-DMIAAm).
polymer. DMIAAm is slowing down the polymerization process. This may resultfrom the increased hydrophobicity of DMIAAm compared to NIPAAm.
Table 7.1: ATRP of NIPAAm-DMIAAm with different mol% of crosslinker with[M]0=0.5 mol·L−1 with [M]0/[BIBA]0/[CuCl]0/[L]0 = 100/1/0.7/0.3/2.
Polymer DMIAAm NIPAAm: DMIAAm[1] Mn[2] PDI[2] Conversion[3]
f eed (mol%) DMIAAm exp ( mol%) (kg·mol−1) (%)
A 0 100:0 0 23 1.16 97.4B 3 97:3 4 28 1.27 96.2C 5 95:5 5.5 32 1.31 99D 7 93:7 7 32.5 1.32 76
[1] was estimated by 1H-NMR in D2O.[2] were measured by size-exclusion chromatography (SEC) using polystyrene standards indimethylacetamide (DMAc) as eluent.[3] was estimated by 1H-NMR in D2O.
The polymer properties in solution are also changed because DMIAAm is morehydrophobic than PNIPAAm. Aqueous polymer solutions were investigated by UVabsorption and DSC. As seen in Table 7.2, the cloud point Tc of the polymer is de-creasing with the amount of crosslinker from 40.6 to 34.3 ◦C. The cloud point of athermosensitive polymer is dependent of both the molecular weight as well as thepolydispersity. Moreover in this study, the slightly different amount of DMIAAmtends to decrease Tc . As Tc represents the temperature where the polymer chainsturn hydrophobic in aqueous solution, a higher hydrophobicity of the thermosen-sitive polymer will result in a decrease in Tc . The glass transition temperature wasinvestigated because of the importance that the polymer stays in a glassy state un-der UV irradiation, as the crosslinking needs a finite motion of the polymer sidegroups. Tg is constant at about 138 ◦C for all samples, independently from the
85
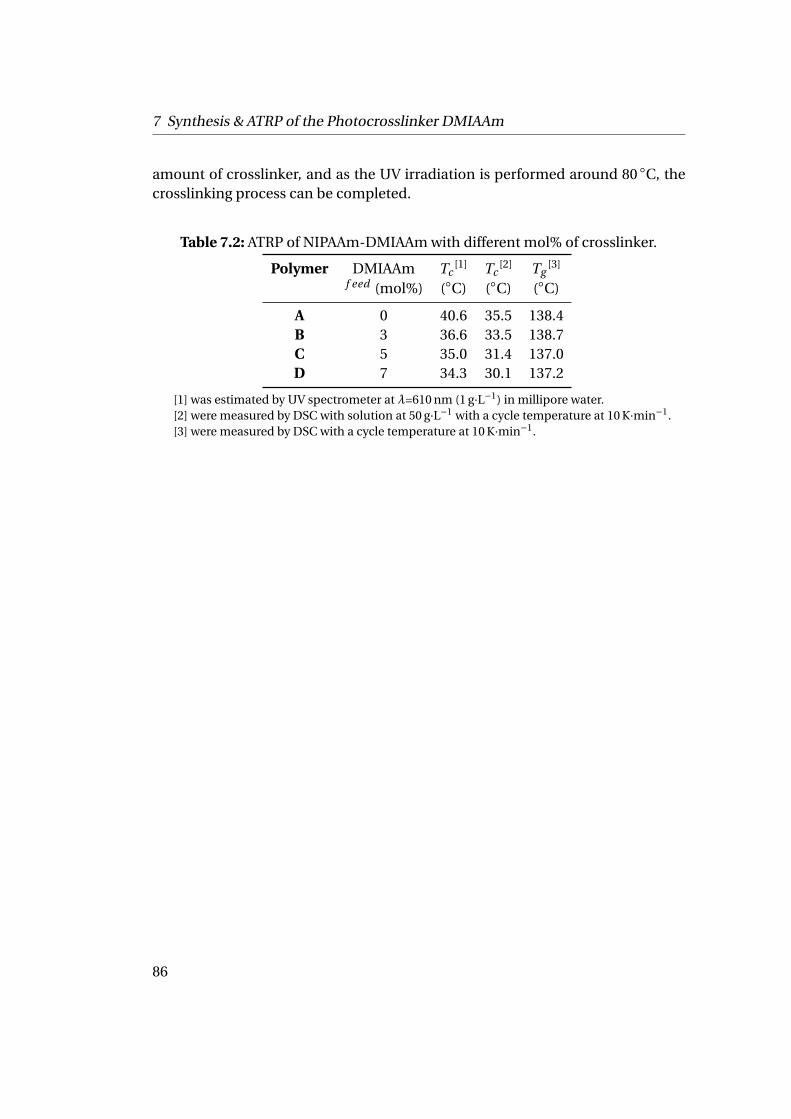
7 Synthesis & ATRP of the Photocrosslinker DMIAAm
amount of crosslinker, and as the UV irradiation is performed around 80 ◦C, thecrosslinking process can be completed.
Table 7.2: ATRP of NIPAAm-DMIAAm with different mol% of crosslinker.
Polymer DMIAAm Tc[1] Tc
[2] Tg[3]
f eed (mol%) (◦C) (◦C) (◦C)
A 0 40.6 35.5 138.4B 3 36.6 33.5 138.7C 5 35.0 31.4 137.0D 7 34.3 30.1 137.2
[1] was estimated by UV spectrometer at λ=610 nm (1 g·L−1) in millipore water.[2] were measured by DSC with solution at 50 g·L−1 with a cycle temperature at 10 K·min−1.[3] were measured by DSC with a cycle temperature at 10 K·min−1.
86
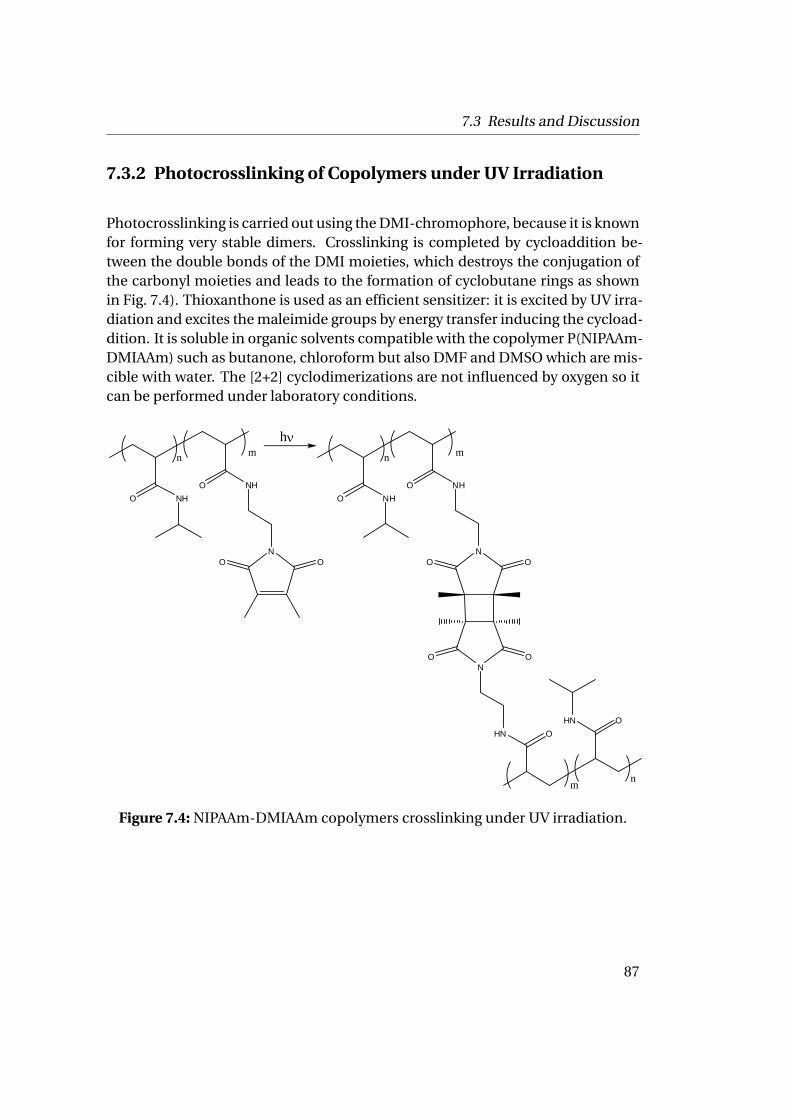
7.3 Results and Discussion
7.3.2 Photocrosslinking of Copolymers under UV Irradiation
Photocrosslinking is carried out using the DMI-chromophore, because it is knownfor forming very stable dimers. Crosslinking is completed by cycloaddition be-tween the double bonds of the DMI moieties, which destroys the conjugation ofthe carbonyl moieties and leads to the formation of cyclobutane rings as shownin Fig. 7.4). Thioxanthone is used as an efficient sensitizer: it is excited by UV irra-diation and excites the maleimide groups by energy transfer inducing the cycload-dition. It is soluble in organic solvents compatible with the copolymer P(NIPAAm-DMIAAm) such as butanone, chloroform but also DMF and DMSO which are mis-cible with water. The [2+2] cyclodimerizations are not influenced by oxygen so itcan be performed under laboratory conditions.
O NH
O NH
NOO
n m
O NH
O NH
NOO
n m
OHN
OHN
NO O
m n
h
Figure 7.4: NIPAAm-DMIAAm copolymers crosslinking under UV irradiation.
87
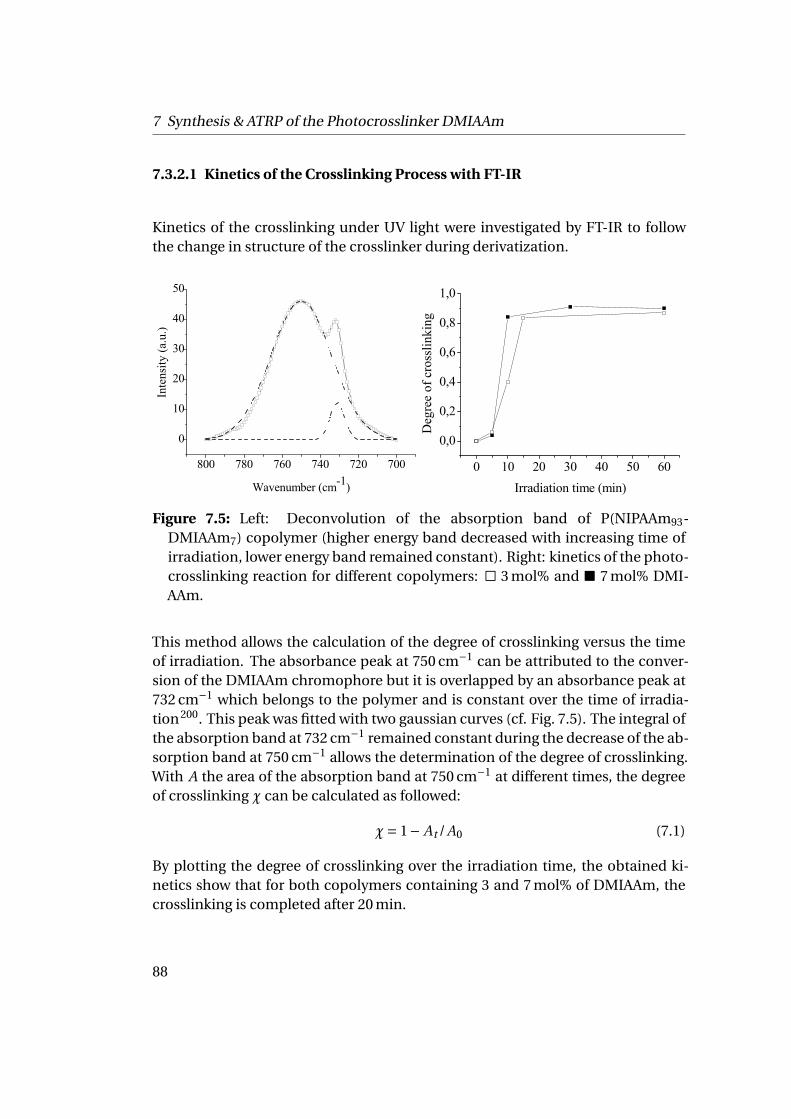
7 Synthesis & ATRP of the Photocrosslinker DMIAAm
7.3.2.1 Kinetics of the Crosslinking Process with FT-IR
Kinetics of the crosslinking under UV light were investigated by FT-IR to followthe change in structure of the crosslinker during derivatization.
0 10 20 30 40 50 60
0,0
0,2
0,4
0,6
0,8
1,0
Deg
ree
of c
ross
linki
ng
Irradiation time (min)
800 780 760 740 720 700
0
10
20
30
40
50
Wavenumber (cm-1)
Inte
nsity
(a.u
.)
Figure 7.5: Left: Deconvolution of the absorption band of P(NIPAAm93-DMIAAm7) copolymer (higher energy band decreased with increasing time ofirradiation, lower energy band remained constant). Right: kinetics of the photo-crosslinking reaction for different copolymers: ä 3 mol% and ■ 7 mol% DMI-AAm.
This method allows the calculation of the degree of crosslinking versus the timeof irradiation. The absorbance peak at 750 cm−1 can be attributed to the conver-sion of the DMIAAm chromophore but it is overlapped by an absorbance peak at732 cm−1 which belongs to the polymer and is constant over the time of irradia-tion200. This peak was fitted with two gaussian curves (cf. Fig. 7.5). The integral ofthe absorption band at 732 cm−1 remained constant during the decrease of the ab-sorption band at 750 cm−1 allows the determination of the degree of crosslinking.With A the area of the absorption band at 750 cm−1 at different times, the degreeof crosslinking χ can be calculated as followed:
χ= 1− At /A0 (7.1)
By plotting the degree of crosslinking over the irradiation time, the obtained ki-netics show that for both copolymers containing 3 and 7 mol% of DMIAAm, thecrosslinking is completed after 20 min.
88
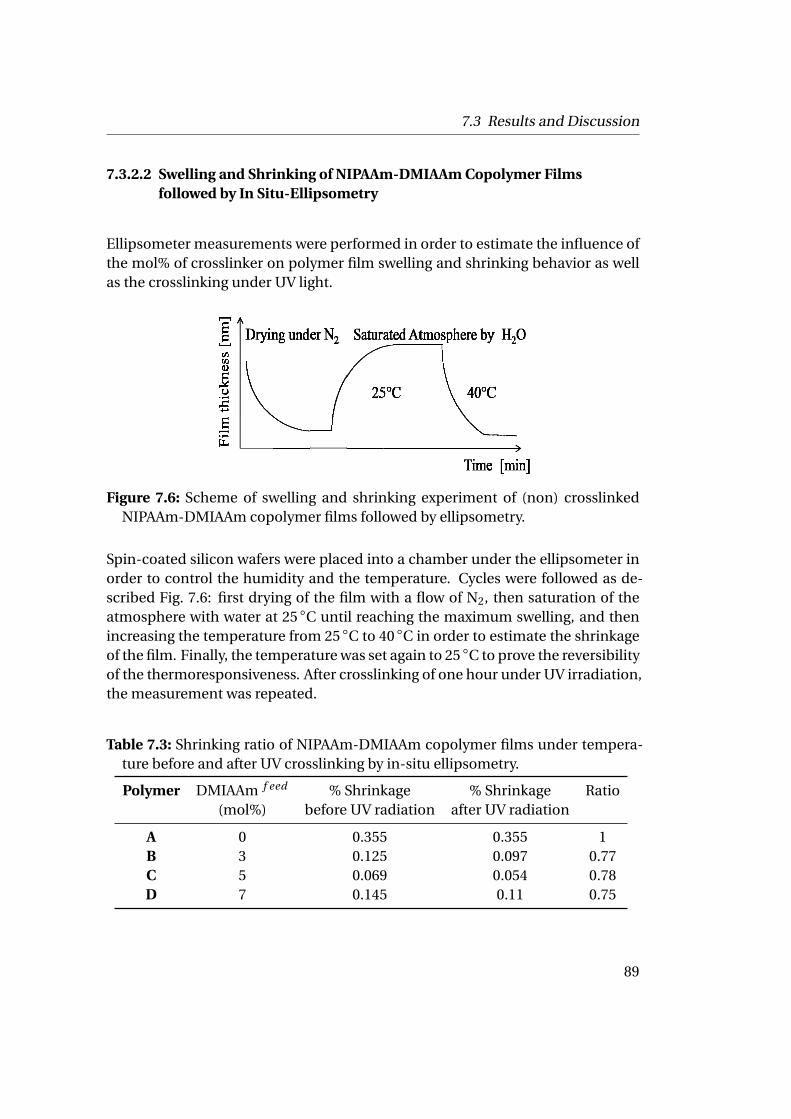
7.3 Results and Discussion
7.3.2.2 Swelling and Shrinking of NIPAAm-DMIAAm Copolymer Filmsfollowed by In Situ-Ellipsometry
Ellipsometer measurements were performed in order to estimate the influence ofthe mol% of crosslinker on polymer film swelling and shrinking behavior as wellas the crosslinking under UV light.
Figure 7.6: Scheme of swelling and shrinking experiment of (non) crosslinkedNIPAAm-DMIAAm copolymer films followed by ellipsometry.
Spin-coated silicon wafers were placed into a chamber under the ellipsometer inorder to control the humidity and the temperature. Cycles were followed as de-scribed Fig. 7.6: first drying of the film with a flow of N2, then saturation of theatmosphere with water at 25 ◦C until reaching the maximum swelling, and thenincreasing the temperature from 25 ◦C to 40 ◦C in order to estimate the shrinkageof the film. Finally, the temperature was set again to 25 ◦C to prove the reversibilityof the thermoresponsiveness. After crosslinking of one hour under UV irradiation,the measurement was repeated.
Table 7.3: Shrinking ratio of NIPAAm-DMIAAm copolymer films under tempera-ture before and after UV crosslinking by in-situ ellipsometry.
Polymer DMIAAm f eed % Shrinkage % Shrinkage Ratio(mol%) before UV radiation after UV radiation
A 0 0.355 0.355 1B 3 0.125 0.097 0.77C 5 0.069 0.054 0.78D 7 0.145 0.11 0.75
89
7 Synthesis & ATRP of the Photocrosslinker DMIAAm
The maximum plateau of swelling and the minimum plateau after increase of thetemperature are used to calculate the percentage of shrinkage. Measurementsof polymer films with different mol% of crosslinker reveal, that the addition ofcrosslinker reduces both the swelling as well as the shrinkage of the polymer filmin comparison to the film without any crosslinker. The results are summarized inTable 7.3. In detail, the crosslinking reduces the shrinking of each film by 20 %.This ratio seems to be independent of the amount of DMIAAm in the copolymeras used in this study (3 mol%-7 mol%).
90
8 Synthesis ofFerritin-P(NIPAAm-DMIAAm)Conjugates
This chapter focuses on the synthesis of ferritin-P(NIPAAm-DMIAAm) conjugates.The grafting from approach was investigated to attach polymer to ferritin particles,as its efficiency for other systems has been shown in the literature85. Grafting fromis divided into two steps: first the particles are modified into a macro-initiator, af-ter which the polymerization is initiated and the polymer begins to grow from theparticles. Horse spleen ferritin, once purified by SEC as monomeric particles, wasmodified as macro-initiator through its addressable ε-amino groups using first azero length crosslinker and, as an alternative, an ATRP initiator which presents ahigh reactivity towards amino groups.
8.1 Modification of Horse Spleen Ferritin into aMacro-Initiator
Performing chemistry on proteins may affect their structure and properties. There-fore, it is necessary to adapt the pH, solvent, concentration and temperature tominimize these effects. For example, the approach of Lele et al. cannot be ap-plied, as the initiator (2-bromoisobutyryl bromide) for conjugation is not watersoluble and precipitates ferritin as soon as it is added to the protein solution64. Inthis work, different approaches in water have been attempted to conjugate ferritinto an ATRP initiator while preserving its monomeric and unfolded state.
91
8 Synthesis of Ferritin-P(NIPAAm-DMIAAm) Conjugates
8.1.1 Conjugation of ATRP Initiator BIBA using a Zero LengthCrosslinker Carbodiimide
Zero length crosslinkers are the smallest available reagent systems for bioconju-gation. These compounds mediate the conjugation of two molecules by form-ing a bond containing no additional atoms. Carbodiimides141 are the most popu-lar zero length crosslinkers to mediate the formation of amide linkages betweena carboxylate and an amine or phosphoamidate linkages between a phosphateand an amine. EDC (1-ethyl-3-(3-dimethylaminopropyl)carbodiimide hydrochlo-ride) is a water soluble carbodiimide and is often used for biochemical conjuga-tion. It is used to form active ester functional groups with carboxylate groups us-ing the water-soluble compound N-hydroxysulfosuccinimide (sulfo-NHS). Sulfo-NHS esters are hydrophilic active groups that react rapidly with amines on tar-get molecules. Sulfo-NHS esters are water soluble, long lived and hydrolyze rela-tively slowly in water203. The advantage of adding sulfo-NHS to EDC is to increasethe stability of the active intermediate, which ultimately reacts with the attack-ing amine. EDC/sulfo-NHS-coupled reactions are highly efficient and usually in-crease the yield of conjugation dramatically over that obtainable solely with EDC.A protein can be incubated in the presence of EDC/sulfo-NHS esters and aminecontaining molecules directly or off-line and the active ester form can be isolatedand then mixed with a second protein or other amine-containing molecules forconjugation. Horse spleen ferritin is incubated with the ATRP initiator BIBA (Bro-moisobutyric acid), EDC and sulfo-NHS to link BIBA to the addressable ε-aminogroups through an amide bond formation (cf. Fig. 8.1).
8.1.1.1 Experimental Part and Results
Materials. Ferritin (Fluka) is purified by size exclusion chromatography to ob-tain monomeric particles. Bromoisobutyric acid (BIBA) (99%, Aldrich), EDC (99%,Fluka) and N-hydroxysulfosuccinimide (sulfo-NHS) (99%, Fluka) were used aspurchased.
Batch reaction. After purification of horse spleen ferritin by SEC, the pH of theprotein solution was adjusted to pH 8. The reaction can be accomplished in onestep by mixing all reagents in the protein solution. Different molar ratios of EDC/sulfo-NHS/BIBA to monomeric ferritin have been tested from 10 to 1000. The
92
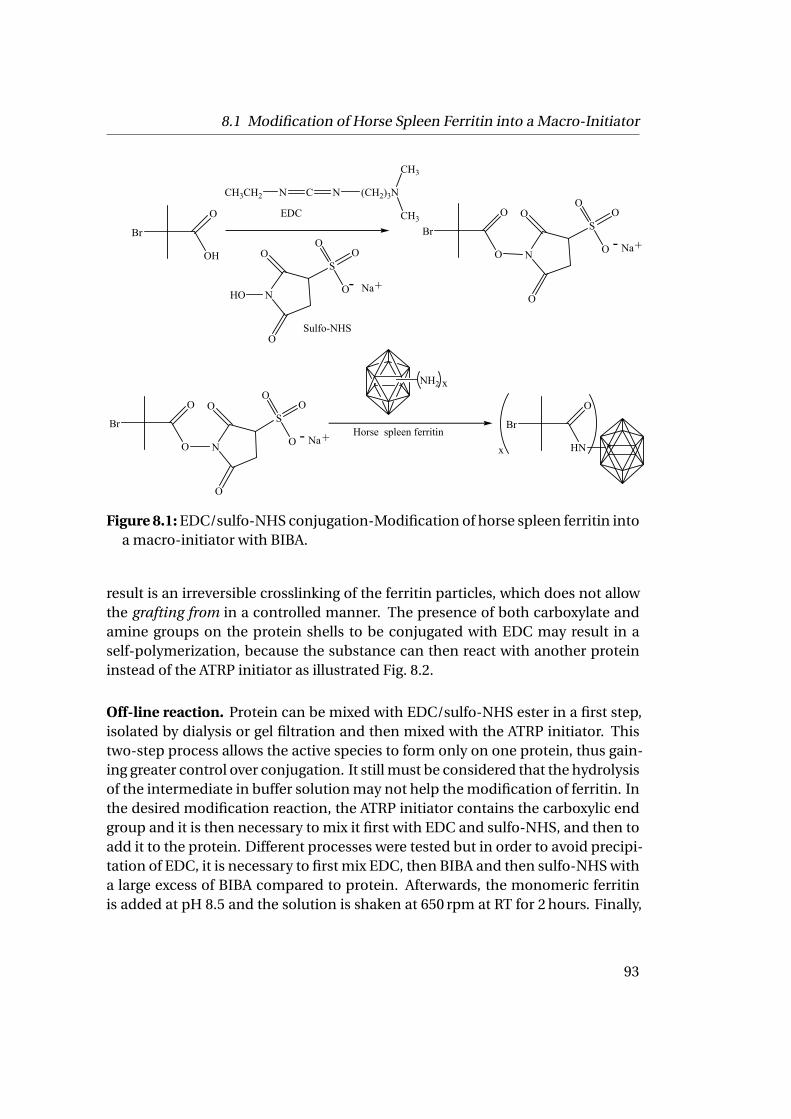
8.1 Modification of Horse Spleen Ferritin into a Macro-Initiator
Br
O
OH
CH3CH2 N C N (CH2)3N
CH3
CH3
N
O
O
S
OO
O-HO Na+
EDC
Sulfo-NHS
N
O
O
S
OO
O - Na+Br
O
O
NH2
Horse spleen ferritinBr
O
x
N
O
O
S
OO
O - Na +Br
O
O x HN *
Figure 8.1: EDC/sulfo-NHS conjugation-Modification of horse spleen ferritin intoa macro-initiator with BIBA.
result is an irreversible crosslinking of the ferritin particles, which does not allowthe grafting from in a controlled manner. The presence of both carboxylate andamine groups on the protein shells to be conjugated with EDC may result in aself-polymerization, because the substance can then react with another proteininstead of the ATRP initiator as illustrated Fig. 8.2.
Off-line reaction. Protein can be mixed with EDC/sulfo-NHS ester in a first step,isolated by dialysis or gel filtration and then mixed with the ATRP initiator. Thistwo-step process allows the active species to form only on one protein, thus gain-ing greater control over conjugation. It still must be considered that the hydrolysisof the intermediate in buffer solution may not help the modification of ferritin. Inthe desired modification reaction, the ATRP initiator contains the carboxylic endgroup and it is then necessary to mix it first with EDC and sulfo-NHS, and then toadd it to the protein. Different processes were tested but in order to avoid precipi-tation of EDC, it is necessary to first mix EDC, then BIBA and then sulfo-NHS witha large excess of BIBA compared to protein. Afterwards, the monomeric ferritinis added at pH 8.5 and the solution is shaken at 650 rpm at RT for 2 hours. Finally,
93
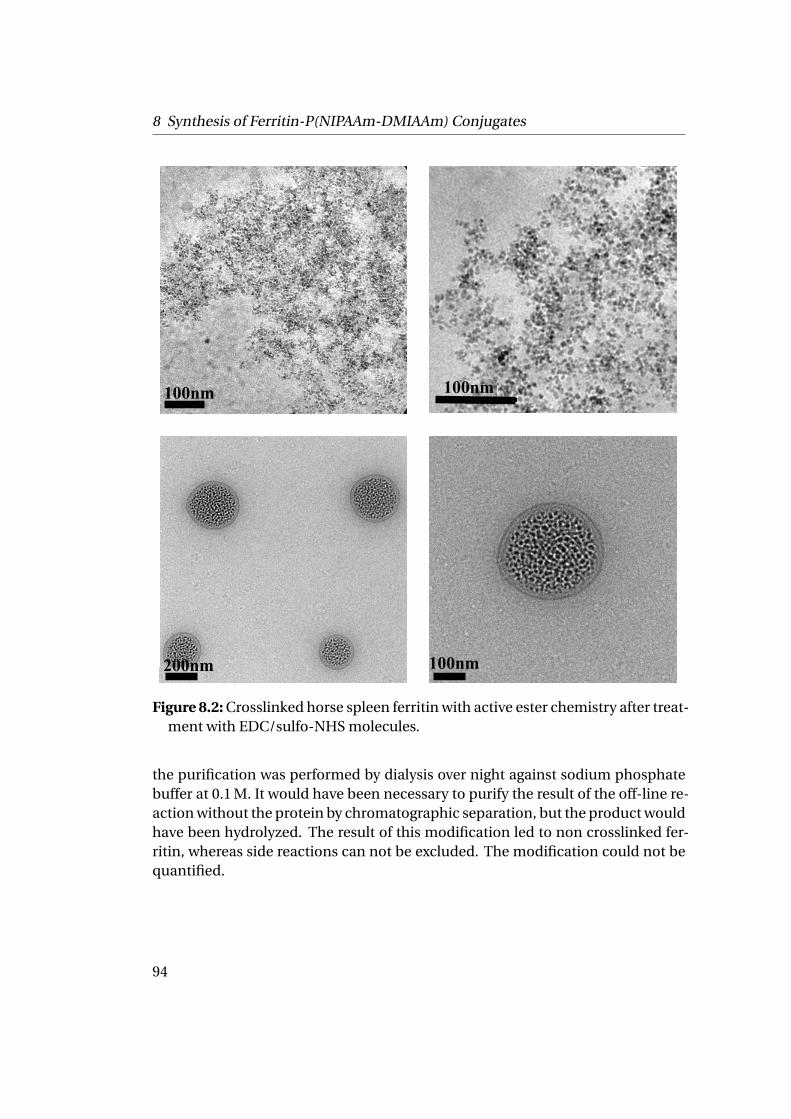
8 Synthesis of Ferritin-P(NIPAAm-DMIAAm) Conjugates
100nm
100nm
100nm
100nm
200nm
Figure 8.2: Crosslinked horse spleen ferritin with active ester chemistry after treat-ment with EDC/sulfo-NHS molecules.
the purification was performed by dialysis over night against sodium phosphatebuffer at 0.1 M. It would have been necessary to purify the result of the off-line re-action without the protein by chromatographic separation, but the product wouldhave been hydrolyzed. The result of this modification led to non crosslinked fer-ritin, whereas side reactions can not be excluded. The modification could not bequantified.
94
8.1 Modification of Horse Spleen Ferritin into a Macro-Initiator
8.1.2 Protection of Carboxylate Groups of the Protein
Another approach is to block the addressable carboxylic groups of ferritin esti-mated at 16821 in order to avoid the crosslinking of ferritin particles due to theactivation of carboxylate groups by EDC. One possibility to achieve this is to firstprotect the primary amine of the side chain ε-amino groups of lysine residues ina reversible manner, then to irreversibly block the carboxylate groups of the sidechain of glutamic acid residues, and finally to deprotect the ε-amino groups inwater. The conjugation is performed using the couple EDC/sulfo-NHS and BIBA.The drawbacks of this method are that it is carried out in four steps and the pro-tein structure may suffer from all the chemistry and that the yield can be low.
8.1.2.1 Materials
Citraconic anhydride (99 %, Fluka), ethanolamine (99 %, Aldrich) and EDC (99 %,Fluka) were used as purchased. Trinitrobenzene sulfonate acid (TNBS) (Fluka,99 %) was used following the protocol from Habeeb et al.143.
8.1.2.2 Experimental Part
The first step is the reversible protection of NH2 groups of ferritin. The pH of themonomeric ferritin solution is adjusted between 8 and 9 by addition of NaOH. Itis necessary to use a sodium phosphate buffer or another non amine containingbuffer (no Tris buffer). The citraconic anhydride is then added with a molar excessof 10 to 50. The solution is then shaken at 800 rpm for two hours. The solutionwas purified by dialysis over night. The following step is the irreversible blockingof the carboxylate groups of the protein using the carbodiimide conjugation. ThepH was adjusted at 7.5, even if the optimum conditions are between pH 4.7 and6, to avoid the hydrolysis of EDC. The ethanolamine was added at 0.1 mol·L−1 fol-lowed by 10 mg of EDC per milliliter of the solution. The reaction was kept at RTfor two to four hours. The purification and the next step were performed simulta-neously. The solution was dialyzed at pH 3 to 4 in a sodium phosphate buffer. Itallows abortion of the previous reaction by releasing the excess of EDC and the de-protection of the ε-amino groups, as illustrated Fig. 8.3. The modification of the
95
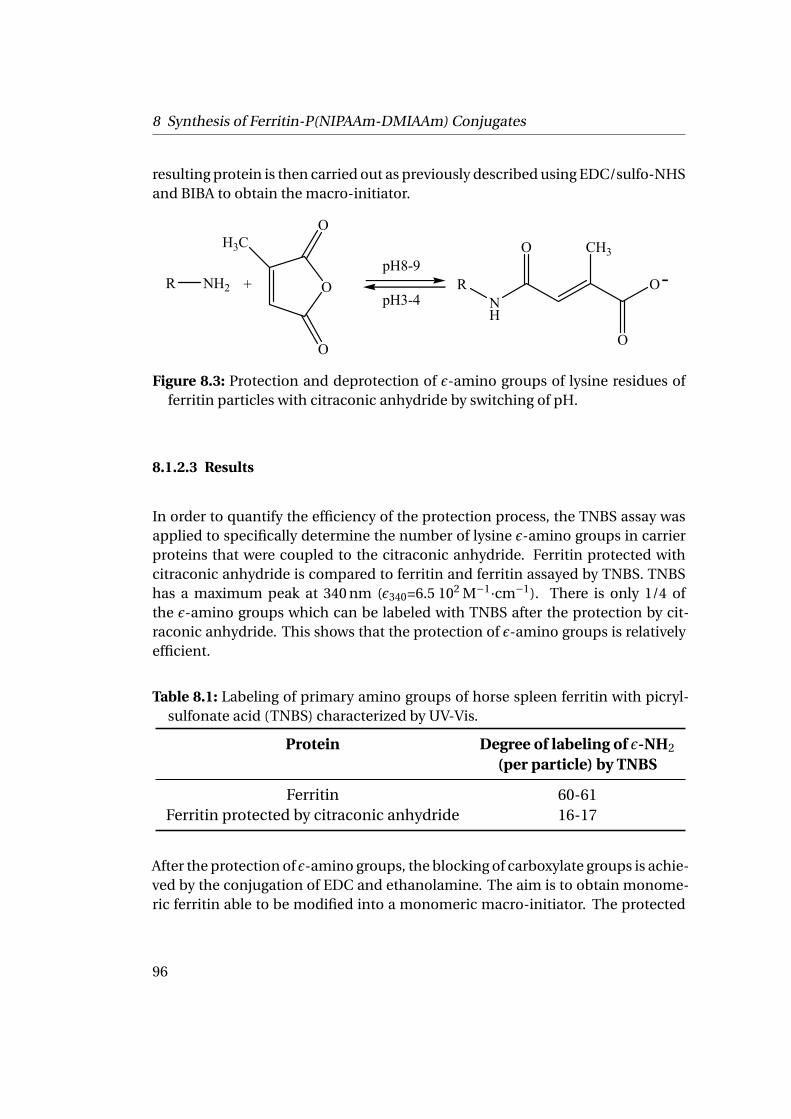
8 Synthesis of Ferritin-P(NIPAAm-DMIAAm) Conjugates
resulting protein is then carried out as previously described using EDC/sulfo-NHSand BIBA to obtain the macro-initiator.
R NH2 +pH8-9
O
O
H3CO
RNH
O
O
O
CH3
-pH3-4
Figure 8.3: Protection and deprotection of ε-amino groups of lysine residues offerritin particles with citraconic anhydride by switching of pH.
8.1.2.3 Results
In order to quantify the efficiency of the protection process, the TNBS assay wasapplied to specifically determine the number of lysine ε-amino groups in carrierproteins that were coupled to the citraconic anhydride. Ferritin protected withcitraconic anhydride is compared to ferritin and ferritin assayed by TNBS. TNBShas a maximum peak at 340 nm (ε340=6.5 102 M−1·cm−1). There is only 1/4 ofthe ε-amino groups which can be labeled with TNBS after the protection by cit-raconic anhydride. This shows that the protection of ε-amino groups is relativelyefficient.
Table 8.1: Labeling of primary amino groups of horse spleen ferritin with picryl-sulfonate acid (TNBS) characterized by UV-Vis.
Protein Degree of labeling of ε-NH2
(per particle) by TNBS
Ferritin 60-61Ferritin protected by citraconic anhydride 16-17
After the protection of ε-amino groups, the blocking of carboxylate groups is achie-ved by the conjugation of EDC and ethanolamine. The aim is to obtain monome-ric ferritin able to be modified into a monomeric macro-initiator. The protected
96
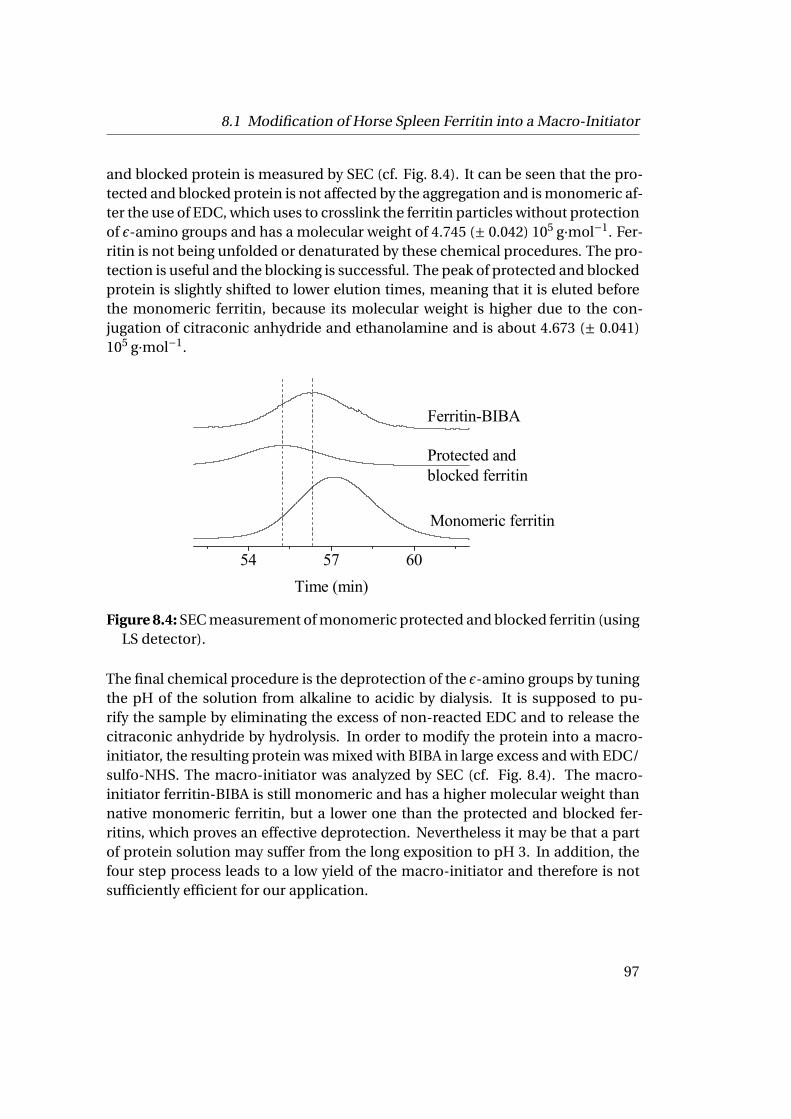
8.1 Modification of Horse Spleen Ferritin into a Macro-Initiator
and blocked protein is measured by SEC (cf. Fig. 8.4). It can be seen that the pro-tected and blocked protein is not affected by the aggregation and is monomeric af-ter the use of EDC, which uses to crosslink the ferritin particles without protectionof ε-amino groups and has a molecular weight of 4.745 (± 0.042) 105 g·mol−1. Fer-ritin is not being unfolded or denaturated by these chemical procedures. The pro-tection is useful and the blocking is successful. The peak of protected and blockedprotein is slightly shifted to lower elution times, meaning that it is eluted beforethe monomeric ferritin, because its molecular weight is higher due to the con-jugation of citraconic anhydride and ethanolamine and is about 4.673 (± 0.041)105 g·mol−1.
54 57 60
Protected and blocked ferritin
Time (min)
Ferritin-BIBA
Monomeric ferritin
Figure 8.4: SEC measurement of monomeric protected and blocked ferritin (usingLS detector).
The final chemical procedure is the deprotection of the ε-amino groups by tuningthe pH of the solution from alkaline to acidic by dialysis. It is supposed to pu-rify the sample by eliminating the excess of non-reacted EDC and to release thecitraconic anhydride by hydrolysis. In order to modify the protein into a macro-initiator, the resulting protein was mixed with BIBA in large excess and with EDC/sulfo-NHS. The macro-initiator was analyzed by SEC (cf. Fig. 8.4). The macro-initiator ferritin-BIBA is still monomeric and has a higher molecular weight thannative monomeric ferritin, but a lower one than the protected and blocked fer-ritins, which proves an effective deprotection. Nevertheless it may be that a partof protein solution may suffer from the long exposition to pH 3. In addition, thefour step process leads to a low yield of the macro-initiator and therefore is notsufficiently efficient for our application.
97
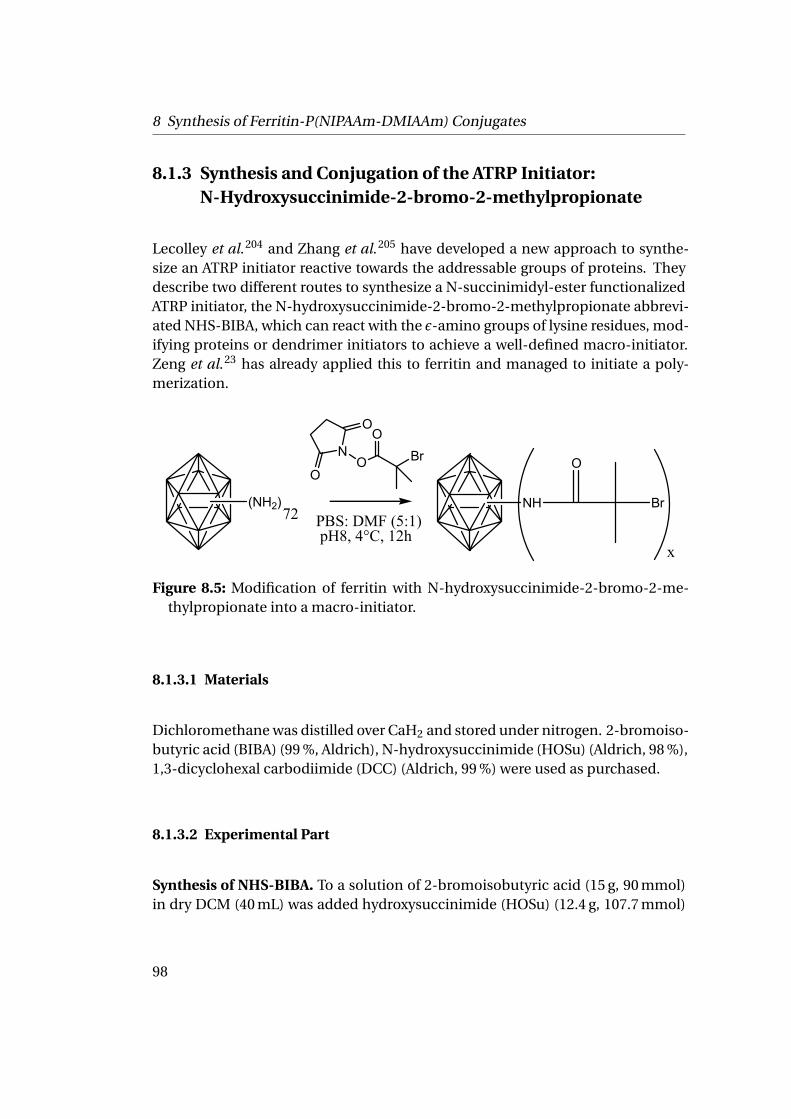
8 Synthesis of Ferritin-P(NIPAAm-DMIAAm) Conjugates
8.1.3 Synthesis and Conjugation of the ATRP Initiator:N-Hydroxysuccinimide-2-bromo-2-methylpropionate
Lecolley et al.204 and Zhang et al.205 have developed a new approach to synthe-size an ATRP initiator reactive towards the addressable groups of proteins. Theydescribe two different routes to synthesize a N-succinimidyl-ester functionalizedATRP initiator, the N-hydroxysuccinimide-2-bromo-2-methylpropionate abbrevi-ated NHS-BIBA, which can react with the ε-amino groups of lysine residues, mod-ifying proteins or dendrimer initiators to achieve a well-defined macro-initiator.Zeng et al.23 has already applied this to ferritin and managed to initiate a poly-merization.
(NH2)
NO
BrO
O
O
PBS: DMF (5:1)pH8, 4°C, 12h
NH
O
Br
x
72
Figure 8.5: Modification of ferritin with N-hydroxysuccinimide-2-bromo-2-me-thylpropionate into a macro-initiator.
8.1.3.1 Materials
Dichloromethane was distilled over CaH2 and stored under nitrogen. 2-bromoiso-butyric acid (BIBA) (99 %, Aldrich), N-hydroxysuccinimide (HOSu) (Aldrich, 98 %),1,3-dicyclohexal carbodiimide (DCC) (Aldrich, 99 %) were used as purchased.
8.1.3.2 Experimental Part
Synthesis of NHS-BIBA. To a solution of 2-bromoisobutyric acid (15 g, 90 mmol)in dry DCM (40 mL) was added hydroxysuccinimide (HOSu) (12.4 g, 107.7 mmol)
98
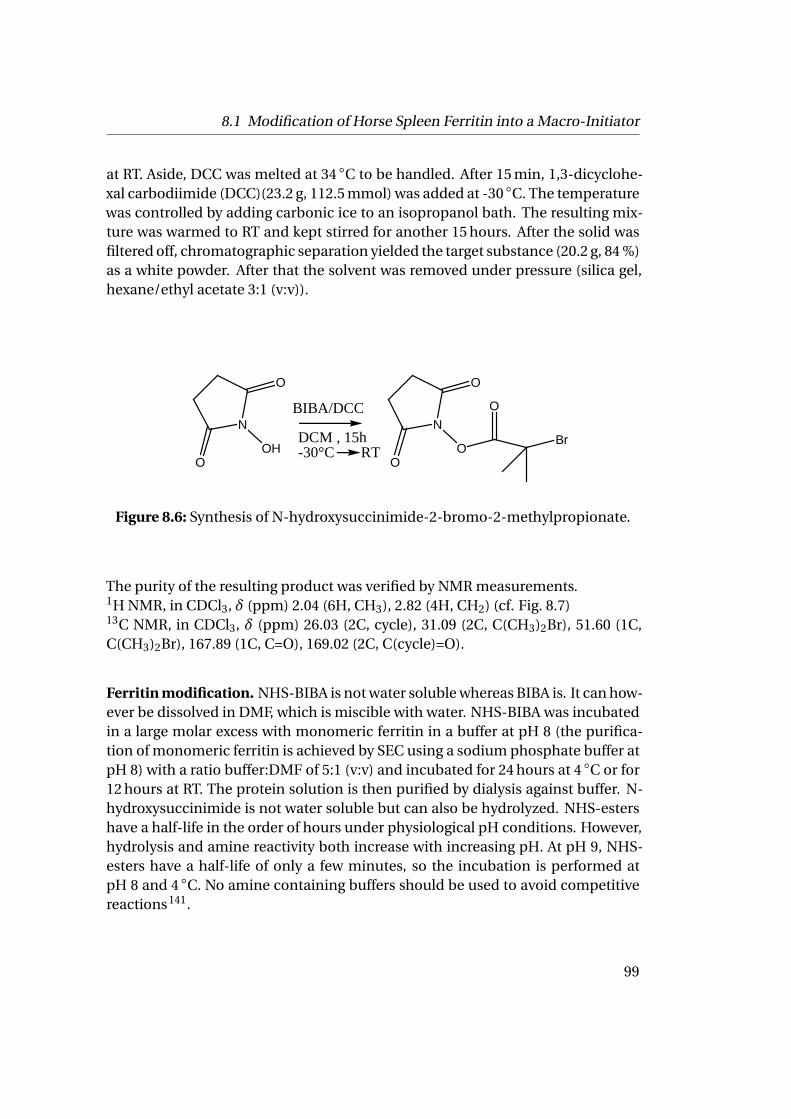
8.1 Modification of Horse Spleen Ferritin into a Macro-Initiator
at RT. Aside, DCC was melted at 34 ◦C to be handled. After 15 min, 1,3-dicyclohe-xal carbodiimide (DCC)(23.2 g, 112.5 mmol) was added at -30 ◦C. The temperaturewas controlled by adding carbonic ice to an isopropanol bath. The resulting mix-ture was warmed to RT and kept stirred for another 15 hours. After the solid wasfiltered off, chromatographic separation yielded the target substance (20.2 g, 84 %)as a white powder. After that the solvent was removed under pressure (silica gel,hexane/ethyl acetate 3:1 (v:v)).
N
O
OO
Br
ON
O
OOH
BIBA/DCC
DCM , 15h-30°C RT
Figure 8.6: Synthesis of N-hydroxysuccinimide-2-bromo-2-methylpropionate.
The purity of the resulting product was verified by NMR measurements.1H NMR, in CDCl3, δ (ppm) 2.04 (6H, CH3), 2.82 (4H, CH2) (cf. Fig. 8.7)13C NMR, in CDCl3, δ (ppm) 26.03 (2C, cycle), 31.09 (2C, C(CH3)2Br), 51.60 (1C,C(CH3)2Br), 167.89 (1C, C=O), 169.02 (2C, C(cycle)=O).
Ferritin modification. NHS-BIBA is not water soluble whereas BIBA is. It can how-ever be dissolved in DMF, which is miscible with water. NHS-BIBA was incubatedin a large molar excess with monomeric ferritin in a buffer at pH 8 (the purifica-tion of monomeric ferritin is achieved by SEC using a sodium phosphate buffer atpH 8) with a ratio buffer:DMF of 5:1 (v:v) and incubated for 24 hours at 4 ◦C or for12 hours at RT. The protein solution is then purified by dialysis against buffer. N-hydroxysuccinimide is not water soluble but can also be hydrolyzed. NHS-estershave a half-life in the order of hours under physiological pH conditions. However,hydrolysis and amine reactivity both increase with increasing pH. At pH 9, NHS-esters have a half-life of only a few minutes, so the incubation is performed atpH 8 and 4 ◦C. No amine containing buffers should be used to avoid competitivereactions141.
99
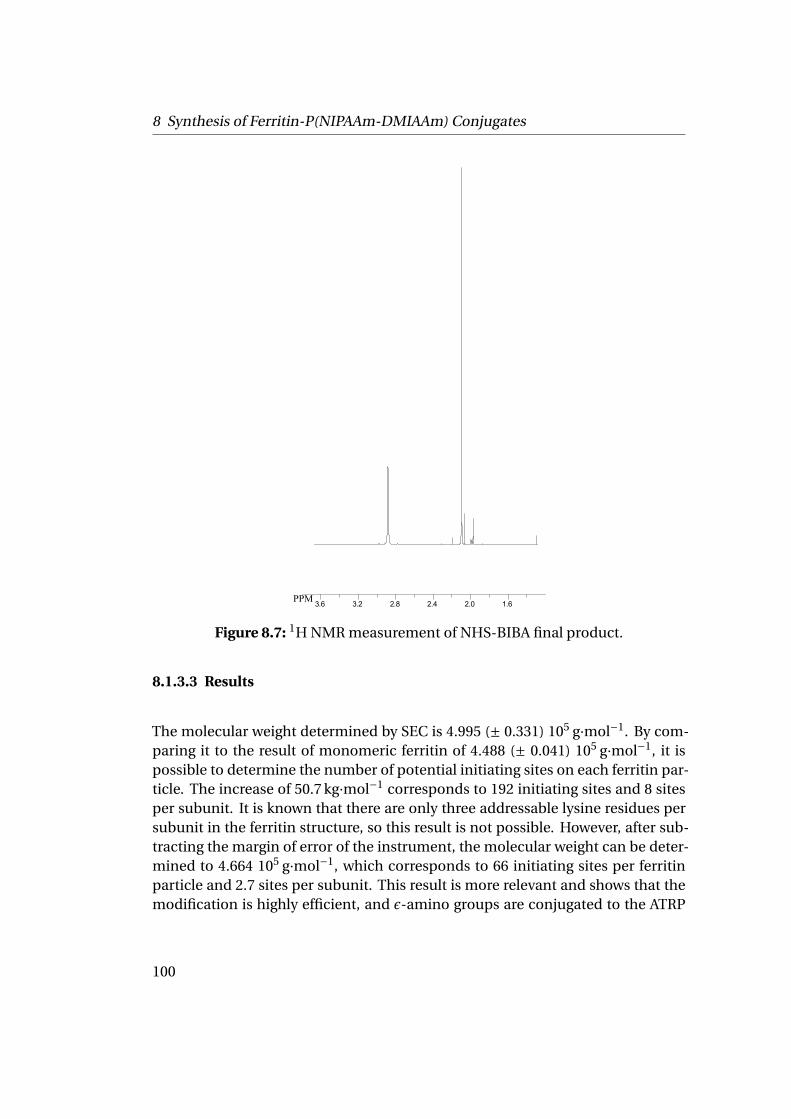
8 Synthesis of Ferritin-P(NIPAAm-DMIAAm) Conjugates
3.6 3.2 2.8 2.4 2.0 1.6 PPM
Figure 8.7: 1H NMR measurement of NHS-BIBA final product.
8.1.3.3 Results
The molecular weight determined by SEC is 4.995 (± 0.331) 105 g·mol−1. By com-paring it to the result of monomeric ferritin of 4.488 (± 0.041) 105 g·mol−1, it ispossible to determine the number of potential initiating sites on each ferritin par-ticle. The increase of 50.7 kg·mol−1 corresponds to 192 initiating sites and 8 sitesper subunit. It is known that there are only three addressable lysine residues persubunit in the ferritin structure, so this result is not possible. However, after sub-tracting the margin of error of the instrument, the molecular weight can be deter-mined to 4.664 105 g·mol−1, which corresponds to 66 initiating sites per ferritinparticle and 2.7 sites per subunit. This result is more relevant and shows that themodification is highly efficient, and ε-amino groups are conjugated to the ATRP
100
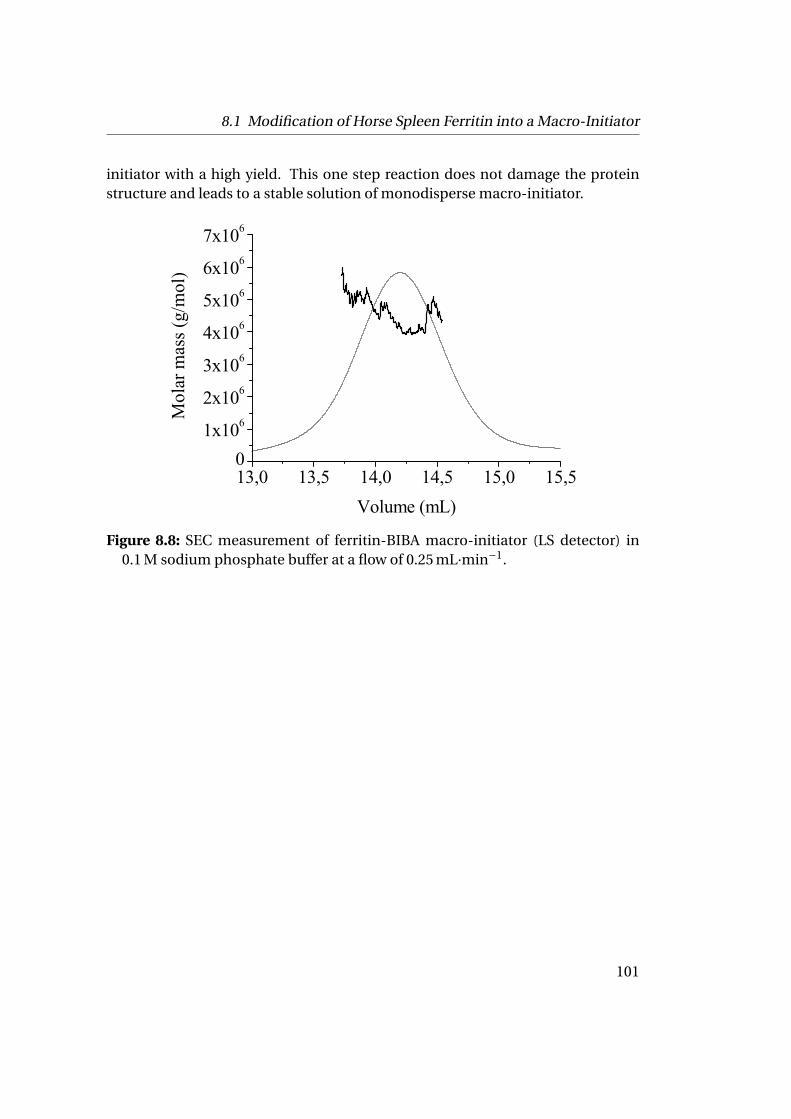
8.1 Modification of Horse Spleen Ferritin into a Macro-Initiator
initiator with a high yield. This one step reaction does not damage the proteinstructure and leads to a stable solution of monodisperse macro-initiator.
13,0 13,5 14,0 14,5 15,0 15,50
1x10⁶
2x10⁶
3x10⁶
4x10⁶
5x10⁶
6x10⁶
7x10⁶
Mol
ar m
ass (
g/m
ol)
Volume (mL) Figure 8.8: SEC measurement of ferritin-BIBA macro-initiator (LS detector) in
0.1 M sodium phosphate buffer at a flow of 0.25 mL·min−1.
101
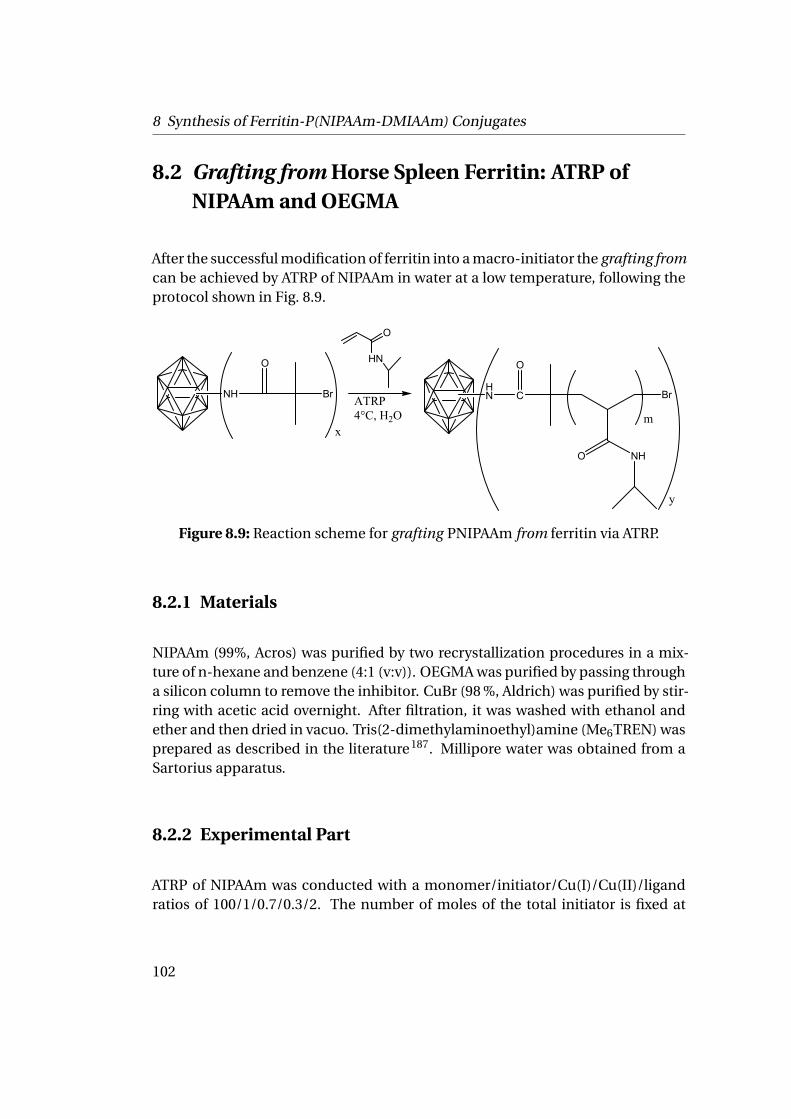
8 Synthesis of Ferritin-P(NIPAAm-DMIAAm) Conjugates
8.2 Grafting from Horse Spleen Ferritin: ATRP ofNIPAAm and OEGMA
After the successful modification of ferritin into a macro-initiator the grafting fromcan be achieved by ATRP of NIPAAm in water at a low temperature, following theprotocol shown in Fig. 8.9.
O
HN
HN C
O NH
Br
m
y
O
ATRP4°C, H2O
NH
O
Br
x
Figure 8.9: Reaction scheme for grafting PNIPAAm from ferritin via ATRP.
8.2.1 Materials
NIPAAm (99%, Acros) was purified by two recrystallization procedures in a mix-ture of n-hexane and benzene (4:1 (v:v)). OEGMA was purified by passing througha silicon column to remove the inhibitor. CuBr (98 %, Aldrich) was purified by stir-ring with acetic acid overnight. After filtration, it was washed with ethanol andether and then dried in vacuo. Tris(2-dimethylaminoethyl)amine (Me6TREN) wasprepared as described in the literature187. Millipore water was obtained from aSartorius apparatus.
8.2.2 Experimental Part
ATRP of NIPAAm was conducted with a monomer/initiator/Cu(I)/Cu(II)/ligandratios of 100/1/0.7/0.3/2. The number of moles of the total initiator is fixed at
102
8.2 Grafting from Horse Spleen Ferritin: ATRP of NIPAAm and OEGMA
4·10−6 mol, corresponding to the total amount of initiator conjugated to ferritinand the sacrificial initiator (BIBA). The dialyzed macro-initiator ferritin is shakenwith NIPAAm and BIBA until complete dissolution. The sacrificial initiator wasdissolved separately from a concentrated batch in water, and added to increasethe concentration of initiator into the solution. This allows a faster and bettercontrolled polymerization. In a second flask, CuBr, CuBr2 and Me6TREN weremixed, and dissolved in Millipore water. Both solutions were then sealed and de-gassed for 15 min in an ice bath. 0.5 mL of the copper/ligand solution was addedto the ferritin solution under agitation. The polymerization was performed over24 hours, as it is carried out in a highly diluted solution. The conjugates are exten-sively dialyzed against water to remove the catalyst (cut-off 1 kDa). Then the con-jugates are dialyzed with a higher cut-off membrane (25 kDa-50 kDa) to removethe polymer formed by the sacrificial initiator. They were then freeze-dried to re-move the solvent for further characterization. The solution of conjugates was keptat 4 ◦C and a part of it was freeze-dried for further analysis. Conjugates were stablein water, as no precipitation could be observed even after months. ATRP was alsoperformed with OEGMA and/or by incorporating the photocrosslinker monomerDMIAAm at about 7 mol% to the solution batch.
Polymer characterization. PNIPAAm was characterized by gas phase chromatog-raphy (GPC) using a 0.05 M solution of LiBr in dimethylacetamide (DMAc) as elu-ent. PSS GRAM columns (300 mm·8 mm, 7µm): 103, 102 Å (PSS, Mainz, Germany)were thermostated at 70 ◦C. A 0.4 wt% (20µL) polymer solution was injected atan elution rate of 0.72 mL·min−1. RI and UV (λ=270 nm) were used for detection.Polystyrene standards were used to calibrate the columns, and methyl benzoatewas used as an internal standard. PEGMA was characterized by size exclusionchromatography using as eluent a sodium phosphate buffer at pH 7.4. LS, RI andUV ((λ=280 nm) are used for detection without needing standards for calibration.Polymer solutions were injected at an elution rate of 0.25 mL·min−1. The conver-sion of each sample was determined directly after quenching into liquid nitrogen.1H-NMR spectra were recorded on a Bruker AC-25 spectrometer in D2O (refer-ence peak δ = 7.26 ppm) at RT. For conversion purposes, DMSO was used as aninternal standard ( δ = 2.7 ppm). MALDI-ToF mass spectra were recorded on aBruker Reflex III spectrometer in linear mode using a 337 nm nitrogen laser andan accelerating potential of 20 kV in positive ion and reflectron modes. For poly-mer chains, 2,5-dihydroxybenzoic acid (20 mg· mL−1) was used as a matrix, andpolymer samples were dissolved in THF (10 mg· mL−1). A droplet of 5µL of thismixture was spotted on the steel target plate, and it was dried in vacuo.
103
8 Synthesis of Ferritin-P(NIPAAm-DMIAAm) Conjugates
Conjugates characterization. The conjugates samples were characterized by tur-bidity measurement using a photospectrometer to determine their cloud point atone wavelength (λ=600 nm). Dynamic light scattering measurements were per-formed on filtrated and diluted solutions (20µL nylon filter) to avoid turbidity,which could damage the detector, as the measurements were done as a function oftemperature. TEM samples were prepared by glow discharge on formvar coppergrids and spotting 2µL of solution and drying the droplet with a filter paper. AFMsamples were prepared by spin coating or drop casting the solution onto a freshlycleaved mica sheet or silicon wafer with plasma cleaning as a pretreatment. To an-alyze the conjugates by MALDI-ToF MS and SDS-PAGE, the ferritin-polymer parti-cles had to be denaturated in order to fly for MALDI-ToF MS and be comparativefor the SDS-PAGE measurement. 100µL of concentrated ferritin-polymer solu-tion was added to a 300µL solution of urea at 7 M and 10µL of 2-mercaptoethanol.Afterwards 5 mg of trypsin were added to the solution. The solution was thenincubated for 12 hours at 37 ◦C. The denaturated conjugates were characterizedby MALDI-ToF MS (as described previously) and SDS-PAGE using a prestainedmarker from 10 to 220 kDa. For characterization of Ferritin-P(NIPAAm-DMIAAm)conjugates, sinapic acid (saturated solution in acetonitrile:H2O (1:1 v:v)) was usedas a matrix, sodium trifluoroacetate salt (NaTFA) was used as a cationicating agentat 10 mg·mL−1, and conjugates samples were prepared following the Ziptip C18protocol.
8.2.3 Results
Polymer chain characterization. Every polymerization was followed by 1H-NMRmeasurements using DMSO in D2O as the internal standard. All polymerizationswere completed to at least 90% within 24 hours. Under the conditions of the NMR-experiment, the protein peaks cannot be observed, whereas the disappearance ofNIPAAm can be easily followed. For this, the intensity of the peaks correspondingto the vinyl group at δ=5.72-5.8 ppm (dd, CH(H)=) was investigated. The molec-ular characterization of the polymer-ferritin conjugate imposes many challengesbecause of their high molecular weight. Thus, the ferritin cage was denaturedin order to investigate the subunit conjugates by GPC and MALDI-ToF MS. GPCof the denaturated PNIPAAm conjugates could not be measured in aqueous solu-tion because PNIPAAm absorbs on the acrylamide column. Therefore, it has to bemeasured in organic solvents, which alters the protein’s properties and offers onlynon reproducible results. The characterization of ferritin-PEGMA conjugates was
104
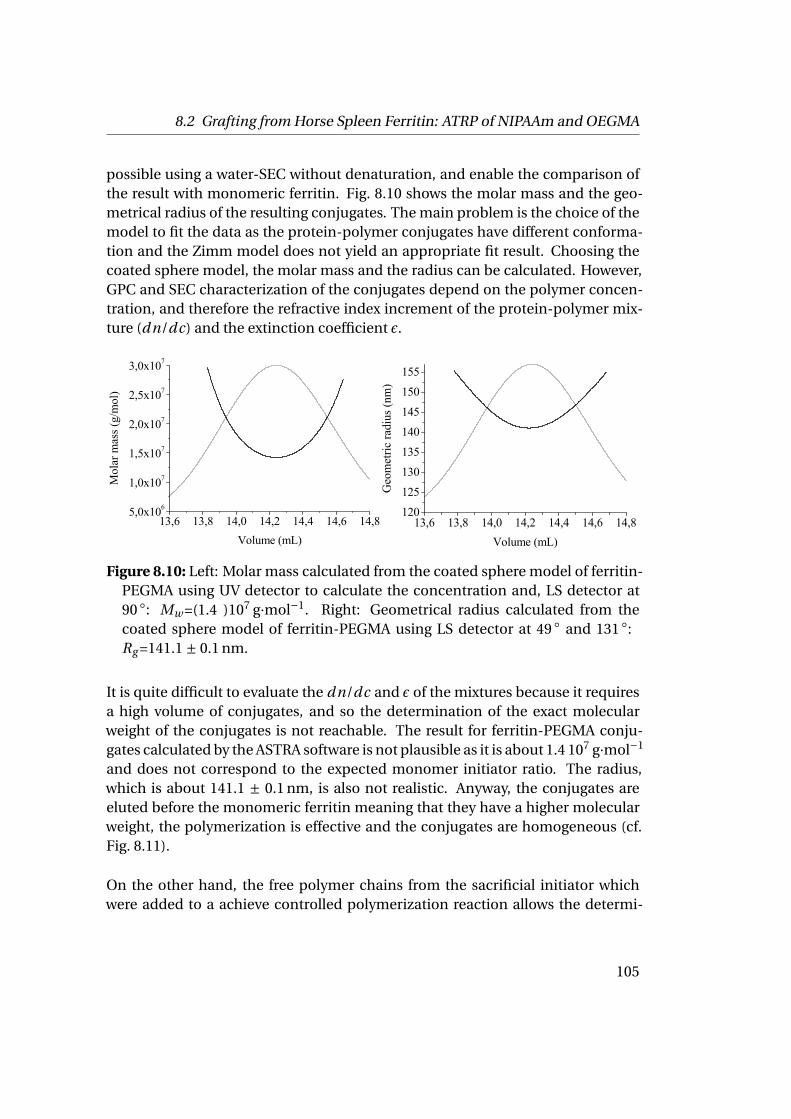
8.2 Grafting from Horse Spleen Ferritin: ATRP of NIPAAm and OEGMA
possible using a water-SEC without denaturation, and enable the comparison ofthe result with monomeric ferritin. Fig. 8.10 shows the molar mass and the geo-metrical radius of the resulting conjugates. The main problem is the choice of themodel to fit the data as the protein-polymer conjugates have different conforma-tion and the Zimm model does not yield an appropriate fit result. Choosing thecoated sphere model, the molar mass and the radius can be calculated. However,GPC and SEC characterization of the conjugates depend on the polymer concen-tration, and therefore the refractive index increment of the protein-polymer mix-ture (dn/dc) and the extinction coefficient ε.
13,6 13,8 14,0 14,2 14,4 14,6 14,85,0x106
1,0x10⁷
1,5x10⁷
2,0x10⁷
2,5x10⁷
3,0x10⁷
Mol
ar m
ass (
g/m
ol)
Volume (mL)13,6 13,8 14,0 14,2 14,4 14,6 14,8
120
125
130
135
140
145
150
155G
eom
etric
radi
us (n
m)
Volume (mL)
Figure 8.10: Left: Molar mass calculated from the coated sphere model of ferritin-PEGMA using UV detector to calculate the concentration and, LS detector at90 ◦: Mw =(1.4 )107 g·mol−1. Right: Geometrical radius calculated from thecoated sphere model of ferritin-PEGMA using LS detector at 49 ◦ and 131 ◦:Rg =141.1 ± 0.1 nm.
It is quite difficult to evaluate the dn/dc and ε of the mixtures because it requiresa high volume of conjugates, and so the determination of the exact molecularweight of the conjugates is not reachable. The result for ferritin-PEGMA conju-gates calculated by the ASTRA software is not plausible as it is about 1.4 107 g·mol−1
and does not correspond to the expected monomer initiator ratio. The radius,which is about 141.1 ± 0.1 nm, is also not realistic. Anyway, the conjugates areeluted before the monomeric ferritin meaning that they have a higher molecularweight, the polymerization is effective and the conjugates are homogeneous (cf.Fig. 8.11).
On the other hand, the free polymer chains from the sacrificial initiator whichwere added to a achieve controlled polymerization reaction allows the determi-
105
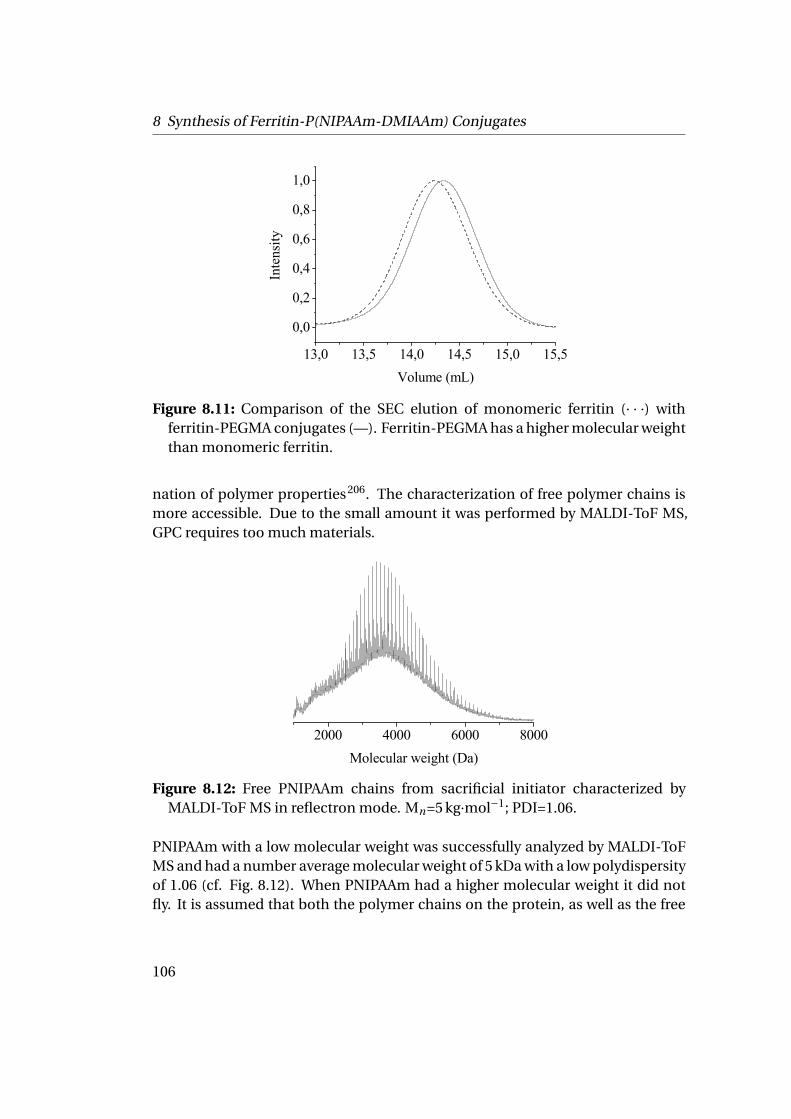
8 Synthesis of Ferritin-P(NIPAAm-DMIAAm) Conjugates
13,0 13,5 14,0 14,5 15,0 15,5
0,0
0,2
0,4
0,6
0,8
1,0
Inte
nsity
Volume (mL)
Figure 8.11: Comparison of the SEC elution of monomeric ferritin (· · ·) withferritin-PEGMA conjugates (—). Ferritin-PEGMA has a higher molecular weightthan monomeric ferritin.
nation of polymer properties206. The characterization of free polymer chains ismore accessible. Due to the small amount it was performed by MALDI-ToF MS,GPC requires too much materials.
2000 4000 6000 8000Molecular weight (Da)
Figure 8.12: Free PNIPAAm chains from sacrificial initiator characterized by
MALDI-ToF MS in reflectron mode. Mn=5 kg·mol−1; PDI=1.06.
PNIPAAm with a low molecular weight was successfully analyzed by MALDI-ToFMS and had a number average molecular weight of 5 kDa with a low polydispersityof 1.06 (cf. Fig. 8.12). When PNIPAAm had a higher molecular weight it did notfly. It is assumed that both the polymer chains on the protein, as well as the free
106
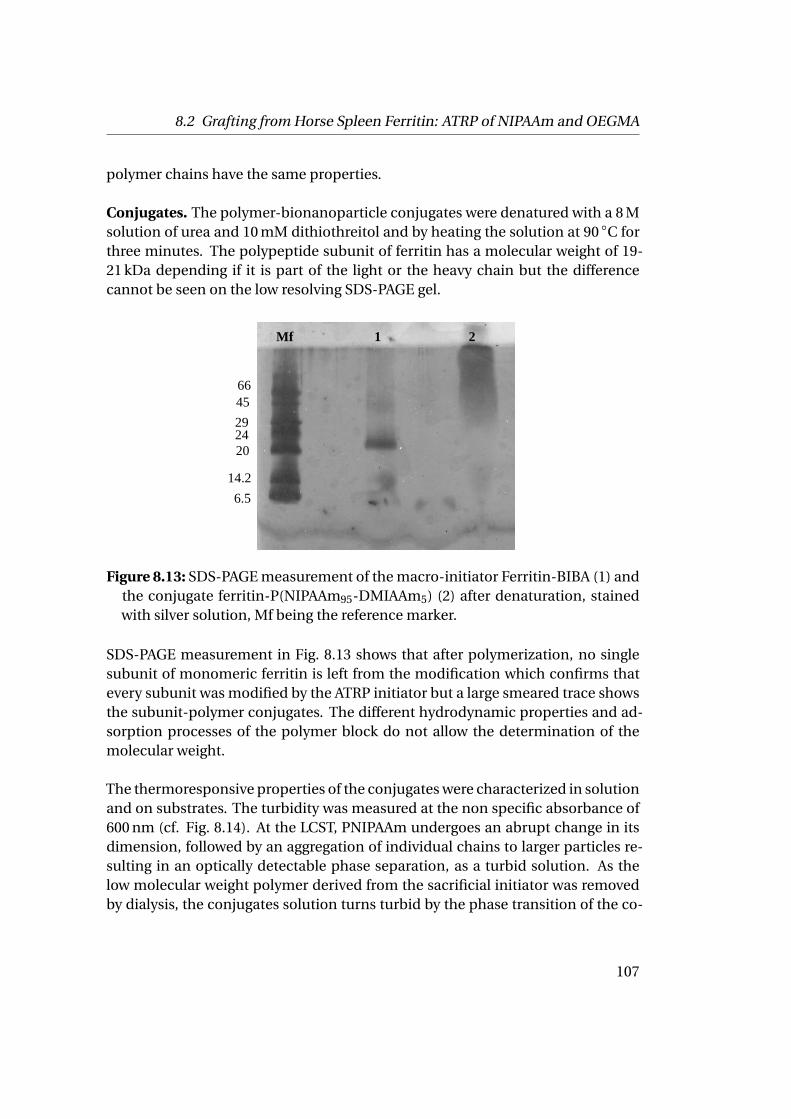
8.2 Grafting from Horse Spleen Ferritin: ATRP of NIPAAm and OEGMA
polymer chains have the same properties.
Conjugates. The polymer-bionanoparticle conjugates were denatured with a 8 Msolution of urea and 10 mM dithiothreitol and by heating the solution at 90 ◦C forthree minutes. The polypeptide subunit of ferritin has a molecular weight of 19-21 kDa depending if it is part of the light or the heavy chain but the differencecannot be seen on the low resolving SDS-PAGE gel.
24 29
66
Mf 1 2
Mf 1 Ferritin-BIBA 2 Ferritin-PNIPAAm97-DMIAAm3
20
14.2 6.5
45
Figure 8.13: SDS-PAGE measurement of the macro-initiator Ferritin-BIBA (1) andthe conjugate ferritin-P(NIPAAm95-DMIAAm5) (2) after denaturation, stainedwith silver solution, Mf being the reference marker.
SDS-PAGE measurement in Fig. 8.13 shows that after polymerization, no singlesubunit of monomeric ferritin is left from the modification which confirms thatevery subunit was modified by the ATRP initiator but a large smeared trace showsthe subunit-polymer conjugates. The different hydrodynamic properties and ad-sorption processes of the polymer block do not allow the determination of themolecular weight.
The thermoresponsive properties of the conjugates were characterized in solutionand on substrates. The turbidity was measured at the non specific absorbance of600 nm (cf. Fig. 8.14). At the LCST, PNIPAAm undergoes an abrupt change in itsdimension, followed by an aggregation of individual chains to larger particles re-sulting in an optically detectable phase separation, as a turbid solution. As thelow molecular weight polymer derived from the sacrificial initiator was removedby dialysis, the conjugates solution turns turbid by the phase transition of the co-
107
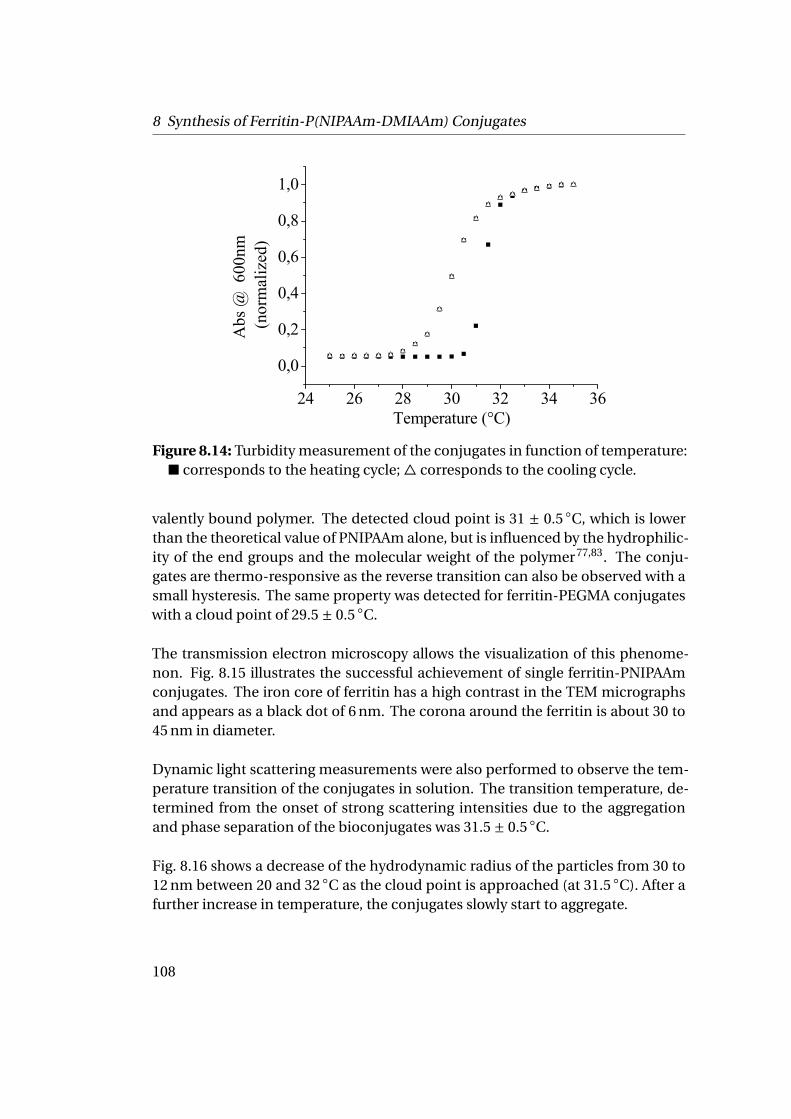
8 Synthesis of Ferritin-P(NIPAAm-DMIAAm) Conjugates
24 26 28 30 32 34 36
0,0
0,2
0,4
0,6
0,8
1,0
Abs
@ 6
00nm
(nor
mal
ized
)
Temperature (°C) Figure 8.14: Turbidity measurement of the conjugates in function of temperature:
■ corresponds to the heating cycle; 4 corresponds to the cooling cycle.
valently bound polymer. The detected cloud point is 31 ± 0.5 ◦C, which is lowerthan the theoretical value of PNIPAAm alone, but is influenced by the hydrophilic-ity of the end groups and the molecular weight of the polymer77,83. The conju-gates are thermo-responsive as the reverse transition can also be observed with asmall hysteresis. The same property was detected for ferritin-PEGMA conjugateswith a cloud point of 29.5 ± 0.5 ◦C.
The transmission electron microscopy allows the visualization of this phenome-non. Fig. 8.15 illustrates the successful achievement of single ferritin-PNIPAAmconjugates. The iron core of ferritin has a high contrast in the TEM micrographsand appears as a black dot of 6 nm. The corona around the ferritin is about 30 to45 nm in diameter.
Dynamic light scattering measurements were also performed to observe the tem-perature transition of the conjugates in solution. The transition temperature, de-termined from the onset of strong scattering intensities due to the aggregationand phase separation of the bioconjugates was 31.5 ± 0.5 ◦C.
Fig. 8.16 shows a decrease of the hydrodynamic radius of the particles from 30 to12 nm between 20 and 32 ◦C as the cloud point is approached (at 31.5 ◦C). After afurther increase in temperature, the conjugates slowly start to aggregate.
108
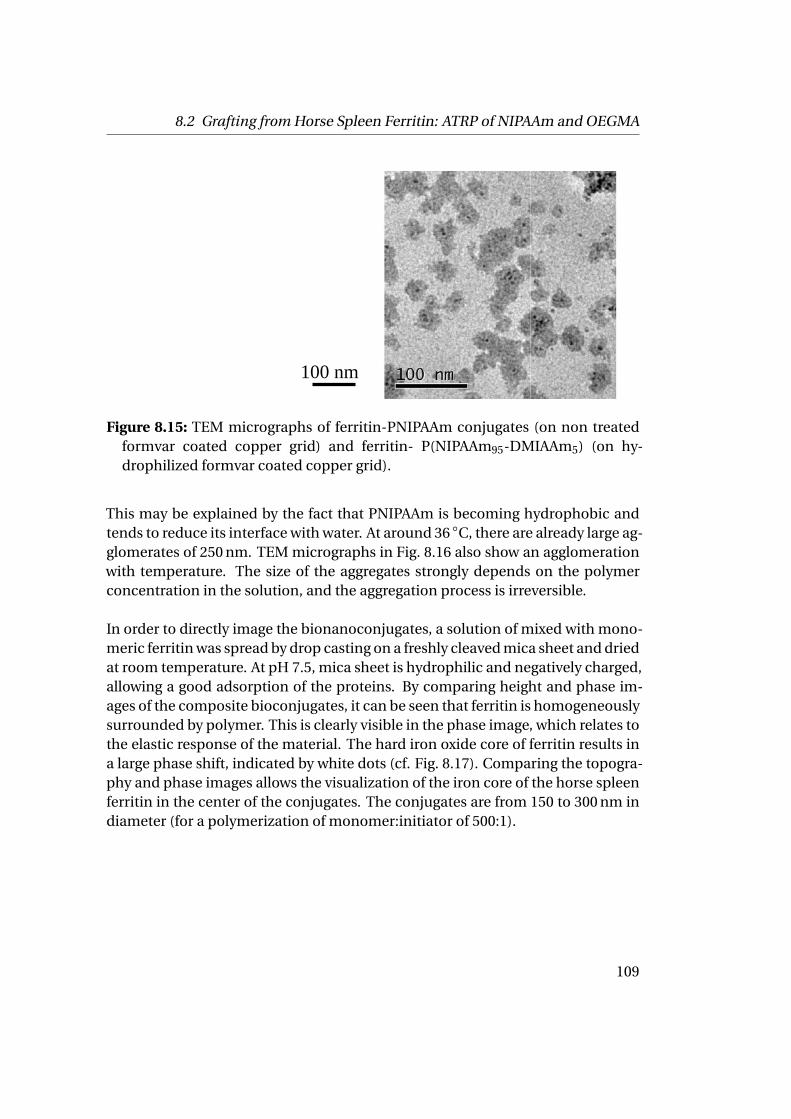
8.2 Grafting from Horse Spleen Ferritin: ATRP of NIPAAm and OEGMA
100 nm
Figure 8.15: TEM micrographs of ferritin-PNIPAAm conjugates (on non treatedformvar coated copper grid) and ferritin- P(NIPAAm95-DMIAAm5) (on hy-drophilized formvar coated copper grid).
This may be explained by the fact that PNIPAAm is becoming hydrophobic andtends to reduce its interface with water. At around 36 ◦C, there are already large ag-glomerates of 250 nm. TEM micrographs in Fig. 8.16 also show an agglomerationwith temperature. The size of the aggregates strongly depends on the polymerconcentration in the solution, and the aggregation process is irreversible.
In order to directly image the bionanoconjugates, a solution of mixed with mono-meric ferritin was spread by drop casting on a freshly cleaved mica sheet and driedat room temperature. At pH 7.5, mica sheet is hydrophilic and negatively charged,allowing a good adsorption of the proteins. By comparing height and phase im-ages of the composite bioconjugates, it can be seen that ferritin is homogeneouslysurrounded by polymer. This is clearly visible in the phase image, which relates tothe elastic response of the material. The hard iron oxide core of ferritin results ina large phase shift, indicated by white dots (cf. Fig. 8.17). Comparing the topogra-phy and phase images allows the visualization of the iron core of the horse spleenferritin in the center of the conjugates. The conjugates are from 150 to 300 nm indiameter (for a polymerization of monomer:initiator of 500:1).
109
8 Synthesis of Ferritin-P(NIPAAm-DMIAAm) Conjugates
20 24 28 32 36 40
50
100
150
200
250
300
350
Hyd
rody
nam
ic ra
dius
(nm
)
Temperature (°C)
Figure 8.16: Effect of temperature on conjugate particles in solution. Left: DLSmeasurement of ferritin-PNIPAAm conjugate particles; Right: TEM micro-graphs of ferritin-polymer conjugates at room temperature and after heatingto 40 ◦C.
Figure 8.17: AFM phase (z=30 ◦) and topography (z=30 nm) images of horse spleenferritin-PNIPAAm conjugates mixed with free horse spleen ferritin prepared ona freshly cleaved mica sheet, over a 9µm2 scale. The iron oxide core of horsespleen ferritin appears as a bright dot in the phase image.
110
9 Towards the Building of theMembrane
This chapter is focused on the building of a thermoresponsive nanoporous mem-brane. The protein-polymer conjugates ferritin-P(NIPAAm-DMIAAm), describedin Chapter 8, are able to absorb at different solid-liquid and liquid-liquid inter-faces. This feature is used to build supported membranes and 3D capsules. By as-sembly of the conjugates at the interface, it is possible to obtain a homogeneousprotein-polymer film and allows the crosslinking through the maleimide sites ofDMIAAm monomers, as shown in Chapter 7. Afterwards, the denaturation of theproteins and intensive washing will open the pores of the membrane. The 3D as-sembly of such protein-polymer conjugates can open further perspectives such asthe creation of nanoporous capsules. For this purpose, the adsorption of protein-polymer conjugates at the liquid-liquid interfaces is investigated and the forma-tion of Pickering emulsions is shown.
9.1 Adsorption at Solid-Liquid Interfaces & SupportedMembrane Formation
Protein-polymer conjugates are able to assemble at the liquid-solid interfaces.Capillary and electrostatic forces are driving the conjugates adsorption. Hydrophi-lic and charged surfaces allow the spreading of the solution of protein-P(NIPAAm-DMIAAm) conjugates to reach a homogeneous polymer matrix. The crosslinkingunder UV irradiation should create the polymer matrix of the membrane. Finally,the denaturation of the proteins should allow the pores formation of the mem-brane.
111
9 Towards the Building of the Membrane
9.1.1 Experimental Part
Ferritin-P(NIPAAm95-DMIAAm5) conjugates dialyzed at a cut-off 50 kDa (a solu-tion at 1 mg·mL−1 in 0.1 M sodium phosphate buffer solution at pH 7.4) are mixedwith a 2 wt% sensitizer thioxanthone solution in DMF.
The resulting solution was spincoated (2000 rpm for 60s), or drop cast onto oxi-dized silicon wafers or freshly cleaved mica sheets. The salt was then washed sev-eral times with millipore water. For the crosslinking, the substrates were placedunder UV light for 20 minutes, the UV irradiation was carried out with a 400 W UVlamp (Panacol 400F), with emitting light with a λ>315 nm wavelength at 20 cmfrom the sample. The denaturation was achieved by adding a 300µL drop of a 8 Murea solution mixed with a 10µL drop at 10 mM of a dithreitol solution (DTT) cov-ering the polymer film and placing the sample in the oven at 90 ◦C for 15 minutes.The sample was then extensively washed with millipore water and further investi-gated by AFM under dry conditions.
9.1.2 Results
Freshly cleaved mica sheets and oxidized silicon wafers are both hydrophilic andnegatively charged at pH 7.5. The isoelectric point of ferritin is between 4 and 4.5.Both surfaces allow to obtain a homogeneous conjugates film before UV crosslink-ing as illustrated by Fig. 9.1. The protein particles are not hexagonally packed,which is not required for the desired application. The main interest is to intro-duce channels of well controlled size and with chemical functions into the poly-mer matrix, by means of denaturation of the proteins. Pore size control yields overmembrane selectivity and chemical functions allow further modifications of themembrane channels.
The polymer film thickness average can be evaluated from the topographic im-age (cf. Fig. 9.2). The conjugates solution was drop cast on the mica sheet, anddid not fully cover it. The proteins can be seen in the film on the phase imageas bright dots and the mica sheet as a bright background (both iron core of fer-ritin and mica are harder than the polymer film). As the mica sheet is not fullycovered by the conjugates film and it is possible to evaluate the thickness of thepolymer film, which is of about 3 nm. The small thickness is foreseeable and de-
112
9.1 Adsorption at Solid-Liquid Interfaces & Supported Membrane Formation
Conjugates height and phase
1um, 20nm, 40° on mica crosslinked film
3um 20nm, 10°
Hot and cool height
Figure 9.1: AFM topography and phase images of ferritin-P(NIPAAm95-DMIAAm5) conjugates film over 1µm2 on mica sheet. Left: z-range: 20 nm;right: z-range: 40 ◦.
sirable as the proteins have a diameter of 12 nm and cannot produce a thick filmas P(NIPAAm-DMIAAm) is spreading on the hydrophilic substrate. If it would bethicker than 20 nm the proteins are covered by the polymer and are not accessibleto denaturating agents and there will not be any holes (pores) in the polymer filmafter denaturation.
Figure 9.2: AFM topography (left) and phase (right) images of ferritin-P(NIPAAm95-DMIAAm5) conjugates forming a film over 1µm2 on mica sheetbefore crosslinking ; height z-range: 30 nm and phase z-range: 30 ◦.
113
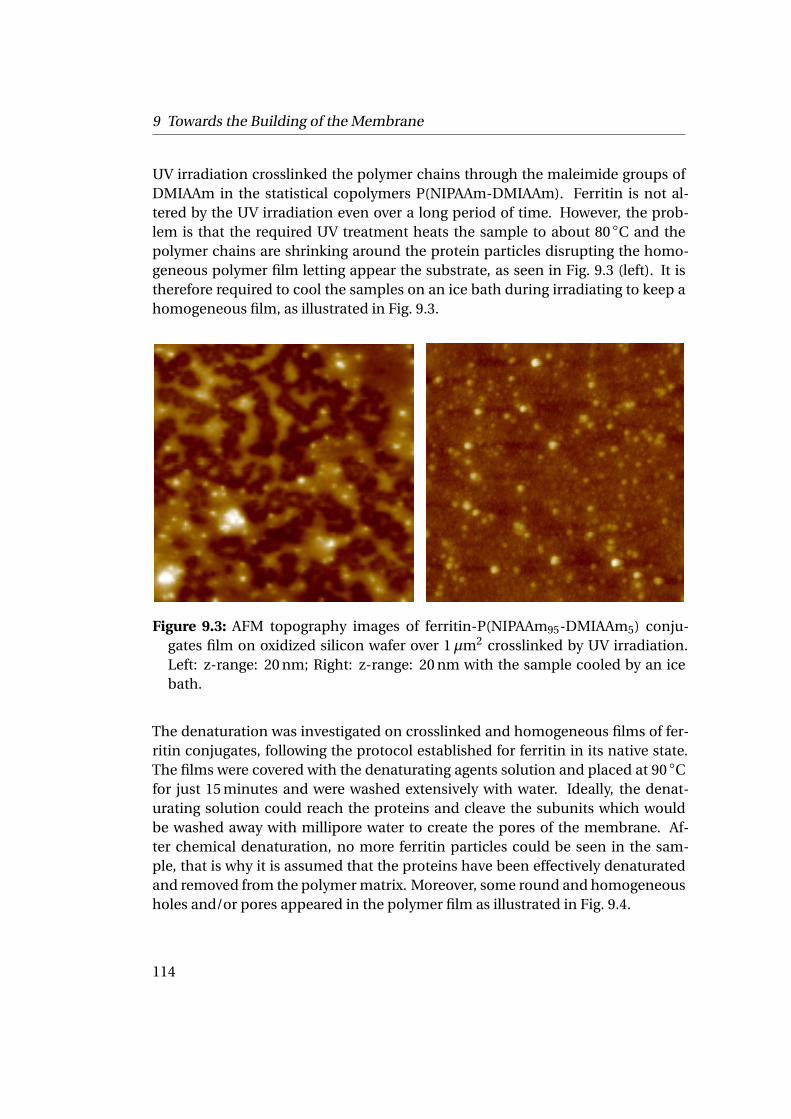
9 Towards the Building of the Membrane
UV irradiation crosslinked the polymer chains through the maleimide groups ofDMIAAm in the statistical copolymers P(NIPAAm-DMIAAm). Ferritin is not al-tered by the UV irradiation even over a long period of time. However, the prob-lem is that the required UV treatment heats the sample to about 80 ◦C and thepolymer chains are shrinking around the protein particles disrupting the homo-geneous polymer film letting appear the substrate, as seen in Fig. 9.3 (left). It istherefore required to cool the samples on an ice bath during irradiating to keep ahomogeneous film, as illustrated in Fig. 9.3.
Conjugates height and phase
1um, 20nm, 40° on mica crosslinked film
3um 20nm, 10°
Hot and cool height
Figure 9.3: AFM topography images of ferritin-P(NIPAAm95-DMIAAm5) conju-gates film on oxidized silicon wafer over 1µm2 crosslinked by UV irradiation.Left: z-range: 20 nm; Right: z-range: 20 nm with the sample cooled by an icebath.
The denaturation was investigated on crosslinked and homogeneous films of fer-ritin conjugates, following the protocol established for ferritin in its native state.The films were covered with the denaturating agents solution and placed at 90 ◦Cfor just 15 minutes and were washed extensively with water. Ideally, the denat-urating solution could reach the proteins and cleave the subunits which wouldbe washed away with millipore water to create the pores of the membrane. Af-ter chemical denaturation, no more ferritin particles could be seen in the sam-ple, that is why it is assumed that the proteins have been effectively denaturatedand removed from the polymer matrix. Moreover, some round and homogeneousholes and/or pores appeared in the polymer film as illustrated in Fig. 9.4.
114
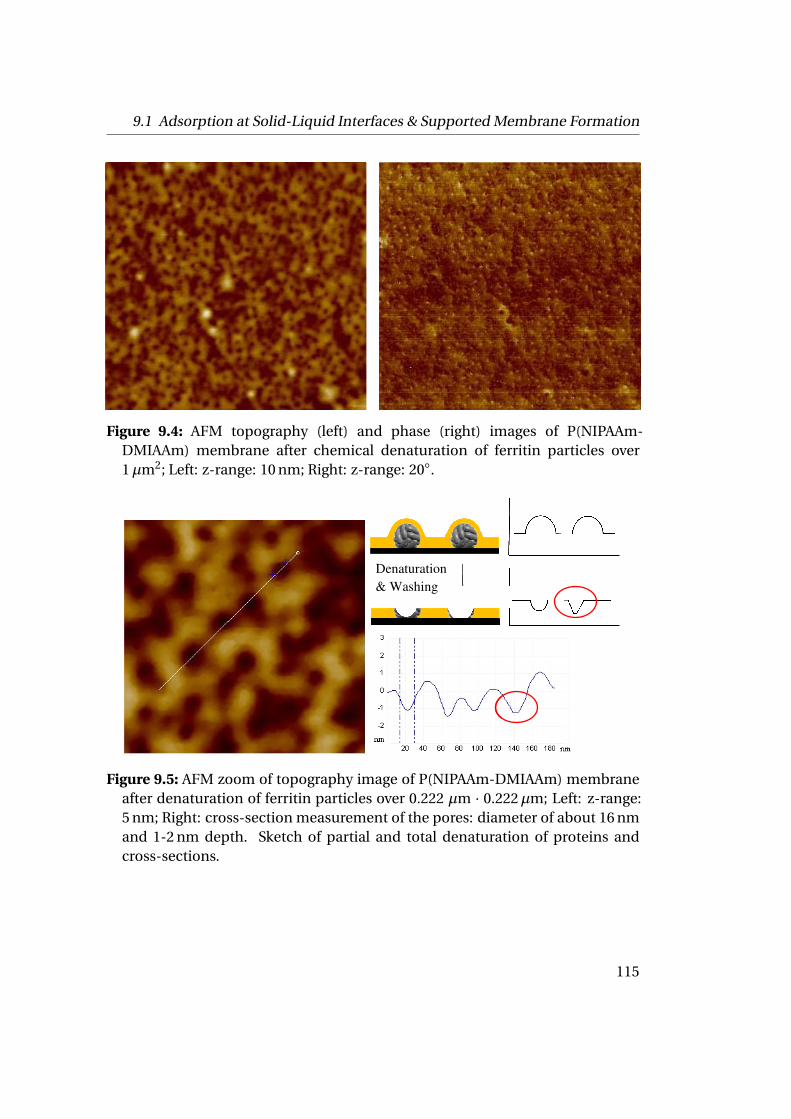
9.1 Adsorption at Solid-Liquid Interfaces & Supported Membrane Formation
Figure 9.4: AFM topography (left) and phase (right) images of P(NIPAAm-DMIAAm) membrane after chemical denaturation of ferritin particles over1µm2; Left: z-range: 10 nm; Right: z-range: 20◦.
Denaturation
& Washing
Figure 9.5: AFM zoom of topography image of P(NIPAAm-DMIAAm) membraneafter denaturation of ferritin particles over 0.222 µm · 0.222µm; Left: z-range:5 nm; Right: cross-section measurement of the pores: diameter of about 16 nmand 1-2 nm depth. Sketch of partial and total denaturation of proteins andcross-sections.
115
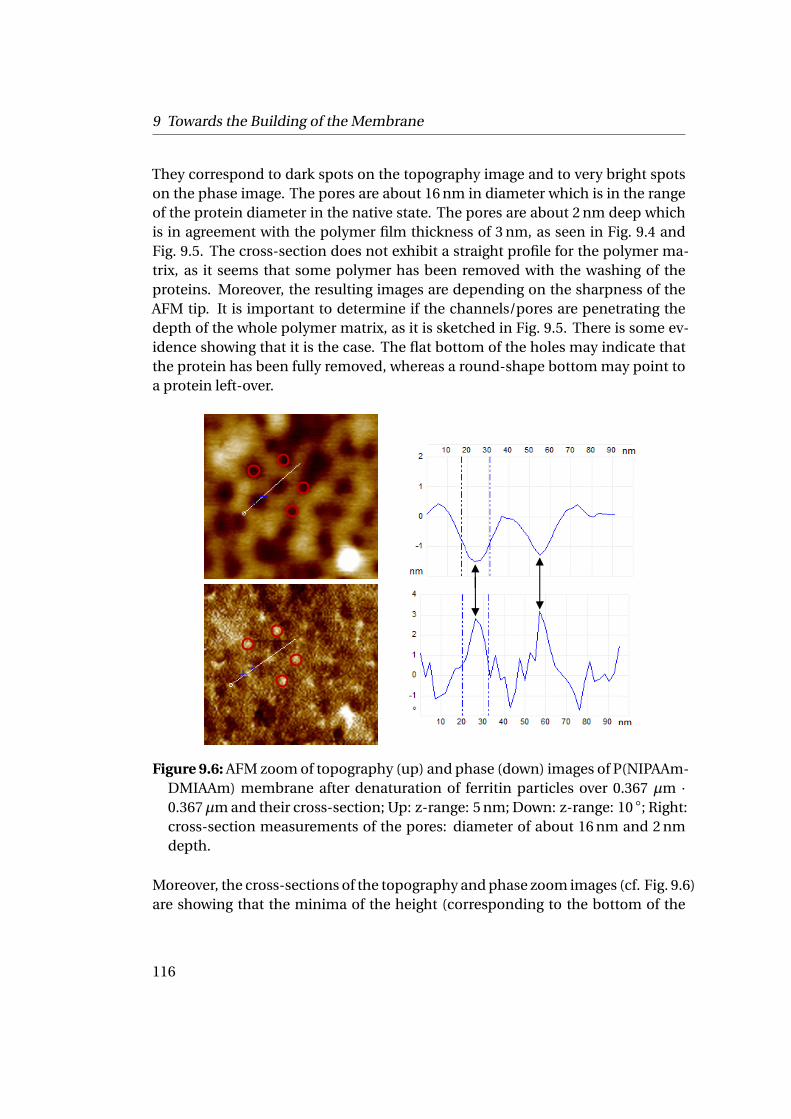
9 Towards the Building of the Membrane
They correspond to dark spots on the topography image and to very bright spotson the phase image. The pores are about 16 nm in diameter which is in the rangeof the protein diameter in the native state. The pores are about 2 nm deep whichis in agreement with the polymer film thickness of 3 nm, as seen in Fig. 9.4 andFig. 9.5. The cross-section does not exhibit a straight profile for the polymer ma-trix, as it seems that some polymer has been removed with the washing of theproteins. Moreover, the resulting images are depending on the sharpness of theAFM tip. It is important to determine if the channels/pores are penetrating thedepth of the whole polymer matrix, as it is sketched in Fig. 9.5. There is some ev-idence showing that it is the case. The flat bottom of the holes may indicate thatthe protein has been fully removed, whereas a round-shape bottom may point toa protein left-over.
339.8*339.8 um, 5nm, 10°
Figure 9.6: AFM zoom of topography (up) and phase (down) images of P(NIPAAm-DMIAAm) membrane after denaturation of ferritin particles over 0.367 µm ·0.367µm and their cross-section; Up: z-range: 5 nm; Down: z-range: 10 ◦; Right:cross-section measurements of the pores: diameter of about 16 nm and 2 nmdepth.
Moreover, the cross-sections of the topography and phase zoom images (cf. Fig. 9.6)are showing that the minima of the height (corresponding to the bottom of the
116
9.1 Adsorption at Solid-Liquid Interfaces & Supported Membrane Formation
channels) are corresponding to the maxima of the phase section, indicating thatthere is a different composition than the polymer in the holes. If the channelscross the whole polymer matrix, the AFM tip should reach the silicon substrate,and as the substrate is harder than the polymer, it appears brighter in the phaseimage. Some diffusion studies would be necessary to affirm this result.
This result is a proof of concept of the supported membrane. Indeed, it is shownhere that ferritin can be used as a model protein for the building of a membraneby the bottom-up approach. Ferritin-polymer conjugates are building blocks ableto assemble at the solid-liquid interfaces. After crosslinking under UV irradiationat low temperature, followed by chemical denaturation, the proteins create chan-nels and/or pores in the polymer matrix. Many other proteins or non infectiousviruses can be used in the same manner to control the pore size and shape of themembrane. Moreover, as the polymer matrix is made of the thermoresponsivecopolymers P(NIPAAm-DMIAAm), this will allows triggering the pore size and se-lectivity with temperature.
117
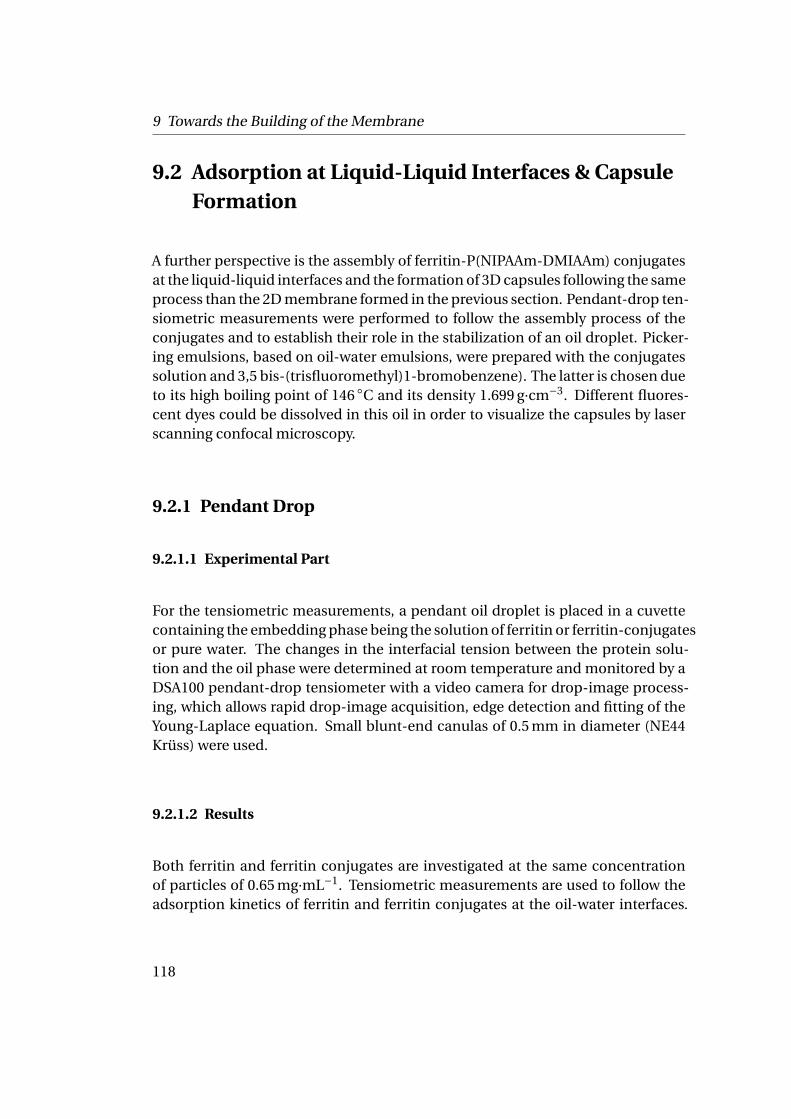
9 Towards the Building of the Membrane
9.2 Adsorption at Liquid-Liquid Interfaces & CapsuleFormation
A further perspective is the assembly of ferritin-P(NIPAAm-DMIAAm) conjugatesat the liquid-liquid interfaces and the formation of 3D capsules following the sameprocess than the 2D membrane formed in the previous section. Pendant-drop ten-siometric measurements were performed to follow the assembly process of theconjugates and to establish their role in the stabilization of an oil droplet. Picker-ing emulsions, based on oil-water emulsions, were prepared with the conjugatessolution and 3,5 bis-(trisfluoromethyl)1-bromobenzene). The latter is chosen dueto its high boiling point of 146 ◦C and its density 1.699 g·cm−3. Different fluores-cent dyes could be dissolved in this oil in order to visualize the capsules by laserscanning confocal microscopy.
9.2.1 Pendant Drop
9.2.1.1 Experimental Part
For the tensiometric measurements, a pendant oil droplet is placed in a cuvettecontaining the embedding phase being the solution of ferritin or ferritin-conjugatesor pure water. The changes in the interfacial tension between the protein solu-tion and the oil phase were determined at room temperature and monitored by aDSA100 pendant-drop tensiometer with a video camera for drop-image process-ing, which allows rapid drop-image acquisition, edge detection and fitting of theYoung-Laplace equation. Small blunt-end canulas of 0.5 mm in diameter (NE44Krüss) were used.
9.2.1.2 Results
Both ferritin and ferritin conjugates are investigated at the same concentrationof particles of 0.65 mg·mL−1. Tensiometric measurements are used to follow theadsorption kinetics of ferritin and ferritin conjugates at the oil-water interfaces.
118
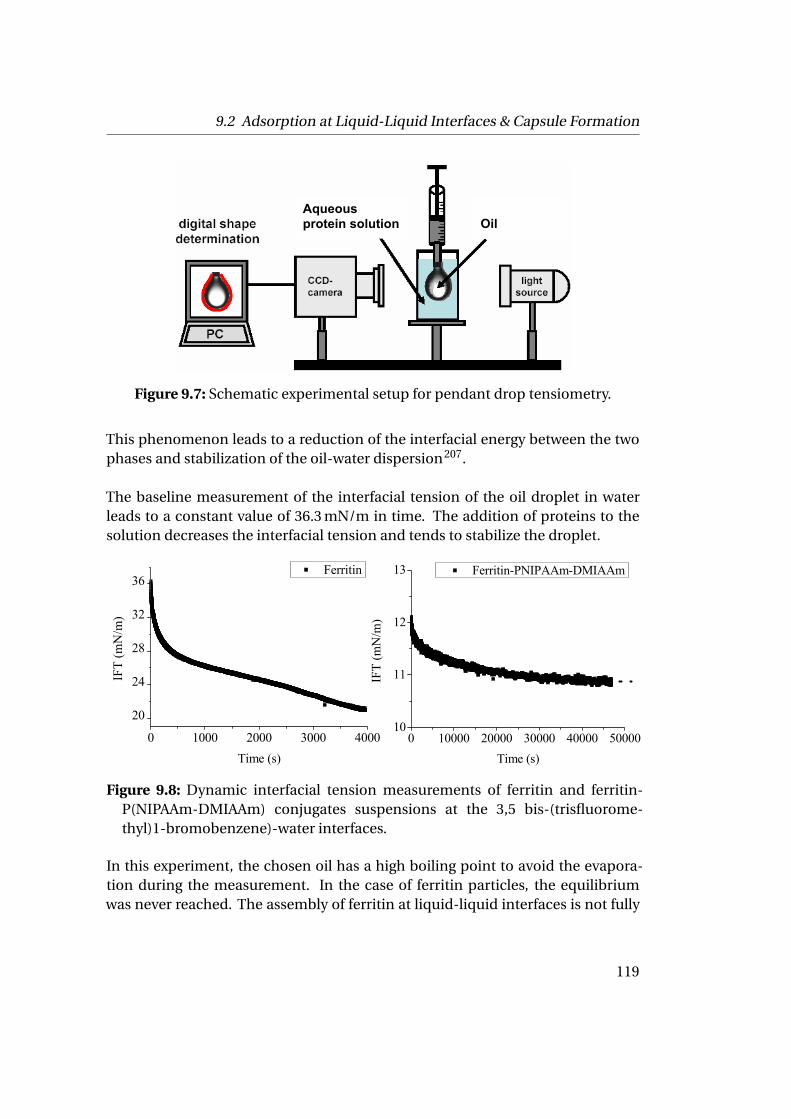
9.2 Adsorption at Liquid-Liquid Interfaces & Capsule Formation
Aqueous protein solution
Oil
Figure 9.7: Schematic experimental setup for pendant drop tensiometry.
This phenomenon leads to a reduction of the interfacial energy between the twophases and stabilization of the oil-water dispersion207.
The baseline measurement of the interfacial tension of the oil droplet in waterleads to a constant value of 36.3 mN/m in time. The addition of proteins to thesolution decreases the interfacial tension and tends to stabilize the droplet.
0 1000 2000 3000 4000
20
24
28
32
36
IFT
(mN
/m)
Time (s)
Ferritin
0 10000 20000 30000 40000 5000010
11
12
13
IFT
(mN
/m)
Time (s)
Ferritin-PNIPAAm-DMIAAm
Figure 9.8: Dynamic interfacial tension measurements of ferritin and ferritin-P(NIPAAm-DMIAAm) conjugates suspensions at the 3,5 bis-(trisfluorome-thyl)1-bromobenzene)-water interfaces.
In this experiment, the chosen oil has a high boiling point to avoid the evapora-tion during the measurement. In the case of ferritin particles, the equilibriumwas never reached. The assembly of ferritin at liquid-liquid interfaces is not fully
119
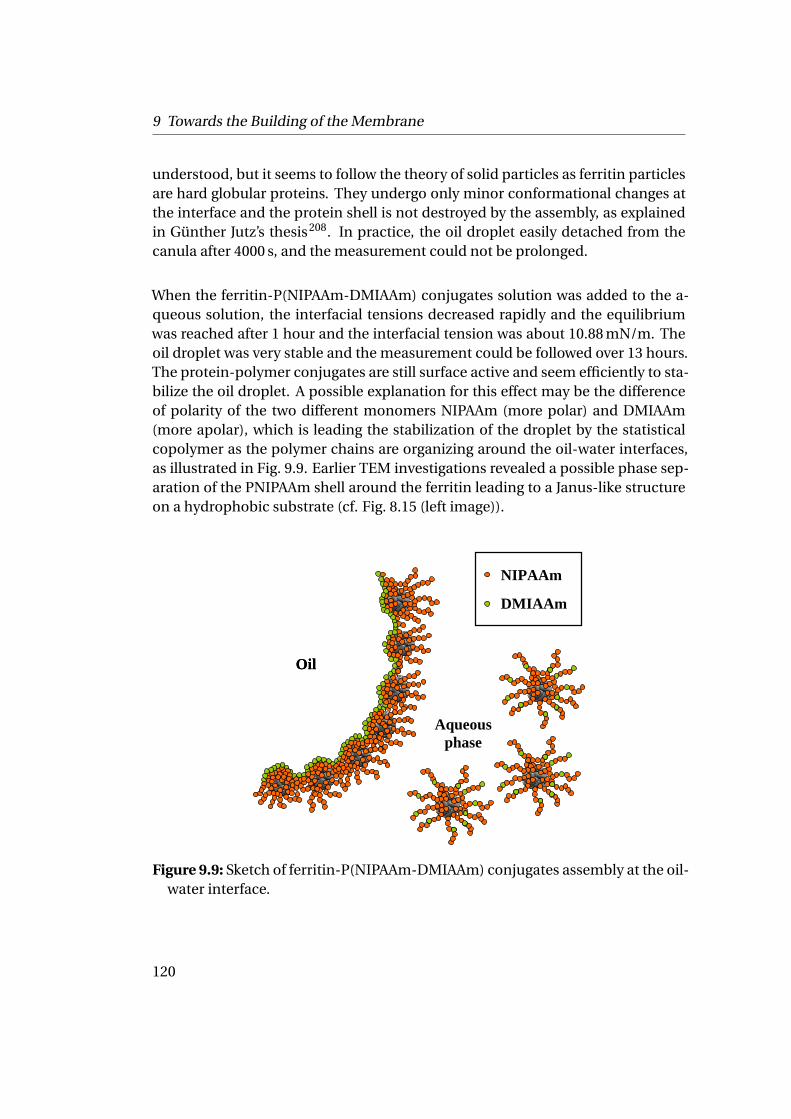
9 Towards the Building of the Membrane
understood, but it seems to follow the theory of solid particles as ferritin particlesare hard globular proteins. They undergo only minor conformational changes atthe interface and the protein shell is not destroyed by the assembly, as explainedin Günther Jutz’s thesis208. In practice, the oil droplet easily detached from thecanula after 4000 s, and the measurement could not be prolonged.
When the ferritin-P(NIPAAm-DMIAAm) conjugates solution was added to the a-queous solution, the interfacial tensions decreased rapidly and the equilibriumwas reached after 1 hour and the interfacial tension was about 10.88 mN/m. Theoil droplet was very stable and the measurement could be followed over 13 hours.The protein-polymer conjugates are still surface active and seem efficiently to sta-bilize the oil droplet. A possible explanation for this effect may be the differenceof polarity of the two different monomers NIPAAm (more polar) and DMIAAm(more apolar), which is leading the stabilization of the droplet by the statisticalcopolymer as the polymer chains are organizing around the oil-water interfaces,as illustrated in Fig. 9.9. Earlier TEM investigations revealed a possible phase sep-aration of the PNIPAAm shell around the ferritin leading to a Janus-like structureon a hydrophobic substrate (cf. Fig. 8.15 (left image)).
Oil
Aqueous phase
Oil
NIPAAm
DMIAAm
Figure 9.9: Sketch of ferritin-P(NIPAAm-DMIAAm) conjugates assembly at the oil-water interface.
120
9.2 Adsorption at Liquid-Liquid Interfaces & Capsule Formation
9.2.2 Pickering Emulsions
9.2.2.1 Experimental Part
Pickering emulsions are prepared by adding 10µL of fresh solution of sensitizerthioxanthone in DMF to 400µL of the conjugates at 1 mg·mL−1. Finally, 40µL ofoil are mixed to the aqueous solution and shake by hand to form the droplets andlet them to stabilize by protein adsorption at the interface at room temperature.Perylene bisimide, a fluorescent dye synthesized by Andre Wicklein, is dissolvedin the oil phase. It was chosen as it is not bleached by UV irradiation, necessaryfor the crosslinking step. The dye was added to the oil phase before the addition ofthe oil into the aqueous phase. The micro-capsules were observed by laser scan-ning confocal microscopy (LSCM) before and after crosslinking, with a Zeiss LSM710 microscope with excitation by an Argon and a HeNe lasers and using an oil-emulsion objective Plan-Achroplan 63*/1.4 Oil DIC M27*. The fluorescence fromthe protein conjugates is shown by a color scale, in which brightness representsintensity.
9.2.2.2 Results
The pickering emulsions were visualized using confocal microscopy with and with-out crosslinking. A water-soluble dye, fluorescein isothiocyanate, is added to theaqueous phase of the non-crosslinked capsules, as shown in Fig. 9.10A.
Two lasers with different wavelengths at 488 and 543 nm allow the visualization ofboth dyes, the capsules appear in red while the aqueous phase appears in green.The capsules are not homogeneous in size but the capsules are not destroyed byUV irradiation. Moreover, the crosslinked capsules are stable in solution for sever-als weeks.
In order to show the effect of crosslinking and prove the enhanced mechanicalstability, the capsules were centrifuged into an oil phase. Fig. 9.10B shows thatthe crosslinked capsules did not disrupt, while the same experiment with non-crosslinked capsules lead to disruption of the capsules.
Ferritin-P(NIPAAm-DMIAAm) conjugates have been proven to lead to stabiliza-
121
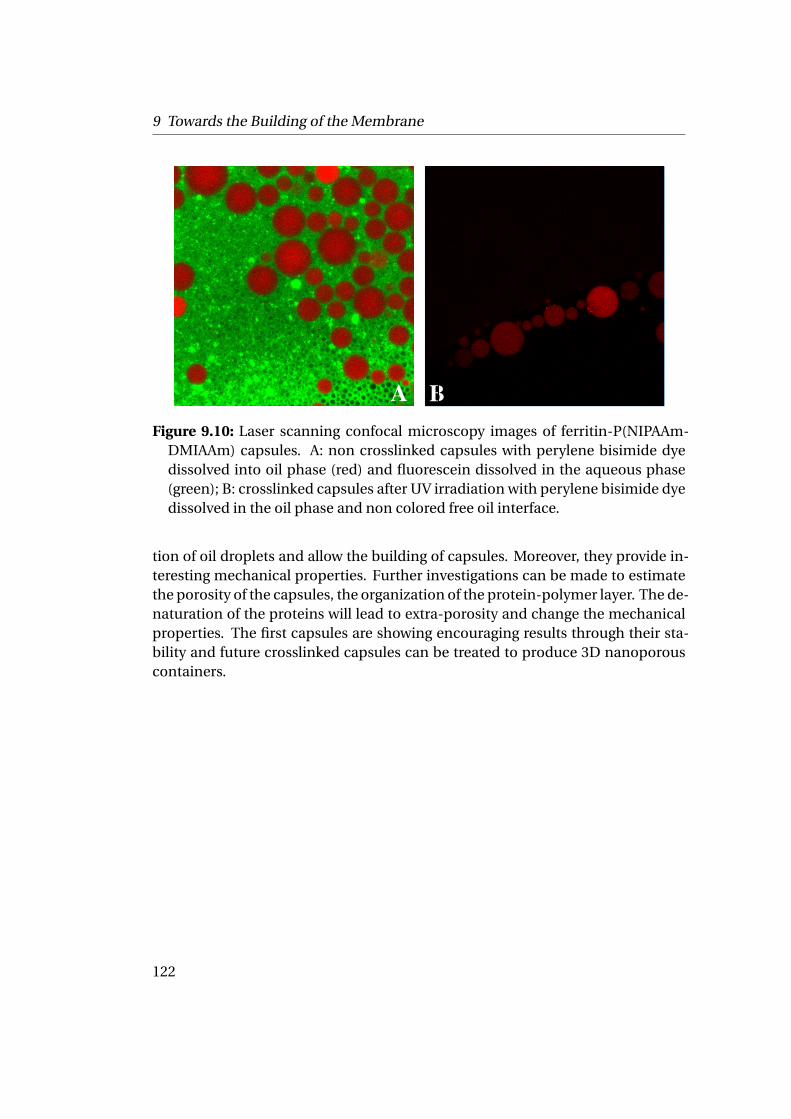
9 Towards the Building of the Membrane
A B B
Figure 9.10: Laser scanning confocal microscopy images of ferritin-P(NIPAAm-DMIAAm) capsules. A: non crosslinked capsules with perylene bisimide dyedissolved into oil phase (red) and fluorescein dissolved in the aqueous phase(green); B: crosslinked capsules after UV irradiation with perylene bisimide dyedissolved in the oil phase and non colored free oil interface.
tion of oil droplets and allow the building of capsules. Moreover, they provide in-teresting mechanical properties. Further investigations can be made to estimatethe porosity of the capsules, the organization of the protein-polymer layer. The de-naturation of the proteins will lead to extra-porosity and change the mechanicalproperties. The first capsules are showing encouraging results through their sta-bility and future crosslinked capsules can be treated to produce 3D nanoporouscontainers.
122
Bibliography
[1] C. M. Niemeyer, “Nanoparticles, proteins, and nucleic acids: Biotechnologymeets materials science,” Angewandte Chemie-International Edition,vol. 40, pp. 4128–4158, 2001.
[2] J. C. Rodriguez-Cabello, “Smart elastin-like polymers,” Biomaterials: FromMolecules to Engineered Tissues, vol. 553, pp. 45–57, 2004.
[3] J. C. Rodriguez-Cabello, S. Prieto, J. Reguera, F. J. Arias, and A. Ribeiro,“Biofunctional design of elastin-like polymers for advanced applicationsin nanobiotechnology,” Journal of Biomaterials Science-Polymer Edition,vol. 18, 3, pp. 269–286, 2007.
[4] M. Meziani, Y. Lin, and Y. P. Sun, Conjugation of Nanomaterials with Pro-teins. Wiley: Weinheim, 2005.
[5] Y. Lin, A. Böker, J. B. He, K. Sill, H. Q. Xiang, C. Abetz, X. F. Li, J. Wang,T. Emrick, S. Long, Q. Wang, A. Balazs, and T. P. Russell, “Self-directedself-assembly of nanoparticle/copolymer mixtures,” Nature, vol. 434, 7029,pp. 55–59, 2005.
[6] R. Haag and F. Kratz, “Polymer therapeutics: Concepts and applications,”Angewandte Chemie-International Edition, vol. 45, 8, pp. 1198–1215, 2006.
[7] C. De las Heras Alarcón, S. Pennandam, and C. Alexander, “Stimuli re-sponsive polymers for biomedical applications,” Chemical Society Review,vol. 34, pp. 276–285, 2005.
[8] H. Creque, “One month of sustained release of insulin from a polymer im-plant,” Diabetes, vol. 29, pp. 37–40, 1980.
[9] L. Brown, “Characterization of glucose-mediated insulin release from im-plantable polymers,” Journal of Pharmaceutical Science, vol. 85, p. 1341,1996.
123
Bibliography
[10] V. R. Patel and M. M. Amiji, “Preparation and characterization of freeze-dried chitosan-poly(ethylene oxide) hydrogels for site-specific antibiotic de-livery in the stomach,” Pharmaceutical Research, vol. 13, p. 588, 1996.
[11] A. Gutowska, “Heparin release from thermosensitive hydrogels,” Journal ofControlled Release, vol. 22, p. 95, 1992.
[12] C. Kolb and K. B. Sharpless, “The growing impact of click chemistry on drugdiscovery,” Drug Delivery Today, vol. 8, pp. 1128–1137, 2003.
[13] M. Li, D. J. Chaiko, and M. L. Schlossman, “X-ray reflectivity study of amonolayer of ferritin proteins at a nanofilm aqueous-aqueous interface,”Journal of Physical Chemistry B, vol. 107, pp. 9079–9085, 2003.
[14] J. F. Chen, H. M. Ding, J. X. Wang, and L. Shao, “Preparation and character-ization of porous hollow silica nanoparticles for drug delivery application,”Biomaterials, vol. 25, pp. 723–727, 2004.
[15] S. Mann and T. Douglas, Biomimetics Materials Chemistry. Wiley London,1997.
[16] I. G. Macara, P. M. Harrison, and T. G. Hoy, “Formation of ferritin fromapoferritin-Kinetics and mechanism of iron uptake,” Biochemical Journal,vol. 126, 1, pp. 151–162, 1972.
[17] I. G. Macara, T. G. Hoy, and P. M. Harrison, “Formation of ferritin fromapoferritin-Catalytic action of apoferritin,” Biochemical Journal, vol. 135, 2,pp. 343–348, 1973.
[18] T. Granier, B. Gallois, A. Dautant, B. L. D´Estaintot, and G. Precigoux, “Com-parison of the structures of the cubic and tetragonal forms of horse-spleenapoferritin,” Acta Crystallographica Section D-Biological Crystallography,vol. 53, pp. 580–587, 1997.
[19] A. A. Suran, “N-Terminal sequence of horse spleen apoferritin,” Archives ofBiochemistry and Biophysics, vol. 113, 1, pp. 1–4, 1966.
[20] W. Mainwari and T. Hoffmann, “Horse spleen ferritin apoferritin-N-Terminal and C-Terminal residues,” Archives of Biochemistry and Bio-physics, vol. 125, 3, pp. 975–980, 1968.
124
Bibliography
[21] K. Wetz and R. Crichton, “Chemical modification as a probe of topographyand reactivity of horse spleen apoferritin,” European Journal of Biochem-istry, vol. 61, 2, pp. 545–550, 1976.
[22] Q. Zeng, R. Reuther, J. Oxsher, and Q. Wang, “Characterization of horsespleen apoferritin reactive lysines by MALDI-ToF mass spectrometry com-bined with enzymatic digestion,” Bioorganic Chemistry, vol. 36, pp. 255–260,2008.
[23] Q. B. Zeng, T. Li, B. Cash, S. Q. Li, F. Xie, and Q. Wang, “Chemoselectivederivatization of a bionanoparticle by click chemistry and ATRP reaction,”Chemical Communications, vol. 14, pp. 1453–1455, 2007.
[24] Z. M. Wang, C. Li, M. Ellenburg, E. Soistman, J. Ruble, B. Wright, J. X. Ho, andD. C. Carter, “Structure of human ferritin L chain,” Acta CrystallographicaSection D-Biological Crystallography, vol. 62, pp. 800–806, 2006.
[25] P. Aisen and I. Listowsky, “Iron transport and storage proteins,” Annual Re-view of Biochemistry, vol. 49, pp. 357–393, 1980.
[26] J. L. Farrant, “An electron microscopic study of ferritin,” Biochimica et Bio-physica Acta, vol. 13, 4, pp. 569–576, 1954.
[27] A. E. Hamburger, A. P. West, Z. A. Hamburger, P. Hamburger, and P. J. Bjork-man, “Crystal structure of a secreted insect ferritin reveals a symmetrical ar-rangement of heavy and light chains,” Journal of Molecular Biology, vol. 349,3, pp. 558–569, 2005.
[28] D. M. Lawson, P. J. Artymiuk, S. J. Yewdall, J. M. A. Smith, J. C. Livingstone,A. Treffy, A. Luzzago, S. Levi, P. Arosio, G. Cesareni, W. V. Thomas, C. D. Shaw,and P. M. Harrison, “Solving the structure of human H-ferritin by geneti-cally engineering intermolecular crystal contacts,” Nature, vol. 349, 6309,pp. 541–544, 1991.
[29] C. M. Barnes, E. C. Theil, and K. N. Raymond, “Iron uptake in ferritin isblocked by binding of a slow dissociation,” Proceedings of the NationalAcademy of Sciences of the USA, vol. 99, 8, pp. 5195–5200, 2002.
[30] F. C. Meldrum, T. Douglas, S. Levi, P. Arosio, and S. Mann, “Reconstitution ofmanganese oxide core in horse spleen and recombinant ferritins,” Journalof Inorganic Biochemistry, vol. 58, 1, pp. 59–68, 1995.
125
Bibliography
[31] P. D. Hempstead, S. J. Yewdall, A. R. Fernie, D. M. Lawson, P. J. Artymiuk, D. W.Rice, G. C. Ford, and P. M. Harrison, “Comparison of the three-dimensionalstructures of recombinant human H and horse L ferritins at high resolu-tion,” Journal of Molecular Biology, vol. 268, 2, pp. 424–448, 1997.
[32] T. J. Stillman, P. D. Hempstead, P. J. Artymiuk, S. C. Andrews, A. J. Hudson,A. Treffy, J. R. Guest, and P. M. Harrison, “The high resolution X-ray crys-tallographic structure of the ferritin (EcFtnA) of Escherichia coli; compari-son with human H ferritin (HuHF) and the structures of the Fe3+ and Zn2+
derivatives,” Journal of Molecular Biology, vol. 307, 2, pp. 587–603, 2001.
[33] S. Srivastava, B. Samanta, B. J. Jordan, R. Hong, A. Xiao, M. T. Tuomi-nen, and V. M. Rotello, “Integrated magnetic bionanocomposites throughnanoparticle-mediated assembly of ferritin,” Journal of the American Chem-ical Society, vol. 129, 38, pp. 11776–11780, 2009.
[34] S. T. Silk and E. Breslow, “Hydrogen-ion interactions of horse spleen ferritinand apoferritin,” Journal of Biological Chemistry, vol. 251, 22, pp. 6963–6973,1976.
[35] I. Listowsky, G. Blauer, J. J. Betheil, and S. Englard, “Denaturation of horsespleen ferritin in aqueous guanidinium chloride solutions,” Biochemistry,vol. 11, 11, pp. 2176–2181, 1972.
[36] M. Uchida, M. T. Klem, M. Allen, P. Suci, M. Flenniken, E. Gillitzer, Z. Varp-ness, L. Leipold, M. Young, and T. Douglas, “Biological containers: Pro-teins cage as multifunctional nanoplatforms,” Advanced Materials, vol. 19,8, pp. 1025–1042, 2007.
[37] U. B. Sleyter, P. Messner, D. Pum, and M. Sára, “Crystalline bacterial cellsurface layers (S layers): From supramolecular cell structure to biomimet-ics and nanotechnology,” Angewandte Chemie International Edition, vol. 38,pp. 1034–1054, 1999.
[38] P. Messner, D. Pum, M. Sara, K. O. Stetter, and U. B. Sleytr, “Ultrastruc-ture of the cell-envelope of the archaebacteria thermoproteus-tenax andthermoproteus-neutrophilus,” Journal of Bacteriology, vol. 166, 3, pp. 1046–1054, 1986.
[39] S. A. Darst, M. Ahlers, P. H. Meller, E. W. Kubalek, R. Blankenburg, H. O. Ribi,H. Ringsdorf, and R. D. Kornberg, “Two-dimensional crystals of strepavidin
126
Bibliography
on biotinylated lipid layers and their interactions with biotinylated macro-molecules,” Biophysical Journal, vol. 59, pp. 387–396, 1991.
[40] I. Yamashita, “Fabrication of a two-dimensional array of nanoparticles us-ing ferritin molecule,” Thin Solid Films, vol. 393, 1-2, pp. 12–18, 2001.
[41] M. Tominaga, M. Matsumoto, K. Soejima, and I. Taniguchi, “Size control fortwo-dimensional iron oxide nanodots derived from biological molecules,”Journal of Colloid and Interface Science, vol. 299, 2, pp. 761–765, 2006.
[42] D. Vriezema, M. C. Aragones, J. A. A. W. Elemans, J. J. L. M. Cornelissen,A. E. Rowan, and R. J. M. Nolte, “Self-assembled nanoreactors,” ChemicalReviews, vol. 105, 4, pp. 1445–1489, 2005.
[43] N. D. Chasteen and P. M. Harrison, “Mineralization in ferritin: an efficientmeans of iron storage,” Journal of Structural Biology, vol. 126, 3, pp. 182–194,1999.
[44] H. Yoshimura, “Protein-assisted nanoparticle synthesis,” Colloids and Sur-faces A: Physicochemical and Engineering Aspects, vol. 282, pp. 464–470,2006.
[45] F. C. Meldrum, V. J. Wade, D. L. Nimmo, and S. Heywood, B. R. Mann, “Syn-thesis of inorganic nanophase materials in supramolecular protein cages,”Nature, vol. 349, 6311, pp. 684–687, 1991.
[46] F. C. Meldrum, B. R. Heywood, and S. Mann, “Magnetoferritin - invitro syn-thesis of a novel magnetic protein,” Science, vol. 257, 5069, pp. 522–523,1992.
[47] K. K. W. Wong, T. Douglas, S. Gider, D. D. Awschalom, and S. Mann,“Biomimetic synthesis and characterization of magnetic proteins (magneto-ferritin),” Chemistry of Materials, vol. 10, 1, pp. 279–285, 1998.
[48] T. Douglas, D. P. E. Dickson, S. Betteridge, J. Charnock, C. D. Garner, andS. Mann, “Synthesis and structure of an iron (III) Sulfide-ferritin bioorganicnanocomposite,” Science, vol. 269, 5220, pp. 54–57, 1995.
[49] M. Li, K. K. W. Wong, and S. Mann, “Organization of inorganic nanoparti-cles using biotin-strepavidin connectors,” Chemistry of Materials, vol. 11, 1,pp. 23–26, 1999.
127
Bibliography
[50] E. J. Ashford, V. Naldi, R. O´Dell, N. C. Billingham, and S. P. Armes, “Firstexample of the atom transfer radical polymerization of an acidic monomer:direct synthesis of methacrylic acid copolymers in aqueous media,” Chemi-cal Communications, vol. 14, pp. 1285–1286, 1999.
[51] J. A. M. Brandts, P. Van de Geijn, E. E. Van Faassen, J. Boersma, andG. Van Koten, “Controlled radical polymerization of styrene in the pres-ence of lithium molybdate(V) complexes and benzylic halides,” Journal ofOrganometallic Chemistry, vol. 584, 2, pp. 246–253, 1999.
[52] G. Chambard, P. De man, and B. Klumperman, “Atom transfer radical poly-merization in emulsion,” Macromolecular Symposia, vol. 150, pp. 45–51,2000.
[53] A. A. Brown, N. S. Khan, L. Steinbock, and W. T. S. Huck, “Synthesis ofoligo(ethylen glycol) methacrylate polymer brushes,” European PolymerJournal, vol. 41, 8, pp. 1757–1765, 2005.
[54] K. Matyjaszewski, J. Qiu, D. A. Shipp, and S. G. Gaynor, “Controlled/"Living"radical polymerization applied to water-borne systems,” MacromolecularSymposia, vol. 155, pp. 15–29, 2000.
[55] Y. Kagawa, H. Minami, M. Okubo, and H. Zhou, “Preparation of blockcopolymer particles by two-step atom transfer radical polymerization inaqueous media and its unique morphology,” Polymer, vol. 46, 4, pp. 1045–1049, 2005.
[56] G. Masci, D. Bontempo, N. Tiso, M. Diociaiuti, L. Mannina, D. Capitani,and V. Crescenzi, “Atom transfer radical polymerization of potassium 3-sulfopropyl methacrylate: Direct synthesis of amphiphilic block copoly-mers with methyl methacrylate,” Macromolecules, vol. 37, 12, pp. 4464–4473, 2004.
[57] D. Bontempo, K. L. Heredia, B. A. Fish, and H. D. Maynard, “Cysteine-reactive polymers synthesized by atom transfer radical polymerization forconjugation to proteins,” Journal of the American Chemical Society, vol. 126,47, pp. 15372–15373, 2004.
[58] R. M. Broyer, G. M. Quaker, and H. D. Maynard, “Designed amino acid ATRPinitiators for the synthesis of biohybrid materials,” Journal of the AmericanChemical Society, vol. 130, 3, pp. 1041–1047, 2008.
128
Bibliography
[59] K. Matyjaszweski and J. H. Xia, “Atom transfer radical polymerization,”Chemical Reviews, vol. 101, 9, pp. 2921–2990, 2001.
[60] M. Kamigaito, T. Ando, and M. Sawamoto, “Metal-catalyzed living radicalpolymerization,” Chemical Reviews, vol. 101, 12, pp. 3698–3785, 2001.
[61] G. Moad and D. H. Solomon, The Chemistry of Radical Polymerization. Else-vier, 2005.
[62] A. Bhattacharya and B. N. Misra, “Grafting: a versatile means to modifypolymers-techniques, factors and applications,” Progress in Polymer Sci-ence, vol. 29, 8, pp. 767–814, 2004.
[63] K. S. Raja, Q. Wang, M. J. Gonzalez, M. Manchester, J. E. Johnson, and M. G.Finn, “Hybrid virus polymer materials. 1. synthesis and properties of PEG-decorated cowpea mosaic virus,” Biomacromolecules, vol. 4, 3, pp. 472–476,2003.
[64] B. S. Lele, H. Murata, K. Matyjaszewski, and A. J. Russell, “Synthesis of uni-form protein-polymer conjugates,” Biomacromolecules, vol. 6, 6, pp. 3380–3387, 2005.
[65] K. Al-Tahami and J. Singh, “Smart polymer based deliver systems for pep-tides and proteins,” Recent Patents on Drug Delivery and Formulation, vol. 1,pp. 65–71, 2007.
[66] S. Fujishige, K. Kubota, and I. Ando, “Phase-transition of aqueous solutionsof Poly(N-isopropylacrylamide) and Poly(N-isopropylmethacrylamide),”Journal of Physical Chemistry, vol. 93, 8, pp. 3311–3313, 1989.
[67] H. G. Schild and D. A. Tirrell, “Microcalorimetric detection of lower criticalsolution temperatures in aqueous polymer-solutions,” Journal of PhysicalChemistry, vol. 94, 10, pp. 4352–4356, 1990.
[68] H. G. Schild, “Poly(N-isopropylacrylamide): experiment, theory and appli-cation,” Progress in Polymer Science, vol. 17, p. 163, 1992.
[69] J. F. Lutz, O. Akedemir, and A. Hoth, “Point by point comparison oftwo thermoresponsive polymers exhibiting a similar LCST: Is the age ofpoly(NIPAm) over?,” Journal of the American Chemical Society, vol. 128, 40,pp. 13046–13047, 2006.
129
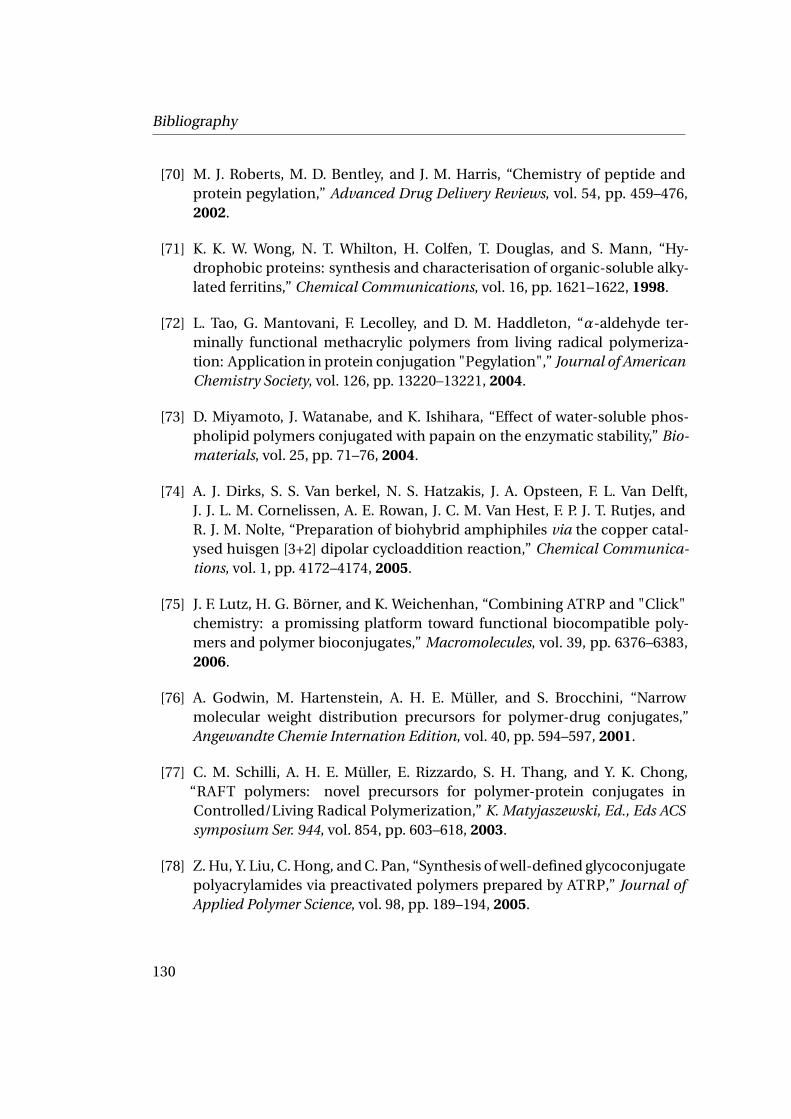
Bibliography
[70] M. J. Roberts, M. D. Bentley, and J. M. Harris, “Chemistry of peptide andprotein pegylation,” Advanced Drug Delivery Reviews, vol. 54, pp. 459–476,2002.
[71] K. K. W. Wong, N. T. Whilton, H. Colfen, T. Douglas, and S. Mann, “Hy-drophobic proteins: synthesis and characterisation of organic-soluble alky-lated ferritins,” Chemical Communications, vol. 16, pp. 1621–1622, 1998.
[72] L. Tao, G. Mantovani, F. Lecolley, and D. M. Haddleton, “α-aldehyde ter-minally functional methacrylic polymers from living radical polymeriza-tion: Application in protein conjugation "Pegylation",” Journal of AmericanChemistry Society, vol. 126, pp. 13220–13221, 2004.
[73] D. Miyamoto, J. Watanabe, and K. Ishihara, “Effect of water-soluble phos-pholipid polymers conjugated with papain on the enzymatic stability,” Bio-materials, vol. 25, pp. 71–76, 2004.
[74] A. J. Dirks, S. S. Van berkel, N. S. Hatzakis, J. A. Opsteen, F. L. Van Delft,J. J. L. M. Cornelissen, A. E. Rowan, J. C. M. Van Hest, F. P. J. T. Rutjes, andR. J. M. Nolte, “Preparation of biohybrid amphiphiles via the copper catal-ysed huisgen [3+2] dipolar cycloaddition reaction,” Chemical Communica-tions, vol. 1, pp. 4172–4174, 2005.
[75] J. F. Lutz, H. G. Börner, and K. Weichenhan, “Combining ATRP and "Click"chemistry: a promissing platform toward functional biocompatible poly-mers and polymer bioconjugates,” Macromolecules, vol. 39, pp. 6376–6383,2006.
[76] A. Godwin, M. Hartenstein, A. H. E. Müller, and S. Brocchini, “Narrowmolecular weight distribution precursors for polymer-drug conjugates,”Angewandte Chemie Internation Edition, vol. 40, pp. 594–597, 2001.
[77] C. M. Schilli, A. H. E. Müller, E. Rizzardo, S. H. Thang, and Y. K. Chong,“RAFT polymers: novel precursors for polymer-protein conjugates inControlled/Living Radical Polymerization,” K. Matyjaszewski, Ed., Eds ACSsymposium Ser. 944, vol. 854, pp. 603–618, 2003.
[78] Z. Hu, Y. Liu, C. Hong, and C. Pan, “Synthesis of well-defined glycoconjugatepolyacrylamides via preactivated polymers prepared by ATRP,” Journal ofApplied Polymer Science, vol. 98, pp. 189–194, 2005.
130
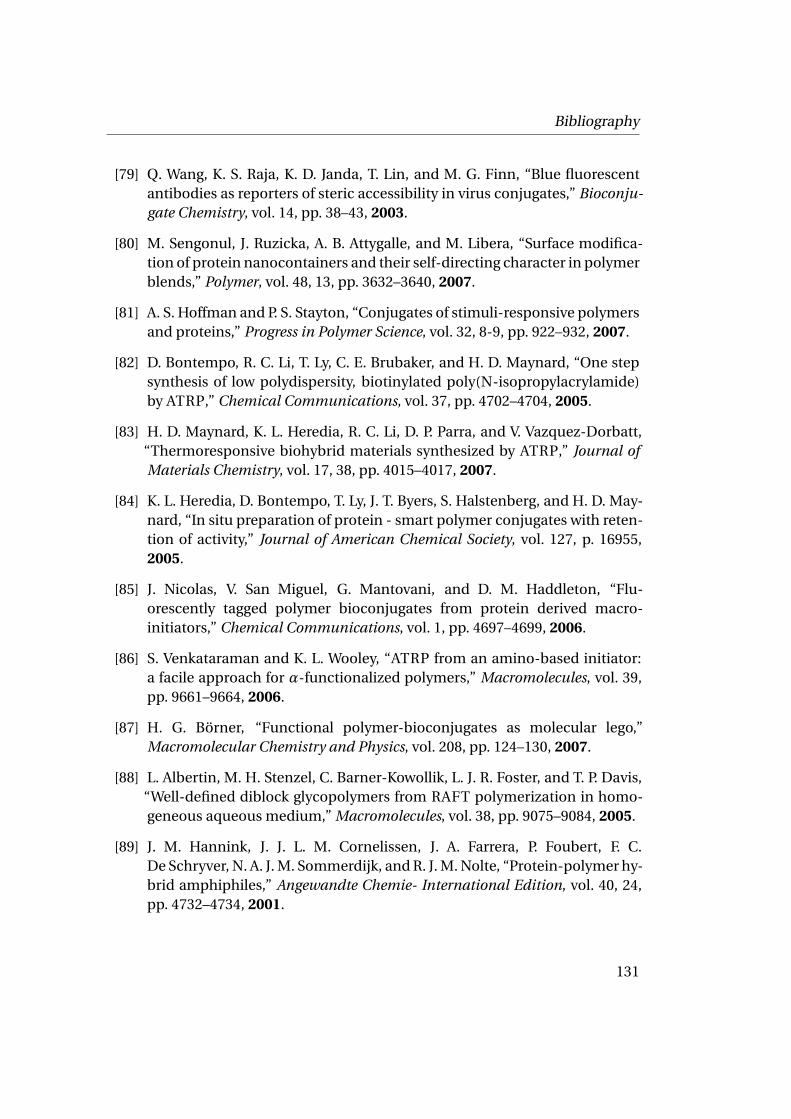
Bibliography
[79] Q. Wang, K. S. Raja, K. D. Janda, T. Lin, and M. G. Finn, “Blue fluorescentantibodies as reporters of steric accessibility in virus conjugates,” Bioconju-gate Chemistry, vol. 14, pp. 38–43, 2003.
[80] M. Sengonul, J. Ruzicka, A. B. Attygalle, and M. Libera, “Surface modifica-tion of protein nanocontainers and their self-directing character in polymerblends,” Polymer, vol. 48, 13, pp. 3632–3640, 2007.
[81] A. S. Hoffman and P. S. Stayton, “Conjugates of stimuli-responsive polymersand proteins,” Progress in Polymer Science, vol. 32, 8-9, pp. 922–932, 2007.
[82] D. Bontempo, R. C. Li, T. Ly, C. E. Brubaker, and H. D. Maynard, “One stepsynthesis of low polydispersity, biotinylated poly(N-isopropylacrylamide)by ATRP,” Chemical Communications, vol. 37, pp. 4702–4704, 2005.
[83] H. D. Maynard, K. L. Heredia, R. C. Li, D. P. Parra, and V. Vazquez-Dorbatt,“Thermoresponsive biohybrid materials synthesized by ATRP,” Journal ofMaterials Chemistry, vol. 17, 38, pp. 4015–4017, 2007.
[84] K. L. Heredia, D. Bontempo, T. Ly, J. T. Byers, S. Halstenberg, and H. D. May-nard, “In situ preparation of protein - smart polymer conjugates with reten-tion of activity,” Journal of American Chemical Society, vol. 127, p. 16955,2005.
[85] J. Nicolas, V. San Miguel, G. Mantovani, and D. M. Haddleton, “Flu-orescently tagged polymer bioconjugates from protein derived macro-initiators,” Chemical Communications, vol. 1, pp. 4697–4699, 2006.
[86] S. Venkataraman and K. L. Wooley, “ATRP from an amino-based initiator:a facile approach for α-functionalized polymers,” Macromolecules, vol. 39,pp. 9661–9664, 2006.
[87] H. G. Börner, “Functional polymer-bioconjugates as molecular lego,”Macromolecular Chemistry and Physics, vol. 208, pp. 124–130, 2007.
[88] L. Albertin, M. H. Stenzel, C. Barner-Kowollik, L. J. R. Foster, and T. P. Davis,“Well-defined diblock glycopolymers from RAFT polymerization in homo-geneous aqueous medium,” Macromolecules, vol. 38, pp. 9075–9084, 2005.
[89] J. M. Hannink, J. J. L. M. Cornelissen, J. A. Farrera, P. Foubert, F. C.De Schryver, N. A. J. M. Sommerdijk, and R. J. M. Nolte, “Protein-polymer hy-brid amphiphiles,” Angewandte Chemie- International Edition, vol. 40, 24,pp. 4732–4734, 2001.
131
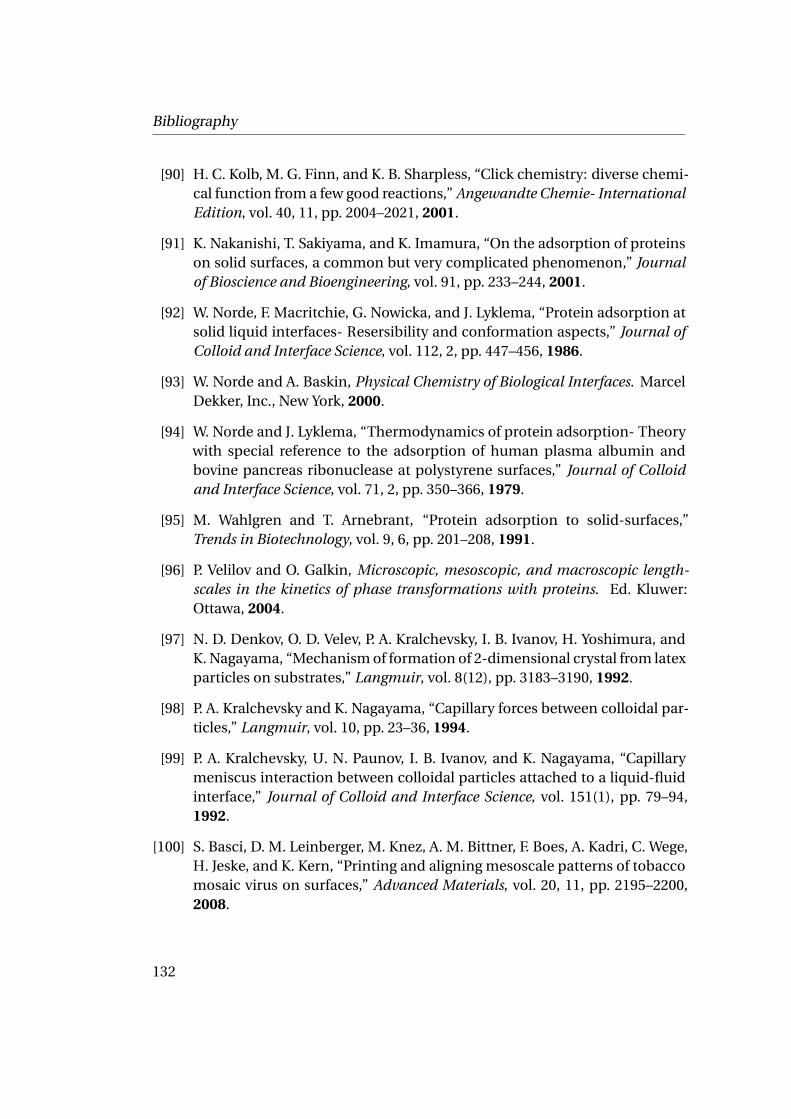
Bibliography
[90] H. C. Kolb, M. G. Finn, and K. B. Sharpless, “Click chemistry: diverse chemi-cal function from a few good reactions,” Angewandte Chemie- InternationalEdition, vol. 40, 11, pp. 2004–2021, 2001.
[91] K. Nakanishi, T. Sakiyama, and K. Imamura, “On the adsorption of proteinson solid surfaces, a common but very complicated phenomenon,” Journalof Bioscience and Bioengineering, vol. 91, pp. 233–244, 2001.
[92] W. Norde, F. Macritchie, G. Nowicka, and J. Lyklema, “Protein adsorption atsolid liquid interfaces- Resersibility and conformation aspects,” Journal ofColloid and Interface Science, vol. 112, 2, pp. 447–456, 1986.
[93] W. Norde and A. Baskin, Physical Chemistry of Biological Interfaces. MarcelDekker, Inc., New York, 2000.
[94] W. Norde and J. Lyklema, “Thermodynamics of protein adsorption- Theorywith special reference to the adsorption of human plasma albumin andbovine pancreas ribonuclease at polystyrene surfaces,” Journal of Colloidand Interface Science, vol. 71, 2, pp. 350–366, 1979.
[95] M. Wahlgren and T. Arnebrant, “Protein adsorption to solid-surfaces,”Trends in Biotechnology, vol. 9, 6, pp. 201–208, 1991.
[96] P. Velilov and O. Galkin, Microscopic, mesoscopic, and macroscopic length-scales in the kinetics of phase transformations with proteins. Ed. Kluwer:Ottawa, 2004.
[97] N. D. Denkov, O. D. Velev, P. A. Kralchevsky, I. B. Ivanov, H. Yoshimura, andK. Nagayama, “Mechanism of formation of 2-dimensional crystal from latexparticles on substrates,” Langmuir, vol. 8(12), pp. 3183–3190, 1992.
[98] P. A. Kralchevsky and K. Nagayama, “Capillary forces between colloidal par-ticles,” Langmuir, vol. 10, pp. 23–36, 1994.
[99] P. A. Kralchevsky, U. N. Paunov, I. B. Ivanov, and K. Nagayama, “Capillarymeniscus interaction between colloidal particles attached to a liquid-fluidinterface,” Journal of Colloid and Interface Science, vol. 151(1), pp. 79–94,1992.
[100] S. Basci, D. M. Leinberger, M. Knez, A. M. Bittner, F. Boes, A. Kadri, C. Wege,H. Jeske, and K. Kern, “Printing and aligning mesoscale patterns of tobaccomosaic virus on surfaces,” Advanced Materials, vol. 20, 11, pp. 2195–2200,2008.
132
Bibliography
[101] S. Kumagai, S. Yoshii, K. Yamada, N. Matsukawa, I. Fujiwara, K. Iwahori, andI. Yamashita, “Electrostatic placement of single ferritin molecules,” AppliedPhysics Letters, vol. 88, 15, pp. 1531031–1531033, 2006.
[102] N. D. Denkov, “Two-dimensional crystallization,” Nature, vol. 361(6407),p. 26, 1993.
[103] Z. C. Zhou, Q. Li, and X. S. Zhao, “Evolution of interparticle capillary forcesduring drying of colloidal crystals,” Langmuir, vol. 22(8), pp. 3692–3697,2006.
[104] P. A. Kralchevsky and N. D. Denkov, “Capillary forces and structuring in lay-ers of colloid particles,” Current Opinion in Colloid and Interface Science,vol. 6(4), pp. 383–401, 2001.
[105] K. Uto, K. Yamamoto, N. Kishimoto, M. Muraoka, T. Aoyagi, and I. Ya-mashita, “Electrostatic adsorption of ferritin, proteins and nanoparticleconjugate onto the surface of polyelectrolyte multilayers,” Journal of Ma-terials Chemistry, vol. 18, 32, pp. 3876–3884, 2008.
[106] Z. Yuan, D. N. Petsev, B. G. Prevo, O. D. Velev, and P. Atanassov, “Two-dimensional nanoparticle arrays derived from ferritin monolayers,” Lang-muir, vol. 23, 10, pp. 5498–5504, 2007.
[107] A. P. F. Turner, I. Karube, and G. Wilson, Biosensors: Fundamentals and Ap-plications. University Press: Oxford, 1987.
[108] H. Nygren, “Nonlinear kinetics of ferritin adsorption,” Biophysical Journal,vol. 65, pp. 1508–1512, 1993.
[109] F. Caruso, D. N. Furlong, and P. Kingshott, “Characterization of ferritinadsorption onto gold,” Journal of Colloid and Interface Science, vol. 186,pp. 129–140, 1997.
[110] M. J. Waner, M. Gilchrist, M. Schindler, and M. Dantus, “Imaging the molec-ular dimensions and oligomerization of proteins at liquid/solid interfaces,”Journal of Physical Chemistry, vol. 102, pp. 1649–1657, 1998.
[111] P. Lavalle, C. Gergely, A. Lustig, and V. Ball, “Critical analysis of the apofer-ritin adsorption at solid-liquid interfaces in the framework of a particularadsorption model,” Journal of Chemical Physics, vol. 113, pp. 8212–8224,2000.
133
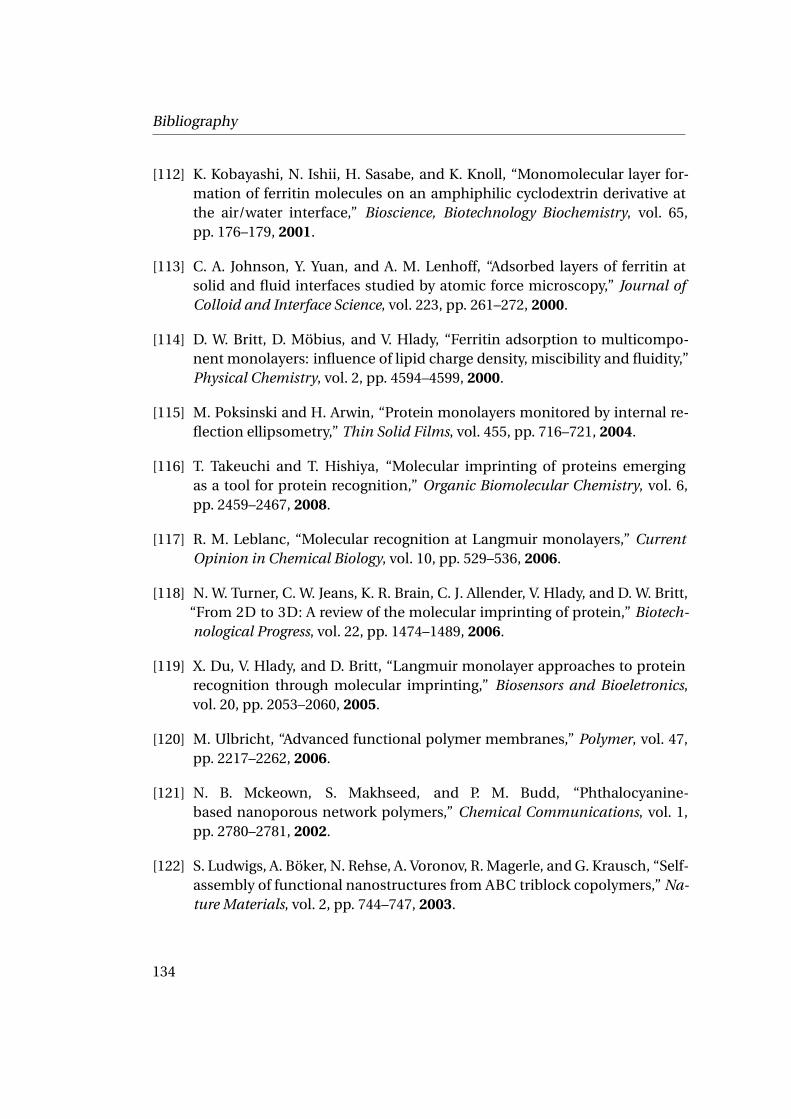
Bibliography
[112] K. Kobayashi, N. Ishii, H. Sasabe, and K. Knoll, “Monomolecular layer for-mation of ferritin molecules on an amphiphilic cyclodextrin derivative atthe air/water interface,” Bioscience, Biotechnology Biochemistry, vol. 65,pp. 176–179, 2001.
[113] C. A. Johnson, Y. Yuan, and A. M. Lenhoff, “Adsorbed layers of ferritin atsolid and fluid interfaces studied by atomic force microscopy,” Journal ofColloid and Interface Science, vol. 223, pp. 261–272, 2000.
[114] D. W. Britt, D. Möbius, and V. Hlady, “Ferritin adsorption to multicompo-nent monolayers: influence of lipid charge density, miscibility and fluidity,”Physical Chemistry, vol. 2, pp. 4594–4599, 2000.
[115] M. Poksinski and H. Arwin, “Protein monolayers monitored by internal re-flection ellipsometry,” Thin Solid Films, vol. 455, pp. 716–721, 2004.
[116] T. Takeuchi and T. Hishiya, “Molecular imprinting of proteins emergingas a tool for protein recognition,” Organic Biomolecular Chemistry, vol. 6,pp. 2459–2467, 2008.
[117] R. M. Leblanc, “Molecular recognition at Langmuir monolayers,” CurrentOpinion in Chemical Biology, vol. 10, pp. 529–536, 2006.
[118] N. W. Turner, C. W. Jeans, K. R. Brain, C. J. Allender, V. Hlady, and D. W. Britt,“From 2D to 3D: A review of the molecular imprinting of protein,” Biotech-nological Progress, vol. 22, pp. 1474–1489, 2006.
[119] X. Du, V. Hlady, and D. Britt, “Langmuir monolayer approaches to proteinrecognition through molecular imprinting,” Biosensors and Bioeletronics,vol. 20, pp. 2053–2060, 2005.
[120] M. Ulbricht, “Advanced functional polymer membranes,” Polymer, vol. 47,pp. 2217–2262, 2006.
[121] N. B. Mckeown, S. Makhseed, and P. M. Budd, “Phthalocyanine-based nanoporous network polymers,” Chemical Communications, vol. 1,pp. 2780–2781, 2002.
[122] S. Ludwigs, A. Böker, N. Rehse, A. Voronov, R. Magerle, and G. Krausch, “Self-assembly of functional nanostructures from ABC triblock copolymers,” Na-ture Materials, vol. 2, pp. 744–747, 2003.
134
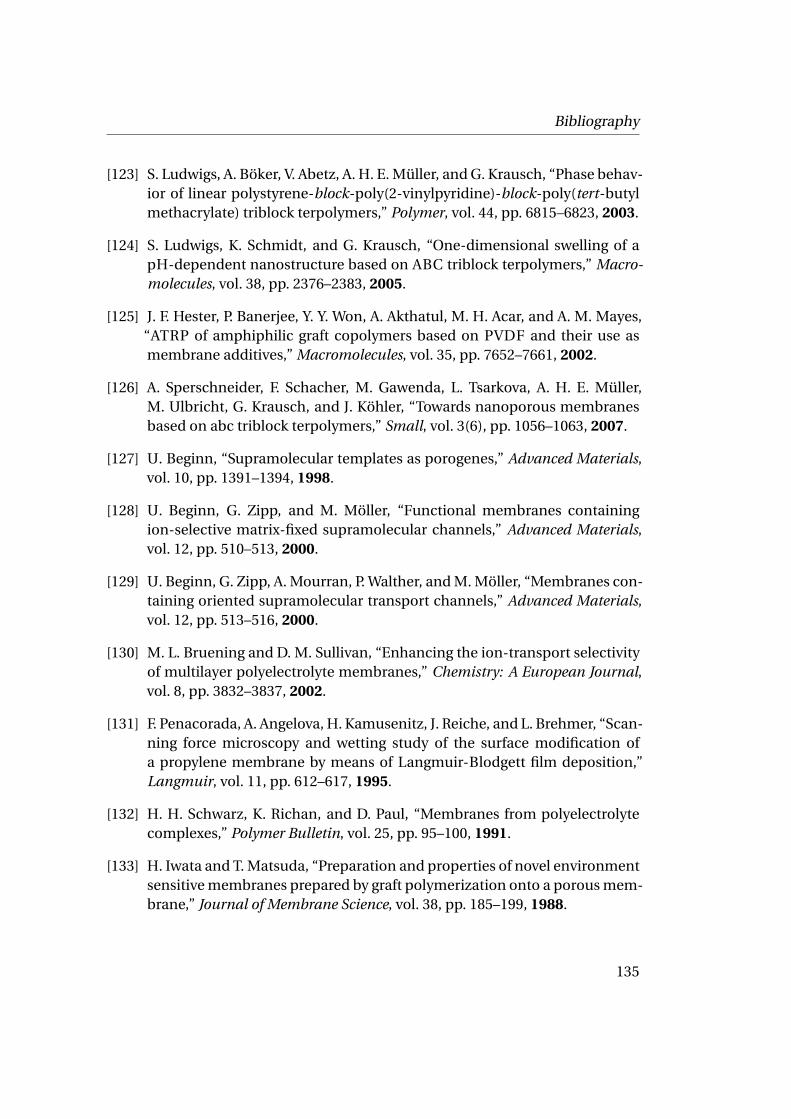
Bibliography
[123] S. Ludwigs, A. Böker, V. Abetz, A. H. E. Müller, and G. Krausch, “Phase behav-ior of linear polystyrene-block-poly(2-vinylpyridine)-block-poly(tert-butylmethacrylate) triblock terpolymers,” Polymer, vol. 44, pp. 6815–6823, 2003.
[124] S. Ludwigs, K. Schmidt, and G. Krausch, “One-dimensional swelling of apH-dependent nanostructure based on ABC triblock terpolymers,” Macro-molecules, vol. 38, pp. 2376–2383, 2005.
[125] J. F. Hester, P. Banerjee, Y. Y. Won, A. Akthatul, M. H. Acar, and A. M. Mayes,“ATRP of amphiphilic graft copolymers based on PVDF and their use asmembrane additives,” Macromolecules, vol. 35, pp. 7652–7661, 2002.
[126] A. Sperschneider, F. Schacher, M. Gawenda, L. Tsarkova, A. H. E. Müller,M. Ulbricht, G. Krausch, and J. Köhler, “Towards nanoporous membranesbased on abc triblock terpolymers,” Small, vol. 3(6), pp. 1056–1063, 2007.
[127] U. Beginn, “Supramolecular templates as porogenes,” Advanced Materials,vol. 10, pp. 1391–1394, 1998.
[128] U. Beginn, G. Zipp, and M. Möller, “Functional membranes containingion-selective matrix-fixed supramolecular channels,” Advanced Materials,vol. 12, pp. 510–513, 2000.
[129] U. Beginn, G. Zipp, A. Mourran, P. Walther, and M. Möller, “Membranes con-taining oriented supramolecular transport channels,” Advanced Materials,vol. 12, pp. 513–516, 2000.
[130] M. L. Bruening and D. M. Sullivan, “Enhancing the ion-transport selectivityof multilayer polyelectrolyte membranes,” Chemistry: A European Journal,vol. 8, pp. 3832–3837, 2002.
[131] F. Penacorada, A. Angelova, H. Kamusenitz, J. Reiche, and L. Brehmer, “Scan-ning force microscopy and wetting study of the surface modification ofa propylene membrane by means of Langmuir-Blodgett film deposition,”Langmuir, vol. 11, pp. 612–617, 1995.
[132] H. H. Schwarz, K. Richan, and D. Paul, “Membranes from polyelectrolytecomplexes,” Polymer Bulletin, vol. 25, pp. 95–100, 1991.
[133] H. Iwata and T. Matsuda, “Preparation and properties of novel environmentsensitive membranes prepared by graft polymerization onto a porous mem-brane,” Journal of Membrane Science, vol. 38, pp. 185–199, 1988.
135
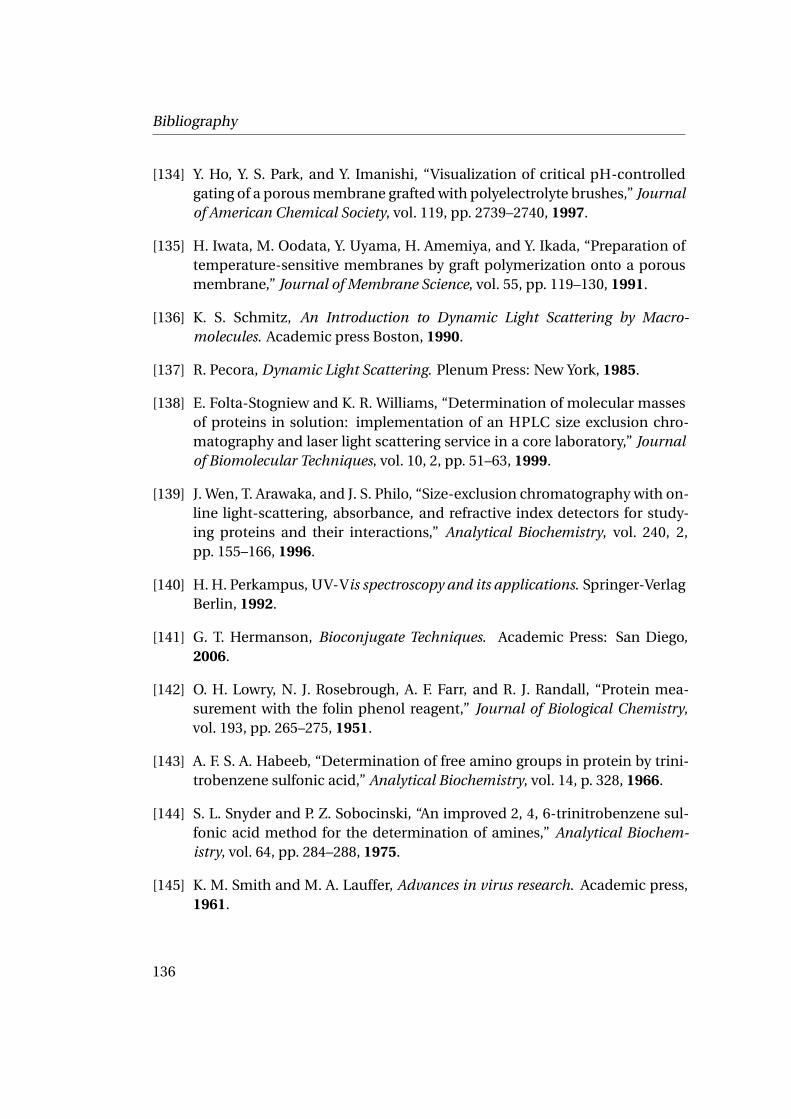
Bibliography
[134] Y. Ho, Y. S. Park, and Y. Imanishi, “Visualization of critical pH-controlledgating of a porous membrane grafted with polyelectrolyte brushes,” Journalof American Chemical Society, vol. 119, pp. 2739–2740, 1997.
[135] H. Iwata, M. Oodata, Y. Uyama, H. Amemiya, and Y. Ikada, “Preparation oftemperature-sensitive membranes by graft polymerization onto a porousmembrane,” Journal of Membrane Science, vol. 55, pp. 119–130, 1991.
[136] K. S. Schmitz, An Introduction to Dynamic Light Scattering by Macro-molecules. Academic press Boston, 1990.
[137] R. Pecora, Dynamic Light Scattering. Plenum Press: New York, 1985.
[138] E. Folta-Stogniew and K. R. Williams, “Determination of molecular massesof proteins in solution: implementation of an HPLC size exclusion chro-matography and laser light scattering service in a core laboratory,” Journalof Biomolecular Techniques, vol. 10, 2, pp. 51–63, 1999.
[139] J. Wen, T. Arawaka, and J. S. Philo, “Size-exclusion chromatography with on-line light-scattering, absorbance, and refractive index detectors for study-ing proteins and their interactions,” Analytical Biochemistry, vol. 240, 2,pp. 155–166, 1996.
[140] H. H. Perkampus, UV-Vis spectroscopy and its applications. Springer-VerlagBerlin, 1992.
[141] G. T. Hermanson, Bioconjugate Techniques. Academic Press: San Diego,2006.
[142] O. H. Lowry, N. J. Rosebrough, A. F. Farr, and R. J. Randall, “Protein mea-surement with the folin phenol reagent,” Journal of Biological Chemistry,vol. 193, pp. 265–275, 1951.
[143] A. F. S. A. Habeeb, “Determination of free amino groups in protein by trini-trobenzene sulfonic acid,” Analytical Biochemistry, vol. 14, p. 328, 1966.
[144] S. L. Snyder and P. Z. Sobocinski, “An improved 2, 4, 6-trinitrobenzene sul-fonic acid method for the determination of amines,” Analytical Biochem-istry, vol. 64, pp. 284–288, 1975.
[145] K. M. Smith and M. A. Lauffer, Advances in virus research. Academic press,1961.
136
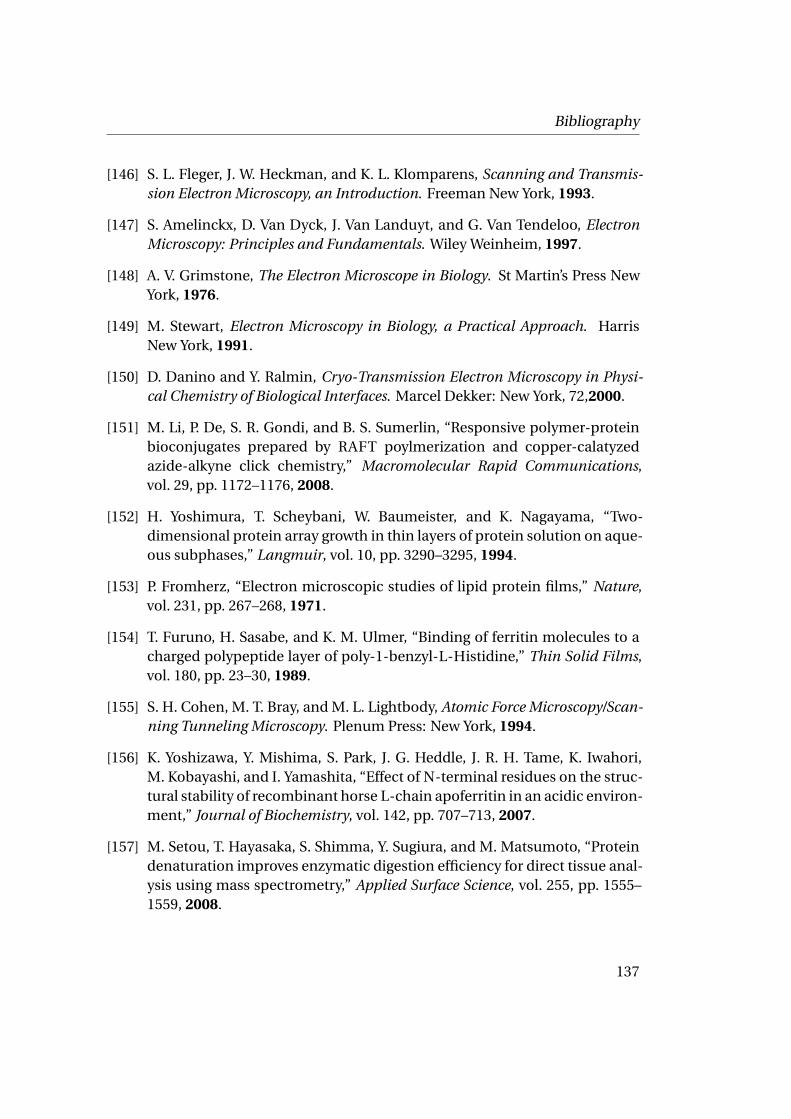
Bibliography
[146] S. L. Fleger, J. W. Heckman, and K. L. Klomparens, Scanning and Transmis-sion Electron Microscopy, an Introduction. Freeman New York, 1993.
[147] S. Amelinckx, D. Van Dyck, J. Van Landuyt, and G. Van Tendeloo, ElectronMicroscopy: Principles and Fundamentals. Wiley Weinheim, 1997.
[148] A. V. Grimstone, The Electron Microscope in Biology. St Martin’s Press NewYork, 1976.
[149] M. Stewart, Electron Microscopy in Biology, a Practical Approach. HarrisNew York, 1991.
[150] D. Danino and Y. Ralmin, Cryo-Transmission Electron Microscopy in Physi-cal Chemistry of Biological Interfaces. Marcel Dekker: New York, 72,2000.
[151] M. Li, P. De, S. R. Gondi, and B. S. Sumerlin, “Responsive polymer-proteinbioconjugates prepared by RAFT poylmerization and copper-calatyzedazide-alkyne click chemistry,” Macromolecular Rapid Communications,vol. 29, pp. 1172–1176, 2008.
[152] H. Yoshimura, T. Scheybani, W. Baumeister, and K. Nagayama, “Two-dimensional protein array growth in thin layers of protein solution on aque-ous subphases,” Langmuir, vol. 10, pp. 3290–3295, 1994.
[153] P. Fromherz, “Electron microscopic studies of lipid protein films,” Nature,vol. 231, pp. 267–268, 1971.
[154] T. Furuno, H. Sasabe, and K. M. Ulmer, “Binding of ferritin molecules to acharged polypeptide layer of poly-1-benzyl-L-Histidine,” Thin Solid Films,vol. 180, pp. 23–30, 1989.
[155] S. H. Cohen, M. T. Bray, and M. L. Lightbody, Atomic Force Microscopy/Scan-ning Tunneling Microscopy. Plenum Press: New York, 1994.
[156] K. Yoshizawa, Y. Mishima, S. Park, J. G. Heddle, J. R. H. Tame, K. Iwahori,M. Kobayashi, and I. Yamashita, “Effect of N-terminal residues on the struc-tural stability of recombinant horse L-chain apoferritin in an acidic environ-ment,” Journal of Biochemistry, vol. 142, pp. 707–713, 2007.
[157] M. Setou, T. Hayasaka, S. Shimma, Y. Sugiura, and M. Matsumoto, “Proteindenaturation improves enzymatic digestion efficiency for direct tissue anal-ysis using mass spectrometry,” Applied Surface Science, vol. 255, pp. 1555–1559, 2008.
137
Bibliography
[158] F. Hillenkamp and J. Peter-Katalinic, MALDI-MS a practical guide to instru-mentation, methods and applications. Wiley: Weinheim, 2007.
[159] R. M. Kamp, T. Choli-Papadopoulou, and B. Wittmann-Liebold, Pro-tein structure and its preparation, characterization and microsequencing.Springer-Verlag Berlin, 1997.
[160] A. L. Shapiro, E. Vinuela, and J. L. Maizel, “Molecular weight estimationof polypeptide chains by electrophoresis in SDS-Polyacrylamide gels,” Bio-chemical and Biophysical Research Communications, vol. 28, 5, p. 815, 1967.
[161] K. Weber and M. Osborn, “Reliability of molecular weight determinationsby dodecyl sulfate-polyacrylamide gel electrophoresis,” Journal of Biologi-cal Chemistry, vol. 244, 16, p. 4406, 1969.
[162] D. C. Coughlan and O. I. Corrigan, “Drug-polymer interactions and theireffect on thermoresponsive poly(N-isopropylacrylamide) drug delivery sys-tems,” International Journal of Pharmaceutics, vol. 313, p. 163, 2006.
[163] S. Kulkarni, C. Schilli, A. H. E. Müller, A. S. Hoffman, and P. S. Stayton,“Reversible meso-scale smart polymer-protein particles of controlled sizes,”Bioconjugate Chemistry, vol. 15, p. 747, 2004.
[164] C. C. Yang, Y. Tian, A. K. Y. Jen, and W. C. Chen, “New environmentally re-sponsive fluorescent N-isopropylacrylamide copolymer and its applicationto DNA sensing,” Journal of Polymer Science, Part A: Polymer Chemistry,vol. 44, p. 5495, 2006.
[165] C. J. Hawker, A. W. Bosman, and E. Harth, “New polymer synthesis by nitrox-ide mediated living radical polymerizations,” Chemical Reviews, vol. 101,p. 3661, 2001.
[166] T. Schulte, K. O. Siegenthaler, H. Luftmann, M. Letzel, and A. Studer,“Nitroxide-mediated polymerization of N-isopropylacrylamide: electro-spray ionization mass spectrometry, matrix assisted laser desorption ion-ization mass spectrometry, and multiple.angle laser light scattering stud-ies on nitroxide-terminated poly-N-isopropylacrylamide,” Macromolecules,vol. 38, p. 6833, 2005.
[167] A. Studer and T. Schulte, “Nitroxide-mediated radical processes,” ChemicalRecord, vol. 5, p. 27, 2005.
138
Bibliography
[168] A. Favier and M.-T. Charreyre, “Experimental requirements for an effi-cient control of free-radical polymerizations via the reversible addition-fragmentation chain transfer (RAFT) process,” Macromolecular Rapid Com-munications, vol. 27, p. 653, 2006.
[169] G. Moad, Y. K. Chong, A. Postma, E. Rizzardo, and S. H. Thang, “Advances inRAFT polymerization: the synthesis of polymers with defined end groups,”Polymer, vol. 46, p. 8458, 2005.
[170] M. J. Monteiro, “Design strategies for controlling the molecular weight andrate using reversible addition-fragmentation chain transfer mediated livingradical polymerization,” Journal of Polymer Science, Part A: Polymer Chem-istry, vol. 43, p. 3189, 2005.
[171] K. Matyjaszewski, J. Spanswick, and B. S. Sumerlin, Preparation, characteri-zation, and applications of polymers synthesized by Atom Transfer RadicalPolymerization. Nova Science Publishers: New York, 2006.
[172] P. E. Millard, L. Barner, M. H. Stezel, C. Barner-Kowollik, and A. H. E. Müller,“RAFT polymerization of N-isopropylacrylamide and acrylic acid,” Macro-molecular Rapid Communications, vol. 27, p. 821, 2006.
[173] X. Lou, C. Wang, and L. He, “Core-shell au nanoparticles formation withDNA-polymer hybrid coatings using aqueous ATRP,” Biomacromolecules,vol. 8, p. 1385, 2007.
[174] P. E. Millard, N. C. Mougin, A. Böker, and A. H. E. Müller, “Fast ATRP ofN-isopropylacrylamide in water and its application to bioconjugates,” Poly-mer Preprints (American Chemical Society, Division of Polymer Chemistry),vol. 49, p. 121, 2008.
[175] N. C. Mougin, A. H. E. Müller, and A. Böker, “Towards a self-assembledmembrane made of bionanoparticle-polymer conjugates,” PMSE Preprints(American Chemical Society, Division of Polymeric Materials Science and En-gineering), vol. 99, p. 713, 2008.
[176] G. Masci, L. Giacomelli, and V. Crescenzi, “Atom transfer radical polymeriza-tion of N-isopropylacrylamide,” Macromolecular Rapid Communications,vol. 25, p. 559, 2004.
139
Bibliography
[177] Y. Xia, X. Yin, N. A. D. Burke, and H. D. H. Stoever, “Thermoresponse ofnarrow-disperse Poly(N-isopropylacrylamide) prepared by atom transferradical polymerization,” Macromolecules, vol. 38, p. 5937, 2005.
[178] K. H. Kim, J. Kim, and W. H. Jo, “Preparation of hydrogel nanoparticles byatom transfer radical polymerization of N-isopropylacrylamide in aqueousmedia using PEG macro-initiator,” Polymer, vol. 46, p. 2836, 2005.
[179] K. Ranganathan, R. Deng, R. K. Kainthan, C. Wu, D. E. Brooks, and J. N.Kizhakkedathu, “Synthesis of thermoresponsive mixed arm star polymersby combination of RAFT and ATRP from a multifunctional core and its self-assembly in water,” Macromolecules, vol. 41, p. 4226, 2008.
[180] J. Cheng, L. Wang, J. Huo, H. Yu, Q. Yang, and L. Deng, “Study on synthe-sis of poly-N-isopropylacrylamide grafted carbon black and temperature-dependence conductivity of grafted carbon black/epoxy composites,” Jour-nal of Polymer Science, Part B: Polymer Physics, vol. 46, p. 1529, 2008.
[181] D. J. Kim, J. Y. Heo, K. S. Kim, and I. S. Choi, “Formation of thermore-sponsive poly(N-isopropylacrylamide)/dextran particles by atom transferradical polymerization,” Macromolecular Rapid Communications, vol. 24,p. 517, 2003.
[182] D. J. Kim, S. M. Kang, B. Kong, W. J. Kim, H. J. Paik, H. Choi, and I. S. Choi,“Formation of thermoresponsive gold nanoparticle/PNIPAAm hybrids bysurface initiated, atom transfer radical polymerization in aqueous media,”Macromolecular Chemistry and Physics, vol. 206, p. 1941, 2005.
[183] V. Mittal, N. B. Matsko, A. Butte, and M. Morbidelli, “Synthesis of temper-ature responsive polymer brushes from polystyrene latex particles func-tionalized with ATRP initiator,” European Polymer Journal, vol. 43, p. 4868,2007.
[184] A. Mizutani, A. Kikuchi, M. Yamato, H. Kanazawa, and T. Okano, “Prepara-tion of thermoresponsive polymer brush surfaces and their interaction withcells,” Biomaterials, vol. 29, p. 2073, 2008.
[185] J. N. Kizhakkedathu, K. R. Kumar, D. Goodman, and D. E. Brooks, “Synthesisand characterization of well-defined hydrophilic block copolymer brushesby aqueous ATRP,” Polymer, vol. 45, p. 7471, 2004.
140
Bibliography
[186] J. N. Kizhakkedathu, R. Norris-Jones, and D. E. Brooks, “Synthesis of well-defined environmentally responsive polymer brushes by aqueous ATRP,”Macromolecules, vol. 37, p. 734, 2004.
[187] M. Ciampolini and N. Nardi, “Five-coordinated high spin complexes of biva-lent cobalt, nickel and copper with tris(2-dimethylaminoethyl)amine,” Inor-ganic chemistry, vol. 5, p. 41, 1966.
[188] G. Golub, A. Lashaz, H. Cohen, P. Paoletti, B. Andrea, B. Valtancoli, andD. Meyerstein, “The effect of N-methylation of tetra-aza-alkane coppercomplexes on the axial binding of anions,” Inorganica Chimica Acta,vol. 255, p. 11, 1997.
[189] N. V. Tsarevsky, W. A. Braunecker, A. Vacca, P. Gans, and K. Matyjaszewski,“Competitive equilibria in atom transfer radical polymerization,” Macro-molecules Symposium, vol. 248, p. 60, 2007.
[190] A. Narumi, K. Fuchise, R. Kakuchi, A. Toda, T. Satoh, S. Kawaguchi,K. Sugiyama, A. Hirao, and T. Kakuchi, “A versatile method for adjust-ing thermoresponsivity: synthesis and click reaction of an azido end-functionalized poly(n-isopropylacrylamide),” Macromolecular Rapid Com-munications, vol. 29, p. 1126, 2008.
[191] S. Mendrek, A. Mendrek, H.-J. Adler, W. Walach, A. Dworak, and D. Kuckling,“Synthesis of poly(glycidol)-block-poly(N-isopropylacrylamide) copoly-mers using new hydrophilic poly(glycidol) macro-initiator,” Journal ofPolymer Science, Part A: Polymer Chemistry, vol. 46, p. 2488, 2008.
[192] W. Tang and K. Matyjaszewski, “Effect of ligand structure on activation rateconstants in ATRP,” Macromolecules, vol. 39, p. 4953, 2006.
[193] X. Zhang, J. Xia, and K. Matyjaszewski, “Controlled/living radical polymer-ization of 2-(dimethylamino)ethyl methacrylate,” Macromolecules, vol. 31,p. 5167, 1998.
[194] N. V. Tsarevski and K. Matyjaszewski, “Green Atom Transfer RadicalPolymerization: from process design to preparation of well-defined en-vironmentally friendly polymeric materials,” Chemical Review, vol. 107,p. 2270, 2007.
141
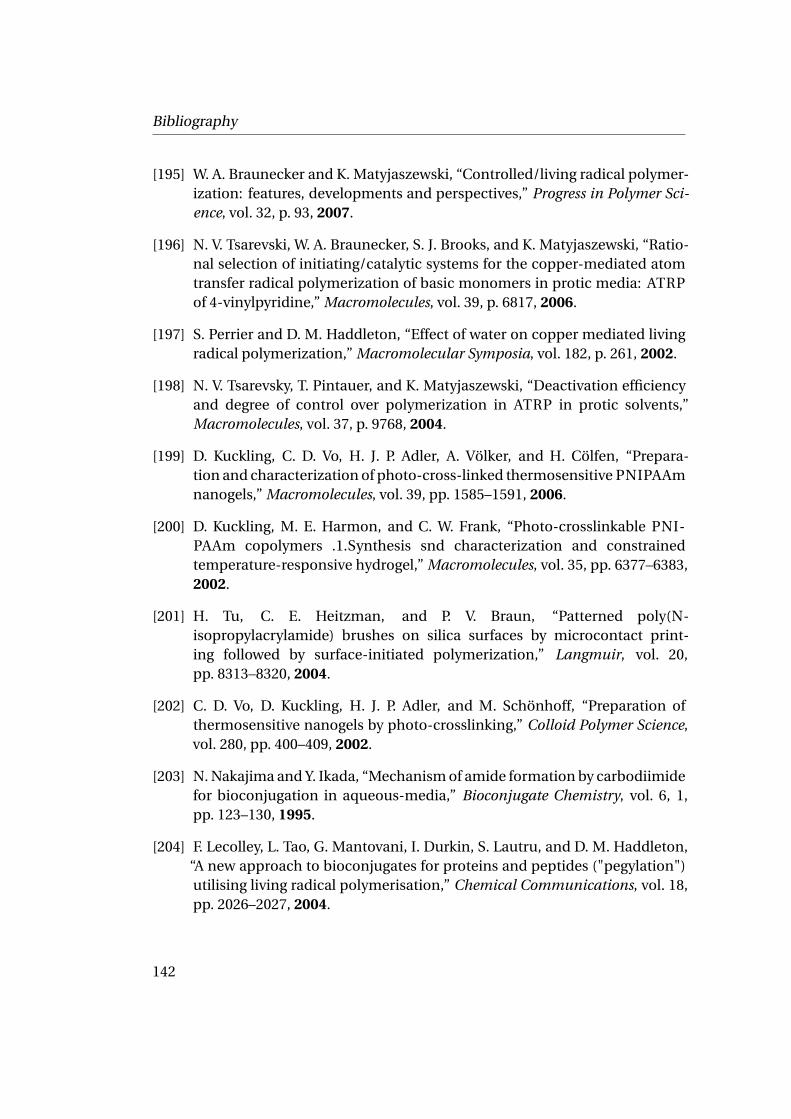
Bibliography
[195] W. A. Braunecker and K. Matyjaszewski, “Controlled/living radical polymer-ization: features, developments and perspectives,” Progress in Polymer Sci-ence, vol. 32, p. 93, 2007.
[196] N. V. Tsarevski, W. A. Braunecker, S. J. Brooks, and K. Matyjaszewski, “Ratio-nal selection of initiating/catalytic systems for the copper-mediated atomtransfer radical polymerization of basic monomers in protic media: ATRPof 4-vinylpyridine,” Macromolecules, vol. 39, p. 6817, 2006.
[197] S. Perrier and D. M. Haddleton, “Effect of water on copper mediated livingradical polymerization,” Macromolecular Symposia, vol. 182, p. 261, 2002.
[198] N. V. Tsarevsky, T. Pintauer, and K. Matyjaszewski, “Deactivation efficiencyand degree of control over polymerization in ATRP in protic solvents,”Macromolecules, vol. 37, p. 9768, 2004.
[199] D. Kuckling, C. D. Vo, H. J. P. Adler, A. Völker, and H. Cölfen, “Prepara-tion and characterization of photo-cross-linked thermosensitive PNIPAAmnanogels,” Macromolecules, vol. 39, pp. 1585–1591, 2006.
[200] D. Kuckling, M. E. Harmon, and C. W. Frank, “Photo-crosslinkable PNI-PAAm copolymers .1.Synthesis snd characterization and constrainedtemperature-responsive hydrogel,” Macromolecules, vol. 35, pp. 6377–6383,2002.
[201] H. Tu, C. E. Heitzman, and P. V. Braun, “Patterned poly(N-isopropylacrylamide) brushes on silica surfaces by microcontact print-ing followed by surface-initiated polymerization,” Langmuir, vol. 20,pp. 8313–8320, 2004.
[202] C. D. Vo, D. Kuckling, H. J. P. Adler, and M. Schönhoff, “Preparation ofthermosensitive nanogels by photo-crosslinking,” Colloid Polymer Science,vol. 280, pp. 400–409, 2002.
[203] N. Nakajima and Y. Ikada, “Mechanism of amide formation by carbodiimidefor bioconjugation in aqueous-media,” Bioconjugate Chemistry, vol. 6, 1,pp. 123–130, 1995.
[204] F. Lecolley, L. Tao, G. Mantovani, I. Durkin, S. Lautru, and D. M. Haddleton,“A new approach to bioconjugates for proteins and peptides ("pegylation")utilising living radical polymerisation,” Chemical Communications, vol. 18,pp. 2026–2027, 2004.
142
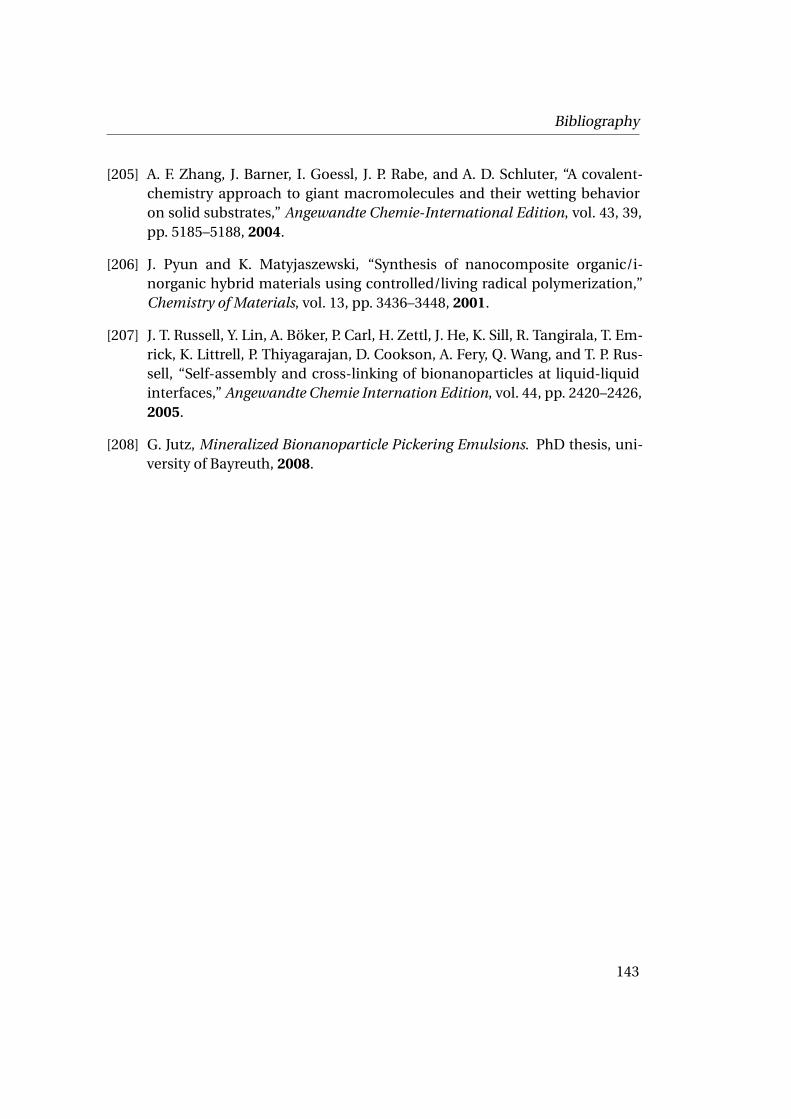
Bibliography
[205] A. F. Zhang, J. Barner, I. Goessl, J. P. Rabe, and A. D. Schluter, “A covalent-chemistry approach to giant macromolecules and their wetting behavioron solid substrates,” Angewandte Chemie-International Edition, vol. 43, 39,pp. 5185–5188, 2004.
[206] J. Pyun and K. Matyjaszewski, “Synthesis of nanocomposite organic/i-norganic hybrid materials using controlled/living radical polymerization,”Chemistry of Materials, vol. 13, pp. 3436–3448, 2001.
[207] J. T. Russell, Y. Lin, A. Böker, P. Carl, H. Zettl, J. He, K. Sill, R. Tangirala, T. Em-rick, K. Littrell, P. Thiyagarajan, D. Cookson, A. Fery, Q. Wang, and T. P. Rus-sell, “Self-assembly and cross-linking of bionanoparticles at liquid-liquidinterfaces,” Angewandte Chemie Internation Edition, vol. 44, pp. 2420–2426,2005.
[208] G. Jutz, Mineralized Bionanoparticle Pickering Emulsions. PhD thesis, uni-versity of Bayreuth, 2008.
143

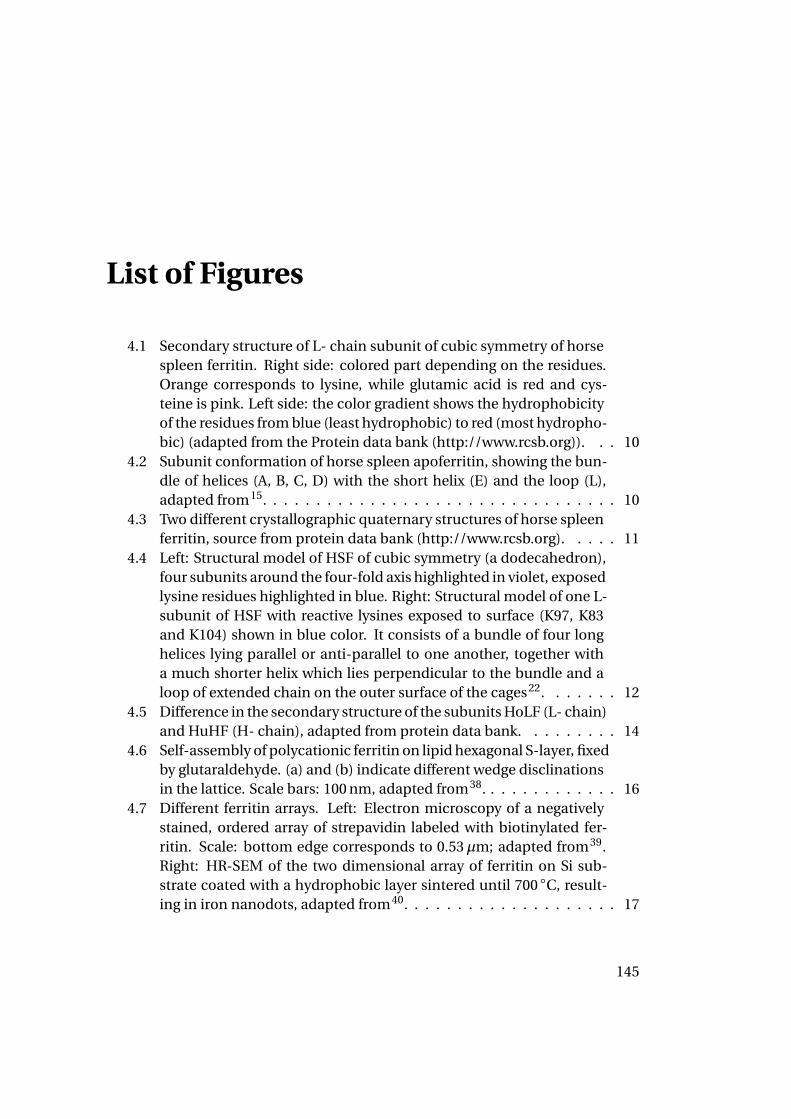
List of Figures
4.1 Secondary structure of L- chain subunit of cubic symmetry of horsespleen ferritin. Right side: colored part depending on the residues.Orange corresponds to lysine, while glutamic acid is red and cys-teine is pink. Left side: the color gradient shows the hydrophobicityof the residues from blue (least hydrophobic) to red (most hydropho-bic) (adapted from the Protein data bank (http://www.rcsb.org)). . . 10
4.2 Subunit conformation of horse spleen apoferritin, showing the bun-dle of helices (A, B, C, D) with the short helix (E) and the loop (L),adapted from15. . . . . . . . . . . . . . . . . . . . . . . . . . . . . . . . . 10
4.3 Two different crystallographic quaternary structures of horse spleenferritin, source from protein data bank (http://www.rcsb.org). . . . . 11
4.4 Left: Structural model of HSF of cubic symmetry (a dodecahedron),four subunits around the four-fold axis highlighted in violet, exposedlysine residues highlighted in blue. Right: Structural model of one L-subunit of HSF with reactive lysines exposed to surface (K97, K83and K104) shown in blue color. It consists of a bundle of four longhelices lying parallel or anti-parallel to one another, together witha much shorter helix which lies perpendicular to the bundle and aloop of extended chain on the outer surface of the cages22. . . . . . . 12
4.5 Difference in the secondary structure of the subunits HoLF (L- chain)and HuHF (H- chain), adapted from protein data bank. . . . . . . . . 14
4.6 Self-assembly of polycationic ferritin on lipid hexagonal S-layer, fixedby glutaraldehyde. (a) and (b) indicate different wedge disclinationsin the lattice. Scale bars: 100 nm, adapted from38. . . . . . . . . . . . . 16
4.7 Different ferritin arrays. Left: Electron microscopy of a negativelystained, ordered array of strepavidin labeled with biotinylated fer-ritin. Scale: bottom edge corresponds to 0.53µm; adapted from39.Right: HR-SEM of the two dimensional array of ferritin on Si sub-strate coated with a hydrophobic layer sintered until 700 ◦C, result-ing in iron nanodots, adapted from40. . . . . . . . . . . . . . . . . . . . 17
145
List of Figures
4.8 Possible reaction pathways for nanoscale synthesis using the pro-tein ferritin: (a) mineralization/demineralization, (b) metathesis min-eralization; (c) hydrolysis polymerization, adapted from15. . . . . . . 18
4.9 Transition metal catalyzed ATRP scheme. . . . . . . . . . . . . . . . . . 19
4.10 Scheme of the time-dependence of the conversion in linear and semi-logarithmic coordinates. . . . . . . . . . . . . . . . . . . . . . . . . . . . 22
4.11 The grafting to and grafting from strategies applied to nanoparticles. 23
4.12 Phase diagram to evaluate the LCST and the cloud points Tc . . . . . . 24
4.13 Different amine reactive molecules used for bioconjugation reactionstowards ε-amino groups from lysine, R’ can also represent polymerssuch as PEG70. . . . . . . . . . . . . . . . . . . . . . . . . . . . . . . . . . 26
4.14 Adsorption/desorption process of a protein molecule. . . . . . . . . . 30
4.15 Two particles partially immersed in a thin liquid film. Attractive im-mersion capillary forces evolve between them, defined by the con-tact angle θ, the separation distance h, and the particle radius r . . . . 32
4.16 Monolayer formation of particles due to capillary forces in 2 steps:step I evaporation of the solvent and nucleus formation; step II hy-drodynamic flux of particles. . . . . . . . . . . . . . . . . . . . . . . . . 35
4.17 Tapping-mode AFM topography images of the highly ordered triblockcopolymer PS-P2VP-PtBMA before (left) and after (right) exposureto ultra-violet radiation122. . . . . . . . . . . . . . . . . . . . . . . . . . 38
5.1 Left: SEC measurement of horse spleen ferritin (UV detector); themonomeric peak is colored in blue. Right: DLS measurement of col-lected monomeric ferritin (Rh=6.7 ± 2 nm). . . . . . . . . . . . . . . . . 44
5.2 Estimation of dn/dc of horse spleen ferritin in SEC buffer (sodiumphosphate buffer pH 7.4) using RI detector: dn/dc=0.02428(±7.410−4) mL·g−1. . . . . . . . . . . . . . . . . . . . . . . . . . . . . . . . . . 48
5.3 Left: Molar mass calculated from the Zimm model of horse spleenferritin using UV detector to calculate the concentration and, LS de-tector at 90 ◦. Mw =(4.488 ± 0.041)105 g·mol−1. Right: Radius of gyra-tion calculated from the Zimm model of horse spleen ferritin usingLS detector at 49 ◦ and 131 ◦. Rg =5.9 ± 4.8 nm. . . . . . . . . . . . . . . 49
5.4 Schematic cross-section of a CEVS. . . . . . . . . . . . . . . . . . . . . 55
5.5 TEM micrographs of monomeric horse spleen ferritin on formvarcoated copper grids at different concentrations (left: monolayer offerritin). . . . . . . . . . . . . . . . . . . . . . . . . . . . . . . . . . . . . . 56
5.6 Scheme of the interaction volume as a tear drop. . . . . . . . . . . . . 57
146
List of Figures
5.7 SEM image of monomeric horse spleen ferritin on silicon wafer (mag-nification 100 kX, EHT 1 kV). . . . . . . . . . . . . . . . . . . . . . . . . 58
5.8 Working principle of Atomic Force Microscope. . . . . . . . . . . . . . 595.9 Top: AFM image of monomeric horse spleen ferritin on freshly clea-
ved mica sheet over 100µm2, left image (A) height z-range: 10 nm,right phase image (B) z-range: 20 ◦. Bottom: AFM height zoom im-age (C) over 1µm2. The last image (D) shows the horse spleen fer-ritin diameter of about 20 nm. . . . . . . . . . . . . . . . . . . . . . . . 60
5.10 Matrix-Assisted Laser Desorption Ionization-Time of Flight Mass An-alyzer scheme in linear and reflectron modes. . . . . . . . . . . . . . . 63
5.11 MALDI-ToF MS measurement of apoferritin after denaturation anddigestion and SDS-PAGE of ferritin after denaturation, dyed with sil-ver solution (1-4 are different preparations of denaturated ferritinsolution. Mf is a standard protein marker from 6.5 to 66 kDa). . . . . . 66
6.1 Kinetics of ATRP of NIPAAm (0.5 M) in water at 4 ◦C with [M]0/[BIBA]0-/[CuBr]0/[CuBr2]0/[Me6TREN]0 = 50/1/0.5/0.5/1. (A) First-order time-conversion plot. (B) Molecular weight and polydispersity index vsconversion. (—) theoretical number average molecular weight. . . . . 74
6.2 Influence of the ratio [monomer]/[initiator] of the ATRP of NIPAAm(0.5 M) in water at 4 ◦C with [BIBA]0/[CuBr]0/[CuBr2]0/[Me6TREN]0
= 1/0.7/0.3/1. (A) MWD at a ratio [M]0/[BIBA]0= (–) 30, (- -) 100, (·)200, (- · -) 400. (B) Dependence of Mn on the ratio [M]0/[BIBA]0. . . . 75
6.3 Molecular weight distribution for the chain extension of PNIPAAmby ATRP in water at 4 ◦C. [M]0=0.5 M, [M]0/[PNIPAAm120-Cl]0 = 300.(–) precursor, (- -) extension after 40 % conversion. . . . . . . . . . . . . 76
7.1 2-(dimethyl maleimido)-N-ethylacrylamide (DMIAAm) synthesis sche-me202. . . . . . . . . . . . . . . . . . . . . . . . . . . . . . . . . . . . . . . 82
7.2 NMR measurements of 2-(dimethyl maleimido)-N-ethylacrylamide(DMIAAm). Top: 1H NMR measurement. Bottom: 13C NMR mea-surement. . . . . . . . . . . . . . . . . . . . . . . . . . . . . . . . . . . . 83
7.3 Synthesis of the photo-crosslinkable polymers P(NIPAAm-DMIAAm). 857.4 NIPAAm-DMIAAm copolymers crosslinking under UV irradiation. . . 877.5 Left: Deconvolution of the absorption band of P(NIPAAm93-DMIAAm7)
copolymer (higher energy band decreased with increasing time of ir-radiation, lower energy band remained constant). Right: kinetics ofthe photo-crosslinking reaction for different copolymers: ä 3 mol%and ■ 7 mol% DMIAAm. . . . . . . . . . . . . . . . . . . . . . . . . . . . 88
147
List of Figures
7.6 Scheme of swelling and shrinking experiment of (non) crosslinkedNIPAAm-DMIAAm copolymer films followed by ellipsometry. . . . . . 89
8.1 EDC/sulfo-NHS conjugation-Modification of horse spleen ferritininto a macro-initiator with BIBA. . . . . . . . . . . . . . . . . . . . . . . 93
8.2 Crosslinked horse spleen ferritin with active ester chemistry aftertreatment with EDC/sulfo-NHS molecules. . . . . . . . . . . . . . . . . 94
8.3 Protection and deprotection of ε-amino groups of lysine residues offerritin particles with citraconic anhydride by switching of pH. . . . . 96
8.4 SEC measurement of monomeric protected and blocked ferritin (us-ing LS detector). . . . . . . . . . . . . . . . . . . . . . . . . . . . . . . . . 97
8.5 Modification of ferritin with N-hydroxysuccinimide-2-bromo-2-me-thylpropionate into a macro-initiator. . . . . . . . . . . . . . . . . . . . 98
8.6 Synthesis of N-hydroxysuccinimide-2-bromo-2-methylpropionate. . 99
8.7 1H NMR measurement of NHS-BIBA final product. . . . . . . . . . . . 100
8.8 SEC measurement of ferritin-BIBA macro-initiator (LS detector) in0.1 M sodium phosphate buffer at a flow of 0.25 mL·min−1. . . . . . . 101
8.9 Reaction scheme for grafting PNIPAAm from ferritin via ATRP. . . . . 102
8.10 Left: Molar mass calculated from the coated sphere model of ferritin-PEGMA using UV detector to calculate the concentration and, LSdetector at 90 ◦: Mw =(1.4 )107 g·mol−1. Right: Geometrical radiuscalculated from the coated sphere model of ferritin-PEGMA usingLS detector at 49 ◦ and 131 ◦: Rg =141.1 ± 0.1 nm. . . . . . . . . . . . . 105
8.11 Comparison of the SEC elution of monomeric ferritin (···) with ferritin-PEGMA conjugates (—). Ferritin-PEGMA has a higher molecularweight than monomeric ferritin. . . . . . . . . . . . . . . . . . . . . . . 106
8.12 Free PNIPAAm chains from sacrificial initiator characterized by MALDI-ToF MS in reflectron mode. Mn=5 kg·mol−1; PDI=1.06. . . . . . . . . . 106
8.13 SDS-PAGE measurement of the macro-initiator Ferritin-BIBA (1) andthe conjugate ferritin-P(NIPAAm95-DMIAAm5) (2) after denaturation,stained with silver solution, Mf being the reference marker. . . . . . . 107
8.14 Turbidity measurement of the conjugates in function of tempera-ture: ■ corresponds to the heating cycle; 4 corresponds to the cool-ing cycle. . . . . . . . . . . . . . . . . . . . . . . . . . . . . . . . . . . . . 108
8.15 TEM micrographs of ferritin-PNIPAAm conjugates (on non treatedformvar coated copper grid) and ferritin- P(NIPAAm95-DMIAAm5)(on hydrophilized formvar coated copper grid). . . . . . . . . . . . . . 109
148
List of Figures
8.16 Effect of temperature on conjugate particles in solution. Left: DLSmeasurement of ferritin-PNIPAAm conjugate particles; Right: TEMmicrographs of ferritin-polymer conjugates at room temperature andafter heating to 40 ◦C. . . . . . . . . . . . . . . . . . . . . . . . . . . . . . 110
8.17 AFM phase (z=30 ◦) and topography (z=30 nm) images of horse spleenferritin-PNIPAAm conjugates mixed with free horse spleen ferritinprepared on a freshly cleaved mica sheet, over a 9µm2 scale. Theiron oxide core of horse spleen ferritin appears as a bright dot in thephase image. . . . . . . . . . . . . . . . . . . . . . . . . . . . . . . . . . . 110
9.1 AFM topography and phase images of ferritin-P(NIPAAm95-DMIAAm5)conjugates film over 1µm2 on mica sheet. Left: z-range: 20 nm;right: z-range: 40 ◦. . . . . . . . . . . . . . . . . . . . . . . . . . . . . . . 113
9.2 AFM topography (left) and phase (right) images of ferritin-P(NIPAAm95-DMIAAm5) conjugates forming a film over 1µm2 on mica sheet be-fore crosslinking ; height z-range: 30 nm and phase z-range: 30 ◦. . . . 113
9.3 AFM topography images of ferritin-P(NIPAAm95-DMIAAm5) conju-gates film on oxidized silicon wafer over 1µm2 crosslinked by UVirradiation. Left: z-range: 20 nm; Right: z-range: 20 nm with thesample cooled by an ice bath. . . . . . . . . . . . . . . . . . . . . . . . . 114
9.4 AFM topography (left) and phase (right) images of P(NIPAAm-DMIAAm)membrane after chemical denaturation of ferritin particles over 1µm2;Left: z-range: 10 nm; Right: z-range: 20◦. . . . . . . . . . . . . . . . . . 115
9.5 AFM zoom of topography image of P(NIPAAm-DMIAAm) membraneafter denaturation of ferritin particles over 0.222 µm · 0.222µm; Left:z-range: 5 nm; Right: cross-section measurement of the pores: di-ameter of about 16 nm and 1-2 nm depth. Sketch of partial and totaldenaturation of proteins and cross-sections. . . . . . . . . . . . . . . . 115
9.6 AFM zoom of topography (up) and phase (down) images of P(NIPAAm-DMIAAm) membrane after denaturation of ferritin particles over 0.367µm · 0.367µm and their cross-section; Up: z-range: 5 nm; Down: z-range: 10 ◦; Right: cross-section measurements of the pores: diame-ter of about 16 nm and 2 nm depth. . . . . . . . . . . . . . . . . . . . . 116
9.7 Schematic experimental setup for pendant drop tensiometry. . . . . . 1199.8 Dynamic interfacial tension measurements of ferritin and ferritin-
P(NIPAAm-DMIAAm) conjugates suspensions at the 3,5 bis-(trisfluo-romethyl)1-bromobenzene)-water interfaces. . . . . . . . . . . . . . . 119
9.9 Sketch of ferritin-P(NIPAAm-DMIAAm) conjugates assembly at theoil-water interface. . . . . . . . . . . . . . . . . . . . . . . . . . . . . . . 120
149

List of Figures
9.10 Laser scanning confocal microscopy images of ferritin-P(NIPAAm-DMIAAm) capsules. A: non crosslinked capsules with perylene bisi-mide dye dissolved into oil phase (red) and fluorescein dissolved inthe aqueous phase (green); B: crosslinked capsules after UV irradia-tion with perylene bisimide dye dissolved in the oil phase and noncolored free oil interface. . . . . . . . . . . . . . . . . . . . . . . . . . . . 122
150
List of Tables
4.1 X-ray data collection of different ferritin crystallizations. . . . . . . . . 114.2 Structural properties of Horse Spleen Ferritin. . . . . . . . . . . . . . . 144.3 Different syntheses of polymer-bioconjugates by grafting to strategy. 274.4 Different syntheses of polymer-bioconjugates by grafting from strat-
egy. . . . . . . . . . . . . . . . . . . . . . . . . . . . . . . . . . . . . . . . 284.5 Studies of ferritin adsorption at different liquid-solid interfaces. . . . 36
5.1 Labeling of primary amino groups of horse spleen ferritin with 5-carboxyfluorescein succinimidyl ester and picrylsulfonate acid (TNBS)characterized by UV-Vis. . . . . . . . . . . . . . . . . . . . . . . . . . . . 51
6.1 Influence of the ligand on the ATRP of NIPAAm in water at 4 ◦C[1]. . . 726.2 Influence of the ratio Cu(I)/Cu(II) on the ATRP of NIPAAm with Me6TREN
as ligand in water at 4 ◦C[1]. . . . . . . . . . . . . . . . . . . . . . . . . . 73
7.1 ATRP of NIPAAm-DMIAAm with different mol% of crosslinker with[M]0=0.5 mol·L−1 with [M]0/[BIBA]0/[CuCl]0/[L]0 = 100/1/0.7/0.3/2. . 85
7.2 ATRP of NIPAAm-DMIAAm with different mol% of crosslinker. . . . . 867.3 Shrinking ratio of NIPAAm-DMIAAm copolymer films under tem-
perature before and after UV crosslinking by in-situ ellipsometry. . . 89
8.1 Labeling of primary amino groups of horse spleen ferritin with picryl-sulfonate acid (TNBS) characterized by UV-Vis. . . . . . . . . . . . . . 96
151

Acknowledgements
I would like to express my gratitude to all those who gave me the possibility tocomplete this thesis. I want to thank the Department of Physical Chemistry ofthe University of Bayreuth and Prof. Dr. Alexander Böker for supervising my PhD’swork.
I am grateful for the financial support for this project from the Deutsche Forschungs-gemeinschaft (DFG) and the Lichtenberg-Program of the VolkswagenStiftung. Thiswork is also supported by the European Union within the Marie Curie ResearchTraining Network BIOPOLYSURF of the Sixth Framework Programme under thecoordination of Prof. Dr. Cabello-Rodriguez.
This work would not have been completed without the help and support of manyindividuals from the physical chemistry II department in Bayreuth but also fromthe macromolecular chemistry II during my research work. I want to thank themfor all their help, support, interest and valuable hints: in particular, Prof. Dr. AxelMüller for providing me with an opportunity to conduct my research and for hisexcellent guidance over the course of it, Dr. Günther Jutz for asking the right ques-tions and providing me with valuable suggestions and Dipl.-Chem. Anne Horn forbeing patient, always having an open door for my questions. I also want to thankPierre Millard for his help teaching me the polymerization process, Markus Hundfor his introduction about AFM and Dr. Dreschler for the TEM. Moreover, I want tothank the physical chemistry department (IPC) of the RWTH in Aachen and DWIpeople who have welcomed me.
Lastly, I want to thank my family, friends (especially Arnaud, Lara & Jérôme, Steffi& Christian) and my love Dejan who encouraged me all along to go ahead with mythesis and without whose support none of this would have been possible.
153

Lebenslauf
Persönliche Daten
Name: Nathalie Céline MouginGeburtsdatum 3. Juni 1982Geburtsort Belfort, FrankreichFamilienstand Ledig
AusbildungSchulausbildung Ecole primaire de Bourogne (1985-1993)
Collège de Morvillars (1993-1997)-Brevet des CollègesGymnasium in Belfort (Lycée Courbet)(1997-200)-Abitur
Studium Vorbereitungsklasse an der Ingenieurausbildungschule(2000-2002) in Belfort (Lycée Condorcet)Ingenieurschule ESIREM (2002-2005) in Dijon/ IngenieurdiplomDoktorarbeit an der Universität Bayreuth (Okt 2005-Jan. 2009)Doktorarbeit an der RWTH Aachen (seit Feb. 2009)
Praktika Pratikum bei Dr. Janssen TUHH in Hamburg (April-Juni 2004)Praktikum bei Prof. Dr. Millot in CNRS in Dijon (Okt.2004- Jan.2005)Diplomarbeit bei Siemens AG in München (Feb.-Sept 2005)
SonstigesFremdsprachen Englisch, Deutsch, Französisch, Spanisch