The Value of Capital Market Regulation: IPOs versus Reverse … · 2011. 2. 9. · information...
41
Montréal Avril 2009 © 2009 Cécile Carpentier, Douglas Cumming, Jean-Marc Suret. Tous droits réservés. All rights reserved. Reproduction partielle permise avec citation du document source, incluant la notice ©. Short sections may be quoted without explicit permission, if full credit, including © notice, is given to the source. Série Scientifique Scientific Series 2009s-06 The Value of Capital Market Regulation: IPOs versus Reverse Mergers Cécile Carpentier, Douglas Cumming, Jean-Marc Suret
Transcript of The Value of Capital Market Regulation: IPOs versus Reverse … · 2011. 2. 9. · information...
Montréal Avril 2009
© 2009 Cécile Carpentier, Douglas Cumming, Jean-Marc Suret. Tous droits réservés. All rights reserved. Reproduction partielle permise avec citation du document source, incluant la notice ©. Short sections may be quoted without explicit permission, if full credit, including © notice, is given to the source.
Série Scientifique Scientific Series
2009s-06
The Value of Capital Market Regulation:
IPOs versus Reverse Mergers
Cécile Carpentier, Douglas Cumming, Jean-Marc Suret

CIRANO Le CIRANO est un organisme sans but lucratif constitué en vertu de la Loi des compagnies du Québec. Le financement de son infrastructure et de ses activités de recherche provient des cotisations de ses organisations-membres, d’une subvention d’infrastructure du Ministère du Développement économique et régional et de la Recherche, de même que des subventions et mandats obtenus par ses équipes de recherche.
CIRANO is a private non-profit organization incorporated under the Québec Companies Act. Its infrastructure and research activities are funded through fees paid by member organizations, an infrastructure grant from the Ministère du Développement économique et régional et de la Recherche, and grants and research mandates obtained by its research teams. Les partenaires du CIRANO Partenaire majeur Ministère du Développement économique, de l’Innovation et de l’Exportation Partenaires corporatifs Banque de développement du Canada Banque du Canada Banque Laurentienne du Canada Banque Nationale du Canada Banque Royale du Canada Banque Scotia Bell Canada BMO Groupe financier Caisse de dépôt et placement du Québec DMR Fédération des caisses Desjardins du Québec Gaz de France Gaz Métro Hydro-Québec Industrie Canada Investissements PSP Ministère des Finances du Québec Power Corporation du Canada Raymond Chabot Grant Thornton Rio Tinto Alcan State Street Global Advisors Transat A.T. Ville de Montréal Partenaires universitaires École Polytechnique de Montréal HEC Montréal McGill University Université Concordia Université de Montréal Université de Sherbrooke Université du Québec Université du Québec à Montréal Université Laval Le CIRANO collabore avec de nombreux centres et chaires de recherche universitaires dont on peut consulter la liste sur son site web.
ISSN 1198-8177
Les cahiers de la série scientifique (CS) visent à rendre accessibles des résultats de recherche effectuée au CIRANO afin de susciter échanges et commentaires. Ces cahiers sont écrits dans le style des publications scientifiques. Les idées et les opinions émises sont sous l’unique responsabilité des auteurs et ne représentent pas nécessairement les positions du CIRANO ou de ses partenaires. This paper presents research carried out at CIRANO and aims at encouraging discussion and comment. The observations and viewpoints expressed are the sole responsibility of the authors. They do not necessarily represent positions of CIRANO or its partners.
Partenaire financier

The Value of Capital Market Regulation: IPOs versus Reverse Mergers*
Cécile Carpentier†, Douglas Cumming‡, Jean-Marc Suret§
Résumé / Abstract
Nous analysons les conséquences économiques des règles de divulgation et d’inscription en Bourse dans un contexte où l’asymétrie informationnelle est grande et la réglementation des valeurs mobilières peu contraignante. L’échantillon porte sur 1 455 émissions initiales et prises de contrôle inversées, effectuées entre 1993 et 2003. Au Canada, les entreprises peuvent accéder au marché boursier avant même de percevoir des revenus, en effectuant soit un appel public à l’épargne qui implique une divulgation complète, soit une prise de contrôle inversée comportant une divulgation minimale. En contrôlant pour diverses dimensions, incluant l’auto-sélection du mode d’entrée, nous montrons que le niveau de divulgation et de réglementation auquel se soumet l’émetteur influence de façon significative la valeur et la performance à long terme des entreprises nouvellement inscrites en Bourse. Nos résultats indiquent que la divulgation a un effet économique important, et sont en accord avec les propositions qui lient l’augmentation de la divulgation à la réduction de l’asymétrie et du coût du capital. Ils sont également cohérents avec l’hypothèse qui veut que l’augmentation de l’information réduit l’hétérogénéité des anticipations et les erreurs d’évaluation.
Mots clés : Divulgation, réglementation des valeurs mobilières, prise de contrôle inversée, norme minimales d’inscription en Bourse.
We analyze the economic consequences of disclosure and regulation within a context of significant information asymmetry and lenient regulation. In Canada, firms can enter the stock market at a pre-revenue stage, using full disclosure (initial public offerings, IPOs) or the minimal disclosure allowed by reverse mergers (RMs). Our sample is a set of 1,455 IPOs and RMs between 1993 and 2003. Controlling for several dimensions, including self-selection, we find that the level of disclosure and regulation significantly influence the value and long-run performance of newly listed firms. Overall, our results suggest that disclosure has a significant economic impact. These results are consistent with theories suggesting that a commitment by a firm to increase its disclosure level lowers the information asymmetry component of the cost of capital. The results are also consistent with the hypothesis that increased disclosure reduces the heterogeneity of expectations and mispricing.
Keywords: Disclosure, Securities Regulation, Initial Public Offerings, Reverse Mergers, Listing Standards. Codes JEL : G24; G32; G14; G1
* We owe thanks to the participants to the CELS meeting at Cornell in September 2008 and mainly Bernie Black for helpful comments. † Professor, Laval University and CIRANO Fellow, Faculty of Administrative Science, School of Accountancy, Pavilion Palasis-Prince, 2325 de la Terrasse, Laval University, Québec (Québec) Canada, G1V 0A6, phone: 418 656 2131 #6385, fax: 418 656 7746, email: [email protected]. ‡ Associate Professor, Ontario Research Chair and CIRANO Associated Fellow, York University - Schulich School of Business, 4700 Keele Street, Toronto, Ontario M3J 1P3, Canada, phone: 416 736 2100 #77942, fax: 416 736 5687, email: [email protected]. § Professor, Laval University and CIRANO Fellow, Faculty of Administrative Science, School of Accountancy, Pavilion Palasis-Prince, 2325 de la Terrasse, Laval University, Québec (Québec) Canada, G1V 0A6, phone: 418 656 7134, fax: 418 656 7746, email: [email protected].
1. Introduction
Security issuance is subject to the risk that corporate issuers will sell bad securities to the
public (La Porta, Lopez-De-Silanes and Shleifer 2006; Campbell 2009). In the U.S., minimum
listing standards and securities regulation limit a firm’s access to stock markets based on firm
size and earnings, among other things, and they require extensive information disclosure in the
way of promoting market quality and investor protection (Macey and O'Hara 2002). Moreover,
securities regulations require that firms that seek listing comply with a prospectus requirement
that must be filed with the Securities and Exchange Commission (SEC) as part of a registration
statement. The SEC's rationale has been that regulators are gatekeepers whose strict requirements
protect investors and market integrity and thereby reduce the cost of equity for listed firms. U.S.
regulations on security issuance have increased in recent years. For initial public offerings
(IPOs), the Penny Stock Reform Act of 1990 placed severe restrictions on issues that were priced
below $5 (Beatty and Kadiyala 2003). When revising the Penny Stock Rule in 2005, the SEC
required that newly listed firms to have positive net income, that the market value of their listed
securities be at least $50 million, and that the securities’ minimum bid price be $4 per share. The
SEC also strongly limited a firm’s capacity to escape the initial listing requirement by using a
Reverse Merger (RM), also known as a backdoor listing method. SEC Rule 419 severely
restricted Blank Check Companies, commonly used in the 1980s as shell companies to facilitate
RMs. On January 4, 1999, the SEC approved the “eligibility rule,” which required all domestic
Over-the-Counter Bulletin Board firms to comply with the reporting obligations under the 1934
Act (Bushee and Leuz 2005).
Despite these developments, the “appropriate” or “fair” level of regulatory requirements for
new listings is still subject to debate. Several authors argue for easing the rules for smaller
entities (Cohn 1999; Chiu 2003; Friedman and Grose 2006). Campbell (2009 p.1) states that “one
of the most curious and misdirected regulatory approaches of the Securities and Exchange
Commission is the Commission's relentless refusal to permit small businesses to solicit broadly
for external capital.” In the U.S. the listing process is generally considered long and costly,
especially for small and medium-sized companies (Cohn 1999). Thus, some authors consider
firms should be allowed to list without fulfilling the IPO process, and that RMs and Special
Purpose Acquisition Corporations (SPACs) can be a useful tool for smaller firms (Heyman
2007). Because the variation between the characteristics of new listed firms is limited, analyzing

1
the effect of listing and disclosure requirements is an empirical question difficult to address in the
U.S. context. For this reason, recent studies of the effects of regulation on market development
and the cost of capital use cross-national comparisons (La Porta, Lopez-De-Silanes, Shleifer and
Vishny 2002; Hail and Leuz 2006; La Porta et al. 2006) or regulatory changes in foreign
countries (Black, Love and Rachinsky 2006; Black and Khanna 2007). A parallel stream of
research has analyzed the influence of securities regulation to the ability of firms to issue capital,
based on a large cross-national sample (Knill and Richardson 2005).
In this paper, we compare two types of new listings in a country where the regulatory
standards for listing are very low. In Canada, regulators have allowed easy access to the market
via RMs and new listings are divided almost equally between RMs and IPOs. In an IPO, the firm
has to meet all the regulatory requirements and provide a prospectus, but with an RM, there are
no prospectus requirements. An RM firm achieves a public listing with minimum disclosure and
on short notice. RMs and IPOs exhibit similar characteristics in Canada -- such as size,
profitability, and shareholding. We estimate the effect of disclosure on the value and the long-run
performance of the newly listed companies. Hence, this paper enables an analysis of the effects of
increasing disclosure in a non-U.S. setting with potentially more pronounced effects. The low
requirements create a situation with much asymmetric information, risk, and uncertainty faced by
the purchasers of newly listed firms. Our setting is close to the one developed by Hartzell,
Kallberg, and Liu (2008) to study the effect of governance on value and performance at the IPO
date.
Based on a sample of 1,455 IPOs and RMs between 1993 and 2003, comprising more than
60% of the new listings population, our findings are as follows:
1: Low listing requirements negatively affect investor wealth. The long-run returns that
follow Canadian IPOs and RM listings are extremely poor. They are significantly lower than
those reported for IPOs in other countries. The proportion of negative raw or excess returns can
reach 60% to 70% depending on the specification. The assessment that higher initial listing
requirements protect investors is confirmed by the data.
2: A careful analysis of the return distributions indicates that a few newly listed firms
produce huge returns. A preference for skewness can explain why the investors still participate in
these offerings, since they resemble lottery stocks. Investors involved in IPOs and RMs do not
exhibit the characteristics of rational behaviour in the classical mean-variance scheme.

2
3: Even if RMs and IPOs share many characteristics, the analysis of the self-selection
problem indicates that the lower quality firms opt for the less regulated RMs to obtain a publis
listing. RMs are smaller firms, more often exhibit negative earnings, and often do not have
revenues. This observation is on line with the “lemon market” proposition stated by Black
(2001). Black (2001) considers that rigorous disclosure rules are a precondition for a strong
securities market, and our findings are strongly consistent with this proposition.
4: If prospectus disclosure is informative above and beyond what is disclosed in the firm’s
prior financial statements, then IPOs will have a lower cost of capital than RMs. Thus, IPOs will
receive higher valuations. We evidence a strong effect of the choice of disclosure/listing mode on
the value that the firms can obtain for the new shares issued during the listing. In terms of the
earnings, the multiple obtained through IPOs is twice that observed for RMs. We carefully
control for the other dimensions that can influence the valuation, including but not limited to self-
selection between the two listing modes, in order to carefully assess the observed effect of
disclosure.
5: If prospectus disclosure reduces the asymmetry and the heterogeneity of expectations,
then IPOs will exhibit better long-run performance. If prospectus requirements really mitigates
asymmetric information, and if asymmetric information is linked with long-run performance,
then we should observe significant differences between RMs and IPOs. Indeed, we find that IPOs
have strongly superior long-term returns than RMs. All else being equal, investing in firms that
list with full disclosure is better than investing in firms that bypass the prospectus and registration
process. In our analyses, we controlled to the fullest extent possible for the other possible
determinants of performance and self-selection.
These results suggest that for both the issuer and the investors, there is significant benefit to
voluntary disclosure through a prospectus. Overall, our results suggest that disclosure has a
significant economic impact. These results are consistent with theories suggesting that a
commitment by a firm to increase its disclosure level mitigates information asymmetry and
thereby lowers the cost of capital. These results are also consistent with the hypothesis that
increased disclosure reduces the heterogeneity of expectations and mispricing.
Our paper is organized as follows. In Section 2 we develop propositions in the context of
the related IPO and RM literature. In Section 3 we introduce the data and present summary
3
statistics. We explain our empirical methods in Section 4, and we present our econometric results
in Section 5. Section 6 describes policy implications and concludes.
2. Related IPO and RM Literature and Propositions
We first present the distinctive characteristics of the Canadian market. After discussing the
effects of disclosure on valuation and on performance, we present our hypothesis.
2.1. IPOs and RMs in Canada
The first distinctive characteristic of the Canadian securities market is its very low level of
listing requirements, even though IPOs in Canada face similar regulations as in the U.S. For a
listing on Tier 2 of the junior market -- the TSXV -- a firm must meet the following conditions:
stock price over CAN$0.15 and post-IPO net tangible assets and market capitalization higher
than CAN$500,000.1 The TSXV has no requirements for issuers’ profitability. As a result, the
pre-IPO median shareholder equity (total asset) in newly listed companies from 1986 to 2006 was
CAN$260,000 (CAN$710,000) and the median gross IPO proceed was CAN$670,000
(Carpentier, L'Her and Suret 2008). In the U.S., for penny stocks IPOs, the median total asset was
US$7.7 million and the median gross proceed was US$5.5 million (Floros 2008). Canadian
newly listed companies are approximately 10% the size of U.S. penny stock IPO firms. In
Canada, more than 80% of firms report negative earnings at the time of listing, and close to 50%
report no revenues. This implies that entrepreneurial ventures have access to the stock market,
and that they indeed constitute the bulk of the entering firms. Such ventures could not enter the
other junior markets in the world.2 This is an important point, because the problems of
information asymmetry and adverse selection are particularly acute for entrepreneurial ventures
seeking for external equity financing. The second distinctive feature of the Canadian market is its
1 Corresponding values for NASDAQ from June 1999 to June 2001 were US$4 (price), US$4 million for shareholders’ equity, and US$5 million for market capitalization. 2 The “new” markets in Europe devoted to growing companies generally require minimum gross proceeds of Euro5 million (CAN$8 million). Several junior markets, like the AIM, First North or NZAX apply principles-based listing requirements. They do not require a numerical threshold but require the entrant to get a sponsor. According to Derrien and Kecskes (2007), the average size of the IPO firm joining AIM in London, from 1995 to 2004, is equivalent to CAN$15 million, when size is estimated by gross proceeds of the IPO. On First North, in the Nordic countries, the mean market capitalization was equivalent to CAN$85.53 million. In 2009, January, the 34 small firms listed on the NZAX had a total capitalization of NZ$633 million, for an average (post crisis) capitalization equivalent to CAN$12.5 million. Even if they use principles in lieu of rules, these exchanges do not list entrepreneurial ventures at early stages.

4
promotion, by the exchange, of RM listings and the low level of regulatory constraint that is
placed on firms that opt for this method.
An RM is a method used by a private firm (the entrant firm) to become publicly traded
without issuing an IPO). We illustrate a classical RM transaction in figure 1. The RM listing
includes a merger between a public shell company, which is generally inactive, and privately held
operating company. Figure 1 shows that the Canadian shell generally has a very low market
value: CAN$100,000, based on 500,000 shares priced at CAN$0.20. Currently operating closed
firms that seek listing usually have a much higher value: for example 500,000 shares priced at
CAN$1. The resulting company, here named Result inc., is a product of the merger of the two
former firms. This merger entails an exchange of shares:3 the shareholders of the entrant firm and
of the shell exchange their shares for those of the new entity, Result inc. The difference in value
between the shell and the operating company means that the shareholders of the private operating
company will acquire the majority of the shares of the resulting entity. This transaction is called
an RM because the shareholders of the private company ultimately control the public shell
company. After the RM, the private firm effectively becomes publicly traded (the resulting firm).
Newly listed companies using an RM are exempt from filing a prospectus and need not comply
with the registration requirements prevailing for IPOs. RMs, amalgamation, or other similar
procedures are used to take advantage of the prospectus and registration exemptions in provincial
securities legislations (See Brook, 2000, and cited references, p. 3). This legislation implies that
the RM firms cannot issue shares publicly. They get the cash available in the shell and, in the
majority of the cases we observe, they issue shares privately. The private placements associated
with an RM are generally too small for institutional investors. In figure 1, we consider that
private investors get a participation of CAN$100,000. That gives them a 14.29% proportion of
control. Then, if we omit the transaction cost, the value of Result inc. is equal to CAN$700,000
[CAN$500,000 (the entrant) + CAN$100,000 (the shell) + CAN$100,000 (the private
placement)].
[Insert Figure 1 About Here]
3 RMs occur in a number of ways. Most often, RMs involve the acquisition by the listed shell of either the assets of a private firm or all of its outstanding shares in exchange for the shares of the shell. If the shell acquires all or part of the outstanding shares of the private firm, the private firm becomes a subsidiary of the shell. We do not consider the intricacy of the various methods or the regulatory dimension of RMs. Interested readers can see Feldman (2006) or Sjostrom (2008) for a detailed presentation of these dimensions.
5
As a result of the RM, the private company becomes public by buying the shell, without
issuing a prospectus,4 selling new shares to the public, or meeting the minimum listing
requirements. “Classic” shells are once-active companies that failed to develop and ceased or
strongly reduced their activities, but have kept their stature as public companies. “Manufactured”
shells are created specifically from nothing, using the Capital Pool Program (Carpentier and Suret
2006).5
According to the firms specializing in RMs, the primary benefits of going public this way
are mainly the significantly lower costs and less time required as opposed to an IPO.6 Gleason,
Rosenthal, and Wiggins (2005) estimate that IPOs take a minimum of 6 months while RMs take
between 1 and 3 months, and that RMs involve substantially lower costs than IPOs.
According to the securities laws,7 the required disclosure relative to RMs was limited to
issuing a filing statement or information circular. Before 2004, the situation was different in the
various provinces. In 1987, the Ontario Securities Commission proposed “prospectus level
disclosure” for RMs (Brock 2000); however, the draft policy was not formally adopted. The
majority of the RMs occurred in Alberta and British Columbia. An analysis of the System for
Electronic Document Analysis and Retrieval (SEDAR) filing for some of these transactions
illustrates that the disclosure level was far from the prospectus level (see, as an example, the
Augusta Metals Incorporated-CyberCom System, in 2000, where the sole financial statements
available are those of the inactive shell). The differences in disclosure were eliminated in 2005,
4 The disclosure requirements for these transactions vary over time and between provinces. In 2005, the exchange modified the policy to require prospectus-like disclosure 5 On the AIM, the Investment Companies can be considered equivalent to the capital pool companies (CPCs), although they should raise a minimum equivalent to CAN$6 million, against CAN$300,000 for CPCs. In the U.S., the SPACs play a similar role, but for larger transactions (Berger 2008) 6 See http://www.reversemergers.net/overview.html; (last visited Dec. 4, 2008), (Costs are less, time is less), or http://www.venturea.com/shell.htm (last visited Dec. 4, 2008) (“saves time” “saves money”).These economies are largely linked to the non-requirement of a prospectus. When an RM agreement is reached, the company must submit a comprehensive news release. The news release must include a description of the transaction, including a description of the target assets, a summary of any available significant financial information and a description of the terms of the RM. A shareholders’ meeting is required to approve the transaction, but the information the shareholders receive is scant compared with the information required for an IPO. 7 In Canada, securities laws are administered and enforced by a provincial securities commission. A concerted effort toward harmonizing and streamlining securities regulation across Canada by establishing a uniform securities regulation regime is in the works. However, during the period we analyze, several differences existed between the provinces, mainly in the area of exempt placements where RMs and private placements take place.

6
following the adoption of NI 51-102 (Section 4.10), and the related amendments to this
instrument that were adopted during the subsequent years. It was only in 2005 (after the period in
our dataset described below) that the exchange required that the filing statement/information
circular associated with a RTO should provide “full, true and plain disclosure of all material
facts relating to the Target Company,” essentially to align its requirements with those of the
Canadian Securities Administrators.
We analyze a situation where entrepreneurial ventures enter a stock market. In this context
of much information asymmetry, they can choose to provide full disclosure through a prospectus
or to avoid this requirement by using an RM. We contend that this choice should influence their
value at the time of listing and their long-run performance.
2.2. Disclosure and Valuation
A large body of theoretical research supports a link between information and the cost of
equity (see Botasan (2006) or Haley and Palepu (2001) for a review). However, as Lambert,
Leuz, and Verrecchia (2007) illustrates, the link between the cost of equity and disclosure is
complex. One perspective considers that disclosure reduces the estimation risk. However, risk is
priced only if it is not diversifiable. Lambert, Leuz, and Verrecchia demonstrate that higher
quality disclosures will affect the firm's assessed covariances with the cash flows of other firms,
which are nondiversifiable. Higher quality disclosure thus reduces the cost of equity.
Another stream of research considers that the cost of equity is higher when the transaction
costs and illiquidity are higher. Because more disclosure increases the liquidity of shares (Healy,
Hutton and Palepu 1999; Leuz and Verrecchia 2000), it also potentially reduces the cost of
equity. Following both tracks, the effects of disclosure may be more important when the
asymmetry of information is large. This possible effect of disclosure occurs at the listing time,
when the information relevant to the firm is scarce. Firms’ managers have superior information to
outside investors about the firm’s future prospects. These firms will view making public equity or
debt offers as costly for existing shareholders. Consequently, the managers who anticipate
undertaking capital market transactions have incentives to provide extensive disclosure in order
to reduce the information asymmetry problem, thus reducing the firm’s cost of external equity
(Chemmanur and Paeglis 2005; Hyytinen and Pajarinen 2005).. Because the value of a firm
equity is the present value of the future cash flow available to shareholders, reducing the equity
cost is likely to increase the value of the stock. However, the extent to which disclosure can
7
effectively reduce the cost, and increase the present value, of equity is an empirical question. As
Leuz and Wysocki (2006) note, firms with non-existent or minimal disclosures often are missing
from cross-sectional studies, and therefore the results probably understate the true magnitude of
the liquidity impact of disclosures. This is where we stand in our analysis.
Easley and O’Hara (2004) introduce the distinction between private and public information,
and contend that differences in the composition of information (between public and private)
affect the cost of capital, with investors demanding a higher return for holding stocks with greater
private information. This dimension may be relevant when one compares public (IPO) vs. private
(RM) financing. For this reason, we carefully analyze the characteristics of the provider of
private equity in Canada.8 We observe that a very small proportion of private placements are
indeed invested by institutional investors (less than 2%) or by people who appear as important
shareholders after the placement and can be considered insiders. The situation is therefore very
different from what prevailing in the U.S. Even for small placements, we observe numerous
investors (10 on average). This, and the lack of evidence of any significant implication of private
investors in the post-RM shareholding allows us to consider that investors involved in private
placement surrounding RM do not have private access to information.
If increased disclosure indeed reduces the cost of equity, then firms that opt for RM listing
should have lower value than similar firms that choose to fully disclose using a prospectus and
the IPO process. Gore, Sachs, and Trzcinka (2004) observe that, when disclosure is unregulated,
issuers substitute between disclosure and insurance on the bond market. In the particular context
of very small companies that we analyze, there is no clear substitute to disclosure and as such we
do not consider other dimensions.
2.3. Disclosure and long-run performance
It is well documented that IPOs are underpriced in the short-run and underperform in the
long-run (Jenkinson and Ljungqvist 2001). Several explanations have been proposed for these
regularities, but Jenkinson and Ljungqvist (p.58) acknowledge that “we do not know what causes
8 The characteristics of the investors can be determined in a several cases, but accessing the information is very difficult, and we conducted the analysis on a sub sample of the RM, covering two years. The investors are mainly individual, but they do not seem to be related to the business team. Very few institutional investors are involved, and few investors appear among the important shareholders after the RM. These investors cannot be characterized as business angels. We have left their characteristics, and their rationality, for further studies.

8
initial public offerings to perform poorly in the long run.” Behavioral theories may assume the
presence of “irrational” investors who bid up the price of IPO shares beyond their true value. In
Miller’s (1977) setting, the price around the time of new listing is set mainly by optimistic
investors. Heterogeneous expectations drive the post-listing price to abnormally high levels, and
price returns to equilibrium levels as more information mitigates the heterogeneity (Dong and
Michel 2008) or when investors can learn more about the fundamental valuation of the asset
(Morris 1996). This theory predicts that greater divergence in investor beliefs about the firm’s
true value will lead to more short-run overvaluation and stronger long-run underperformance.
Because heterogeneity of expectations is negatively associated with disclosure, Jenkinson and
Ljungqvist (2001 p.149) and others argue that greater disclosure should be associated with less
pronounced long-run underperformance following new issues. In short, disclosure is positively
associated with the value at the listing time and negatively linked to long-run underperformance.
There have been mixed empirical findings in prior research on the relationship between
disclosure and IPO performance. Bhabra and Pettway (2003) analyze the relationship between
IPOs’ underperformance and prospectus data; they conclude that financial and operating
characteristics, as well as offering characteristics, have a limited correlation with the one-year
stock returns. Hanley and Hoberg (2008) examine more detailed prospectus information and find
a stronger connection between prospectus disclosure and underpricing and long-run performance.
When the content of prospectuses is not regulated, however, evidence shows little or no
correlation between disclosure and IPO performance (at least in the case of Sweden, see Ström
2006). In a related paper, Hartzell, Kallberg, and Liu (2008) evidence that firms with more
shareholder’s oriented governance structures receive higher valuations at the IPO stage and have
better long-term performance
2.4. Testable propositions
We specifically test the following two propositions: First, if prospectus disclosure is
informative above and beyond what is disclosed in the firm’s prior financial statements, then
IPOs will incur a lower cost of capital than RM listed firms, and hence they will experience a
higher valuation. Second, if prospectus disclosure reduces the asymmetry and the heterogeneity
of expectations, then IPOs will exhibit better long-term performance. These two propositions --
that the disclosure level is positively associated with the value at the listing time and negatively
linked to the long-run underperformance -- can be seen as hard to reconcile. However, in the case

9
of the value argument, we refer to the stock price set in the prospectus (IPO) or in the private
placement (RM). The long-run performance is estimated from the market price. The difference
between the two prices is the initial return (underpricing) in the case of an IPO, or the discount in
the case of private placements associated with RM.
Our empirical tests extend the previous literature by providing new analyses of full
disclosure listings, including a prospectus (in the case of IPOs), and very limited disclosure,
without a prospectus (in the case of RMs). We account for the fact that performance differences
between IPOs and RMs are not solely attributable to the disclosure effect. First, in the case of
IPOs, prestigious investment bankers or venture capitalists also can be involved, while they are
absent in RM listing. These reputational intermediaries can influence the pricing and the long-run
performance of newly listed companies. We control for the involvement of such intermediaries in
the robustness check on our results. Second, an IPO gives rise to a more liquid secondary market
for the stocks than an RM, and the illiquidity discount thus negatively affects RM pricing. We
implicitly control for the liquidity by including the firm size in the various models. Third, we
consider that the TSXV is a less liquid market than the senior exchange, the TSX. We test for the
robustness of our model to the inclusion of a dummy variable to differentiate the firms listed on
both markets. Fourth, RM firms rely on private equity. According to Wu (2004), private
placement firms have higher information asymmetry than public offering firms and entrenched
private placement investors do not engage in more monitoring than public offering investors.
However, private placement investors generally are considered as well informed and
knowledgeable, and the exact influence of the private equity investors on control is highly
controversial. While we cannot control for the differences between the two categories of
investors, that probably has limited influence on our results. In Canada, the small size of the
private placements linked to RM listing prevents institutional investors from being significantly
involved in these transactions. Hence, investors in both IPOs and RMs are mainly individuals.
In the remaining sections of this paper, we test these two propositions in the Canadian
context with minimal disclosure requirements for RMs and minimal listing standards for IPOs.
We control for differences among IPOs and RMs with an extremely detailed dataset that is
described in the next section.

10
3. Data and Stylized Facts
3.1. Data sources
We use a hand-collected sample of new listings on the TSX and TSXV (and its predecessor
exchanges). We collected and documented the new listings from 1993 to 2003, including RMs
and IPOs. We do not consider the IPOs of Capital Pool Companies9 (CPCs) when these entities
simply collect some cash, but we consider all the Qualifying Transactions (QTs) that enable a
closed operating corporation to list on the Exchange. We collected the lists of IPOs from
FPInfomart.ca. We exclude only IPOs resulting from the creation of income trusts, because they
are essentially the continuation, in another form, of a previously existing public firm. We also
exclude the few cases of privatization of state-owned firms and demutualizations, for similar
reasons. We detected 1,024 IPOs from 1993 to 2003. Prospectuses are available in SEDAR since
1997.10 We obtain those of earlier years from the Autorité des Marchés Financiers du Québec,
investment bankers, and academic libraries in several provinces. We took the remaining
accounting information from old versions of Thomson’s Cancorp Financials (the accounting
database).
To compile the RTO data, we used four sources. First, these operations were systematically
reported by the TSXV review from 2001 on. Second, for the earlier years, we used a keyword
scan, programmed on the accounting database, to detect each mention of a RM or RTO in
financial statements and notes. Third, we scanned the stock market database (Datastream) to track
the typical pattern of shells involved in an RM: a penny stock increases sharply in value for a few
months before a trade suspension, and trading generally restarts under a new symbol. Finally, we
scanned the Canadian business newspaper databases (via Factiva and Eureka.cc) to identify all
RTO, RM, and takeover announcements. We then cross-checked these sources and analyzed
each transaction to confirm that the detected cases indeed consisted of RMs associated with new
listings. To compile a list of the CPCs, we used the new issues published by Financial Post and
searched the Exchange reviews and SEDAR to determine whether the new issue was a CPC.
QTs were identified for each CPC using the TSX Web site, along with SEDAR, the Survey of
9 A CPC is a shell company listing with a number of restrictions. These restrictions are described on the TSX webpage: http://www.tsx.com/en/listings/listing_with_us/ways/capital_company.html. See also Carpentier and Suret (2006) 10 SEDAR, the Canadian equivalent of the U.S. EDGAR, was implemented in 1997. See http://www.sedar.com
11
Predecessor and Defunct Companies published by the Financial Post, Lexis-Nexis, and Internet
browsers.11 We detected 1,384 RMs from 1993 to 2003. We collected the main characteristics of
the entrant firm from the accounting database and SEDAR.
Often, firms use backdoor listing methods to access the market without issuing equity, or
they delay the offering for several weeks or months. Using SEDAR since 1997 and
FPinfomart.ca for the earlier years, we analyzed each transaction to determine the amounts
collected around the time of listing. We consider that financing is associated with a backdoor
listing if it occurs during the 12 months following the listing.
In Canada, there is no equivalent to the CRSP delisting codes. Therefore, we hand checked
the status of all the issues as of June 30, 2007. For each of the delisted stocks, we identified the
approximate date of delisting, the reason for, and the exact circumstances of the delisting. Our
information came from the TSX Web site, SEDAR, FPinfomart.ca, the Securities and Exchange
Commissions’ cease trade orders, Factiva, and research tools on the internet. The data allow for a
correct treatment of the last returns for each truncated stream of returns. There are frequently
incomplete series because of the high delisting rates of the small issuers we study. However, the
incomplete series cannot be deleted if one expects to limit the survival bias.
We summarize the population (Panel A) and the final sample (Panel B) in Table 1. We
reduced the sample to the observations for which complete data are available at the listing time
and whose returns can be estimated during the 36 months following the listing. Panel A
illustrates the growing popularity of RM listing in Canada. For the entire period, we observe
1.35 RM for each IPO. However, since 1998, this ratio has reached 2.33 (804 RMs against 345
IPOs). The growing popularity of RMs as a listing tool reinforces our interest in the present
study. The amounts of money collected in both types of listing are in the same range: the median
IPO gross proceeds are CAN$2.48 million and the median private placements occurring during
RM are CAN$1.1 million. Both are very small relative to the U.S. criteria. Gleason, Rosenthal
and Wiggins (2005) report a median transaction value of US$31 million for their 121 RMs.
[Insert Table 1 About Here]
11 The rules of the program required that a CPC completes its QT in the 18 months following its creation. In 2001, the rules governing the program changed, to allow the QT to involve a public firm. In such cases, the QT become equivalent to a private placement, and we deleted these cases which do not imply a new listing.
12
Panel B reports the number and characteristics of the final sample. The missing values
reduce the number of IPOs from 1,024 to 684. The final sample represents 66.8% of the
population. The corresponding number is 55.7% for the RMs, because the collection of
accounting data is generally more difficult for them because of the lower disclosure level. The
missing observations increase the median gross proceeds of IPOs from 2.48 to 3.51, indicating
that we lost the smaller issuers. No such effect is detected for RM. In the population, as in the
sample, the large difference between median and mean amounts collected at the listing time
indicates that a few very large transactions are included together with a large number of very
small placements.
3.2. Valuation Metrics
We follow the strategy of Kim and Ritter (1999) and Purnanandam and Swaminathan
(2004) who respectively analyze the IPO’s valuation at the prospectus and at the market prices,
based on the common multiple of sales, earnings, or book values.12 This method requires an
estimation of the multiples for each company in the sample, and then expressing this multiple
relative to a benchmark.
The IPO value is given by Vi= Offer pricei x Shares outstandingi,t0 where the number of
shares outstanding is estimated at the end of the year of the issue (t0). If an RM is part of a
private placement, then we use the price per share of the private placement, and our estimation is
similar to the case of an IPO. When the RM occurs without a private placement, we use the first
market value available after the RM to substitute for the unobservable offer price. Because we
consider the total number of shares of the resulting firm, our estimated value reflects the
combined value of the entrant; that is, the shell plus the private placement (the value of Result inc
in Figure 1). To be consistent in the estimation of valuation ratios, we also consider the total
revenues and earnings of the entrant, plus those of the shell, as follows.
Revenues, earnings, and shareholders’ equity are estimated at the closing of the year
preceding the listing. For RMs where the financial statements of the private entity are not
available, we infer the accounting number of the entrant firm from the consolidated financial
statements for the year including the RM as follows:
EARN t-1 = EARN t0 – EARN of shell t-1, with EARN = Total earnings.
12 Hartzell, Kallberg, and Liu (2008) use the Q ratio. The large diversity of our sample between the industry and the development stage limit our ability to use this valuation metric.
13
REV t-1 = REV t0 – REV of shell t-1, with REV = Total revenues
SE t-1 = SE t0 – SE of shell t-1 – EARN t0, with SE = shareholders’ equity.
We include the book-to-price ratio, to obviate the lack of positive earnings, and even of sales in a
large proportion of the sample. We define the raw valuation metrics of a firm i as follows:
S/Pi = REVi / (Offer Pricei x SOi)
E/Pi = EARNi / (Offer Pricei x SOi)
B/Pi = PSEi / (Offer Pricei x SOi)
With
SO = shares outstanding after listing
REV = Total revenues before listing
EARN = total earnings before listing
PSE = Post-money Shareholders’ equity
We estimate the comparable values for the universe of the Canadian listed firms included in
the successive versions of the accounting database, using the market value at the end of each
month. Then we set up three groups by size based on total assets, and we split the population
according to 2-digit SIC codes. Then, we further split the sample according to profitability, as in
Bhojraj and Lee (2002), indicating that considering the profitability of comparables will improve
the accuracy of relative valuation models. The relative valuation ratio for a firm i is given by the
raw valuation metric of the firm i divided by size/sector/profitability median valuation metric for
the listing month and the two preceding months.13 For example, relative E/PIPO = E/PIPO / E/PComp
where E/PComp stands for the median ratio of comparable firms. All statistics and models are
presented for relative valuation metrics.
3.3. Stylized facts
In Table 2, we report the main characteristics of the samples of IPOs and RM listings, along
the median characteristics generally used in the analysis of the IPOs. The gross proceeds and the
pre-listing shareholders’ equity indicate that both types of listing mainly involve tiny capitalized
stocks, with a few exceptions that explain the large differences between medians and means. The
shareholders’ equity is CAN$400,000 before RMs and CAN$1.19 million before the IPOs. The
RMs have a median private placement of CAN$1 million, and the IPO’s median gross proceeds
13 We include three months in the estimation of the median ratio to circumvent the low number of observations in several sectors.
14
are CAN$3.51 million. The difference between these two groups of listing is statistically
significant. RM listed firms are younger than IPOs: 6.07 years vs. 9.81. Both groups report very
small median revenues of CAN$200,000 (RMs) and CAN$880,000 (IPOs). The proportion of
newly listed firms reporting negative earnings before the listing for RMs and IPOs is 71.85% and
59.94%, respectively. Both groups are financially constrained and, without the cash injection,
they would have negative cash after the listing.
The last three rows of Panel A report the relative valuation metrics. These valuation ratios
are estimated by dividing the value indicator by the price (E/P), which is then expressed relative
to their comparable. As a consequence, a low value of this metric indicates that the firms we
analyzed are valued more highly than their peers. For earnings- and sales-based ratios, the
median is in the vicinity of 50%. This indicates that the median newly listed firm is valued much
more highly (by approximately two times) than firms similar in terms of sector, size, and
profitability. This finding also indicates that, for a large proportion of our sample, the valuations
are optimistic. The valuation appears to be higher for RMs than for IPOs, but this result should be
analyzed cautiously, because the other characteristics of the issuers are not accounted for.
However, the mean ratios are higher than 1. This indicates that, on average, newly listed firms are
valued less highly than comparable non-issuers. The large difference between the mean and the
median indicates that the distribution of the valuation metrics is skewed.
[Insert Table 2 About Here]
Panel B reports tests and comparisons for the dummy variables. The proportion of new
listings that report no revenue is similar in the two groups, around 30%. We also report the
proportion of firms reporting revenues but negative earnings. It reaches 44.49% in the RM group
vs. 30.26% in the IPO group. Both types of listing seem to be used by emerging firms, but the
RM listing attracts a larger proportion of loss reporting firms than the IPO.
The proportion of IPOs and RMs observed in the High-Tech and Materials-and-Energy
sectors is similar. Many of the RM-listed firms (35.67%) are audited by one of the Big Five
(Four) auditors. This is more true in the case of IPOs (44.01%), and the difference between the
groups is significant. It is surprising to observe such high involvement of prestigious auditors in
very small and generally still developing firms. The pre-listing market returns are significantly
higher in the case of IPOs than RMs; this is in line with the link between public equity issuance
and market sentiment.

15
4. Methodology
4.1. Self-selection Problem
There is a self-selection problem in the choice of RMs and IPOs. This choice should be
explained by the managers’ long-run objectives (an unobservable set of variables) together with
an observable set of variables. If managers want to develop the firm, they should consider listing
through an IPO, which provides a more liquid market and potentially reduces the cost of equity
because of the higher level of disclosure. If the managers’ objective is to disinvest, or if they
want to maintain a large degree of control over the public firm, then they will put less emphasis
on these considerations and will prefer the RM listing option. Moreover, several exogenous and
endogenous variables also can explain the choice. For example, IPOs can be easier and more
frequent in hot issue markets. An RM would be the optimal choice if the required amount of
money were small. The managers’ objective is unobservable.
We use the two-stage procedure of Heckman (1979) to estimate the self-selection model. In
the first stage, consistent estimates are obtained from a probit regression of the dummy variable
DIPOi, that equals 1 if the company i lists after an IPO, and 0 otherwise, on Zi, a vector of
explanatory variables. These estimates are used to compute the inverse Mills ratios (IMR), λ0i.
Then, in the second stage, the long-run returns and valuation equations are estimated by OLS
with the IMR included as an additional explanatory variable (Heckman’s Lambda). Our self-
selection model is given by:
DIPOi = a1 + a2 DHTi + a3 DNRi + a4 DOGi + a5 LogAsseti + a6 Rm12m1i + a7 DNEi + a8 Pre B/Mi +
ui (1)
This model is based on the general idea that better companies opt for the most stringent
listing mode, to signal their quality, and to create the favorable conditions for future growth.14
This relation between disclosure and future growth is evidenced by Hyytinen and Pajarinen
(2005), who observe that firms in need of external finance voluntarily look for good disclosure
14 Professionals present the RM listings’ advantage (through the CPC program) as follows: (1) provides alternative access to capital when the firm is at too early a stage for a broadly distributed regular IPO, or the IPO market is not strong enough in general; (2) VC financing is not viable or management prefers not to use; (3) desire for a transaction that can retain higher ownership; (4) time to be a public firm; (5) greater flexibility, certainty, and control in the going-public process; and (6) going public transaction costs are known for the private firm. Source: Accessing Growth Financing Through the CPC Program. October 16, 2006, presented by: Sean D. Caulfeild. Perley-Robertson, Hill & McDougall LLP, http://www.ocri.ca/events/presentations/dollars_sense/nov062.pdf

16
quality. Sjostrom (2008 p.8) writes that in general only lower quality firms undertake RMs,
because more attractive financing options are available to higher quality firms. Hence, going
public through an RM signals to the market that the firm has probably been passed over by
underwriters and is therefore of low quality. Moreover, we consider that the choice of the listing
mode can be linked to the industry. As an example, the mining sector has a long tradition of RM,
and the CPC program was initiated in the provinces where the Oil-and-Gas and mineral sectors
are important. We include three dummy variables (DHTi, DNRi, and DOGi) that take the value 1
if the firm belongs to the Technology, Natural resources (Mineral), and Oil-and-Gas sector,
respectively. The other firms fall into disparate activity sectors. We consider that the level of
asymmetry is decreasing with firm size. We control for size by including the natural logarithm of
pre-listing total assets (LogAsseti). The lack of positive earnings is the primary indicator of a
low-quality issuer. We control for this dimension by including DNEi, a dummy variable that
equals 1 if the issuing firm reports negative earnings before the listing. We consider that negative
earnings are also a proxy for the heterogeneity of the expectation and information asymmetry.
The probability of public firms issuing private over public securities is positively related to the
measures of asymmetric information (Gomes and Phillips 2005).
The choice of a RM listing implies that the secondary market for stocks will be less liquid
than after an IPO, although in the Canadian case the differences are likely to be small. We
propose that the firms will use an IPO listing more frequently when they have more growth
opportunities. We use the classical measure for the relative weight of the growth opportunities,
the book-to-market ratio. We estimate this ratio before the listing to avoid capturing a post-listing
valuation effect. Pre B/M is estimated by dividing the shareholders’ equity at the end of the
previous fiscal year by the simultaneous market value.15 A high value of this ratio indicates a lack
of growth opportunities. We expect a negative association between this ratio and the choice of an
IPO. Firms are more likely to issue public equity than private equity when the market conditions
appear to be favorable (Gomes and Phillips 2005). We estimate this dimension by the market
return during the 12 months preceding the listing (Rm12m1i).
The constraint level and the age also can explain the choice of the listing mode, but they
cannot be estimated for a sizeable part of our sample of RMs. Accordingly, we cannot use these 15 When the shareholders’ equity at t-1 (SEt-1) was not available, we infer this value with the following expression: SE t-1 = SE0 – GP – EARN0, where GP and EARN stands for the gross product of the IPO or private placement and EARN for the net earnings of the listing year, respectively.
17
variables for the whole study. However, we report the results for the sub-sample in Table 3.
Heavily constrained firms are of lower quality and they need cash rapidly. Using an RM can
provide cash more rapidly than using an IPO. However, doing an IPO can be difficult for a
distressed firm. For each firm, we estimate the financial constraint indicator proposed by
DeAngelo, De Angelo, and Stulz (2007): pro forma cash/TAi= [cash, deposit, and short-term
investment in year 1, less the gross proceeds of the issue] divided by the total assets in year 1.
[Insert Table 3 About Here]
Based on previous U.S. evidence, we consider that the choice of an IPO is more likely when
the firms are larger, of better quality (reporting positive earnings), have superior growth
opportunities, and when the market is more favorable to the IPO. Because of the high pricing for
high-tech stocks that prevailed during a large part of the studied period, we suggest that there will
be more IPOs in this sector. Table 3 summarizes the results of the model of choice used to
control for the self-selection problem. The model is highly significant. All of the variables have
the expected sign, except for the DNR dummy. The probability of the choice of an IPO is higher
in this sector, a result that can be traced to the very good performance of this sub-sector in the
stock market, in line with the increasing price of natural resources since 2000.
4.2. Relative Valuation Metrics
Our main hypothesis is that the choice of the listing mode influences the cost of equity,
because of the difference in the disclosure level between the two modes. If more disclosure
implies a lower cost of equity, then a firm should be valued more, all else being equal, when the
listing follows an IPO rather than an RM. We analyze the valuation as stated by the investment
bankers (in the case of IPOs) or by the private investors (in the case of RMs). Then, our logic is
more in line with Kim and Ritter (1999) than with Purnanandam and Swaminathan (2004) who
explain the market price following the IPOs. Using ordinary least-squares regressions, we explain
the relative valuation metrics by the listing choice (DIPO) and by several control variables. The
most important of these variables is the choice of a prestigious auditor (PAUDIT): it takes a value
of 1 if the auditor is one of the Big Five (Four). Our second hypothesis is that prestigious auditors
can have a positive influence on valuation, above and beyond the effect of the listing mode. We
include additional control variables to consider two dimensions: the first is risk -- larger firms
and those with positive earnings should obtain higher multiples, because they constitute less risky
investments. All else equal, the required cost of equity should be lower. Second is sector: the

18
accounting rules governing R&D reporting, such as the ones related to resource companies, are
likely to influence the earnings and book values of the firms in these sectors. We can expect to
observe systematic differences between the valuations in these different sectors. Moreover, the
expectations of future revenues also may have systematically influenced market values. We
control for the return of the market during the year preceding the listing to consider the potential
effect of timing. We can expect higher values following the periods of rally in the market. To
handle the self-selection problem previously discussed, we add the Heckman’s lambda estimated
in the probit model. This variable controls for the unobservable factors that influence the choice
of the listing mode.
4.3. Long-run Return Estimates
The analysis of long-run returns is a complex empirical problem, particularly for penny
stocks, whose distribution of returns is highly influenced by a few extremely high returns. The
estimation of abnormal returns in such situations calls for particular care. Mainly, the test based
on averages could have low predictive power because returns are strongly influenced by the right
tail of the distribution.16 As a first step, we estimate the raw geometric returns for each issuer, for
the 36 months following the issue. These returns are neither adjusted for the market nor for other
factors like size and risk. However, in the area of very small capitalization, the adjustments
allowing for estimation of excess return could produce significant noise, and the analysis of raw
returns is of interest.
As a second step, we estimate abnormal returns using the event-time methodology (BHAR,
namely the investor’s experience measure). These returns are estimated against reference
portfolios composed of firms of comparable size and book-to-market ratios.17 To construct the
reference portfolios, we extract Canadian firms’ book-equity from the accounting database and
estimate the book-to-market ratios after matching the stock market and accounting databases. To
construct the size-control portfolio, we ranked all Canadian stocks each month according to their
market capitalization, and formed three portfolios. Independently, all Canadian stocks also are 16 The estimation of excess returns also can be complicated, because the returns on the benchmark portfolios, also composed of small capitalized stocks, can be heavily skewed. This is why we analyze the raw returns together with the excess returns. We cannot use accounting measures of performance as in Hartzell, Kallberg, and Liu (2008) because the majority of our firms report negative earnings. 17 Several authors use control-firm benchmarks in lieu of, or in complement to, the portfolio benchmark. We opt for portfolios. The characteristics of our sample are very specific, including a high proportion of firms at an early development stage, and with a limited life expectation. The choice of a control firm could lead to random results, in the case of delisting and when the returns reach extreme values.

19
ranked according to their book-to-market ratios, and three portfolios are formed. The returns on
the nine-monthly rebalanced portfolios are calculated as the value-weighted average of the
individual-firm monthly returns in each of the size/book-to-market intersections. Each RM firm
then is assigned a control portfolio based on its market capitalization and book-to-market ratio
over the performance test period examined. BHARs are based on the calculation of the average
abnormal return from a buy-and-hold strategy ( qtoBHAR1 ) from the RM month (1) to the month
q (36):
∑Nq
1=i qto1,i*q,iqto1 BHARw=BHAR , where ∏∏
1,
1,q to1 i, )1(-)1( BHAR
q
ssbi
q
ssi RR
==
++= (2)
Thus, BHARs measure the average multiyear returns from a strategy of investing in all Canadian
RM listed firms, and selling at the end of a particular holding period, versus a comparable
strategy using a benchmark (Rbi). We estimate equally-weighted (EW) and value-weighted (VW)
portfolio returns. We use both weighting schemes to override the problem induced by the
distribution of market capitalizations. The VW results could be largely influenced by a small sub-
sample of large firms.18
5. Results
5.1. Listing mode and valuation
Table 4 presents the results of the model that explain the relative valuation by the
listing/disclosure choice and control variables. Each model is estimated with and without the
Heckman’s Lambda as a control for self-selection. We express the valuation metrics in the
opposite of the conventional way (earnings-to-price ratio, rather than price-to-earnings ratio, for
example) to overcome the problem of a very low value indicator in numerous cases. Accordingly,
we expect negative signs for the DIPO and PAUDIT dummy variables, which indicate
respectively that the firm had fulfilled the disclosure and registration requirement to get listed,
and that a prestigious auditor was hired before the listing.
[Insert Table 4 About Here]
The firms that list after an IPO get higher relative valuation, in each of the valuation metrics
we analyze. The effect is statistically and economically significant. We can interpret the
18 We also estimate the abnormal returns through the alphas obtained from the Fama and French’s (1993) three factor pricing model (TFPM). This method is highly sensitive to skweness, though, and we do not report the results. They are available from the authors.

20
coefficient of the dummy variable DIPO, which is -1.36 in the case of the relative earnings to
price, as follows: the difference between the firms choosing IPO versus RM, when the other
factors are considered as constant, is -1.36. The average relative ratio is in the vicinity of 1.24 for
IPOs (Table 2). The relative ratio should be approximately 2.60 for RM to get a difference of -
1.36. If the price / earnings ratio for a comparable group of non-issuers is 10, then E/PComp = 0.10
and E/PIPO and E/PRM are 0.124 and 0.26, respectively (Rel E/PIPO = 1.24 = 0.124 / 0.10). Under
this plausible hypothesis, the average P/E is 8.06 and 3.85 for IPOs and RM, respectively.
Accordingly, the coefficient of the dummy variable indicates that the full disclosure through an
IPO increases the value obtained around the listing by two, for a given level of earnings. The
coefficients are -1.18 for the relative sale-to-price ratio and 1.81 for the book-to-price ratio.
According to all valuation metrics, the full disclosure required by the IPO regulation significantly
increases the valuation, relative to the backdoor listing process. The investment bankers and
private equity investors who price the shares around the listing time seem to incorporate the
choice of listing mode in their valuation.
We observe a positive and significant relationship between the relative valuation metrics
and size, when value is estimated relative to sales and earnings. This indicates that the smaller
issuers receive a better valuation than the larger firms. This result contradicts the argument that
larger firms benefit from a lower cost of equity, which in turn provide them a higher valuation.
Our sample includes a number of very small issuers: in the restricted group for which we can
estimate the relative sales-to-price ratio, more than 10% of the observations report total assets
below CAN$1 million. These companies also report very low revenues and earnings. In Table 2,
we observe that the pricing is, at the median, very high relative to the benchmark, indicating
optimistic pricing for a large proportion of the sample. We assess the robustness of our results to
the higher and lower values of the relative valuation metrics, by trimming the extreme percentile
of the distributions. We also verify whether the results hold in each of the two groups of newly
listed companies. The results are robust and indicate that the over-pricing is more frequent among
small issuers than the larger ones.
5.2. Listing Mode and Long-run Returns
In Table 5, we illustrate the distributions of raw and abnormal returns. Raw returns
culminate at 3200% for three years, and 1% of the distribution exhibits returns higher than 890%.
21
However, only 10% of the distribution is higher than 167% (39% per year).19 Using BHAR does
not eliminate the skewness, although the negative tail does increase. We then observe that the
distributions of long-run returns exhibit a high level of skewness. This situation limits the
possibility of inferring significant differences using methods that essentially rely on average
effects, like the portfolio approach of the TFPM. Moreover, such distributions violate the basic
assumptions of the OLS method. We deal with this by discussing and comparing the medians in
the univariate comparisons, and we use the log transformation (Ln return = Natural logarithm of
1000% + buy-and-hold or Raw returns) to normalize abnormal returns in the OLS estimations.
We get similar results by trimming the distributions at the 99th percentile. The results are reported
with this last method.
[Insert Table 5 About Here]
Globally, the long-run returns following Canadian IPOs and listings through RMs are
extremely poor, and are lower for RM than for IPOs. Overall, we estimate the average abnormal
return to -58.75%, but the median of the distribution of abnormal returns is -86.75%. The long-
run underperformance following IPOs is well documented (Jenkinson and Ljungqvist 2001,
Table 2.2). However, previous evidence situates generally this abnormal return in the vicinity of
-30% in the US. The very negative values estimated in our study are consistent with the
proposition that lax regulatory requirements induce low quality firm to list on the market. This
indicates that lowering the initial listing requirements initiated by the Canadian exchanges and
regulators has negative effects on shareholders’ wealth. An open question remains to understand
why rational investors still participate in such poor quality issues. We can propose two non
exclusive answers. First, newly listed Canadian companies are generally in the developing stage,
and short sales are quite impossible. The observed return pattern is therefore consistent with the
argument that prices are increased irrationally by the more optimistic investors (Miller 1977).
Second, we observe in Table 5 that few newly listed firms produce huge returns, which is
attributable to the very low issue prices on average. The distribution of returns is consistent with
the “lottery stocks” explanation provided by authors like Barberis and Huang (2007). In contrast
to the prediction of a standard expected utility model, a security's own skewness can be priced: a
positively skewed security can be overpriced, and can earn a negative average excess return. 19 We carefully analyze each case where the raw returns exceed 200% to detect and correct the possible errors. The reported huge returns are true returns, generally observed for firms initially traded at prices below 50 cents.
22
Positive skewness of the returns distribution means that, in a few cases, the shareholders can
obtain very high rates of return even if, on average, the expected return is low. In such a context,
however, the information disclosed at the listing time could be of value in identifying the likely
loser from the potential winners.
Table 6 presents the analysis of the effect of the listing choice on the mean and median
abnormal returns (Panel A) and on the TFPM alphas (Panel B). In the first part of Panel A, we
report the mean and median of the distributions of returns, first for the population and then for the
two sub-samples. We test for the significance of the differences in mean and median. Because the
distributions of the raw and abnormal returns are so heavily skewed, we mainly discuss the
median and their differences. We observe strong and statistically significant effects of the
listing/disclosure choice on the raw and abnormal returns. The median raw return is -31.76% for
3 years for IPOs and -54.08% for RM, and the difference is statistically significant.
Benchmarking against reference portfolios increases this difference between the two sub-
samples. The median abnormal return reaches -70.81 % for the IPOs but falls to -103.78% for
RMs. Such a result indicates that, for half of the sample, the investment in post-RM listed firms
is equal to a total opportunity loss. In Panel B, we do not observe significant differences between
the median of alphas, but the means do differ. This first analysis indicates a significant effect of
the listing/disclosure choice on the long-run performance of newly listed companies.20
[Insert Table 6 About Here]
Table 7 presents the results of the models explaining the different measures of long-run
performance. Each model is estimated with and without the Heckman’s Lambda for controlling
for the self-selection problem. The first noticeable effect is the significant influence of the
listing/disclosure mode on Raw and BHAR returns, even when we control for the dimensions
generally associated with risk and uncertainty. In both cases, the effect is positive, indicating that
IPO listed-firms perform better (less badly) than those that use backdoor listing. BHRE is 17.9%
higher and BHAR is 33.9% higher for IPO listings.
[Insert Table 7 About Here]
20 To control for the bubble period, we omitted the 200 listings occurring from 1997 (January) to 2001 (January), when they are classified as high-tech companies. The results are unchanged.
23
5.3. Additional Variables and Robustness Checks
We also considered additional robustness checks. First, we re-ran regressions for the
subsample of RMs and IPOs separately. We do not report the results for the valuation models,
where we do not observe any significant effect. This reinforces the previous results, indicating
that the only significant variable that affects the value at the listing time is the disclosure level.
We report the results of the returns models in Table 8. The effect of a reputable auditor is
significant only in the subsample for IPOs, not for the subsample of RMs. For IPOs, BHRE is
18.5% higher, and BHAR is 24.8% higher when there is a reputable auditor. This indicates that
hiring a reputable auditor contributes to setting a more reasonable price in the secondary market.
Such a result is consistent with the proposition that the reputable auditors reduce the asymmetry
of information and the associated heterogeneity of expectations. From a practical point of view,
this result indicates that investors are less negatively affected by investing in IPOs when
reputable auditors are involved in the issue. Because reasonable performance of the stock on the
secondary market also is of interest for the newly listed firm seeking a seasoned offering, this
constitutes a complementary benefit of hiring a reputable auditor. We do not observe any
significant effect in the case of RMs. This finding is consistent with the fact that, when the
disclosure level is low, the certification of this disclosure has both a limited interest and effect. In
view of this new evidence, it is puzzling that so many RM listed companies hire prestigious
auditors; one plausible explanation might be that private investors requested such intermediaries.
Second, we considered additional variables in the subsample regressions for IPOs and
acquisitions in order to control for factors that can influence the relative performance or valuation
of IPOs and RMs. The results also are reported in Table 8. First, we included variables for
venture capital backing (VBIPO)21 and investment banker reputation (PUND) for the subsample
of IPOs (those variables could not be included for the subsample of RMs given they do not apply
to RMs).22 We also considered the exchange listing for both samples (DEXCH is 1 if the firm
21 VBIPO is defined as equal to one when the IPO is backed by a venture capitalist and zero otherwise. We obtained a list of VC-backed-IPOs from Thomson Financial VC Reporter, for the years 1997, and 1999 to 2003. For the other years, we analyze the list of important shareholders in each of the prospectuses. We compile a list of VCs operating in Canada from 1993 to 2003 from the lists of the Canadian Venture Capital Association, the summary of Industry Canada and the lists of the equity sources provided by M. Volker at http://www.sfu.ca/~mvolker/biz/moneylnk.htm. Then, we identify each case where a VC was involved in the company before the IPO. 22 Following Carter, Dark, and Singh (1998), we consider the most active investment bankers in Canada to be prestigious. During the period under study, seven investment bankers subscribed to 60% of all the
24
lists on the TSX); however, almost all RMs listed on the TSXV and not on the TSX. This
variable controls for a possible liquidity effect. The important finding is that the inclusion of
these variables does not change the previous results.
[Insert Table 8 About Here]
6. Conclusion
We analyze three dimensions of the new listing process that can roughly be associated with
the three main stakeholders of new listings: the regulators, the firms, and the investors. We
exploit a particular situation where the firm can list under a full disclosure process or by using
backdoor listing methods, where the disclosure can be minimal and even absent. This context is
of particular interest because the low listing requirements that prevail in Canada allow for the
listing of emerging companies that are reporting negative earnings or even no revenues at all.
This creates a situation where the information asymmetry is very pronounced, and where the role
of disclosure and certification can be seen more easily than in the highly regulated U.S. context.
Overall, our assessment is that low listing requirements negatively affect investor wealth.
The long-run returns that follow Canadian IPOs and RM listings are extremely poor. However,
this effect can be accounted for by focusing on the average of the distributions. A few newly
listed firms produce huge returns, but the proportion of negative raw or excess returns can reach
60% to 70% depending on the measure. The assessment that a higher initial listing requirement
will protect the investors seems to be confirmed. A preference for skewness can explain why the
investors still participate in these offerings which resemble lottery stocks.
The second dimension we analyze is of interest for both the managers and for research on
disclosure. We evidence a strong effect of the choice of disclosure/listing mode on the value that
the firms can obtain for the new shares issued during the listing. In terms of the earnings, the
multiple obtained through an IPO is twice the multiple observed in an RM situation. We carefully
control for the other dimensions that can influence the valuation, including self-selection between
the two listing modes, in order to carefully assess the observed effect associated with the
disclosure level.
initial and seasoned equity issues, and are thus considered prestigious. No other Canadian-based investment bank comprises more than 5% of the total market. We also consider as prestigious US firms with a score higher than 7 in Carter, Dark, and Singh and the most active investment bankers worldwide provided by Ljungqvist, Jenkinson, and Wilhelm (2003 Table 2, p. 73). The dummy variable PUND is one when the investment banker is considered prestigious.
25
The third dimension we analyze is more related to the investors. The important question is
whether, all else being equal, investing in firms that list with full disclosure is better than
investing in firms that bypass the prospectus and registration process. The answer is definitely
yes: IPO-listed firms perform better than RM-listed firms. This effect can be traced to the higher
level of disclosure implied by the information in the prospectus, if one accepts Miller’s (1977)
proposition that, when short sales are constrained, the price is set by the more optimistic
investors. In our analyses, we controlled to the fullest extent possible for the other possible
determinants of performance and self-selection.
It is noteworthy that we find a significant impact of the auditor’s prestige when, and only
when, the firm chooses to disclose and list after an IPO. This result confirms the fact that
certification matters only in the case of disclosure. This suggests that it is worth exploring in
further research the issue of why firms hire a prestigious auditor when they choose an RM.
Overall, our results suggest that disclosure has a significant economic impact. These results
are consistent with theories suggesting that a commitment by a firm to increase its disclosure
level lowers the information asymmetry component of the cost of capital. The results are also
consistent with the hypothesis that increased disclosure reduces the heterogeneity of expectations
and mispricing.
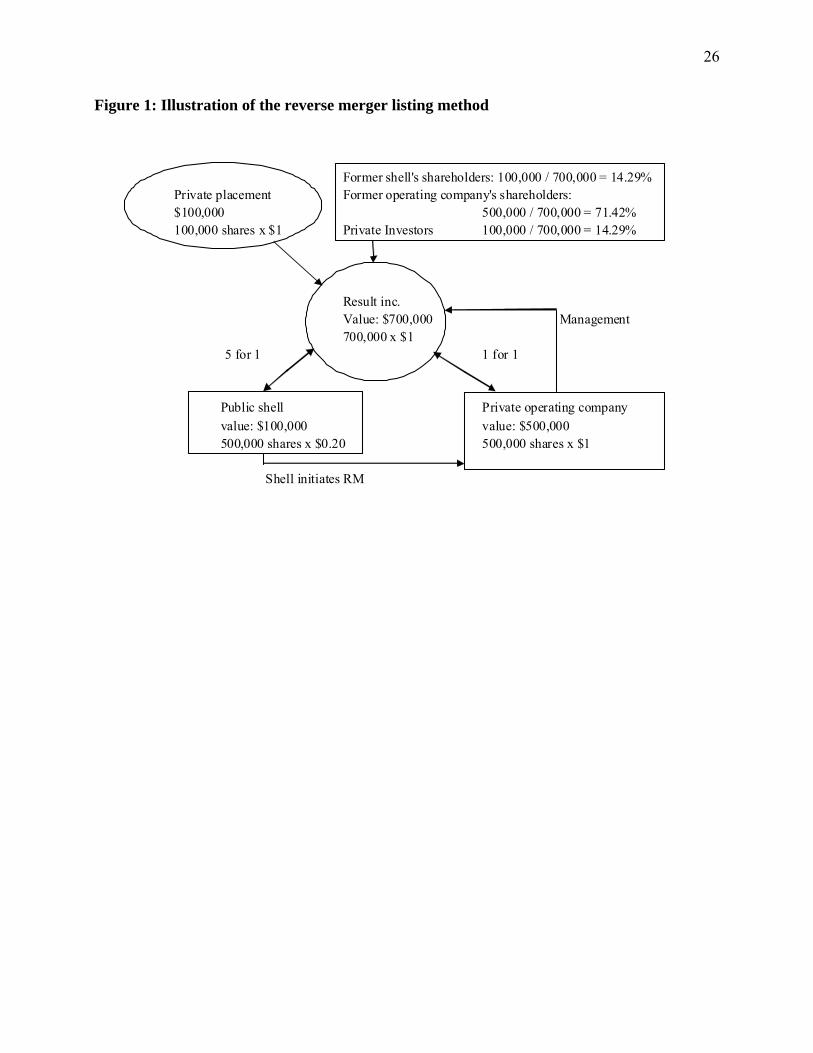
26
Figure 1: Illustration of the reverse merger listing method
Former shell's shareholders: 100,000 / 700,000 = 14.29%Private placement Former operating company's shareholders:$100,000 500,000 / 700,000 = 71.42%100,000 shares x $1 Private Investors 100,000 / 700,000 = 14.29%
Result inc.Value: $700,000 Management700,000 x $1
5 for 1 1 for 1
Public shell Private operating companyvalue: $100,000 value: $500,000500,000 shares x $0.20 500,000 shares x $1
Shell initiates RM
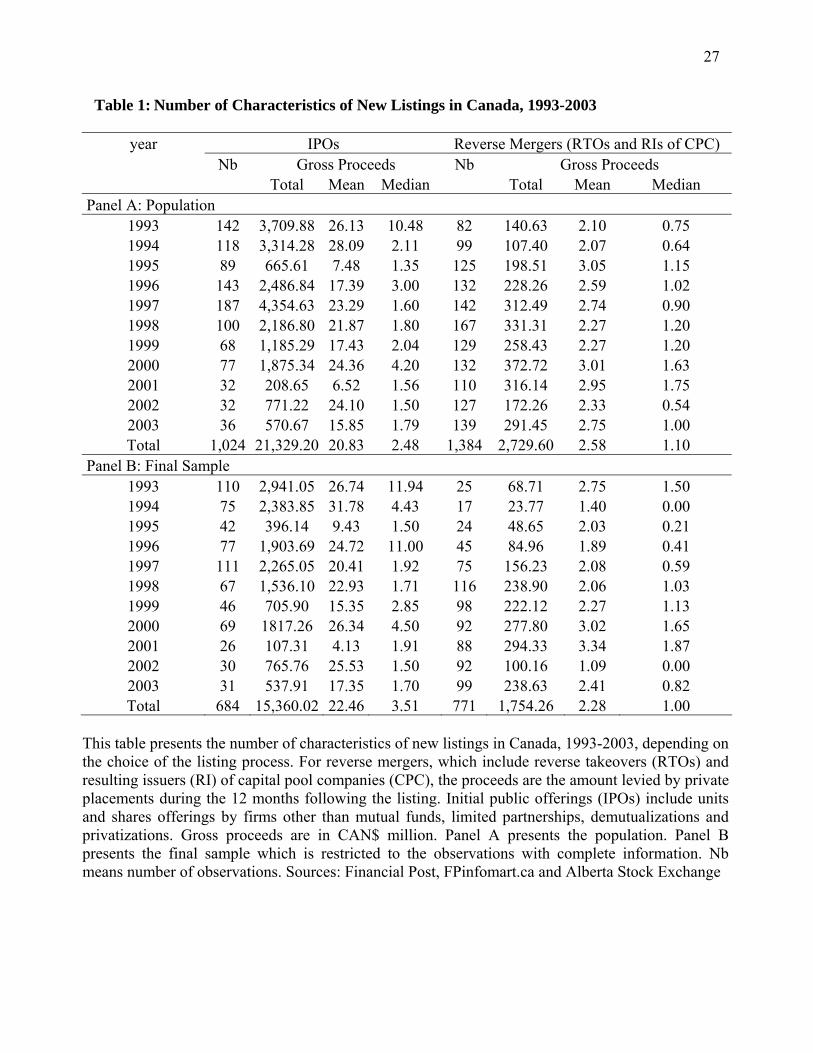
27
Table 1: Number of Characteristics of New Listings in Canada, 1993-2003
year IPOs Reverse Mergers (RTOs and RIs of CPC) Nb Gross Proceeds Nb Gross Proceeds Total Mean Median Total Mean Median
Panel A: Population 1993 142 3,709.88 26.13 10.48 82 140.63 2.10 0.75 1994 118 3,314.28 28.09 2.11 99 107.40 2.07 0.64 1995 89 665.61 7.48 1.35 125 198.51 3.05 1.15 1996 143 2,486.84 17.39 3.00 132 228.26 2.59 1.02 1997 187 4,354.63 23.29 1.60 142 312.49 2.74 0.90 1998 100 2,186.80 21.87 1.80 167 331.31 2.27 1.20 1999 68 1,185.29 17.43 2.04 129 258.43 2.27 1.20 2000 77 1,875.34 24.36 4.20 132 372.72 3.01 1.63 2001 32 208.65 6.52 1.56 110 316.14 2.95 1.75 2002 32 771.22 24.10 1.50 127 172.26 2.33 0.54 2003 36 570.67 15.85 1.79 139 291.45 2.75 1.00 Total 1,024 21,329.20 20.83 2.48 1,384 2,729.60 2.58 1.10
Panel B: Final Sample 1993 110 2,941.05 26.74 11.94 25 68.71 2.75 1.50 1994 75 2,383.85 31.78 4.43 17 23.77 1.40 0.00 1995 42 396.14 9.43 1.50 24 48.65 2.03 0.21 1996 77 1,903.69 24.72 11.00 45 84.96 1.89 0.41 1997 111 2,265.05 20.41 1.92 75 156.23 2.08 0.59 1998 67 1,536.10 22.93 1.71 116 238.90 2.06 1.03 1999 46 705.90 15.35 2.85 98 222.12 2.27 1.13 2000 69 1817.26 26.34 4.50 92 277.80 3.02 1.65 2001 26 107.31 4.13 1.91 88 294.33 3.34 1.87 2002 30 765.76 25.53 1.50 92 100.16 1.09 0.00 2003 31 537.91 17.35 1.70 99 238.63 2.41 0.82 Total 684 15,360.02 22.46 3.51 771 1,754.26 2.28 1.00
This table presents the number of characteristics of new listings in Canada, 1993-2003, depending on the choice of the listing process. For reverse mergers, which include reverse takeovers (RTOs) and resulting issuers (RI) of capital pool companies (CPC), the proceeds are the amount levied by private placements during the 12 months following the listing. Initial public offerings (IPOs) include units and shares offerings by firms other than mutual funds, limited partnerships, demutualizations and privatizations. Gross proceeds are in CAN$ million. Panel A presents the population. Panel B presents the final sample which is restricted to the observations with complete information. Nb means number of observations. Sources: Financial Post, FPinfomart.ca and Alberta Stock Exchange
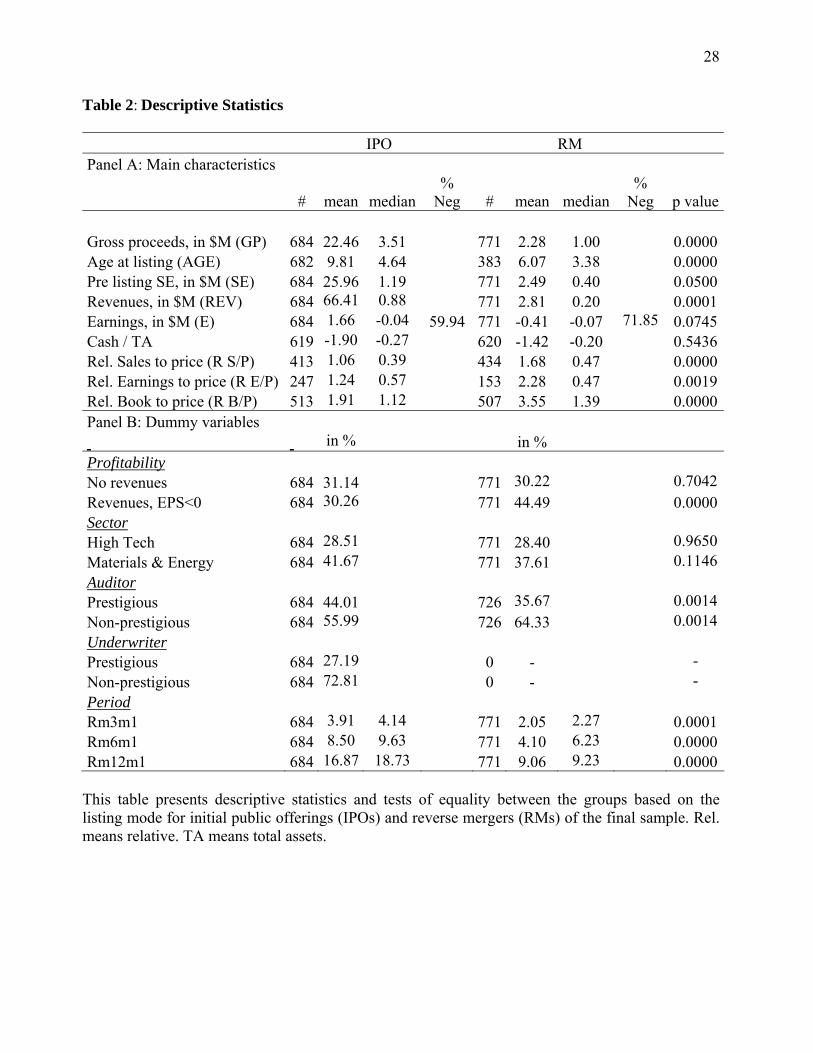
28
Table 2: Descriptive Statistics
IPO RM Panel A: Main characteristics
# mean median%
Neg # mean median %
Neg p value Gross proceeds, in $M (GP) 684 22.46 3.51 771 2.28 1.00 0.0000Age at listing (AGE) 682 9.81 4.64 383 6.07 3.38 0.0000Pre listing SE, in $M (SE) 684 25.96 1.19 771 2.49 0.40 0.0500Revenues, in $M (REV) 684 66.41 0.88 771 2.81 0.20 0.0001Earnings, in $M (E) 684 1.66 -0.04 59.94 771 -0.41 -0.07 71.85 0.0745Cash / TA 619 -1.90 -0.27 620 -1.42 -0.20 0.5436Rel. Sales to price (R S/P) 413 1.06 0.39 434 1.68 0.47 0.0000Rel. Earnings to price (R E/P) 247 1.24 0.57 153 2.28 0.47 0.0019Rel. Book to price (R B/P) 513 1.91 1.12 507 3.55 1.39 0.0000Panel B: Dummy variables in % in % Profitability No revenues 684 31.14 771 30.22 0.7042Revenues, EPS<0 684 30.26 771 44.49 0.0000Sector High Tech 684 28.51 771 28.40 0.9650Materials & Energy 684 41.67 771 37.61 0.1146Auditor Prestigious 684 44.01 726 35.67 0.0014Non-prestigious 684 55.99 726 64.33 0.0014Underwriter Prestigious 684 27.19 0 - - Non-prestigious 684 72.81 0 - - Period Rm3m1 684 3.91 4.14 771 2.05 2.27 0.0001Rm6m1 684 8.50 9.63 771 4.10 6.23 0.0000Rm12m1 684 16.87 18.73 771 9.06 9.23 0.0000
This table presents descriptive statistics and tests of equality between the groups based on the listing mode for initial public offerings (IPOs) and reverse mergers (RMs) of the final sample. Rel. means relative. TA means total assets.
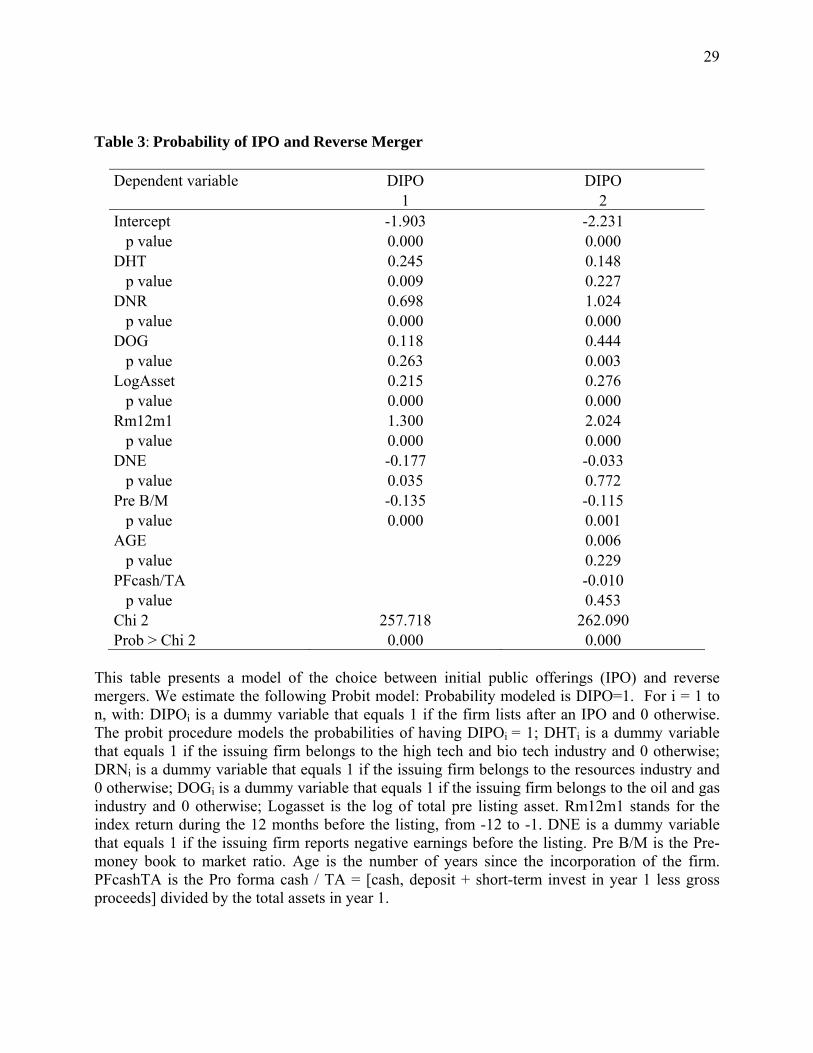
29
Table 3: Probability of IPO and Reverse Merger
Dependent variable DIPO DIPO 1 2 Intercept -1.903 -2.231 p value 0.000 0.000 DHT 0.245 0.148 p value 0.009 0.227 DNR 0.698 1.024 p value 0.000 0.000 DOG 0.118 0.444 p value 0.263 0.003 LogAsset 0.215 0.276 p value 0.000 0.000 Rm12m1 1.300 2.024 p value 0.000 0.000 DNE -0.177 -0.033 p value 0.035 0.772 Pre B/M -0.135 -0.115 p value 0.000 0.001 AGE 0.006 p value 0.229 PFcash/TA -0.010 p value 0.453 Chi 2 257.718 262.090 Prob > Chi 2 0.000 0.000
This table presents a model of the choice between initial public offerings (IPO) and reverse mergers. We estimate the following Probit model: Probability modeled is DIPO=1. For i = 1 to n, with: DIPOi is a dummy variable that equals 1 if the firm lists after an IPO and 0 otherwise. The probit procedure models the probabilities of having DIPOi = 1; DHTi is a dummy variable that equals 1 if the issuing firm belongs to the high tech and bio tech industry and 0 otherwise; DRNi is a dummy variable that equals 1 if the issuing firm belongs to the resources industry and 0 otherwise; DOGi is a dummy variable that equals 1 if the issuing firm belongs to the oil and gas industry and 0 otherwise; Logasset is the log of total pre listing asset. Rm12m1 stands for the index return during the 12 months before the listing, from -12 to -1. DNE is a dummy variable that equals 1 if the issuing firm reports negative earnings before the listing. Pre B/M is the Pre-money book to market ratio. Age is the number of years since the incorporation of the firm. PFcashTA is the Pro forma cash / TA = [cash, deposit + short-term invest in year 1 less gross proceeds] divided by the total assets in year 1.

30
Table 4: OLS Regressions of Relative Valuation Multiples
Dependant variable
Model 1: Relative Sales to Price Ratio,
R S/P
Model 2: Relative Earnings to Price Ratio,
R E/P
Model 3: Relative Book to Price Ratio,
R B/P Intercept -0.070 0.249 0.453 0.144 2.776 4.039 t -0.191 0.484 0.653 0.128 3.925 4.034 DIPO -1.175 -1.177 -1.365 -1.359 -1.809 -1.812 t -6.888 -6.895 -4.005 -3.977 -6.226 -6.244 PAUDIT -0.053 -0.058 -0.106 -0.097 0.151 0.106 t -0.343 -0.375 -0.365 -0.330 0.540 0.378 LogAsset 0.209 0.209 0.185 0.190 0.062 0.057 t 5.316 5.294 2.492 2.513 0.854 0.779 DNE -0.093 -0.083 -0.237 -0.204 t -0.575 -0.515 -0.756 -0.649 DHT 0.318 0.326 0.593 0.607 0.848 0.887 t 1.814 1.856 1.671 1.698 2.360 2.467 DOG 0.538 0.556 0.524 0.526 0.054 0.112 t 2.703 2.781 1.379 1.382 0.137 0.284 DNR 1.768 1.762 0.440 0.468 0.051 0.144 t 4.508 4.490 0.672 0.708 0.126 0.354 Rm12m1 0.599 0.637 0.413 0.437 1.351 1.453 t 1.529 1.617 0.496 0.523 1.890 2.028 Lambda -0.966 0.752 -3.716 t -0.891 0.351 -1.780 Number of observations 794 794 381 381 955 955 Adjusted R2 0.079 0.079 0.032 0.029 0.043 0.045 This table presents OLS regression analysis of relative valuation multiples on listing method, auditor choice and control variables. Each valuation metrics is divided by the median of the same quantity for the population of similar sector/size/profitability firms. The sample is reduced to the firms with positive sales (Model 1), with positive earnings (Model 2) and with positive book value (Model 3). Each model is first estimated without the Heckam’s Lambda, and then including this variable to control for the self-selection. DIPOi is a dummy variable that equals 1 if the firm lists after an IPO and 0 otherwise. PAUDITi is a dummy variable that equals 1 if the firm is audited by one of the Big Four (five) and 0 otherwise. DNE is a dummy variable that equals 1 if the issuing firm reports negative earnings before the listing. LogAsset is the log of total pre-listing asset. DHTi, DOGi and DNRi are dummy variables that equals 1 if the issuing firm belongs to the high tech and bio tech industry, Natural resources and Oil and Gas respectively and 0 otherwise; Rm12m1 stands for the index return during the 12 months before the listing, from -12 to -1.
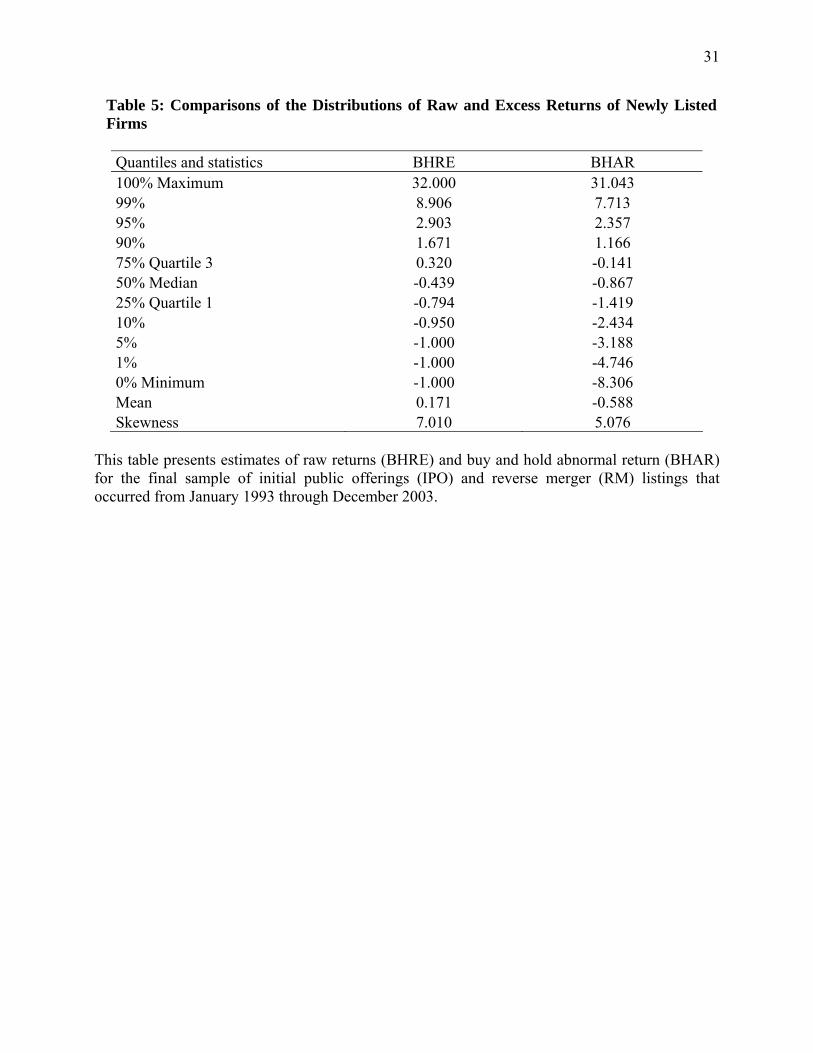
31
Table 5: Comparisons of the Distributions of Raw and Excess Returns of Newly Listed Firms
Quantiles and statistics BHRE BHAR 100% Maximum 32.000 31.043 99% 8.906 7.713 95% 2.903 2.357 90% 1.671 1.166 75% Quartile 3 0.320 -0.141 50% Median -0.439 -0.867 25% Quartile 1 -0.794 -1.419 10% -0.950 -2.434 5% -1.000 -3.188 1% -1.000 -4.746 0% Minimum -1.000 -8.306 Mean 0.171 -0.588 Skewness 7.010 5.076
This table presents estimates of raw returns (BHRE) and buy and hold abnormal return (BHAR) for the final sample of initial public offerings (IPO) and reverse merger (RM) listings that occurred from January 1993 through December 2003.
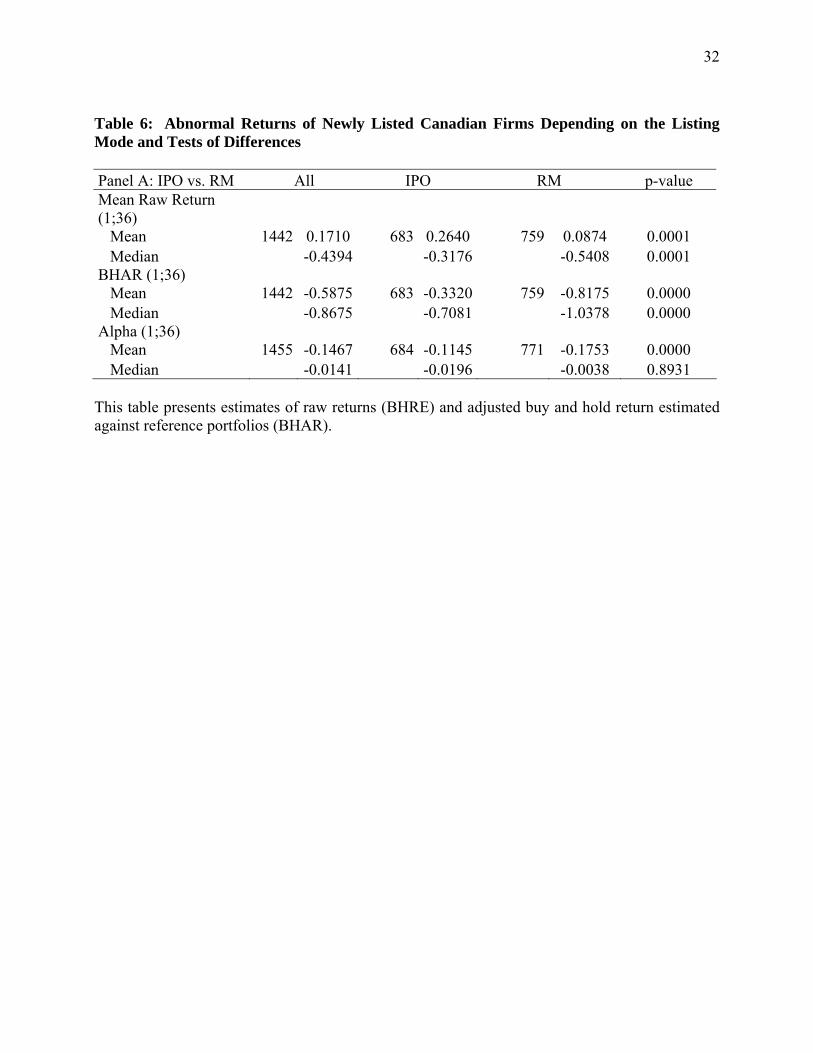
32
Table 6: Abnormal Returns of Newly Listed Canadian Firms Depending on the Listing Mode and Tests of Differences Panel A: IPO vs. RM All IPO RM p-value Mean Raw Return (1;36) Mean 1442 0.1710 683 0.2640 759 0.0874 0.0001 Median -0.4394 -0.3176 -0.5408 0.0001 BHAR (1;36) Mean 1442 -0.5875 683 -0.3320 759 -0.8175 0.0000 Median -0.8675 -0.7081 -1.0378 0.0000 Alpha (1;36) Mean 1455 -0.1467 684 -0.1145 771 -0.1753 0.0000 Median -0.0141 -0.0196 -0.0038 0.8931 This table presents estimates of raw returns (BHRE) and adjusted buy and hold return estimated against reference portfolios (BHAR).

33
Table 7: Cross Sectional OLS Regression of Long Run Abnormal Returns on Listing Method BHRE (1;36) BHAR (1;36) Intercept -0.542 -0.548 -1.569 -1.704 t -3.227 -2.297 -7.865 -5.950 DIPO 0.179 0.179 0.338 0.339 t 2.439 2.439 3.870 3.881 PAUDIT 0.096 0.096 0.205 0.209 t 1.354 1.353 2.432 2.473 LogAsset 0.059 0.059 0.085 0.085 t 3.336 3.331 4.019 4.006 DNE -0.144 -0.144 -0.252 -0.255 t -1.830 -1.829 -2.697 -2.724 DHT 0.103 0.103 0.254 0.250 t 1.165 1.159 2.404 2.365 DOG 0.696 0.695 0.604 0.596 t 7.049 7.007 5.119 5.032 DRN 0.223 0.222 0.117 0.106 t 2.187 2.152 0.965 0.859 Rm12m1 -1.023 -1.024 -0.583 -0.596 t -5.689 -5.657 -2.721 -2.768 Lambda 0.020 0.413 t 0.038 0.656 Number of observations 1313 1313 1312 1312 Adjusted R2 0.073 0.079 0.073 0.079 This table examines the determinants of stock performance over a three-year horizon following the listing. Stock performance is measured using the raw return, BHRE (1;36) and the adjusted buy and hold return estimated against reference portfolios, BHAR (1;36). Each model is first estimated without the Heckam’s Lambda, and then including this variable to control for the self-selection. DIPO is a dummy variable which is equal to one if the firm list through an IPO and 0 is the firm uses a RM. PAUDIT is a dummy variable that equals 1 if the firm is audited by one of the Big Four (five) and 0 otherwise. Logasset is the natural logarithm of the total asset before the listing. DNE is an indicator variable which is equal to one if the firm has negative earnings during the year prior to the listing transaction. DHTi, DOGi and DNRi are dummy variables that equals 1 if the issuing firm belongs to the high tech and bio tech industry, Natural resources and Oil and Gas respectively and 0 otherwise; Rm12m1 stands for the index return during the 12 months before the listing, from -12 to -1.
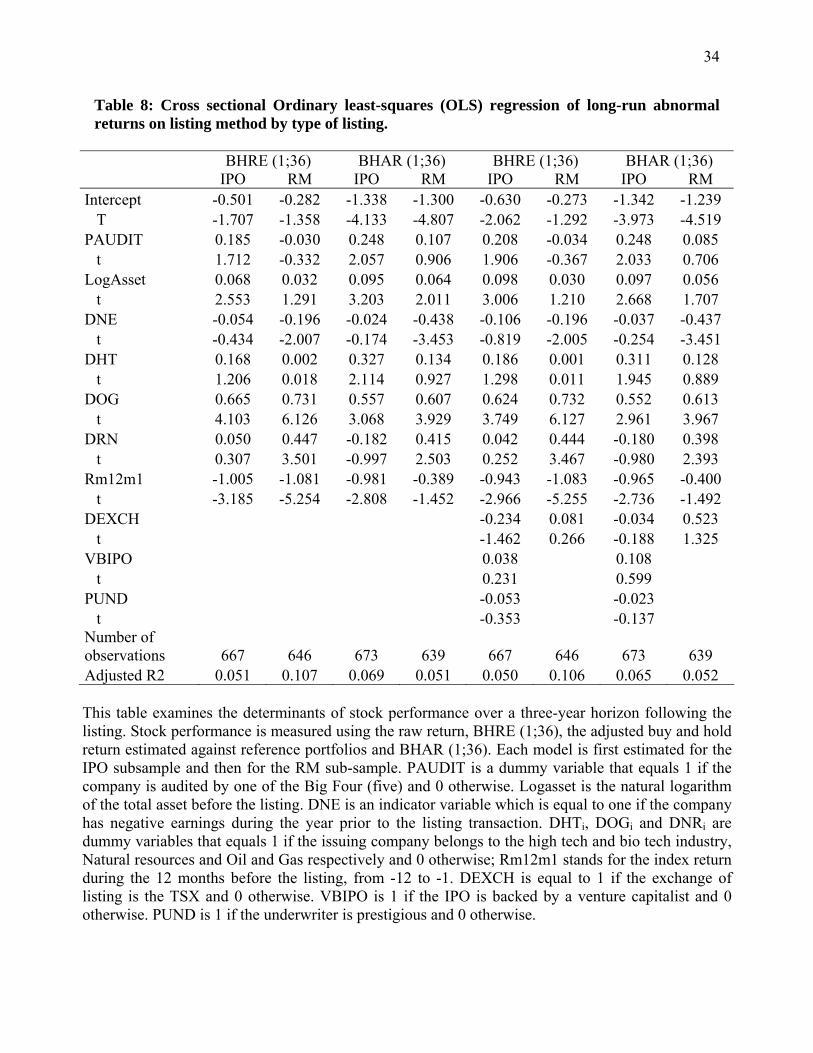
34
Table 8: Cross sectional Ordinary least-squares (OLS) regression of long-run abnormal returns on listing method by type of listing.
BHRE (1;36) BHAR (1;36) BHRE (1;36) BHAR (1;36) IPO RM IPO RM IPO RM IPO RM Intercept -0.501 -0.282 -1.338 -1.300 -0.630 -0.273 -1.342 -1.239 T -1.707 -1.358 -4.133 -4.807 -2.062 -1.292 -3.973 -4.519 PAUDIT 0.185 -0.030 0.248 0.107 0.208 -0.034 0.248 0.085 t 1.712 -0.332 2.057 0.906 1.906 -0.367 2.033 0.706 LogAsset 0.068 0.032 0.095 0.064 0.098 0.030 0.097 0.056 t 2.553 1.291 3.203 2.011 3.006 1.210 2.668 1.707 DNE -0.054 -0.196 -0.024 -0.438 -0.106 -0.196 -0.037 -0.437 t -0.434 -2.007 -0.174 -3.453 -0.819 -2.005 -0.254 -3.451 DHT 0.168 0.002 0.327 0.134 0.186 0.001 0.311 0.128 t 1.206 0.018 2.114 0.927 1.298 0.011 1.945 0.889 DOG 0.665 0.731 0.557 0.607 0.624 0.732 0.552 0.613 t 4.103 6.126 3.068 3.929 3.749 6.127 2.961 3.967 DRN 0.050 0.447 -0.182 0.415 0.042 0.444 -0.180 0.398 t 0.307 3.501 -0.997 2.503 0.252 3.467 -0.980 2.393 Rm12m1 -1.005 -1.081 -0.981 -0.389 -0.943 -1.083 -0.965 -0.400 t -3.185 -5.254 -2.808 -1.452 -2.966 -5.255 -2.736 -1.492 DEXCH -0.234 0.081 -0.034 0.523 t -1.462 0.266 -0.188 1.325 VBIPO 0.038 0.108 t 0.231 0.599 PUND -0.053 -0.023 t -0.353 -0.137 Number of observations 667 646 673 639 667 646 673 639 Adjusted R2 0.051 0.107 0.069 0.051 0.050 0.106 0.065 0.052
This table examines the determinants of stock performance over a three-year horizon following the listing. Stock performance is measured using the raw return, BHRE (1;36), the adjusted buy and hold return estimated against reference portfolios and BHAR (1;36). Each model is first estimated for the IPO subsample and then for the RM sub-sample. PAUDIT is a dummy variable that equals 1 if the company is audited by one of the Big Four (five) and 0 otherwise. Logasset is the natural logarithm of the total asset before the listing. DNE is an indicator variable which is equal to one if the company has negative earnings during the year prior to the listing transaction. DHTi, DOGi and DNRi are dummy variables that equals 1 if the issuing company belongs to the high tech and bio tech industry, Natural resources and Oil and Gas respectively and 0 otherwise; Rm12m1 stands for the index return during the 12 months before the listing, from -12 to -1. DEXCH is equal to 1 if the exchange of listing is the TSX and 0 otherwise. VBIPO is 1 if the IPO is backed by a venture capitalist and 0 otherwise. PUND is 1 if the underwriter is prestigious and 0 otherwise.

35
References Barberis, Nicholas and Ming Huang. 2007. Stocks as Lotteries: The Implications of Probability
Weighting for Security Prices. NBER Working Paper No 12936 Available at SSRN: http://ssrn.com/abstract=649421
Beatty, Randolph and Padma Kadiyala. 2003. Impact of the Penny Stock Reform Act of 1990 on the Initial Public Offering Market. Journal of Law and Economics 46:2, 517-541.
Berger, Robert. 2008. SPACs: An Alternative Way to Access the Public Markets. Journal of Applied Corporate Finance 20:3, 68-75.
Bhabra, Harjeet S and Richard H Pettway. 2003. IPO Prospectus Information and Subsequent Performance. The Financial Review 38:3, 369-397.
Bhojraj, Sanjeev and Charles M. C. Lee. 2002. Who is my Peer? A Valuation-Based Approach to the Selection of Comparable Firms. Journal of Accounting Research 40:2, 407-439.
Black, Bernard S. 2001. The Legal and Institutional Preconditions for Strong Securities Markets. UCLA Law Review 48, 781-858.
Black, Bernard S. and Vikramaditya S. Khanna. 2007. Can Corporate Governance Reforms Increase Firm Market Values? Event Study Evidence from India. Journal of Empirical Legal Studies 4:4, 749-796.
Black, Bernard S., Inessa Love and Andrei Rachinsky. 2006. Corporate governance indices and firms' market values: Time series evidence from Russia. Emerging Markets Review 7:4, 361-379.
Botosan, Christine A. 2006. Disclosure and the cost of capital: what do we know? Accounting & Business Research 36, 31-40.
Brock, Jason. 2000. Regulating the Reverse Takeover. University of Toronto Faculty of Law Review. 60:1, 1-19.
Bushee, Brian J. and Christian Leuz. 2005. Economic Consequences of SEC Disclosure Regulation: Evidence From the OTC Bulletin Board. Journal of Accounting and Economics 39:2, 233-264.
Campbell, Rutheford B. 2009. Pernicious Economic Rules: The SEC's Inglorious Role in Limiting Small Business's Access to Capital. Working Paper available ar SSRN : http://ssrn.com/abstract=1141946.
Carpentier, Cécile, Jean-François L'Her and Jean-Marc Suret. 2008. Stock Exchange Markets for New Ventures. Journal of Business Venturing In Press.
Carpentier, Cécile and Jean-Marc Suret. 2006. Bypassing the Financial Growth Cycle: Evidence from Capital Pool Companies. Journal of Business Venturing 21:1, 45-73.
Carter, Richard B., Frederick H. Dark and Ajai K. Singh. 1998. Underwriter Reputation, Initial Returns, and the Long-run Performance of IPO Stocks. The Journal of Finance 53:1, 285-311.
Chemmanur, Thomas J. and Imants Paeglis. 2005. Management Quality, Certification, and Initial Public Offerings. Journal of Financial Economics 76:2, 331-368.
Chiu, Hse-Yu. 2003. Can UK Small Businesses Obtain Growth Capital in the Public Equity Markets? - An Overview of the Shortcomings in UK and European Securities Regulation and Condiderations For Reform. Delaware Journal of Corporate Law 28:3, 933-977.
Cohn, Stuart R. 1999. Impact of Securities Laws on Developing Companies: Would the Wright Brothers Have Gotten off the Ground? Journal of Small and Emerging Business Law 3, 315-366.
36
DeAngelo, Harry, Linda DeAngelo and René Stulz. 2007. Fundamentals, Market Timing, and Seasoned Equity Offerings. NBER Working Paper No. W13285 Available at SSRN: http://ssrn.com/abstract=1002064
Derrien, François and Ambrus Kecskes. 2007. The Initial Public Offerings of Listed Firms. The Journal of Finance 62:1, 447-479.
Dong, Ming and Jean-Sebastien Michel. 2008. Does Investor Heterogeneity Lead to IPO Overvaluation? Working Paper, York University Available at SSRN:. http://ssrn.com/paper=1092122
Easley, David and Maureen O'Hara. 2004. Information and the Cost of Capital. The Journal of Finance 59:4, 1553-1583.
Fama, Eugene F. and Kenneth R. French. 1993. Common Risk Factors in the Returns on Stocks and Bonds. Journal of Financial Economics 33:1, 3-56.
Feldman, David N. 2006. Reverse Mergers : Taking a Company Public Without an IPO. New York, Bloomberg Press
Floros, Ioannis V. 2008. Two Essays on Alternative Mechanisms to Going Public. Ph.d Thesis, University of Pittsburgh
Friedman, Felice and Claire Grose. 2006. Promoting Access to Primary Equity Markets: A Legal and Regulatory Approach. World Bank Working Paper 3892
Gleason, Kimberly C., Leonard Rosenthal and Roy A. Wiggins. 2005. Backing into Being Public: an Exploratory Analysis of Reverse Takeovers. Journal of Corporate Finance 12:1, 54-79.
Gomes, Armando R and Gordon M Phillips. 2005. Why Do Public Firms Issue Private and Public Securities? NBER Working Paper. Available at SSRN: http://ssrn.com/abstract=686903
Gore, Angela K., Kevin Sachs and Charles Trzcinka. 2004. Financial Disclosure and Bond Insurance. The Journal of Law and Economics 47:1, 275-306.
Hail, Luzi and Christian Leuz. 2006. International Differences in the Cost of Equity Capital: Do Legal Institutions and Securities Regulation Matter? Journal of Accounting Research 44 3, 485-531.
Hanley, Kathleen W. and Gerard Hoberg. 2008. Strategic Disclosure and the Pricing of Initial Public Offerings. Working Paper, Available at SSRN: http://ssrn.com/abstract=1004518. http://ssrn.com/paper=1004518
Hartzell, Jay C., Jarl G. Kallberg and Crocker H. Liu. 2008. The Role of Corporate Governance in Initial Public Offerings: Evidence from Real Estate Investment Trusts. The Journal of Law and Economics 51:3, 539-562.
Healy, Paul M., Amy P. Hutton and Krishna G. Palepu. 1999. Stock Performance and Intermediation Changes Surrounding Sustained Increases in Disclosure. Contemporary Accounting Research 16:3, 485-520.
Healy, Paul M. and Krishna G. Palepu. 2001. Information Asymmetry, Corporate Disclosure, and the Capital Markets: A Review of the Empirical Disclosure Literature. Journal of Accounting and Economics 31:1-3, 405-440.
Heckman, James J. 1979. Sample Selection Bias as a Specification Error. Econometrica 47:1, 153-162.
Heyman, Derek K. 2007. From Blank Check to SPAC: The Regulator's Response to the Market, and the Market's Response to the Regulation. Entrepreneurial Business Law Journal 2:1, 531-552.

37
Hyytinen, Ari and Mika Pajarinen. 2005. External Finance, Firm Growth and the Benefits of Information Disclosure: Evidence from Finland. European Journal of Law and Economics 19:1, 69-93.
Jenkinson, Tim and Alexander Ljungqvist. 2001. Going Public: The theory and Evidence on How Companies Raise Equity Finance, Second edition. Oxford : Oxford University Press.
Kim, Moonchul and Jay R. Ritter. 1999. Valuing IPOs. Journal of Financial Economics 53:3, 409-437.
Knill, April M. and Nela T. Richardson. 2005. Help or Hindrance: An Examination of Securities Regulation and Firm Issuance around the World. Available at SSRN: http://ssrn.com/abstract=805331. http://ssrn.com/paper=805331
La Porta, Rafael, Florencio Lopez-De-Silanes and Andrei Shleifer. 2006. What Works in Securities Laws? The Journal of Finance 61:1, 1-32.
La Porta, Rafael, Florencio Lopez-De-Silanes, Andrei Shleifer and Robert Vishny. 2002. Investor Protection and Corporate Valuation. The Journal of Finance 57:3, 1147.
Lambert, Richard, Christian Leuz and Robert E. Verrecchia. 2007. Accounting Information, Disclosure, and the Cost of Capital. Journal of Accounting Research 45:2, 385-420.
Leuz, Christian and Robert E. Verrecchia. 2000. The Economic Consequences of Increased Disclosure. Journal of Accounting Research 38:3, 91-124.
Leuz, Christian and Peter Wysocki. 2006. Capital-Market Effects of Corporate Disclosures and Disclosure Regulation. Research Study, Commissioned by the Task Force to Modernize Securities Legislation in Canada.
Ljungqvist, Alexander P., Tim Jenkinson and William J. Wilhelm Jr. 2003. Global Integration in Primary Equity Markets: The Role of U.S. Banks and U.S. Investors. Review of Financial Studies 16:1, 63-99.
Macey, Jonathan R. and Maureen O'Hara. 2002. The Economics of Stock Exchange Listing Fees and Listing Requirements. Journal of Financial Intermediation 11:3, 297-319.
Miller, Edward M. 1977. Risk, Uncertainty, and Divergence of Opinions. The Journal of Finance 32:4, 1151-1168.
Morris, Stephen. 1996. Speculative Investor Behavior and Learning. Quarterly Journal of Economics 111:4, 1111-1133.
Purnanandam, Amiyatosh K. and Bhaskaran Swaminathan. 2004. Are IPOs Really Underpriced? Review of Financial Studies 17:3, 811-848.
Sjostrom, William K., Jr. 2008. The Truth About Reverse Mergers. Entrepreneurial Business Law Journal 2, Forthcoming.
Ström, Niklas. 2006. IPO Pricing–Does Prospectus Disclosure Matter? Working paper-Uppsala University.
Wu, YiLin. 2004. The Choice of Equity-Selling Mechanisms. Journal of Financial Economics 74, 93-119.