This paper focusses on the relation between external ... · nominal exchange rate ... In section 2...
20
econstor www.econstor.eu Der Open-Access-Publikationsserver der ZBW – Leibniz-Informationszentrum Wirtschaft The Open Access Publication Server of the ZBW – Leibniz Information Centre for Economics Standard-Nutzungsbedingungen: Die Dokumente auf EconStor dürfen zu eigenen wissenschaftlichen Zwecken und zum Privatgebrauch gespeichert und kopiert werden. Sie dürfen die Dokumente nicht für öffentliche oder kommerzielle Zwecke vervielfältigen, öffentlich ausstellen, öffentlich zugänglich machen, vertreiben oder anderweitig nutzen. Sofern die Verfasser die Dokumente unter Open-Content-Lizenzen (insbesondere CC-Lizenzen) zur Verfügung gestellt haben sollten, gelten abweichend von diesen Nutzungsbedingungen die in der dort genannten Lizenz gewährten Nutzungsrechte. Terms of use: Documents in EconStor may be saved and copied for your personal and scholarly purposes. You are not to copy documents for public or commercial purposes, to exhibit the documents publicly, to make them publicly available on the internet, or to distribute or otherwise use the documents in public. If the documents have been made available under an Open Content Licence (especially Creative Commons Licences), you may exercise further usage rights as specified in the indicated licence. zbw Leibniz-Informationszentrum Wirtschaft Leibniz Information Centre for Economics Kool, Clemens; de Regt, Erik; van Veen, Tom Working Paper Money Overhang, Credit Overhang and Financial Imbalances in the Euro Area CESifo Working Paper, No. 4476 Provided in Cooperation with: Ifo Institute – Leibniz Institute for Economic Research at the University of Munich Suggested Citation: Kool, Clemens; de Regt, Erik; van Veen, Tom (2013) : Money Overhang, Credit Overhang and Financial Imbalances in the Euro Area, CESifo Working Paper, No. 4476 This Version is available at: http://hdl.handle.net/10419/89745
-
Upload
nguyenkhuong -
Category
Documents
-
view
217 -
download
4
Transcript of This paper focusses on the relation between external ... · nominal exchange rate ... In section 2...

econstor www.econstor.eu
Der Open-Access-Publikationsserver der ZBW – Leibniz-Informationszentrum WirtschaftThe Open Access Publication Server of the ZBW – Leibniz Information Centre for Economics
Standard-Nutzungsbedingungen:
Die Dokumente auf EconStor dürfen zu eigenen wissenschaftlichenZwecken und zum Privatgebrauch gespeichert und kopiert werden.
Sie dürfen die Dokumente nicht für öffentliche oder kommerzielleZwecke vervielfältigen, öffentlich ausstellen, öffentlich zugänglichmachen, vertreiben oder anderweitig nutzen.
Sofern die Verfasser die Dokumente unter Open-Content-Lizenzen(insbesondere CC-Lizenzen) zur Verfügung gestellt haben sollten,gelten abweichend von diesen Nutzungsbedingungen die in der dortgenannten Lizenz gewährten Nutzungsrechte.
Terms of use:
Documents in EconStor may be saved and copied for yourpersonal and scholarly purposes.
You are not to copy documents for public or commercialpurposes, to exhibit the documents publicly, to make thempublicly available on the internet, or to distribute or otherwiseuse the documents in public.
If the documents have been made available under an OpenContent Licence (especially Creative Commons Licences), youmay exercise further usage rights as specified in the indicatedlicence.
zbw Leibniz-Informationszentrum WirtschaftLeibniz Information Centre for Economics
Kool, Clemens; de Regt, Erik; van Veen, Tom
Working Paper
Money Overhang, Credit Overhang and FinancialImbalances in the Euro Area
CESifo Working Paper, No. 4476
Provided in Cooperation with:Ifo Institute – Leibniz Institute for Economic Research at the University ofMunich
Suggested Citation: Kool, Clemens; de Regt, Erik; van Veen, Tom (2013) : Money Overhang,Credit Overhang and Financial Imbalances in the Euro Area, CESifo Working Paper, No. 4476
This Version is available at:http://hdl.handle.net/10419/89745
Money Overhang, Credit Overhang and Financial Imbalances in the Euro Area
Clemens Kool Erik de Regt
Tom van Veen
CESIFO WORKING PAPER NO. 4476 CATEGORY 7: MONETARY POLICY AND INTERNATIONAL FINANCE
NOVEMBER 2013
An electronic version of the paper may be downloaded • from the SSRN website: www.SSRN.com • from the RePEc website: www.RePEc.org
• from the CESifo website: Twww.CESifo-group.org/wp T
CESifo Working Paper No. 4476
Money Overhang, Credit Overhang and Financial Imbalances in the Euro Area
Abstract This paper focusses on the relation between external imbalances and domestic money and credit growth in the euro area. We compute money and credit overhang both for the euro area as a whole and for individual member countries. Our results show that both aggregate money and credit overhang have trend-like increased since the early 2000s. The increase in money overhang has been rather evenly spread over the member states but the increase in credit overhang has been unevenly spread and has mainly occurred in the GIIP. We apply panel analysis to detect temporal patterns between the developments in money overhang, credit overhang and external indebtedness. Looking at the groups of GIPS countries in isolation, net debt flows do play a significant role to explain money and credit overhang.
JEL-Code: E500.
Clemens Kool Utrecht School of Economics
Utrecht University The Netherlands
Erik de Regt School of Business and Economics
Maastricht University The Netherlands
Tom van Veen
School of Business and Economics Maastricht University
The Netherlands [email protected]

2
1. Introduction
Over the past decades, financial liberalization and globalization have increased at a tremendous
speed in the developed world. It resulted in enormous growth of cross-border financial flows and the
build-up of large gross stocks of foreign assets and liabilities. For some small open economies like the
Netherlands, Ireland and Switzerland, gross foreign asset positions became as large as 5 to 10 times
nominal GDP prior to the start of the global financial crisis in 2007. Net foreign asset positions grew
as well. On a global level, the increasing capital flows from Asia, and particularly China, to the United
States – and the corresponding current account disequilibria – started to attract increasing attention
in the 1990s. Bernanke (2006) used the global “savings glut” to explain low real interest rates, while
Krugman (2007) discussed the possibility of a future dollar collapse.2 Macro imbalances and net
capital flows played an important role within the euro area as well. Southern European countries
started to run increasing current account deficits after the introduction of the euro, while Northern
European countries did the opposite and exhibited persistently growing current account surpluses
(see Holinski, Kool and Muysken, 2012).
Interestingly, the growth of foreign assets and liabilities was either treated with benign neglect or
seen as a positive sign of global financial integration up till the start of the global financial crisis in
2008. Feldstein and Horioka (1980) provide an important argument for such attitude. In their view,
financial globalization breaks down borders between national capital markets and allows for better
financial integration, improves worldwide allocation of capital and a – desirable – disconnect
between domestic savings and investments. The consequent current account imbalances are no
problem in this view as well-functioning financial markets will price foreign assets and liabilities
efficiently and prevent the emergence of unsustainable foreign debt.3 Feldstein and Horioka (1980)
empirically demonstrate that domestic savings and investments were closely tied together in the
1960s and 1970s, suggesting only a limited degree of financial integration at the time. However,
more recent literature using the same methodology finds the correlation between domestic saving
and investment to decrease over time, especially since the early 1990s. In the late 1990s it even
becomes insignificantly different from zero (see for example Kool and Keijzer, 2009).
The 2008 global financial crisis and the subsequent sovereign debt crisis in the euro area have
destroyed the previous consensus that cross- country macroeconomic imbalances are innocuous or
even exclusively advantageous. Especially in the euro area, where the nominal exchange rate has
disappeared as potential adjustment mechanism, the academic and political debate on the limits to
macroeconomic divergence and the role of capital markets therein has strongly resurfaced. On the
political side this has resulted in the EU “Excessive Imbalances Procedure” to prevent and correct
macroeconomic imbalances in 2011.
In this paper, we focus on the financial dimension of macroeconomic imbalances in the euro area for
a number of reasons. First, the euro area comes very close to the ideal Feldstein-Horioka world. It
has free mobility of capital, well developed financial markets, a uniform banking license so as to
allow financial intermediaries to operate throughout the whole union, a common currency and a
2 See also Eichengreen (2007) and Ferguson (2008).
3 The Latin-American debt crisis of the 1980s, after a decade of Latin-American deficit financing by petro-dollars
via the American banking system, serves as an early example that non-sustainable foreign debt positions can arise in practice.
3
common monetary policy with a uniform money market interest rate. At the same time, individual
countries can still be identified accounting wise to measure and evaluate current account imbalances
and net capital flows. A more accommodative environment for the emergence of such imbalances
can hardly be envisaged. Second, the euro area suffers more from the absence of automatic
adjustment mechanisms than any other country or region in the world. The absence of an adjustable
nominal exchange rate – an advantage when it comes to facilitating financial integration – may
become a liability when divergent developments require significant adjustments. Alternative
adjustment channels such as labour mobility and fiscal transfers are less developed than in
comparable large areas (countries) with a common currency. Put differently, if emerging imbalances
can become unsustainable, the euro area would be likely to be the first to run into such
unsustainability. Third, over the last couple of years, there is increasing evidence that persistent
current account deficits in some euro area countries correspond to excessive credit creation and
asset and real estate booms. It links the discussion on external imbalances directly to that of money
and credit creation. Here, we note a disconcerting analogy in reasoning. We already noted that the
Feldstein-Horioka perspective provides an argument for ignoring gross and net capital flows - under
the implicit assumption that financial markets will prevent the build-up of unsustainable liabilities. In
central banking, the consensus over the past decades has been that money and credit creation can
be treated with similar benign neglect as long as inflation and inflation expectations remain stable
and firmly anchored. In our view, more attention needs to be paid to stocks and flows of financial
assets and liabilities to assess the stability and convergence of the euro area.4
In section 2 we provide a brief theoretical framework and embed our approach in the literature.
Here, we also define and discuss the concepts of money “overhang” and credit “overhang”, which
will take a central position in our analysis. In section 3, we compute money and credit overhang and
present their time paths for individual countries. In section 4 we go in more detail into credit
overhang and link it to net external debt flows as it captures an important dimension of the
asymmetric development within the euro area. Section 5 investigates temporal causality between
money overhang, credit overhang and net debt flows using Granger causality tests. Section 6
concludes.
2. Money, credit and overhang
Given the established links between external debt flows and domestic credit growth, we now turn to
a more general analysis of the drivers of money and credit growth. For simplicity, we start with the
closed economy case. In such a setting, the growth rates of broad money (M3) and bank lending are
traditionally strongly correlated as they measure the dominant developments on the liability and on
the asset side of the banking system respectively. Time deposits, demand deposits and short-term
savings deposits on the liability side of the bank balance sheet account for the large majority of broad
money M3 in the economy.5 Private bank lending is on the asset side of the bank balance sheet. At
the moment a bank grants a loan to a private agent, both its asset side (a new loan) and its liability
4 See Godley and Lavoie (2007) as one of the first strong proponents of the development of stock-flow
consistent models. 5 We choose to focus on M3 since it is the monetary aggregate most closely monitored by the ECB (ECB, 1999)
and other major central banks. For that reason, it also is the variable most often used in euro area money demand studies.
4
side (a new demand deposit) increase, leading to simultaneous growth of credit and money. While
this balance sheet approach illustrates the strong link between money and credit, it provides no
insights into the question where money and credit growth ultimately come from. For that, we need
an analysis of demand for and supply of money and credit.
We start with the (macro) money market and assume the economy is characterized by a stable
demand for money. Traditionally, this is represented by a simple (semi-log) linear relation between
real money balances (M/P), real income (Y) and the nominal interest rate (i):6
m–p = α0 + α1y + α2i (1)
Normally Y is proxied by real GDP. The choice of an appropriate nominal interest rate on a broad
monetary aggregate as M3 is less unambiguous. Theoretically, the long term nominal interest rate
captures the opportunity cost of holding money, which would lead to a negative α2. If a short rate
would be included, it could be seen as a proxy for the “own” rate of return on holding money and the
interest rate effect would be positive.7
Money supply can be under the control of the monetary authorities, the central bank. Using a variety
of instruments the central bank can determine the amount of base money – currency and bank
reserves – in the economy which feeds through into the actual level of M3. However, the ECB and
the other major central banks in the world have abstained from formulating or targeting explicit
money supply targets in the past decades. Instead, they have followed interest rate policies to reach
their prime goal of low and stable long run inflation (expectations). As a result, the quantity of M3 in
circulation has become mostly endogenous and has been “accommodated” by the Central Banks.
Consequently, the actual development of monetary aggregates has become an almost neglected
indicator.
Note that at its inception, the ECB did not have the intention to ignore the development of monetary
aggregates. Its two pillar strategy was a balanced approach to control inflation. In one pillar, a broad
set of future inflationary indicators was used to assess current and future monetary policy, in the
other pillar the actual development of M3 growth compared to the reference – equilibrium – value of
4.5 percent served the same purpose.8 Nevertheless, actual M3 structurally grew faster than 4.5
percent per year in the first years of ECB operation but without noticeable effects on inflation or
inflationary expectations. It definitely contributed to the ECB decision to lower the weight of the
monetary pillar in its decision-making process.
Why did M3 grew faster than the ECB thought it should in equilibrium? Possibly, an instable
macroeconomic money demand function (1) may have been automatically accommodated by the
banking system and the ECB.9 Over the past decade, a substantial amount of empirical literature has
6 Lowercase letters m, p, and y refer to logarithms, i is the percentage nominal interest rate. Coefficients are
defined to be positive 7 See also Calza, Gerdesmeier and Levy (2001). Empirically, many specifications have been used including both
short rates and long rates individually or jointly and the spread between them. 8 Early empirical evidence provided supportive evidence of a stable Euro area money demand. See, for
instance, Coenen and Vega (2001), Dedola, Gaiotti and Silipo (2001) and Brand and Cassola (2004). 9 Alternatively, the banking system itself may have been the driver of excess money – and credit – creation,
with the private sector passively absorbing this extra supply. The latter is often referred to as the buffer stock approach.
Without an elaborate model of money demand and supply including a role for the banking sector it is
5
emerged addressing potential money demand instabilities in the euro area. Setzer and Wolff (2013)
estimate a long-run co-integrating money demand function for the euro area for a time period
ending in 2000 and show it does not predict adequately out-of-sample.10 More generally, they report
that their literature search documents a break-down of the co-integrating relationships as well as
instabilities in long-run and short-run parameters of the model. Many attempts have been made to
use more elaborate money demand specifications to enhance econometric stability. Greiber and
Setzer (2007), Boone and van den Noord (2008), Dreger and Wolters (2010) and Avouyi-Dovi et al.
(2011) for example point to the important role of wealth effects and include equity or real estate
prices. De Santis, Favero and Roffia (2013) claim that money demand becomes stable again once
international portfolio allocation effects are taken into account, Ferrero, Nobili and Passiglia (2010)
provide a role for financial innovations, and Greiber and Lemke (2005) and Carstensen (2006) use
explicit indicators of precautionary demand in times of high macroeconomic uncertainty.
Econometric attempts to find a stable money demand function include for instance the relaxation of
the short run homogeneity between money and prices or incorporating structural breaks in
parameters such as the income elasticity of money demand (see Dreger and Wolters, 2010).11
Looking at it this way, the debate of whether the demand for money is stable or unstable becomes
highly semantic. Setzer and Wolff (2013) are skeptic about attempts to force money demand to be
stable by including a whole battery of new explanatory variables. They argue that “augmented
money demand functions typically have a lower theoretical foundation and there is little evidence of
structural changes in the euro area economy to suggest that the relative attractiveness of holding
money as opposed to other financial instruments has been fundamentally altered in recent years”.
Whatever the ultimate causes of high money growth, the result may signal excess liquidity in the
economy. Therefore, we take the evidence in the empirical literature as an important signal to pay
attention to the development of M3 since the start of the euro.
In the money demand literature, several measures of excess liquidity or money overhang have been
developed. Setzer and Wolff (2013) label the difference between the actually observed level of M3
and their out-of-sample M3 prediction “monetary overhang”. They report a cumulative overhang in
the euro area of about 25 percent in 2008.12 Dreger and Wolters (2010) estimate an error-correction
model (ECM) for their total sample and take the error correction term as a measure of excess (or
under-) liquidity. Carstensen, Hagen, Hossfeld and Neaves (2009) use a similar approach both for the
impossible to determine where the excess money growth in the end comes from. Such model is beyond the scope of this article. 10
In addition, they show that money demand estimation for individual countries in deviation from the euro area average does not yield evidence of money demand instability, see also Nautz and Rondorff (2011) for a similar result. Roughly speaking, this suggests excess liquidity was spread more or less homogeneously across the euro area. If so, it is unlikely to be the main source of asymmetric developments between countries. 11
Generally speaking, empirical results show that the estimated income elasticity of money demand strongly increases the more recent years are included into the sample. 12
Historically, the term money overhang was used for forced money holdings in centrally planned (communist) economies. People had to hold money balances and could not buy anything with it. Hence the money was “put under the pillow” and withdrawn from the circular flow: a perfect example of hoarding. Once the economy was liberalized this excess supply of money entered the market and caused excess demand on the goods market. The East-German and the Russian cases in the 1990s are good examples. Here, a different meaning is attached to the term.

6
four largest EMU countries individually and for the EMU-4 aggregate. They compute country-specific
money overhang using both estimated aggregate money demand parameters and estimated
individual money demand parameters. A related but somewhat different approach is chosen by
Avouyi-Dovi, Drumetz and Sahuc (2012). In an ECM framework, they do not use the actual but the
equilibrium – trend – values of the money demand determinants in the error correction term to
estimate excess liquidity, which they label the “real money gap”. Alternatively, De Santis et al. (2013)
estimate a co-integrated VAR and solve it forward for the trend value of real money balances at
horizons of 1, 4 and 40 quarters. The difference between current real money and the future trend
values then is taken as an indicator of excess liquidity.
In the remainder of this paper, we follow the approach of Setzer and Wolff (2013). However, instead
of estimating a long-run money demand function for the euro area ourselves, we take plausible
parameter values for the income elasticity and the semi-interest rate elasticity from the empirical
literature and then define monetary overhang (ohm) as
ohm = m– p –( a0 + a1y + a2i) (2)
where coefficients ai (for i=1, 2) are imputed values for the theoretical parameters αi in equation (1).
The difference between the actual money supply and the calculated money demand is the money
overhang in the period under consideration. No theoretical basis is available for the choice of a0 . We
simply assume that in the period 1999-2001 the average monetary overhang was zero in each
country. This pins down a0 and allows the computation of the money overhang in the sample from
2001 onward. This approach has the advantage that it allows to analyse the development of money
(and credit) overhang in relation to the start of the euro area. However, it goes at the expense of
ignoring any cross-country divergence in monetary and lending conditions that may have arisen prior
to the 1999-2001 period. Therefore, caution has to be applied in an absolute interpretation of the
overhang results.
A similar exercise can be done for credit overhang. The literature on demand and supply for real
credit (L/P) for the euro area is more limited than the money demand literature. Typically, credit
demand depends on similar determinants as money demand. Both income – or preferably expected
future income or expected future profit opportunities – and the interest rate – in the form of lending
costs – play a role. Theoretically, bank credit supply is normally thought to depend on bank-specific
characteristics such as bank size, solvency – capitalization – and liquidity as well as on client-specific
characteristics such as net worth, available collateral, type of activity etc. Most of the empirical
literature focuses on the estimation of the credit channel of monetary policy and the moderating
effect of bank-specific characteristics on lending, see for instance Angeloni et al. (2003) for an
application to the euro area. Calza, Gärtner and Sousa (2003) and Calza, Manrique and Sousa (2006)
estimate euro area wide private bank lending along similar lines as the typical money demand
literature, using a basic specification as given in equation (3).
L–p = 0 + 1y + 2i (3)
Calza et al. (2006) actually compute a “loan overhang” variable as the error correction term from a
co-integration regression. Note the similarity with the approaches described above for calculating
excess liquidity measures. In our paper, we define credit overhang similar to our monetary overhang
variable. Using Calza et al. (2006) we take plausible values for the income and interest (semi-)
7
elasticities of credit demand and compute the difference between actual and computed real credit
levels as a measure of excess credit, that is, credit overhang (ohc) is defined in the following way
ohc = l – p – (0 +1y + 2i) (4)
Again, we take the period 1999-2001 as a benchmark where we assume credit overhang to be zero
on average for each country to determine the appropriate value for 0. We now turn to the empirical
implementation of our approach to money and credit overhang.
3. Money and Credit overhang in the euro area 1999-2011
To calibrate money and credit overhang as defined in equations (2) and (4), we use income
elasticities and interest rate semi-elasticities within the usual parameter range. For the pre-euro
years, estimates of the income elasticity 1 vary from 1 (Kontolemis, 2002) to 1.4 (Golinelli and
Pastorello, 2000), with most studies finding income elasticities somewhere in the middle of this
range. More recent studies find higher elasticities, with De Sanctis et al. (2013) even reporting an
elasticity of 1.9. Seltzer and Wolff (2013) find income elasticities from 1.0 to 1.6, which is more in line
with the 1.3 of Dreger and Wolters (2010) or 1.4 of Nautz and Rondorf (2011). Accordingly we set 1
= 1.3, somewhere in the middle of the reported range. Estimates of the interest rate semi-elasticity
2 show a wider variation, depending on the choice of the interest rate variable, period, country
sample and estimation techniques. For the long-rates that we will use, it varies from –0 to –3 in
Dreger and Wolters (2010). Most estimates are below one in absolute size though. Accordingly we
set 2 = –0.5.
The empirical literature about the credit demand is scarcer. In general, both the income elasticity
and the interest rate semi-elasticity are higher (in absolute value) than in the money demand
literature. Accordingly, we set the income elasticity for credit, 1, at 1.5, and the corresponding
interest rate semi-elasticity of 2 at -2.5.13
As stated before, the 11 country-specific constants have been determined such that average
overhang during the early years of the euro (1999-2001) is zero. Log money overhang (ohm) in each
country (j) over time (t) is thus given as:
( ) (5)
The country-specific constants are positively correlated with inverse velocity (M3/Y) at the start
of the euro. Log credit overhang (ohc) is defined analogously as:
( ) (6)
The country-specific constants are positively correlated with the loan to GDP ratios in 1999-2001.
13
We have investigated how sensitive the results are for the chosen parameters. Varying these elasticities within a plausible range leaves our results qualitatively unchanged.
8
We use equations (5) and (6) to calculate the aggregate money and credit overhang in the 11 euro
countries. It can be easily shown that the aggregate log overhang is a generalized weighted average
of the underlying country-level overhang. To be more specific:
∑
(7)
where the weights wjtt are the share of the countries' real money balances in total real money
balances in year t. Mutatis mutandis, a similar formula holds for aggregate log credit overhang.
We use quarterly data series for the period since the introduction of the euro in 1999 until the end of
2011. We include the founding members of the euro, with the exception of Luxembourg, but include
Greece that joined the euro in 2001. In line with the target variable of the ECB, we use M3 as the
relevant money aggregate, averaging the monthly data in each quarter. Credit (bank lending) is
measured by private sector loans L, excluding the financial sector. Money, credit, nominal and real
GDP, as a proxy for income Y, are taken from the ECB database. The corresponding GDP deflator
(2005=1) is the ratio of nominal and real GDP. For the interest rate, i we use the 10 year government
yields series published by Eurostat, again taking averages of the monthly rates.
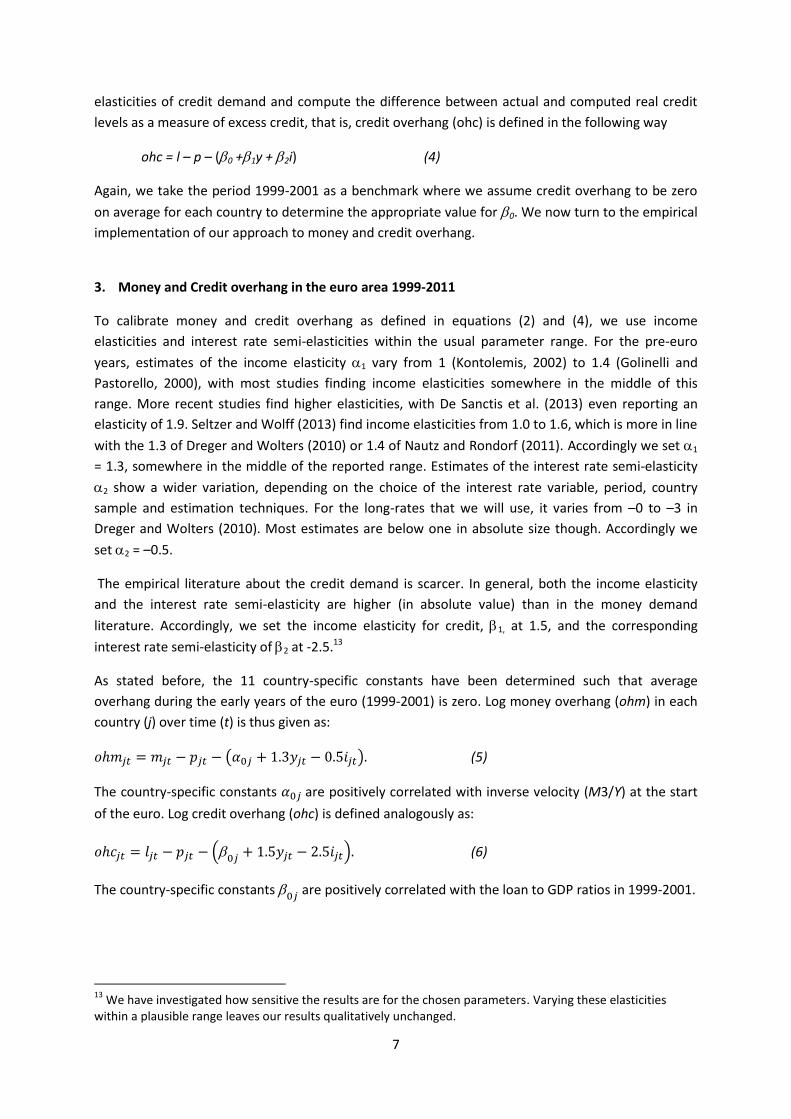
Figure 1 shows the results of our calibration and depicts the corresponding aggregate log money and
log credit overhang. To focus on the long-run development of the series, we follow the suggestion by
Avouyi-Dovi et al. ( 2012) to use Hodrick-Prescott filtered real income and interest rates in the graphs
below when calculating overhang.
In line with the recent literature, we find that both money and credit overhang have increased since
the introduction of the euro, at least until the financial crisis hit the euro after the fall of Lehman
Brothers in September 2008. Thereafter, money and credit overhang changed trend and decreased
somewhat. Nevertheless, the remaining estimated overhang in 2011 was still substantial for both
money (30 percent) and credit (20 percent). The quarterly growth rate of money overhang was on
average 1% in the period (2002q1, 2008q4). Credit overhang increased as well, but at a somewhat
lower rate of 0.7% per quarter over the same period. We also notice a stronger increase since the
beginning of 2006, and drops both in and after the financial crisis. The graph does support the strong
relation between (excessive) money and credit growth on the aggregate euro area level though.
Before, we already referred to the emergence of macroeconomic imbalances and economic
divergences within the euro area. For that reason, we now turn to a disaggregated, country-specific
analysis of money and credit overhang. A priori, we expect the overhang to be mainly concentrated
in the Southern euro area countries.
9
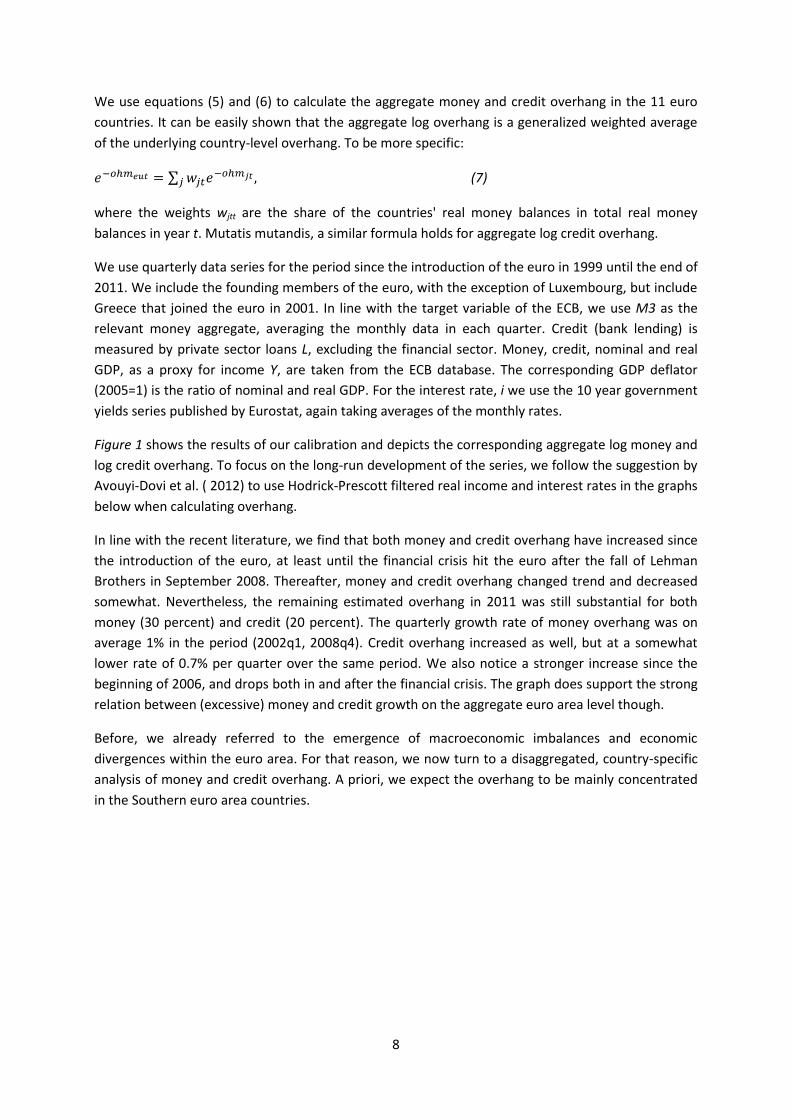
In Figure 2 we compare the development of money overhang in the various countries. For
comparison, we also include the aggregate money overhang (Euro money overhang). Although there
are differences between countries, the country-specific money overhang follows fairly closely the
aggregate overhang figures. Alternatively, money overhang is more or less evenly distributed across
the euro area and apparently most of the money overhang is an aggregate euro area phenomenon.
This is consistent with earlier evidence that, although aggregate money demand seems to have
shifted, country-specific money demand functions in deviation from the aggregate are stable.14 Main
exceptions are Portugal and Greece who appear to have significantly less monetary overhang than is
the case for the euro area as a whole. In Italy, there is a so far unexplained upward jump in monetary
overhang in the middle of the sample period.
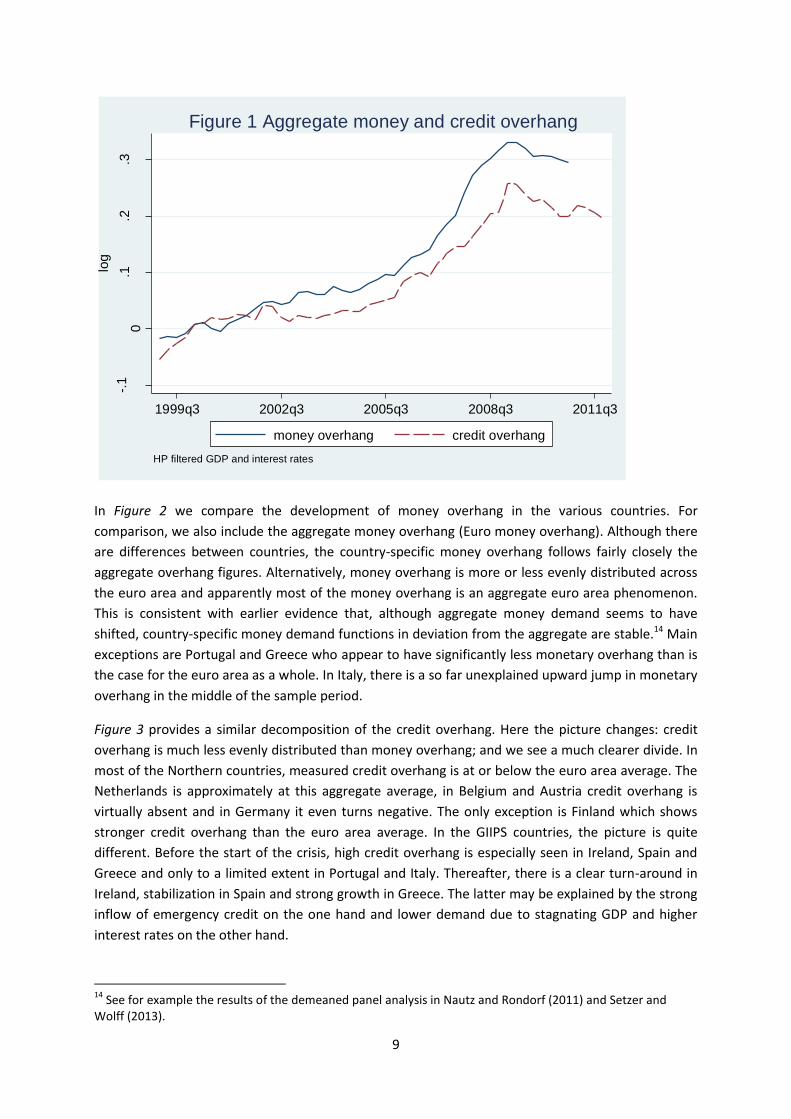
Figure 3 provides a similar decomposition of the credit overhang. Here the picture changes: credit
overhang is much less evenly distributed than money overhang; and we see a much clearer divide. In
most of the Northern countries, measured credit overhang is at or below the euro area average. The
Netherlands is approximately at this aggregate average, in Belgium and Austria credit overhang is
virtually absent and in Germany it even turns negative. The only exception is Finland which shows
stronger credit overhang than the euro area average. In the GIIPS countries, the picture is quite
different. Before the start of the crisis, high credit overhang is especially seen in Ireland, Spain and
Greece and only to a limited extent in Portugal and Italy. Thereafter, there is a clear turn-around in
Ireland, stabilization in Spain and strong growth in Greece. The latter may be explained by the strong
inflow of emergency credit on the one hand and lower demand due to stagnating GDP and higher
interest rates on the other hand.
14
See for example the results of the demeaned panel analysis in Nautz and Rondorf (2011) and Setzer and Wolff (2013).
-.1
0.1
.2.3
log
1999q3 2002q3 2005q3 2008q3 2011q3
money overhang credit overhang
HP filtered GDP and interest rates
Figure 1 Aggregate money and credit overhang

10
-.2
0.2
.4.6
-.2
0.2
.4.6
-.2
0.2
.4.6
1999q3 2006q1 2012q3
1999q3 2006q1 2012q31999q3 2006q1 2012q31999q3 2006q1 2012q3
Austria Belgium Finland France
Germany Greece Ireland Italy
Netherlands Portugal Spain
Money overhang Euro money overhang
log
HP filtered real GDP and Interest rates
Figure 2 Money overhang
-.5
0.5
1-.
50
.51
-.5
0.5
1
1999q3 2005q3 2011q3
1999q3 2005q3 2011q31999q3 2005q3 2011q31999q3 2005q3 2011q3
Austria Belgium Finland France
Germany Greece Ireland Italy
Netherlands Portugal Spain
Credit overhang Euro credit overhang
log
HP filtered real GDP and interest rates
Figure 3 Credit overhang
11
Overall, the hypothesis that credit growth across euro area countries has been quite asymmetric,
with growth in the Southern countries strongly surpassing that in the Northern members, is
confirmed in these data. Summarizing our results, we report four stylized facts:
1. Aggregate money overhang has increased in the euro area.
2. The increase in money overhang has been evenly spread over the member states.
3. Aggregate credit overhang has increased in the euro area, roughly in line with aggregate
money overhang.
4. The increase in credit overhang has been unevenly spread over the member states and has
mainly occurred in the GIIPS countries.
These stylized facts suggest that on a country-level a disconnect may emerge between money and
credit growth. It points at potentially different transmission mechanisms at work. For an explanation,
we turn to the link between national credit overhang and external – current account – imbalances.
First, we note the fact that the countries in our sample that show large credit overhang are the same
countries that Holinski et. al (2012) identify as having large current account deficits. Second, our
stylized facts are consistent with the evidence in Borio and Disyatat (2011) and Lane and McQuade
(2013) that domestic private credit growth depends positively on external net debt flows. These
cross-border loans may have created excess liquidity in the banking sector in the deficit countries
and caused an increase in their private bank lending. In the next section, we explicitly turn to this
issue.
4. Credit overhang and current account balances.
Holinski et al. (2012) were among the first to point out the growing macroeconomic divergence
between Southern (including Ireland) and Northern euro area members as witnessed by their
opposite cumulative current account developments. Their evidence convincingly demonstrates that
for most Southern countries – Greece excepted – private sector behaviour was driving the large and
growing current account deficits. This behaviour was characterized by lower saving rates and higher
investment rates compared to the Northern economies of the euro area. At the same time, many of
these deficit countries experienced strong expansion of private credit. Particularly Spain and Ireland
witnessed a massive construction and real estate boom that came to an end with the onset of the
global financial crisis. Additional evidence is given by van Ewijk (2013). She shows that financial
integration (measured by gross and net capital flows) has had a positive effect on the output gap and
on the change in housing wealth for the members of the euro zone over the period 1999-2010.
Obviously, it is too much of a short-cut to argue that the observed current account imbalances
“caused” – or possibly fuelled – excessive credit growth and real estate booms in Southern euro
member countries. Current account deficits can be funded in various ways, including foreign direct
investments which do not necessarily increase private bank credit. But if current account deficits are
funded by an increase in external debt, then deposits are shifted from the banks in the surplus
country to the banks in the deficit country and this creates opportunities for the banks in the deficit
countries to increase bank lending. Thus, in relation to section 2, in an open economy that operates

12
on an integrated capital market, there is an additional source of money creation: foreign deposits.
Borio and Disyatat (2011) and Lane and McQuade (2013) empirically show that net external debt
flows do have a strong impact on domestic credit growth. Using net debt excludes FDI and portfolio
equity from the overall capital flows that fund the current account.15 That is, to the extent that the
current account deficit is largely financed with external credit there actually is a causal or facilitating
link.16 In our own analysis, we will therefore not use (cumulative) current account imbalances but
(cumulative) net debt flows. The hypothesis we intend to investigate is that domestic credit is mostly
fuelled by foreign debt flows. If the hypothesis is valid, we expect a (close) relation between
cumulative net debt flows and credit overhang.
We use the recent IMF database of Bluedorn et al. (2013) for our analysis. The availability of these
data allows us to investigate both overall capital flows and debt flows in relation to credit overhang.
Both from the graphs and the correlation analyses, we conclude that net debt flows and credit
overhang are indeed closely correlated, see Figure 4.17 Ireland is an outlier and the data analysis
resulted in very counterintuitive results. Therefore we have not included Ireland in the remainder.
15
It also excludes derivatives. Cross country derivative trade is a problem in all analyses. The bright side is that net derivative positions are typically small. Our measure includes both official flows (mostly small) and non-bank private flows. 16
Related to this, Cetorelli and Goldberg (2011, 2012a, b) show the important role of the banking sector as the facilitator and source of excessive credit growth as well as the transmitter of financial shocks across countries. 17
In the remainder of the analysis, we focus on net debt flows and omit overall capital flows, because the former can both theoretically and empirically be linked more directly to bank lending. Correlations between the change in credit overhang and the change in net capital and net debt flows are 0.26 and 0.37, respectively.
-.5
0.5
11
.5-.
50
.51
1.5
-.5
0.5
11
.5
1999q1 2005q3 2012q11999q1 2005q3 2012q1
1999q1 2005q3 2012q11999q1 2005q3 2012q1
Austria Belgium Finland France
Germany Greece Italy Netherlands
Portugal Spain
Credit overhang Cumulative net debt flows (% annualised GDP)
date
HP filtered real GDP and interest rates
Figure 4 Credit overhang and cumulative net debt flows

13
Figure 4 shows clearly the close relation between credit overhang and (cumulative) net debt flows.
Greece, Italy, Portugal and Spain show increasing net debt levels, while Belgium and Germany show a
decreasing net debt flow. Austria and the Netherlands show low and stable levels of debt flows and
credit overhang. The only country for which cumulative net debt flows and domestic credit overhang
strongly diverge is, again, Finland.
5. Granger causality tests
The stylized facts we have disclosed in the previous two sections clearly warrant both a full-fledged
empirical analysis of their underlying dynamics and the development of an underlying theoretical
model. Both are clearly beyond the scope of this paper. However, to get a first impression of the –
temporal – causality between our 3 variables of interest, money overhang, credit overhang and
cumulative net debt flows (% GDP), we now turn to Granger causality tests. The global financial crisis
has led to a series of unconventional monetary policies of the ECB to create liquidity as well as to
prevent the default of large banks and euro area governments. Potentially, this type of ad hoc
measures can have a significant impact on the relation between money, credit and external debt
developments. For that reason, we limit the Granger causality analysis to the period 2000-2008.
In addition, there are some econometric caveats which warrant caution in the interpretation of our
results. We are aware of the fact that Granger causality in potentially heterogeneous panels is
fraught with difficulties, see e.g. Erdil and Yetkiner (2009) and Hood, Kidd and Morris (2008). These
are related amongst others to non-stationarity of the data, cross-sectional dependence and
heterogeneity of the parameters. To avoid potential spurious correlation due to non-stationarity, we
first difference the data. Given the limited number of observations, we restrict the model to 4 lags of
the dependent and the independent variables. Empirically, the last lag was always found to be
significant. We use three different estimation techniques: Standard fixed effects (FE), fixed effects on
the cross-section demeaned variables (DM) to correct for potential cross-sectional dependence, and
finally a Mean Group estimator (MG), averaging the underlying estimates of each of the 10 countries.
For Granger causality we then tested for the joint significance of the 4 lags of each independent
variable. Table 1 shows the results of the test.
Table 1 Granger causality tests (2000q1-2008q4, 4 lags, Ireland excluded) Money overhang Credit overhang Net debt flows FE DM MG FE DM MG FE DM MG
ohm 0.021* 0.001** 0.032* 0.432 0.416 0.366
ohc 0.000** 0.000** 0.607 0.093 0.323 0.036*
ndebt 0.097 0.007** 0.139 0.735 0.108 0.531 p-values of restrictions on all 4 lags of the independent variables, * 5%, ** 1% significance Estimation methods: FE, Homogeneous Fixed effect; DM Demeaned Fixed effects; MG Mean Group.
Table 1 suggests that there is bi-directional Granger causality between changes in money and credit
overhang, although for the Mean Group estimates credit overhang does not-Granger cause money
overhang. Most tests suggest that there is no Granger causality between net debt inflow (% GDP) and
money or credit overhang and the reverse. At first sight, the results appear to contradict earlier
evidence by Borio and Disyatat (2011) and Lane and McQuade (2013), as well as the graphical

14
evidence from figure 4 above. A possible explanation is that cross-country heterogeneity in our
sample of eleven countries prevents the detection of significant patterns. For this reason, we redo
the Granger causality analysis for the 4 GIPS countries plus Germany. Table 2 contains the results.
Overall, the significance of the tests strongly increases. We find significant bidirectional causality
between each pair of variables. It suggests complex dynamics between domestic money and credit
growth and net external debt flows within the euro area. The results definitely call for further
research focusing on the underlying links between money overhang, credit overhang and
international debt (capital) flows.
Table 2 Granger causality tests (2000q1-2008q4, 4 lags, Germany and GIPS) Money overhang Credit overhang Net debt flows FE DM MG FE DM MG FE DM MG
ohm 0.000** 0.000** 0.007** 0.502 0.022* 0.000**
ohc 0.001** 0.005** 0.000** 0.022* 0.083 0.000**
ndebt 0.028* 0.000** 0.000** 0.015* 0.000** 0.000** p-values of restrictions on all 4 lags of the independent variables, * 5%, ** 1% significance Estimation methods: FE, Homogeneous Fixed effect; DM Demeaned Fixed effects; MG Mean Group.
6. Conclusion
Over the last couple of years, there is increasing evidence that persistent current account deficits in
some euro area countries in the run-up to the financial crisis may have contributed to economic
fragility and, ultimately, to the on-going euro-crisis. The benign neglect with which current account
imbalances were perceived in previous decades now appears misguided in the context of a monetary
union. In addition, there is evidence that these external imbalances correspond to excessive
domestic credit creation and asset and real estate booms. It links the discussion on external
imbalances directly to that of money and credit creation.
M3 money growth has structurally exceeded the ECB reference points of 4.5 percent since the
inception of the euro area. As a result, the ECB has reduced the weight it attaches to money growth
as an indicator of excessive liquidity and potential future inflation pressures. Instead, its interest rate
policy has become more and more oriented towards low and stable inflation in the long run and the
development of M3 has received less attention than it used to. In our view, the neglect of attention
for monetary aggregates is as misguided as is the neglect of external imbalances. No consensus exists
as yet on the reasons for the above trend liquidity growth. Both the private sector (money demand)
and the banking sector (money supply) may have played a role here. A large body of empirical work
on money demand in the euro area suggests increasing instability on an aggregate level, but less so
per individual country. Evidence on bank lending growth is less voluminous. However, the available
evidence suggests divergence of credit growth patterns across the euro area. Theoretically, broad
money growth and private credit (bank lending) growth are strongly tied through bank balance
sheets. However, the more banks can fund themselves externally in the interbank market or the
international bond markets, the weaker the link between domestic money and credit growth is
expected to be.
15
In this paper, we contribute to the topic and provide evidence on the admittedly complex relation
between domestic money and credit growth and external imbalances, in particular net debt flows.
First we compute money and credit overhang as cumulative deviations of money and credit levels
from an hypothesized money and credit demand function, respectively. We do this both for the euro
area as a whole and for individual member countries. Our results show four stylized facts. First,
aggregate money overhang has trend-like increased in the euro area since the early 2000s and is still
substantial, despite a modest turn-around after the start of the financial crisis. Second, the increase
in money overhang has been rather evenly spread over the member states. Third, aggregate credit
overhang has increased in the euro area, roughly in line with aggregate money overhang, and shows
a similar moderation after 2007. Fourth, the increase in credit overhang has been unevenly spread in
the member states and has mainly occurred in the GIIPS countries.
In the subsequent step, we measure each country’s net debt funding and show graphically that on a
country-by-country basis there is strong co-movement between credit overhang and net debt flows.
In particular, Southern European countries display large credit overhang in line with cumulative
external borrowing, while Northern European countries have small or no credit overhang and are
cumulative external net lenders.
In the final step, we apply panel analysis to detect temporal patterns between the developments in
money overhang, credit overhang and external indebtedness, using Granger causality tests over the
period 2000-2008. For the total group of countries considered, there is evidence of bidirectional
dynamics between money and credit, but no supportive evidence for the role of external debt flows.
Looking at the groups of GIPS countries in isolation, the significance of all bidirectional links increases
and net debt flows do play a significant role. Our results confirm the importance of the links between
money, credit and external debt. They also suggest asymmetries in these links across different euro
area members. More theoretical and empirical research is required to uncover the underlying
fundamental mechanisms.
16
References
Angeloni I., A. Kashyap, B. Mojon and D. Terlizzese (2003), Monetary Transmission in the Euro Area :
Where do we Stand? In I. Angeloni , A. Kashyap & B. Mojon (Eds.), Monetary Policy Transmission in
the Euro Area, Cambridge University press, pp. 383-412.
Avouyi-Dovi, S., F. Drumetz and J-.G. Sahuc (2012), The Money Demand Function for the Euro Area:
Some Empirical Evidence, Bulletin of Economic Research, 64 (3), pp. 377-392.
Bernanke, B. (2006), Remarks by Governor Ben S. Bernanke at the Sandridge Lecture, Virginia
Association of Economics, Richmond, Virginia.
Bluedorn, J., R. Duttagupta, J. Guajardo and P. Topalova (2013), Capital Flows are Fickle: Anytime,
Anywhere, IMF Working paper 13-183.
Boone, L. and P. Noord (2008), Wealth effects on Money Demand in the Euro Area, Empirical
Economics, 34 (3), pp. 525-536.
Borio, C. and Disyatat P. (2011), Global Imbalances and the Financial Crisis: Link or no Link? Working
Paper 346, Bank for International Settlements, Basle.
Brand, C. and N. Cassola (2004), A Money Demand System for Euro Area M3, Applied Economics, 36,
pp. 817-838.
Calza, A., D. Gerdesmeier and J. Levy (2001), Euro Area Money Demand: Measuring the Opportunity
Costs Appropriately, IMF Working Paper 01/179.
Calza, A., C. Gartner and J. Sousa (2003), Modeling the Demand for Loans to the Private Sector in the
Euro Area, Applied Economics, 35 (1), pp. 107-117.
Calza, A., M. Manrique and J. Sousa (2006), Credit in the Euro Area: an Empirical Investigation using
Aggregate Data, The Quarterly Review of Economics and Finance, 46, pp. 211-226.
Carstensen, K. (2006), Stock Market Downswings and the Stability of European Monetary Union
Money Demand, Journal of Business and Economics Statistics, 24(4): 395-402.
Carstensen, K., J. Hagen, O. Hossfeld and A.S. Neaves (2009), Money Demand Stability and Inflation
Prediction in the Four Largest EMU Countries, Scottish Journal of Political Economy, vol. 56 (1), pp.
73-93.
Cetorelli, N. and L.S. Goldberg (2011). Global Banks and International Shock Transmission: Evidence
from the Crisis. IMF Economic Review, 59, pp. 41-76.
Cetorelli, N. and L.S. Goldberg (2012a), Banking Globalization and Monetary Transmission, The
Journal of Finance, 67 (5), pp. 1811-1843.
Cetorelli, N. and L.S. Goldberg (2012b), Follow the Money: Quantifying Domestic Effects of Foreign
Bank Shocks in the Great Recession. National Bureau of Economic Research, Working Paper 17873.
Coenen, G. and J-L Vega (2001), The Demand for M3 in the Euro area, Journal of Applied
Econometrics, 16 (6), pp. 727-748.

17
Dedola, L., E. Gaiotti and L. Silipo (2001), Money Demand in the Euro Area: do National Differences
matter? Working Paper 405, June, Bank of Italy.
De Santis, R. A., C.A. Favero and B. Roffia (2013), Euro area Money Demand and International
Portfolio Allocation: A Contribution to assessing Risks to Price Stability, Journal of International
Money and Finance, 32 (0), pp. 377-404.
Dreger, C. and J. Wolters (2010), M3 Money Demand and Excess Liquidity in the Euro Area, Public
Choice, 144, 459-472.
ECB (1999), Monthly Bulletin, January, pp. 39-49.
Eichengreen, B. (2007), Global Imbalances and the Lessons of Bretton Woods, The MIT Press,
Cambridge.
Erdil, E. and I. H. Yetkiner (2009), The Granger-Causality between Health Care Expenditure and
Output: A Panel Data Approach, Applied Economics, 41(4-6), pp. 511-518.
Ewijk, S. van (2013), Banking on Growth, PhD thesis, Nyenrode Business Universiteit.
Feldstein, M. and C. Horioka (1980), Domestic Saving and International Capital Flows, Economic
Journal, 90, pp. 314-329.
Ferguson, N. (2008), The Ascent of Money, part 6: Chimerica, BBC DVD series.
Ferrero, G., A. Nobili and P. Passiglia (2010), Assessing Excess Liquidity in the Euro Area: the Role of
Sectorial Distribution of Money, Applied Economics, 43 (23), pp.3213-3230.
Godley, W. and M. Lavoie (2007), Monetary Economics, An Integrated Approach to Credit, Money,
Income, Production and Wealth, Palgrave.
Golinelli, R. and S. Pastorello (2002), Modelling the Demand for M3 in the Euro Area, The European
Journal of Finance, 8, pp. 371-401.
Greiber, C., W. Lemke (2005), Money demand and Macroeconomic Uncertainty, Deutsche
Bundesbank Discussion Paper No 26/2005.,
Greiber, C. and R. Setzer (2007), Money and Housing: Evidence for the Euro Area and the US,
Deutsche Bundesbank Discussion Paper No. 12/2007 .
Holinski, N., C. Kool and J. Muysken (2012), Persistent Macroeconomic Imbalances in the Euro Area:
Causes and Consequences, Federal Reserve Bank of St. Louis Review, 94, 1, pp. 1-20.
Kool, C. and Keijzer L. (2009), International Capital Mobility: Linking the Feldstein-Horioka Puzzle and
the Trade and Equity Home Bias Puzzle, Cambridge Journal of Regions, Economy and Society, 2 (2),
pp. 211-228.
Krugman, P. (2007), Will there be a Dollar Crisis?, Economic Policy, July, 436-467.
Lane, P. and McQuade (2013), Domestic Credit Growth and International Capital Flows, ECB Working
Paper Series, 1566, July.
18
Nautz, D. and U. Rondorf (2011), The (In)stability of Money Demand in the Euro Area: lessons form a
cross-country Analysis, Empirica, 38, pp. 539-553.
Setzer, R., P. van den Noord and G. Wolff (2011), Heterogeneity in Money Holdings across Euro Area
Countries: the role of housing, European Journal of Political Economy, 27, pp. 764-780.
Setzer, R. and G. Wolff (2013), Money Demand in the Euro Area: new Insights from Disaggregated
Data, International Economics and Economic Policy, 10 (2), pp. 297-315.


![Data Mining Studie 2013 | Praxistest & Benchmarking€¦ · RapidMiner fälschlicherweise als nominal er-kannt [siehe Abb.29]. Dieser Umstand lässt sich in RapidMiner ...](https://static.fdokument.com/doc/165x107/5b0139497f8b9af1148dd132/data-mining-studie-2013-praxistest-benchmarking-rapidminer-flschlicherweise.jpg)
![PIV DRIVES - Media · Nominal Power / Puissance nominale 2 Bauart/Type Getriebegröße / Size / Taille ILC 14 16 18 19 20 22 25 i N n 1 [min-1] Getriebe-Nennleistung / Nominal Power](https://static.fdokument.com/doc/165x107/5ffaac0dcceeaa596e639e35/piv-drives-media-nominal-power-puissance-nominale-2-bauarttype-getriebegre.jpg)