Aysıt Tansel - core.ac.uk · The provinces which suffered heavy quake damage are listed in Table 1...
52
econstor www.econstor.eu Der Open-Access-Publikationsserver der ZBW – Leibniz-Informationszentrum Wirtschaft The Open Access Publication Server of the ZBW – Leibniz Information Centre for Economics Standard-Nutzungsbedingungen: Die Dokumente auf EconStor dürfen zu eigenen wissenschaftlichen Zwecken und zum Privatgebrauch gespeichert und kopiert werden. Sie dürfen die Dokumente nicht für öffentliche oder kommerzielle Zwecke vervielfältigen, öffentlich ausstellen, öffentlich zugänglich machen, vertreiben oder anderweitig nutzen. Sofern die Verfasser die Dokumente unter Open-Content-Lizenzen (insbesondere CC-Lizenzen) zur Verfügung gestellt haben sollten, gelten abweichend von diesen Nutzungsbedingungen die in der dort genannten Lizenz gewährten Nutzungsrechte. Terms of use: Documents in EconStor may be saved and copied for your personal and scholarly purposes. You are not to copy documents for public or commercial purposes, to exhibit the documents publicly, to make them publicly available on the internet, or to distribute or otherwise use the documents in public. If the documents have been made available under an Open Content Licence (especially Creative Commons Licences), you may exercise further usage rights as specified in the indicated licence. zbw Leibniz-Informationszentrum Wirtschaft Leibniz Information Centre for Economics Akarca, Ali T.; Tansel, Aysit Working Paper Voter Reaction to Government Incompetence and Corruption Related to the 1999 Earthquakes in Turkey IZA Discussion Papers, No. 9162 Provided in Cooperation with: Institute for the Study of Labor (IZA) Suggested Citation: Akarca, Ali T.; Tansel, Aysit (2015) : Voter Reaction to Government Incompetence and Corruption Related to the 1999 Earthquakes in Turkey, IZA Discussion Papers, No. 9162 This Version is available at: http://hdl.handle.net/10419/114033
Transcript of Aysıt Tansel - core.ac.uk · The provinces which suffered heavy quake damage are listed in Table 1...

econstor www.econstor.eu
Der Open-Access-Publikationsserver der ZBW – Leibniz-Informationszentrum WirtschaftThe Open Access Publication Server of the ZBW – Leibniz Information Centre for Economics
Standard-Nutzungsbedingungen:
Die Dokumente auf EconStor dürfen zu eigenen wissenschaftlichenZwecken und zum Privatgebrauch gespeichert und kopiert werden.
Sie dürfen die Dokumente nicht für öffentliche oder kommerzielleZwecke vervielfältigen, öffentlich ausstellen, öffentlich zugänglichmachen, vertreiben oder anderweitig nutzen.
Sofern die Verfasser die Dokumente unter Open-Content-Lizenzen(insbesondere CC-Lizenzen) zur Verfügung gestellt haben sollten,gelten abweichend von diesen Nutzungsbedingungen die in der dortgenannten Lizenz gewährten Nutzungsrechte.
Terms of use:
Documents in EconStor may be saved and copied for yourpersonal and scholarly purposes.
You are not to copy documents for public or commercialpurposes, to exhibit the documents publicly, to make thempublicly available on the internet, or to distribute or otherwiseuse the documents in public.
If the documents have been made available under an OpenContent Licence (especially Creative Commons Licences), youmay exercise further usage rights as specified in the indicatedlicence.
zbw Leibniz-Informationszentrum WirtschaftLeibniz Information Centre for Economics
Akarca, Ali T.; Tansel, Aysit
Working Paper
Voter Reaction to Government Incompetence andCorruption Related to the 1999 Earthquakes inTurkey
IZA Discussion Papers, No. 9162
Provided in Cooperation with:Institute for the Study of Labor (IZA)
Suggested Citation: Akarca, Ali T.; Tansel, Aysit (2015) : Voter Reaction to GovernmentIncompetence and Corruption Related to the 1999 Earthquakes in Turkey, IZA DiscussionPapers, No. 9162
This Version is available at:http://hdl.handle.net/10419/114033
DI
SC
US
SI
ON
P
AP
ER
S
ER
IE
S
Forschungsinstitut zur Zukunft der ArbeitInstitute for the Study of Labor
Voter Reaction to Government Incompetenceand Corruption Related to the 1999 Earthquakes in Turkey
IZA DP No. 9162
June 2015
Ali T. AkarcaAysıt Tansel

Voter Reaction to Government Incompetence
and Corruption Related to the 1999 Earthquakes in Turkey
Ali T. Akarca University of Illinois at Chicago
Aysıt Tansel
Middle East Technical University, IZA and ERF
Discussion Paper No. 9162 June 2015
IZA
P.O. Box 7240 53072 Bonn
Germany
Phone: +49-228-3894-0 Fax: +49-228-3894-180
E-mail: [email protected]
Any opinions expressed here are those of the author(s) and not those of IZA. Research published in this series may include views on policy, but the institute itself takes no institutional policy positions. The IZA research network is committed to the IZA Guiding Principles of Research Integrity. The Institute for the Study of Labor (IZA) in Bonn is a local and virtual international research center and a place of communication between science, politics and business. IZA is an independent nonprofit organization supported by Deutsche Post Foundation. The center is associated with the University of Bonn and offers a stimulating research environment through its international network, workshops and conferences, data service, project support, research visits and doctoral program. IZA engages in (i) original and internationally competitive research in all fields of labor economics, (ii) development of policy concepts, and (iii) dissemination of research results and concepts to the interested public. IZA Discussion Papers often represent preliminary work and are circulated to encourage discussion. Citation of such a paper should account for its provisional character. A revised version may be available directly from the author.
IZA Discussion Paper No. 9162 June 2015
ABSTRACT
Voter Reaction to Government Incompetence and Corruption Related to the 1999 Earthquakes in Turkey*
Two major earthquakes which struck northwestern Turkey in 1999 exposed rampant corruption involving construction and zoning code violations. The government’s relief efforts were tainted by corruption as well, and exhibited a great deal of incompetence. How voters responded to these in the next election held in 2002 is investigated. The fact that different group of parties were responsible for the construction of the shoddy buildings, and for the corruption and mismanagement related to relief, provided us with a unique opportunity to determine whether and how the electorate punished the culprits for each of these. Vote equations are estimated for the seven major political parties. These are fitted to cross-provincial data individually, using OLS, Robust Regression methods, and Seemingly Unrelated Regressions procedures. The same picture emerges from each of these methods. Not just those ruling at the time of the earthquakes, but also other parties which were in power when the substandard buildings, were built were held accountable by the electorate. Furthermore, the Turkish voters appear to have allocated the blame rationally, taking into consideration the division of labor in the central government, and the relative influences the parties had on local administrations. Reaction of the voters to government incompetence and corruption was one of the factors which resulted in the emergence of a new party system. In 2002, the AKP, established only a year before, captured almost all of the far-right Islamist, about half of the far-right nationalist, and more than half of the center-right votes in 2002. JEL Classification: D72, D73, H84, Q54 Keywords: natural disaster, corruption, disaster aid, governance, election, voter behavior,
voter turnout, Turkey Corresponding author: Ali T. Akarca Department of Economics University of Illinois at Chicago 601 South Morgan Street 725 University Hall (MC 144) Chicago, IL 60607 USA E-mail: [email protected]
* This work has benefited from a financial grant from the Economic Research Forum (ERF) within the framework of the Regional Research Competition funded by the Global Development Network (GDN). The contents and recommendations do not necessarily reflect the views of the Economic Research Forum. We would like to thank also Cengizhan Güder, Mehmet Dikmen and Bülent Özmen for guiding us to the data sources, and Aydın Bozdemir, Ulvi Askerov, Yasemin Aslan for assisting us in gathering and organizing the data. We would like to thank the editor and two anonymous reviewers of the Journal of Economic Studies for their valuable suggestions which enhanced the quality of this article.
1
1. Introduction
The purpose of this paper is to study voter response to government incompetence
and corruption, taking advantage of a natural experiment which occurred in Turkey in 1999:
the two earthquakes and the events surrounding them. These quakes measured 7.4 and 7.2
on the Richter scale, and struck densely populated and heavily industrialized northwestern
section of the country, on 17 August 1999 and 12 November 1999, revealing rampant
corruption involving construction and zoning code violations.1 While a lot of the old
buildings remained standing after the quakes, many of the recently constructed ones folded
in on themselves due to their unsafe locations, inappropriate design, and substandard
practices employed in their construction, such as use of concrete prepared with beach sand,
insufficient amount of cement and steel bars. It was clear that thousands of more people had
died and left homeless than need be the case. The relief efforts were tainted by corruption
as well, and exhibited a great deal of incompetence. Furthermore, the government failed to
prosecute corrupt officials and contractors except for a token few. Kinzer (2001) and Green
(2005) explain in detail, how corruption magnified the above disasters in Turkey. Escalares,
Anbarci and Register (2007), studying 344 major quakes in 42 countries during the 1975-
2003 period, show that public sector corruption is positively related to earthquake fatalities
in other countries as well.
What makes the case at hand interesting is the fact that different coalitions of parties
were in power at the time of the quakes and when the shoddy buildings were constructed.
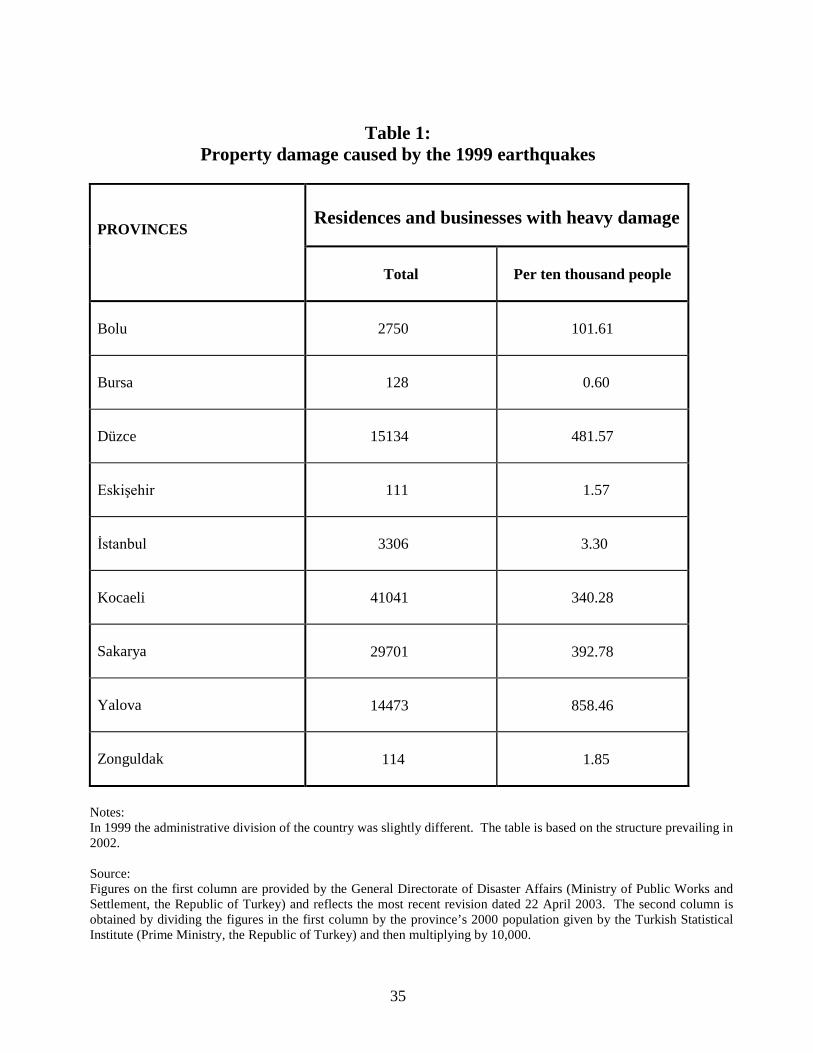
1 The provinces which suffered heavy quake damage are listed in Table 1 and shown on a map in Figure 1.

2
Also, none of the parties ruling in 1999 held power at the local level in the quake-effected
region then or before.2 These conditions provide us with a unique opportunity to determine
whether the voters punished, in the next election held in 2002, all of the parties responsible
for corruption and mismanagement and if so, whether they considered the division of labor
in the central government and relative influences the political parties had on local
administrations. To take advantage of this opportunity is one of our purposes.
The outcome of the 3 November 2002 election was such a shock that journalists and
academicians who analyze it often refer to it using terms such as turning point, landslide,
meltdown, tsunami, and earthquake.3 In that election voters ousted all of the parties,
including opposition parties, which had entered the parliament in the previous election held
on April 18, 1999. Although the economic crisis of 2001 is often cited as the cause of this,
it can’t be the sole explanation. Turkey experienced four economic crisis during the
previous decade and a half under various governments but never experienced such an
electoral outcome as a result. Recently some political scientist, based on case studies,
claimed that corruption or bad governance alone is not sufficient to get such a rise out of the
electorate. For that, they argued, both had to occur together, involve large number of
political parties, and a non-corrupt alternative should be available to the voters. By
showing that such conditions have coalesced in Turkey in 2002 to produce what was
observed, we aim also to provide some more evidence in support of this argument and bring
the Turkish case to the attention of researchers studying voter response to corruption.
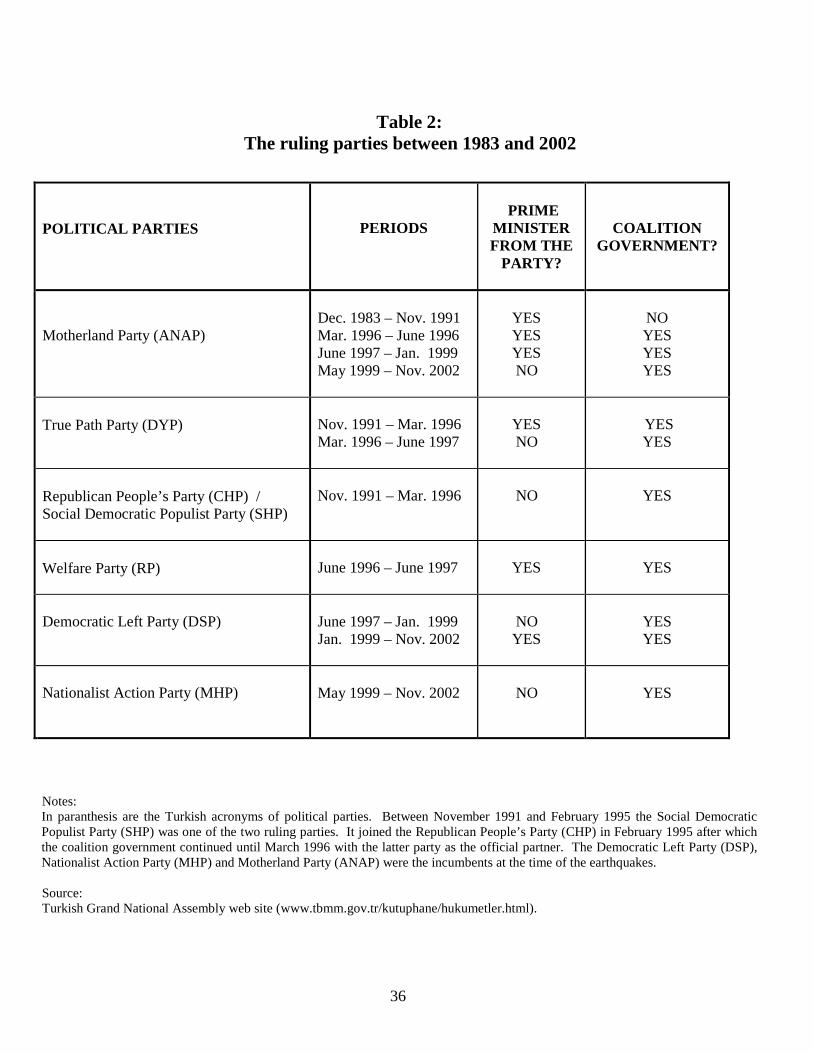
2 In Turkey, municipalities issue the permits for constructions and inspect them, but they are overseen by the central government. The latter, by granting frequent amnesties for improperly and illegally constructed buildings, and providing utilities and other services to them, encourage their spread. Tables 2 and 3 list the parties which were in charge of the central government and municipalities in the quake-affected area, before and at the time of the quakes. 3 See for example, Başlevent, et al. (2004 and 2005), Özel (2003) and Kinzer (2001).
3
Our analysis will be based on a system of party vote equations we will estimate. To
measure the impact of earthquake-related corruption properly, in our equations we will take
into account vote shifts from old parties to the new ones. Consequently, we will be able to
shed some light also on the political realignment which has taken place and the new party
structure which has emerged as a result of it. That is yet another one of our goals.
The paper is organized as follows. In the next section we will review the literature
on corruption and in particular the recent work on voter response to corruption. Then in the
section following that we will discuss in greater detail key events preceding the 2002
election, and each party’s involvement in pre-and post-quake corruption and
mismanagement. Other factors which have contributed to the ascendancy of the Justice and
Development Party (AKP), the ruling party since 2002, will also be discussed in that
section. The method and data used in our analysis, and the empirical results obtained will
be presented in sections 4 and 5, respectively. Finally in section 6, conclusions reached will
be listed.
2. Review of corruption literature
There is a large body of literature which links corruption to various social and
economic ills. Escaleras et al. (2007) show that it raises fatalities from earthquakes, and
Anbarci et al. (2006) from traffic accidents. Pierdzioch and Emrich (2013) find that
corruption reduces the chances of national Olympic success. Azfar and Gurgur (2008)
provides evidence indicating that corruption undermines the delivery of health care services.
Zelekha and Sharabi (2012) show that even a small change in the level of corruption in a
trading partner of a country significantly damages trade volumes in both directions. Méon
4
and Sekkat (2005), Pellegrini and Gerlagh (2004), Mo (2001), and Mauro (1995) find that it
leads to lower investment. Countries with high levels of public sector corruption are found
to receive less foreign aid, by Alesina and Weder (2002), less foreign direct investment, by
Habib and Zurawicki (2002), and less foreign venture capital by Aizenman and Kendall
(2011). Freckleton, et al. (2012) shows that higher levels of corruption reduces the
beneficial impact foreign direct investment has on economic growth. Bahmani-Oskooee
and Goswami (2005) find that black market premium is higher in countries that are plagued
by more corruption. De la Croix and Delavallade (2009), Tanzi and Davoodi (1997), and
Mauro (1997) argue that corruption distorts public expenditures in favor of specific types of
spending for which rent-seeking is easier and better concealed. Murphy et al. (1991, 1993)
argue that it drives potential entrepreneurs to rent-seeking activities, or even to becoming
corrupt officials themselves. In short, it can be said that corruption leads to lower economic
growth through diminished and misallocated resources. Thus it is undesirable not only on
ethical grounds and needs to be fought.
On the other hand, a few studies, such as Nye (1989) and Leff (1964) argue that
corruption can be viewed as greasing the wheels of the government, enabling firms to
sidestep burdensome government controls, and that optimal level of corruption may be non-
zero. However, more recent studies by Ratbek (2014), Swaleheen (2011), Carden and
Verdon (2010), Blackburn, et al. (2010), Kholdy and Sohrabian (2008) and Teles (2007), by
taking into account interactions among the levels of development, corruption and share of
public sector in the economy, show that the ‘grease-in-the-wheel’ argument applies only in
cases of very low income countries which have high-corruption, low-freedom and size of
government exceeding the optimal level. Since such countries do not have fair elections and
5
voter response to speak of, they do not fall under the subject matter of our paper.
It is generally believed that, to fight corruption, it is sufficient to have institutions in
place which can unearth and disseminate the relevant information, and a democratic system
which empowers voters to act on it to hold politicians accountable. For example, Costas et
al. (2011), Freille et al. (2007), Lederman et al. (2005), Adsera et al. (2003), Brunetti and
Weder (2003), and Besley, and Burgess (2002) provide evidence on the importance of free
press, and Schleiter and Voznaya (2014) of effective party competition in reducing
corruption through enhanced information generation. However, as Johnson et al. (2011),
Chang et al. (2010), and Golden (2006) point out, corruption exists even in advanced
democracies. Worse yet, Costas-Pérez et al. (2012), Fernández-Vázquez and Rivero (2010),
Chang et al. (2010), and Reed (2005) show, through Spanish, Italian, and Japanese
examples, that such corruption usually makes very little difference in the reelection fortunes
of politicians even when it is public knowledge. Welch and Hibbing (1997), Dimock and
Jacobson (1995), and Peters and Welch (1980) provide similar evidence in the case of U.S.
Chang et al. (2010), Fernández-Vázquez and Rivero (2010), Manzetti and Wilson
(2007) and Golden (2006) offer some explanations as to why the re-election chances of
politicians known to be corrupt are affected only marginally. They argue that voters may
doubt the information or dismiss it as partisan, especially if the accusations are leveled
predominantly against the members of one party. The pool of candidates or parties from
which citizens can choose may be seriously limited in number or in terms of their quality, a
point emphasized by Schleiter and Voznaya (2014) as well. Also, the voters may take
corruptness of an incumbent into account in casting their ballots, but only as one of his/her
many attributes. If they believe that the honest challengers will not be able to deliver the

6
same results in terms of economic development and improvements in their well-being, many
of them may still vote for the corrupt incumbent. Consequently, a politician can offset, at
least partially, the negative impact of his/her corruptness by transferring government
benefits to his/her constituents, supporting economic policies with which they agree and/or
governing competently otherwise. Indeed Klasnja and Tucker (2013) find that whereas in a
low corruption country, voters react negatively to corruption regardless of the state of the
economy, in a high corruption country, voters react negatively to corruption only when the
state of the economy is also poor; when economic conditions are good, corruption is less
important. Thus corrupt incumbents may lose votes but not enough to deny them re-
election, as long as they keep the level of corruption in check and do not allow it to damage
overall economic performance significantly. This may explain why the level of corruption
is lower in democratic countries, as Pellegrini and Gerlagh (2008) and Lederman et al.
(2005) find, and why its harm on economic growth is less, as Drury et al. (2006) point out.
It appears that publicity about corruption is necessary but not sufficient to get voters
to react. For the latter to occur, the corruption has to be massive, credible, and involve large
number of parties as well. Furthermore, it should not be accompanied by otherwise
competent and beneficial governance, and a non-corrupt alternative should be available.
According to Chang et al. (2010) that is what occurred in Italy in 1994. The election held in
that year took place in the midst of the “Clean Hands” investigation which implicated more
than a third of the legislators from different parties, including five former prime ministers
and thousands of other politicians. A voter realignment of substantial proportions was the
outcome. More than two-thirds of the incumbents did not make it to the new legislature.
Almost all of the existing major parties collapsed and a new party system emerged.

7
Something very similar to what happened in Italy in 1994, occurred in Turkey in
2002, but even more drastically. Yet it went largely unnoticed. We now turn to that case
and give some background information on it.
3. Political background
In 2002 election Turkish voters ousted all of the parties, which had entered the
parliament in the previous election held in 1999. These were who’s who of Turkish politics.
Among them were the Motherland Party (ANAP), which held the premiership during 1983–
1991 and 1996–1999, the True Path Party (DYP) and the Democratic Left Party (DSP),
which led governments during 1991–1996 and 1999–2002, respectively, and the Nationalist
Action Party (MHP), which was part of the ruling coalition between 1999 and 2002. None
of them was able to surpass the ten percent nationwide vote share threshold necessary for
representation in the Turkish Grand National Assembly. The Constitutional Court had
already banned the Virtue Party (FP) in 2001, due to violating the constitutional principle of
secularism.4 The combined vote share of the parties mentioned was 81 percent in 1999 but
only 24 percent in 2002. Merely 11 percent of the legislators elected in 1999 made it to the
2002 parliament. The aggregate vote share of the three incumbent parties, the Democratic
Left Party (DSP), the Nationalist Action Party (MHP) and the Motherland Party (ANAP),
dropped to 14.7 percent from 53.4 percent in the previous election. The Justice and
Development Party (AKP) established only a year before the 2002 election came first with a
vote share of 34.3 percent and remained in power since then reaching 50 percent level in
2011. The Young Party (GP), another party established shortly before the election received
4 However, the party’s deputies, except a few who got banned from politics, remained in the parliament until 2002.

8
7.2 percent of the votes. The CHP, which was left out of the parliament in 1999, with a vote
share of 8.7 percent, was able to raise it to 19.4 percent.5
Interestingly, the conditions listed by Chang et al. (2010), Manzetti and Wilson
(2007) and Golden (2006) as essential for such a dramatic voter reaction, all materialized in
Turkey before the 2002 election. In hindsight, the building of voter dissatisfaction with
established parties is quite obvious. In each parliamentary election between 1987 and 2002,
a different party finished first. Since 1991, each election produced a coalition government
involving a different combination of parties. It is clear that the electorate was frustrated with
rampant corruption, bad governance, and inability of the parties to change their failed
policies and leaders. During six of the fifteen years preceding the 2002 election, under
ANAP, DYP-CHP, ANAP-DSP, DSP-MHP-ANAP governments, the growth rate of per
capita real GDP was negative. A number of corruption allegations were leveled against
each of these governments which went uninvestigated due to reluctance of the coalition
partners to lift the parliamentary immunities of their members. For brevity, we will not list
here all of the cases, but to give an idea to the reader about their nature, and how they
shocked the voters across the spectrum, we will discuss briefly the most notable two. The
first of these came to light inadvertently when a fatal car crash occurred near the small town
of Susurluk on 3 November 1996. In the words of Özel (2003, p. 87), “In the ill-fated
Mercedes sedan that ran into a truck outside Susurluk were a senior police official, an
ultra-rightist assassin and drug dealer wanted by (among others) Interpol, his ex–beauty
queen girlfriend, and a Kurdish tribal leader–cum–DYP deputy (the wreck’s sole survivor)
5 The AKP and CHP continued to raise their vote shares, reaching 49.8 and 26.0 percent respectively, in 2011. Of the parties left out of the parliament in 2002, only the MHP was able to engineer a comeback. The rest and the GP eventually disappeared either literally or for all practical purposes. Their combined vote share declined from 63% in 1999 to 23% in 2002 and to 2% in 2011.
9
who headed an anti-PKK militia. The car’s trunk held an array of pistols and silencers, plus
official documents establishing several false identities for Abdullah Çatlı, the fugitive
criminal. Like a stone heaved into a cesspool, the Susurluk incident sent out widening riplets
of scandal as reporters traced links between these characters and other politicians
(including the DYP’s Mehmet Ağar, who was forced to resign as justice minister),
organized-crime figures, state-security agencies, and unsolved killings from the mid-
1990s”.6 Tansu Çiller, the leader of the DYP and deputy prime-minister, let alone
condemning, actually owned up to what her government had allowed, and tried to justify it
in the name of national security. In a different case, shortly before the Susurluk scandal, she
was personally accused of illegally enriching her family. Then her party was a partner in
another coalition government with the ANAP. When the ANAP deputies decided to vote
together with the opposition to lift her parliamentary immunity so that she can be tried, she
accused them of partisanship, ended her party’s partnership with them, and formed another
government with the Welfare Party (RP), the predecessor of the FP, which agreed to pull its
support from the motion to remove her immunity.
As we explained in the previous section, it took the earthquakes of 1999 and the
economic crisis of 2001, the worst one to date, however to get the voters to react
dramatically. These added to the list of corruption-tainted and incompetent parties, the DSP
and the MHP, the last two parties to be tried by the electorate before 2002. The emergence
of the AKP from the ashes of the banned FP played an important role as well. The party’s
6 Mehmet Ağar ran as an independent candidate in 2002 and got elected. Then he became the leader of the DYP after the resignation of Tansu Çiller. However he lost his parliamentary immunity in 2007 following his party’s failure once again to surpass the ten percent nationwide threshold. He got tried for his offences revealed by the Susurluk incident and sentenced to five years prison term in 2011. PKK is an illegal organization which was waging insurgency against the state since early eighties for achieving autonomy or independence for the ethnic Kurds.

10
disavowal of the anti-Western and pro-Islamist positions of the FP, embrace of political and
economic reforms necessary for Turkey’s accession to the European Union, and the
likelihood of it forming a single-party government, presented an alternative to those who
wanted to desert the right-wing ANAP, DYP and MHP.7 The Felicity Party (SP), the other
party rooted in the FP, towed the old Islamist party line and received only a couple of
percent of the votes, as opposed to the AKP which captured more than a third of it.
Interestingly, the AKP was able to transform without alienating much of its traditional base.
Over the last two decades that base had transformed as well. While holding on to its basic
conservative values, it got increasingly richer, more educated, more urbanized, more
modernized, more entrepreneurial, and more integrated with other parts of Turkey and the
rest of the world, largely as a result of introduction of internet, ending of the state monopoly
on television and radio, major improvements in the highway and telecommunication
systems, and the market-oriented reforms instituted in the eighties by Turgut Özal, the
prime-minister then. The leadership which formed the AKP recognized this evolution in the
society better than all of the other parties, and transformed.
The non-corrupt and populist image of its mayors at the local level also helped the
AKP. In fact, the party’s leader Tayyip Erdoğan gained his popularity as a former mayor of
Istanbul. Most of these mayors got elected in 1994 and 1999 as candidates of the RP and FP
respectively and joined the AKP after the closure of the latter. Some of the founders of the
AKP held positions in the central government but only very briefly when RP held power
from mid-1996 to mid-1997, in partnership with the DYP. In fact, toppling of that coalition
government by the military, through a destabilization campaign referred to as the 28
7 For more details on the sources of the AKP votes the reader is referred to Başlevent and Akarca (2009) and Akarca and Başlevent (2009).

11
February soft-coup by the media after the National Security Council meeting of 28 February
1997 at which it was initiated, and imprisonment of the AKP leader shortly before the 2002
election for reading a poem which was deemed inciting the public to rise up, caused a lot of
votes to shift to the party from the center-right parties which cooperated with the military.
The GP, which was formed a few months before the 2002 election by a young
business tycoon with no previous political experience, provided yet another alternative to
disgruntled voters. Running on a populist and nationalistic platform, the party placed fifth.
One would expect the GP to either be unaffected by the earthquake related events, or benefit
from them, as the party was non-existent when the buildings damaged by the earthquakes
were built and its leader never held an elective office before.
The DSP, the major incumbent party in 2002, came to power for the first time in
June 1997 but got the premiership only seven months before the August 1999 earthquake.
The party had no mayors in cities which suffered major damage in the quakes. Furthermore,
its leader Bülent Ecevit had an impeccable reputation as a non-corrupt politician. Thus this
party could be held responsible for the inefficiency in providing relief and for its inability or
unwillingness to prosecute corrupt officials and their private sector benefactors, but not for
the corruption at the local level, and not for the construction of shoddy buildings. However,
the failure of his party to remove Ecevit from his leadership position and his refusal to
resign, despite his incapacitating illness and some signs of dementia exhibited, probably
contributed to DSP’s vote losses. There is no doubt that his rash decision to make public his
spat with the president triggered the 2001 economic crisis, but it would have arrived
anyway.
The second largest incumbent party in 2002, the MHP, came to power less than three
12
months before the first earthquake in 1999 and after being out of power for two decades.
This party controlled only one small municipality in the area affected by the earthquakes.
However, Koray Aydın, the minister of Public Works and Settlement, who supervised the
General Directorate of Disaster Affairs, was from the party. He was accused after the 2002
election by the new government, of cronyism and receiving kickbacks from contractors his
ministry employed to construct new housing for the earthquake survivors and for providing
other relief efforts. Although he was found not guilty in 2007 by the Supreme Court, it is
doubtful that he is vindicated in the public opinion. Also, at the time of the 2002 election,
whether he will be tried and how the verdict would turn out was not known. In fact, he was
forced to resign his post in 2001 by the leader of his party, being seen as a political liability.
Eight of his top bureaucrats and forty contractors they have collaborated with were found
guilty in 2008. Therefore any punishment of the party by the voters should be attributed to
its failure to come to the aid of the quake victims in a timely manner, its failure to prosecute
contractors who build the substandard structures and the officials who permitted them, and
to its involvement in post-quake corruption. However it would be irrational for the voters to
blame the MHP for the pre-quake corruption.
The third incumbent party, the ANAP, held the premiership of the country in single-
party governments between December 1983 and November 1991, and in coalition
governments, during March 1996 – June 1996, and June 1997 –January 1999 periods. The
party was a minor partner in the coalition ruling at the time of the 1999 earthquakes but it
controlled many of the local administrations in the quake-affected region since 1984. Thus,
as a party ruling both at national and local levels, and both before and after the quakes, the
ANAP is the only party which can be held accountable for all aspects of corruption and
13
mismanagement mentioned.
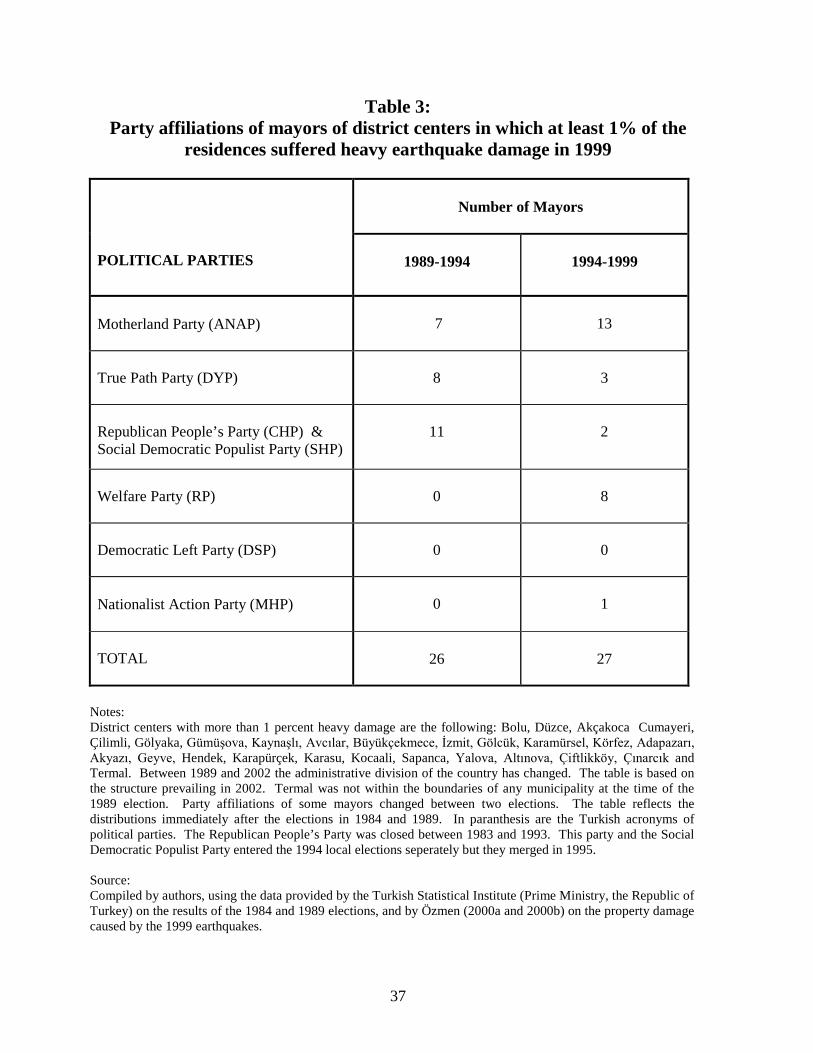
The opposition parties DYP and CHP were in power as partners during the 1991-
1996 period and both had large number of mayors in the provinces impacted by the two
earthquakes, during the decade preceding the quakes.8 Consequently they should share a
large part of the blame for the shoddy buildings being built.
3. Data and method
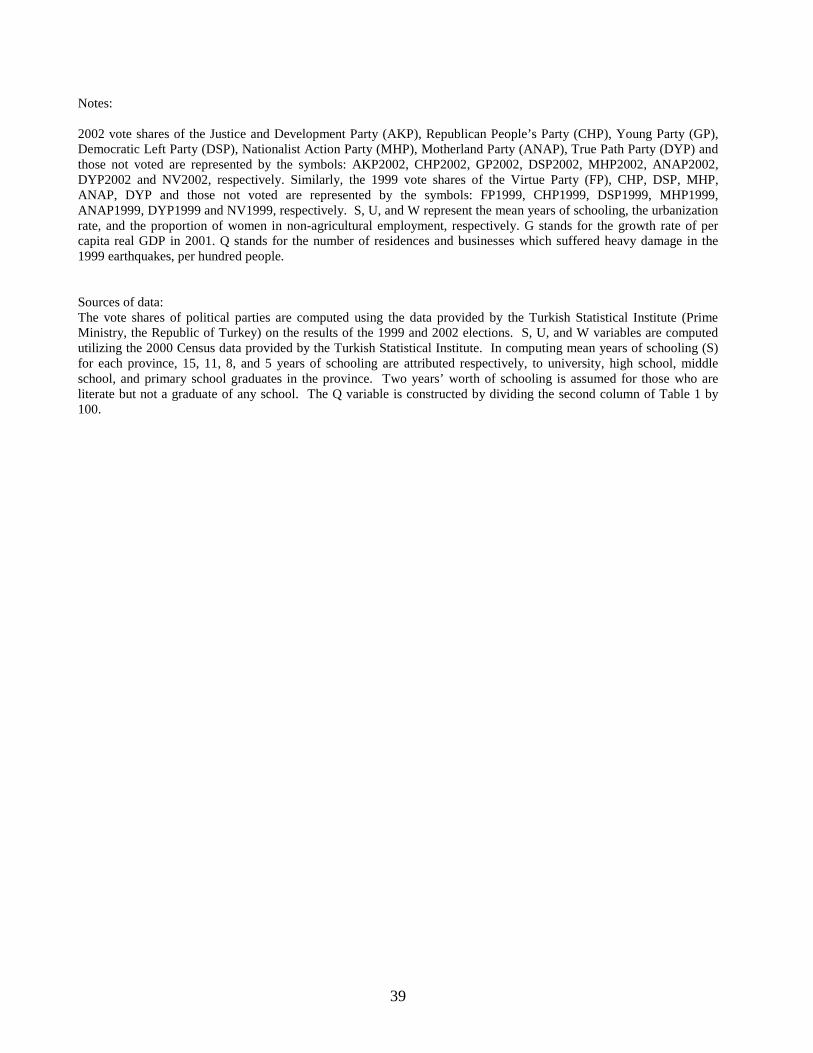
Our analysis is based on vote equations estimated for each major political party:
AKP, ANAP, CHP, DSP, DYP, GP, and MHP. The vote shares of the parties are measured
as a proportion of registered voters, not of valid votes cast.9 The group of people who
registered but did not vote is labeled as NV and are treated as if they constitute another
party. This was done to check whether some voters utilized not voting to signal their
displeasure with the politicians. Chong et al. (2011), analyzing Mexican data, show that
exposing corruption leads not only to vote losses by the incumbents, but also to a decrease
in electoral turnout. Stockemer (2013), studying over 200 elections from over 70 countries,
find that political corruption stifles turnout. However the reverse can be argued as well. The
quake victims may turn out in greater numbers, out of anger.
Cross-provincial data is used in fitting the equations but 20 of the 81 provinces are
excluded from the sample. 16 of the excluded provinces are those in which the Kurdish-
nationalist Democratic People’s Party (DEHAP) received more than 10 percent of the vote
in 2002. These are all in the eastern and south-eastern sections of the country, far from the
8 We are treating the CHP and the Social Democratic Populist Party (SHP) as one party. Between November 1991 and February 1995 the SHP was in power with DYP. This party joined the CHP in February 1995. Then the coalition government continued until March 1996 with the latter party as the official partner. 9 The vote shares given in the previous two sections were computed in the usual way (as a proportion of valid votes cast). However the shares mentioned henceforth are of registered voters.

14
area where the quakes took place. The characteristics and behavior of voters in these
provinces is considerably different than in the rest of the country. It is largely ethnic and
tribal based. The proportion of votes received by the Kurdish-nationalist parties, the
People’s Democracy Party (HADEP) in 1999 and the Democratic People’s Party (DEHAP)
in 2002, in this region was about 10 times their vote share in the rest of the country, while
that of the MHP, AKP, and GP were 35-80 percent lower, the ANAP and DYP about the
same and the votes cast for independent candidates 7-10 times higher. Akarca and Başlevent
(2011), using cluster analysis, show that voting patterns in this region to be quite different
than the rest of the country. Including these provinces in the sample would have
necessitated addition of a number of other independent variables, turning the focus of our
analysis from voter response to corruption and incompetence into one involving differences
in regional voting patterns. Akarca and Tansel (2007), who analyzed the outcome of the
1995 parliamentary election in Turkey, excluded these provinces also, for the same reasons.
Also excluded from the sample are the following provinces: Rize, Osmaniye,
Bayburt and Bartın. The first two of these are the home provinces of the leaders of the
ANAP and MHP, where their candidacies bring to their parties substantially more votes than
would be the case if they were not running. In the third, an independent candidate received
more than a fourth of the vote.10 The last province is one of the only two provinces in the
country in which the MHP was able to raise its vote shares between 1999 and 2002. Under
the same criteria, Sakarya and Yalova should be excluded as well but that would be like
throwing the baby with the bath water, as they are among the provinces affected by the
10 In 2002 election, substantial amount votes went to Mehmet Ağar who ran as an independent candidate in Elazığ, and to Muhsin Yazıcıoğlu, the leader of Grand Unity Party (BBP), a minor regional party, in Sivas. However, since these candidates ran in 1999 as well, and received about the same proportion of votes as in 2002, vote shares of major parties being studied here, were not affected. Consequently, we did not eliminate these provinces from the sample.
15
quakes. Sakarya is the home province of Cem Uzan, the leader of GP, where he was the
favorite son.11 Yalova is the other exceptional province in which the MHP was able to raise
its vote share. This occurred as a result of Yaşar Okuyan, a prominent ANAP politician and
Minister of Labor joining and becoming candidate from the MHP in 2002. Okuyan’s efforts
in Yalova, his constituency, in regards to relief and recovery activities after the 1999
earthquake are well known. Consequently, we handled these cases by adding two dummy
variables in the equations instead of eliminating the observations from the sample.12 The
provinces that are included and excluded from the sample are shown in Figure 1, and the
sources of data are given in the notes to Tables 1, 6, 7 and 8.
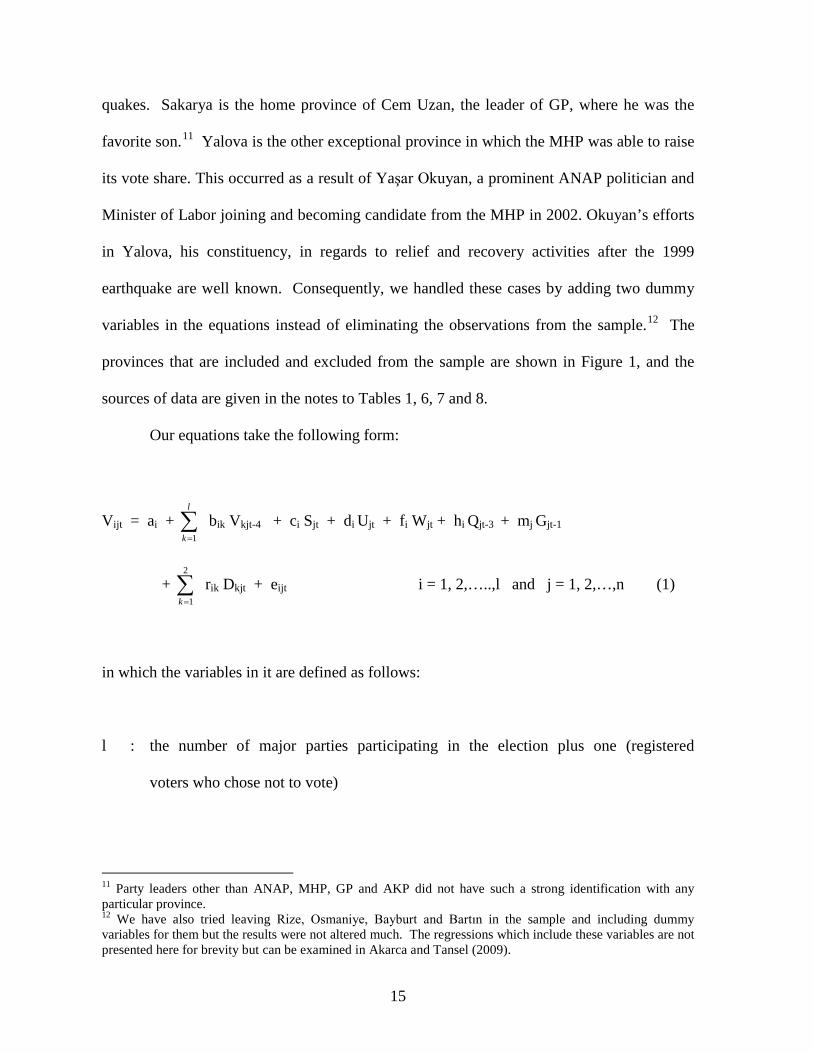
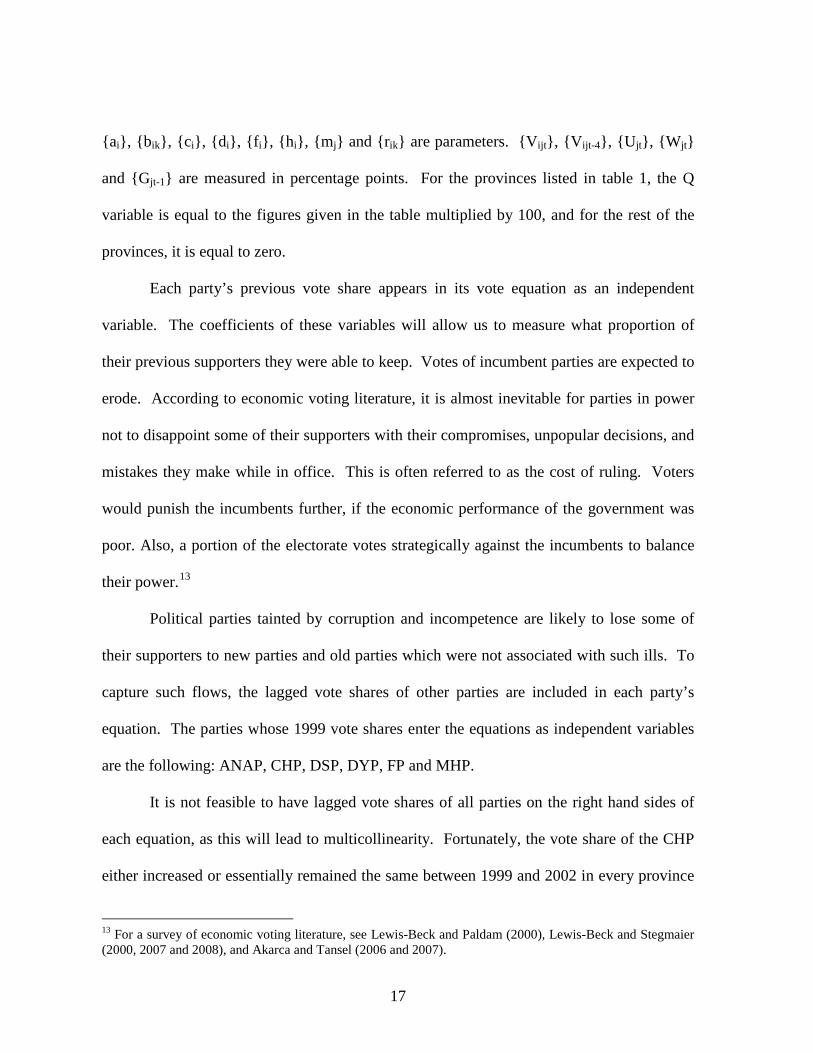
Our equations take the following form:
Vijt = ai + ∑=
l
k 1
bik Vkjt-4 + ci Sjt + di Ujt + fi Wjt + hi Qjt-3 + mj Gjt-1
+ ∑=
2
1krik Dkjt + eijt i = 1, 2,…..,l and j = 1, 2,…,n (1)
in which the variables in it are defined as follows:
l : the number of major parties participating in the election plus one (registered
voters who chose not to vote)
11 Party leaders other than ANAP, MHP, GP and AKP did not have such a strong identification with any particular province. 12 We have also tried leaving Rize, Osmaniye, Bayburt and Bartın in the sample and including dummy variables for them but the results were not altered much. The regressions which include these variables are not presented here for brevity but can be examined in Akarca and Tansel (2009).

16
n : the number of provinces
Vijt : the vote share of party i, in province j, in the election held in year t
Vijt-4 : the vote share of party i, in province j, in the previous election held approximately
four years earlier
Sjt : mean years of schooling of the population over age 6, in province j, in year t
Ujt : proportion of urban population in province j, in year t
Wjt : proportion of women in the non-agricultural employment in province j, in year t
Gjt-1 : provincial growth rate of per capita real GDP in 2001
Qjt-3 : number of residences and places of business that suffered heavy damage (per
hundred people) in province j, during the earthquakes of 17 August 1999 and 12
November 1999
Dkjt : dummy variable which takes on the value of 1 for the province k and zero for all
others
eijt : the disturbance term for party i, in province j, in year t
17
{ai}, {bik}, {ci}, {di}, {fi}, {hi}, {mj} and {rik} are parameters. {Vijt}, {Vijt-4}, {Ujt}, {Wjt}
and {Gjt-1} are measured in percentage points. For the provinces listed in table 1, the Q
variable is equal to the figures given in the table multiplied by 100, and for the rest of the
provinces, it is equal to zero.
Each party’s previous vote share appears in its vote equation as an independent
variable. The coefficients of these variables will allow us to measure what proportion of
their previous supporters they were able to keep. Votes of incumbent parties are expected to
erode. According to economic voting literature, it is almost inevitable for parties in power
not to disappoint some of their supporters with their compromises, unpopular decisions, and
mistakes they make while in office. This is often referred to as the cost of ruling. Voters
would punish the incumbents further, if the economic performance of the government was
poor. Also, a portion of the electorate votes strategically against the incumbents to balance
their power.13
Political parties tainted by corruption and incompetence are likely to lose some of
their supporters to new parties and old parties which were not associated with such ills. To
capture such flows, the lagged vote shares of other parties are included in each party’s
equation. The parties whose 1999 vote shares enter the equations as independent variables
are the following: ANAP, CHP, DSP, DYP, FP and MHP.
It is not feasible to have lagged vote shares of all parties on the right hand sides of
each equation, as this will lead to multicollinearity. Fortunately, the vote share of the CHP
either increased or essentially remained the same between 1999 and 2002 in every province
13 For a survey of economic voting literature, see Lewis-Beck and Paldam (2000), Lewis-Beck and Stegmaier (2000, 2007 and 2008), and Akarca and Tansel (2006 and 2007).

18
in our sample. Its 1999 vote share was unusually low by historical standards anyway,
which resulted in the party being left out of the parliament. Similarly, the AKP vote share
was substantially higher than that of the FP, its predecessor. The SP, the other party to
emerge out of the FP, received only a negligible amount of the votes. Thus the 1999 vote
share of the CHP can be eliminated from all equations except its own, and the 1999 FP vote
share can be eliminated from all equations except that of the AKP. Furthermore, since the
ANAP and DSP lost votes in all provinces in the sample, and the MHP in all, except one
(for which a dummy variable is added), we can eliminate the lagged vote shares of other
parties from their equations. Since the participation rate in 2002 was much lower than in
1999, the lagged value of NV appear only in the NV equation.
Although a lot of anecdotal evidence exists on corruption and incompetence related
to the 1999 earthquakes, unfortunately no quantitative data exists on government’s response
time to the disasters, on the exact number of buildings damaged specifically due to poor
construction, and on when these were constructed. Neither is there any information on how
many corrupt officials and contractors were let go because only a few of them were even
charged. However it is reasonable to assume that the people living in the nine provinces
affected by the 1999 earthquakes would have more information on these than the general
public. Consequently, the tendency to vote against the parties involved in corruption and
mismanagement would be more pronounced in these provinces and by measuring it, we can
get a better idea as to which parties were held accountable by the most informed of the
electorate. Presumably, the greater is the number of residences and businesses which
suffered heavy damage in a province, the greater is the information each voter in that
province is exposed to on the level of corruption involved, and on the quality of the relief
19
provided by the government. Thus the estimated parameter of the Q variable included in
each equation can be viewed as the incremental response of those voters who are better
informed about and more affected by the government corruption and incompetence over and
above the national response.
Socio-economic indicators are included in the equations to control for local
conditions. Economic interests and ideologies of voters depend on how well they are
educated, and whether they live in an urban or a rural location. S and U are included in the
vote equations to capture the impact of these two factors on the vote shares of various
political parties. W is considered as a proxy for the proportion of conservative and/or
religious voters in a province. Highly conservative and devoutly religious families in Turkey
tend to oppose female members of their families working outside their home, unless it is
together with other family members in an agricultural setting.
4. Empirical results
Regressions relating 2002 vote shares of major political parties to the variables
mentioned in the previous section are presented in tables 6 7 and 8. In these all of the zero-
parameter restrictions mentioned in the previous section are applied. If in the preliminary
estimation the parameter of a dummy variable turned out to be very small or insignificant in
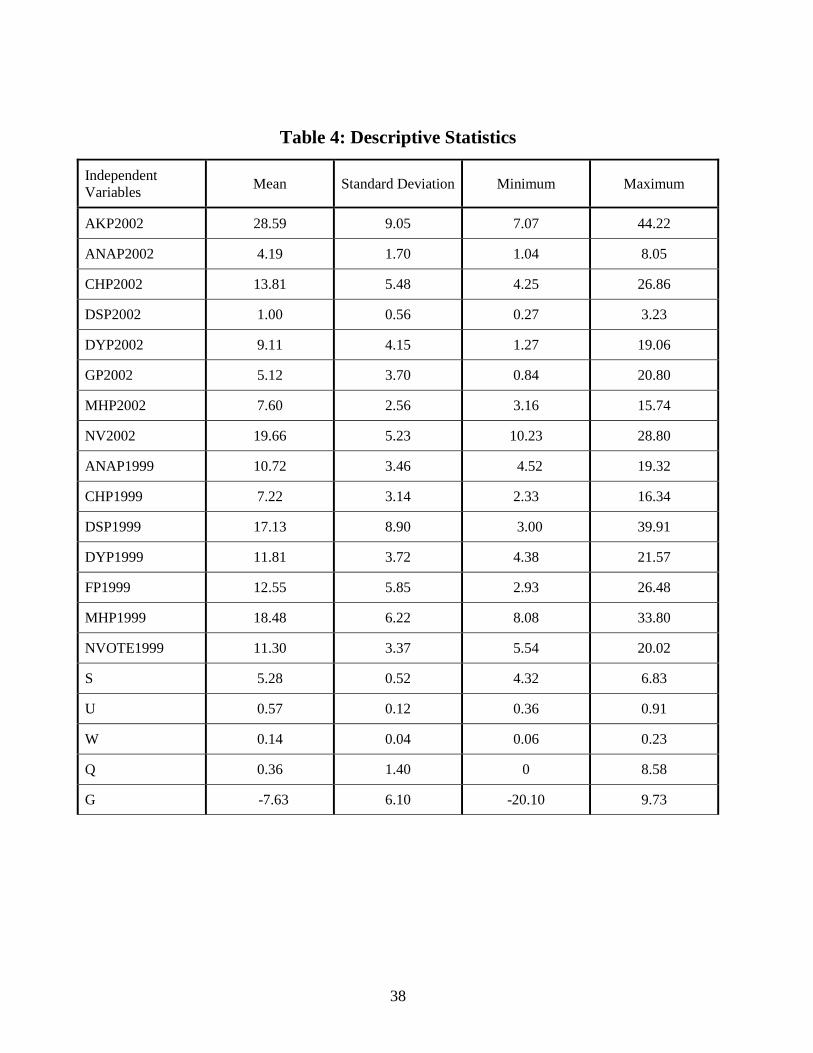
any equation, it is eliminated from that equation. Summary statistics on the variables used
in regressions, and correlations among them are presented in Tables 4 and 5, respectively.
Sources of the data used is given in the notes to Table 4.
Tables 6 presents the Ordinary Least Squares (OLS) estimates, and Table 7 the
results from estimating the equations as a system of seemingly unrelated regressions (SUR)
20
as suggested by Zellner (1962). Most of the estimated coefficients in tables 6 and 7 are
quite similar. A few differ notably in magnitude but the picture emerging from each table is
essentially the same. In each of these tables, equations with dummy variables are also
presented without the dummy variables so that their importance is realized. For example,
introduction of the SAKARYA dummy in the GP equation causes the parameter of the Q
variable to become much smaller and statistically insignificant. On the other hand,
introduction of the YALOVA dummy in the MHP equation changes the Q variable’s
parameter from being highly insignificant to being highly significant.
Despite our efforts to deal with outliers through exclusion of provinces with special
circumstances from the sample, use of dummy variables and socio-economic control factors,
in a case like the one at hand, where special circumstances at the local level can make a big
difference, we cannot be certain that all outliers are fully taken care of. To make sure that
our estimates are not driven by a few outliers, we estimated the equations also using the
robust regression technique. More precisely, we utilized the least trimmed squares (LTS)
method developed by Rousseeuw (1984), Rousseeuw and Van Driessen (2000) and Zaman
et al. (2001). Because the coefficients of G turned out to be very small and highly
insignificant in each regression, estimated both with OLS and SUR methods, except one, for
parsimony we eliminated that variable from our robust regressions.14 The robust regression
results are given in table 8. The outliers detected are listed in the notes to that table.15 We
will base our analysis more specifically on the figures given in Table 8, but we should note
that the patterns presented in that table are not that different from the ones given in Tables 6
14 For the GP, the coefficient of G is statistically significant but it is almost zero in magnitude. 15 In comparing significance of coefficients in Tables 6, 7 and 8, it should be noted that numbers in parantheses below the parameter estimates are the t-values in absolute value in the case of Tables 6 and 7, but chi-square values in the case of Table 8.

21
and 7.
The picture emerging from Table 8 is that, between 1999 and 2002 elections, there
was a general shift in votes, from the extreme right MHP and the center-right ANAP and
DYP towards the AKP, as indicated by the coefficients of the lagged vote variables. This
was even more pronounced in provinces which suffered heavy earthquake damage, as
indicated by the coefficients of the Q variable in various equations. In the latter provinces
there was a shift in votes towards the AKP from the center-left CHP and DSP as well. It
appears that the AKP was either not seen by voters as the continuation of the Welfare and
Virtue parties, or that the mayors of the latter were not seen as corrupt.16 Although the voter
turn-out was lower in 2002 than in 1999 and may be interpreted by some as an indication of
voter disillusionment with the political process, there is no indication in our results that
voter participation in the provinces hit by the earthquakes was any different than the rest of
the country. Countrywide, there is a hint that proportion of those who chose not to vote was
slightly higher among ANAP supporters, and slightly lower among the DYP supporters.
For the three incumbent parties, the DSP, MHP and ANAP, the estimated
coefficients of their own lagged vote variables imply that in a typical province they have
lost almost all, three-fourths, and three to four-fifths, of their 1999 votes, respectively,
controlling for other factors. These are definitely far more than the usual amounts of
erosion that can be expected in the vote shares of incumbent parties due to cost of ruling,
strategic voting and economic performance.17 These losses no doubt reflect to a large extent
16 Henderson and Kuncoro (2011) finds that in Indonesia, Islamic parties at the local level seem to have credibility in voters' minds, perhaps based on the perceived personal integrity of their candidates. The same was the case with the Islamist RP in Turkey. 17 For example, Akarca and Tansel (2007), using cross-section data, estimate the vote erosion for incumbent parties between 1991 and 1995 to be between 44% and 55%. Akarca (2011), analyzing time series data, finds that the primary incumbent party loss in 2002 was 68 percent more than what should be expected had similar incumbency and economic conditions prevailed in previous elections.
22
the disappointment of their supporters all over the country, with the way they have
responded to the earthquakes, with their failure to stop or prosecute culprits of earthquake
related corruption, and with their poor governance. The harshest punishment was levied
against the prime-minister’s party, the DSP, despite non-corrupt image of its leader, and the
minister responsible for disaster relief not being from that party. According to the
parameter estimates of DSP1999 in various vote equations, more than half of the party’s
supporters deserted it for the CHP and GP, and about a fifth of them moved to the DYP.
Besides the poor governance under the leadership of the party, its triggering of the 2001
crisis must have contributed to this outcome. As mentioned above, the coefficient of G is
very small in each regression. However, this does not necessarily mean that the 2001
economic crisis was not important for the voters but just that voters which were affected by
the crisis more did not respond more than those which were affected less. If socio-tropic
voting dominates ego-tropic voting, such an outcome should be expected. Also, the crisis
may have helped voters evaluate the competence of the government regardless of whether
they are affected by the crisis directly or not.
The fact that the DYP which is an opposition party has lost supporters --about a third
of them-- can be interpreted as punishment for its past involvement in corruption, which was
rendered when the conditions ripened, meaning when supporters of other parties begun
judging their parties. However these losses were offset partially by about a fifth of ANAP
and a fifth of DSP voters captured by the DYP.
Parties in power and in opposition both suffered additional vote losses in the quake-
affected provinces. This can be interpreted as the response of those who possess more
information than the general public on the culprits for the poorly constructed buildings
23
which collapsed, and for the poor and corruption-tainted relief efforts. Among the
incumbent parties, the MHP appears to have paid the highest price. Even though the party
controlled virtually none of the municipalities in the area, it was in charge of the relief.
Thus its punishment can be attributed to its poor and corrupt performance in providing
relief. Indeed an analysis of the coefficients of the dummy variables reveal that votes gained
by the MHP in Yalova and the GP in Sakarya, due to circumstances discussed above,
reduced the votes that would have gone to the AKP. It appears that voters distinguish
incumbent politicians who delivered from those who did not. In a recent paper, Cole et al.
(2012) find that in India, fewer voters punish a ruling party when it responds vigorously to a
disaster. The results obtained here is consistent with that.
Interestingly, the DSP, which had no mayors in the quake-ravaged cities, and was
not directly involved with disaster relief, suffered only a negligible amount of extra loss.
The fact that three parties which controlled the local administrations in the area, the ANAP,
DYP and CHP were all dealt relatively high doses of punishment can be taken as an
indication that facilitating the construction of defective buildings and profiting from it
angered the voters. Because there are no parties which controlled local governments but not
served in central government, we are unable to assess relative blame placed by voters on the
central and local governments. A survey conducted by Adaman and Çarkoğlu (2001)
however show that, in general, urban dwellers in Turkey, perceive central and local
governments to be both corrupt but the former be more corrupt. Our results do not
contradict this finding.

24
5. Conclusions
Corruption usually makes little difference in the fortunes of politicians. Some recent
studies suggest that it takes more than just exposure of corruption to get the voters to react.
Politicians pay a significant price only when the corruption touches all political parties
across the board, is not accompanied by good governance, and competent non-corrupt
alternatives are available. Such conditions coalesced before the voters ousted all of the
parties from the parliament in Turkey in 2002. In hindsight, it appears that during the two
decades preceding the 2002 election, Turkish voters tried one-by-one all of the parties in the
parliament, individually and in groups. After experiencing bad governance and corruption
under each, they gradually deserted them. Only after all of the established parties got
tainted by corruption and poor governance, including the last two that were tried, they
reacted drastically. We pointed out that the corruption related to the 1999 earthquakes and
emergence of a new viable party as an alternative, played crucial roles in that.
Extracting as much information as possible from the limited data at hand, we were
able to show that, in casting their ballots in 2002, Turkish voters seem to have taken into
account the performance of all parties that have contributed to the magnification of the
earthquake disasters. Not just those ruling at the time of the earthquakes, but also other
parties which were in power when the substandard buildings, were built were held
accountable. Furthermore, the Turkish voters appear to have allocated the blame rationally,
taking into consideration the division of labor in the central government, and the relative
influences the parties had on local administrations. However, we should mention as a

25
caveat that the above interpretations are based on correlations. The links implied, while
convincing and consistent with data, cannot be asserted with confidence as being causal.
Also, we were not able to control for endogeneity fully.
Reaction of the voters to government incompetence and corruption was one of the
factors which resulted in the emergence of a new party system. In 2002, more than half of
the voters cast their ballots for a party different than the one they chose in 1999. Two new
parties formed shortly before the election received more than two fifths of the votes.
Another party, which was left outside the parliament during 1999-2002, received about a
fifth of the votes, more than doubling its share in the previous election. Votes moved from
the FP, MHP, ANAP and DYP to the AKP, from the DSP to the CHP, DYP and GP and
from the DSP and ANAP to the DYP. Looking from another vantage point, the AKP
captured almost all of the far-right Islamist, about half of the far-right nationalist, and more
than half of the center-right votes in 2002. Transformation of the AKP from Islamist to
conservative democrat, combined with other center-right parties deserting their traditional
anti-establishment positions, played an important role in this but so did the corruption and
incompetence exhibited by other parties. The earthquake-related corruption and
incompetence which tainted all established parties provided the spark that caused the
structural break in the political system.
26
References
Adaman, F. and Çarkoğlu, A. 2001. “Perceptions of central and local governments’
engagement in corruptive activities: the case of Turkey.” Working Paper No. 0103,
Economic Research Forum (ERF), Cairo, Egypt.
Adserà, A., Boix, C. and Payne, M. 2003. “Are you being served? Political accountability
and governmental performance.” Journal of Law, Economics and Organization, 19, 445–
490.
Aizenman, J. and Kendall J. 2011. “The internationalization of venture capital.” Journal of
Economic Studies, 39, 488-511.
Akarca, A. T. 2011. “A prediction for AKP’s nationwide vote share in the 12 June 2011
Turkish parliamentary election.” İktisat İşletme ve Finans, 26 (302), 53-74.
Akarca, A. T. 2010. “Analysis of the 2009 Turkish election results from an economic voting
perspective.” European Research Studies Journal, 13 (3), 3-38.
Akarca, A. T. and Başlevent, C. 2011 “Persistence in Regional Voting Patterns in Turkey
During a Period of Major Political Realignment.” European Urban and Regional Studies,
18, 184-202.
Akarca A. T. and Başlevent C. 2009. “Inter-party Vote Movements in Turkey: The Sources
of AKP Votes in 2007.” İktisat İşletme ve Finans, 24 (285), 32-47.

27
Akarca, A. T. and Tansel, A. 2009. ”Social, Political and Economic Determinants of
Turkish Voter Choice in the 2002 Parliamentary Election.” Working Paper No. 459,
Economic Research Forum (ERF), Cairo, Egypt.
Akarca, A. T. and Tansel, A. 2007. ”Social and economic determinants of Turkish voter
choice in the 1995 parliamentary election.” Electoral Studies, 26, 633-647.
Akarca, A. T. and Tansel, A. 2006. “Economic performance and political outcomes: an
analysis of the Turkish parliamentary and local election results between 1950 and 2004.”
Public Choice, 129, 77-105.
Alesina, A. and Weder, B. 2002. “Do corrupt governments receive less foreign aid?”
American Economic Review, 92, 1126-1137.
Anbarci, N., Escalares, M. and Register, C. 2006. “Traffic fatalities and public sector
corruption.” Kyklos, 59, 327-344.
Azfar, O. and Gurgur, T. 2008. “Does corruption affect health outcomes in the Philippines?”
Economics of Governance, 9, 197–244.
Bahmani-Oskooee, M. and Goswami, G. 2005. “The impact of corruption on the black
market premium.” Southern Economic Journal, 71, 483-493.
Başlevent, C. and Akarca A. T. 2009. “Micro Evidence on Inter-Party Vote Movements in
Turkey: Who Voted for AKP in 2002?” Paper presented at the 5th ECPR General
Conference, Potsdam, Germany, 10-12 September.
Başlevent, C., Kirmanoğlu, H. and Şenatalar, B. 2005. “Empirical investigation of party
preferences and economic voting in Turkey.” European Journal of Political Research, 44,
547-562.

28
Başlevent, C., Kirmanoğlu, H. and Şenatalar, B. 2004. “Voter profiles and fragmentation in
the Turkish party system.” Party Politics, 10, 307–324.
Besley, T. and Burgess, R. 2002. “The political economy of government responsiveness:
theory and evidence from India.” Quarterly Journal of Economics, 117, 1415–1451.
Blackburn, K., Bose, N. and Haque, M. E. 2010. “Endogenous corruption in economic
development.” Journal of Economic Studies, 37, 4-25.
Brunetti, A. and Weder, B. 2003. “A free press is bad news for corruption.” Journal of
Public Economics, 87, 1801–1824.
Chang, E. C. C., Golden, M. A. and Hill, S. J. 2010. “Legislative malfeasance and political
accountability.” World Politics, 62, 177-220.
Chong, A., De La O, A. L., Karlan, D. and Wantchekon, L. 2011. “Looking beyond the
incumbent: the effects of exposing corruption on electoral outcomes.” Working Paper No.
17679, National Bureau of Economic Research (NBER), Cambridge, Massachusetts.
Cole, S., Healy A., and Werker, E. 2012. “Do voters demand responsive governments?
Evidence from Indian disaster relief.” Journal of Development Economics, 97, 167–181.
Costas-Pérez, E, Solé-Ollé, A. and Sorribas-Navarro, P. 2012. “Corruption scandals, voter
information, and accountability.” European Journal of Political Economy, 28, 469-484.
Çağaptay, S. 2002. “The November 2002 elections and Turkey’s new political era.” Middle
East Review of International Affairs, 6, 42-48.
Çarkoğlu, A. 2002. “Turkey’s November 2002 elections: a new beginning?” Middle East
Review of International Affairs, 6, 30-41.
29
De la Croix, D, and Delavallade C. 2009. “Growth, public investment and corruption with
failing institutions.” Economics of Governance, 10, 187-219.
Dimock, M. A. and Jacobson, G. C. 1995. “Checks and choices: the House Bank scandal’s
impact on voters in 1992.” Journal of Politics, 57, 1143–1159.
Drury, A. C., Krieckhaus, J. and Lusztig, M. 2006. “Corruption, democracy and economic
growth.” International Political Science Review, 27, 121-136.
Escaleras, M., Anbarci, N. and Register C. A. 2007. “Public sector corruption and major
earthquakes: a potential deadly interaction.” Public Choice, 132, 209-230.
Escaleras, M., Lin, S. and Register, C. 2010. “Freedom of information acts and public
sector corruption.” Public Choice, 145, 435-460.
Fernández-Vázquez, P. and Rivero, G. 2011. “Electoral consequences of corruption charges
in Andalucia (Spain), 2003-2007.” Unpublished manuscript.
Ferraz, C. and Finan, F. 2008. “Exposing corrupt politicians: the effect of Brazil’s publicly
released audits on electoral outcomes.” Quarterly Journal of Economics, 123, 703–745.
Freckleton, M., Wright, A. and Craigwell, R. 2012. “Economic growth, foreign direct
investment and corruption in developed and developing countries.” Journal of Economic
Studies, 39, 639-652.
Freille, S. M., Haque, E. and Kneller, R. 2007. “A contribution to the empirics of press
freedom and corruption.” European Journal of Political Economy, 23, 838–862.
Gentzkow, M., Glaeser, E. L. and Goldin, C. 2004. “The rise of the fourth estate: how
newspapers became informative and why it mattered.” In Glaeser, E. L. and Goldin, C.
(eds.), Corruption and reform: lessons from America’s economic history. Chicago:
30
University of Chicago Press.
Golden, M. A. 2006. “Some puzzles of political corruption in modern advanced
democracies.” Paper presented at the annual meeting of the Japan Political Science
Association, 29 December 2006, Tokyo, Japan.
Green, P. 2005. “Disaster by design: corruption, construction and catastrophe.” British
Journal of Criminology, 45, 528-546.
Habib, M. and Zurawicki, L. 2002. “Corruption and direct foreign investment.” Journal of
International Business Studies, 33, 291-307.
Henderson, J. V. and Kuncoro, A. 2011. “Corruption and local democratization in
Indonesia: the role of Islamic parties.” Journal of Development Economics, 94, 164–180.
Johnson, N. D., La Fountain, C. L. and Yamarik, S. 2011. “Corruption is bad for growth
(even in the United States).” Public Choice, 147, 377-393.
Kholdy, S. and Sohrabian, A. 2008. “Foreign direct investment, financial markets, and
political corruption.” Journal of Economic Studies, 35, 486-500.
Kinzer, S. 2001. “Turkey’s political earthquake.” Middle East Quarterly, 20, 41-48.
Klasnja, M. and Tucker, J. 2013. “The Economy, Corruption, and the Vote: Evidence from
Experiments in Sweden and Moldova.” Electoral Studies, 32, 536–543.
Lederman, D. Loayza, N. V. and Soares, R. R. 2005. “Accountability and corruption:
political institutions matter.” Economics and Politics, 17, 1–35.
Lewis-Beck, M. S. and Paldam, M. 2000. “Economic voting: an introduction.” Electoral
Studies, 19, 113-121.
31
Lewis-Beck, M. S. and Stegmaier, M. 2008. “The economic vote in transitional
democracies.” Journal of Elections, Public Opinion and Parties, 18, 303–323.
Lewis-Beck, M. S. and Stegmaier, M. 2007. “Economic models of voting.” In R. Dalton and
H. Klingemann (eds.), The Oxford Handbook of Political Behavior, 518-537. Oxford:
Oxford University Press.
Lewis-Beck, M. S. and Stegmaier, M. 2000. “Economic determinants of electoral
outcomes.” Annual Review of Political Science, 3, 183-219.
Manzetti, L. and Wilson, C. J. 2007. “Why do corrupt governments maintain public
support?” Comparative Political Studies, 40, 949-970.
Mauro, P. 1997. “The effects of corruption on growth, investment and government
expenditure: a cross-country analysis.” In Elliot, K. A. (ed.), Corruption and Global
Economy, 83-107, Institute for International Economics: Washington, D.C.
Mauro, P. 1995. “Corruption and growth.” Quarterly Journal of Economics, 110, 681-712.
Méon, P. and Sekkat, K. 2005. “Does corruption grease or sand the wheels of growth.”
Public Choice, 122, 69-97.
Mo, P. 2001. “Corruption and economic growth.” Journal of Comparative Economics, 29,
66-79.
Murphy, K., Shleifer, A. and Vishny, R. 1993. “Why is rent-seeking so costly to growth?”
American Economic Review, 83, 409-414.
Murphy, K., Shleifer, A. and Vishny, R. 1991. “The allocation of talent: implications for
growth.” Quarterly Journal of Economics, 106, 503-530.
32
Öniş, Z. 2006. “Globalization and party transformation: Turkey’s Justice and Development
Party in perspective.” In P. Burnell (ed.), Globalizing Democracy: Party Politics in
Emerging Democracies, 122-140, London: Routledge.
Öniş, Z. and Keyman, E. F. 2003. “A new path emerges.” Journal of Democracy, 14, 95-
107.
Özel, S. 2003. “Turkey at the polls: after the tsunami,” Journal of Democracy, 14, 80-94.
Özmen, B. 2000a. “17 Ağustos 1999 İzmit körfezi depreminin hasar durumu (rakamsal
verilerle)” (Damage caused by 17 August 1999 Gulf of İzmit earthquake: quantitative data),
report number TDV/DR 010-53, Türkiye Deprem Vakfı, Ankara.
Özmen, B. 2000b. “12 Kasım 1999 Düzce depreminin konut ve işyeri hasarları (Rakamsal
Verilerle),” (Residential and commercial building damages caused by 12 November 1999
Düzce earthquake). In Özmen, B. and Bağcı B. (eds), 12 Kasım Düzce depremi raporu
(Report on 12 November 1999 Düzce earthquake, pp. 155-214), Ankara: Bayındırlık ve
İskan Bakanlığı, Afet İşleri Genel Müdürlüğü, Deprem Araştırma Dairesi.
Pellegrini, L. and Gerlagh, R. 2008. “Causes of corruption: a survey of cross-country
analyses and extended results.” Economics of Governance, 9, 245-263.
Pellegrini, L. and Gerlagh, R. 2004. “Corruption effects on growth and its transmission
channels.” Kyklos, 57, 429-456.
Peters, J. G. and Welch, S. 1980. “The effects of charges of corruption on voting behavior in
congressional elections.” American Political Science Review, 74, 697–708.
Pierdzioch, C. and Emrich, E. 2013. “A note on corruption and national Olympic success.”
Atlantic Economic Journal, 41, 405–411.

33
Ratbek, D. 2014. “Corruption and growth: The role of governance, public spending, and
economic development.” Economic Modelling, 37, 202–215.
Reed, S. R. 2005. “Japan: haltingly toward a two-party system.” In Gallagher, M. and
Mitchell, P. (eds.), The Politics of Electoral Systems (pp. 277-293), Oxford: Oxford
University Press.
Rousseeuw, P.J. 1984. “Least median of squares regression.” Journal of the American
Statistical Association, 79, 871–880.
Rousseeuw, P.J. and Van Driessen, K. 2000. “An algorithm for positive-breakdown
regression based on concentration steps.” In W. Gaul, O. Opitz, and M. Schader (eds.), Data
Analysis: Scientific Modeling and Practical Application (pp. 335–346). New York:
Springer-Verlag.
SAS. 2008. SAS/STAT 9.2 User’s Guide. Cary, North Carolina: SAS Institute Inc.
Schleiter, P. and Voznaya, A. M. 2014. “Party system competitiveness and corruption.”
Party Politics, forthcoming.
Stockemer, D. 2013. “Corruption and turnout in presidential elections: A macro-level
quantitative analysis.” Politics and Policy, 41, 189-212.
Tanzi, V. and Davoodi, H. 1997. “Corruption, public investment and growth.” Working
Paper No. 97/139, International Monetary Fund, Washington, D.C.
Teles, V. K. 2007. “Institutional quality and endogenous economic growth.” Journal of
Economic Studies, 34, 29-41.
Welch, S. and Hibbing, J. R. 1997. “The effects of charges of corruption on voting behavior
in congressional elections, 1982–1990.” Journal of Politics, 59, 226–239.

34
Zaman, A., Rousseeuw, P.J. and Orhan, M. 2001. “Econometric applications of high-
breakdown robust regression techniques.” Econometrics Letters, 71, 1–8.
Zelekha, Y and Sharabi, E. 2012. “Corruption, institutions and trade. Economics of
Governance, 13, 169–192.
Zellner, A. 1962. “An Efficient Method of Estimating Seemingly Unrelated Regressions and
Tests for Aggregation Bias,” Journal of the American Statistical Association, 57, 348-368
35
Table 1: Property damage caused by the 1999 earthquakes
PROVINCES
Residences and businesses with heavy damage
Total
Per ten thousand people
Bolu
2750
101.61
Bursa
128
0.60
Düzce
15134
481.57
Eskişehir
111
1.57
İstanbul
3306
3.30
Kocaeli
41041
340.28
Sakarya
29701
392.78
Yalova
14473
858.46
Zonguldak
114
1.85
Notes: In 1999 the administrative division of the country was slightly different. The table is based on the structure prevailing in 2002.
Source: Figures on the first column are provided by the General Directorate of Disaster Affairs (Ministry of Public Works and Settlement, the Republic of Turkey) and reflects the most recent revision dated 22 April 2003. The second column is obtained by dividing the figures in the first column by the province’s 2000 population given by the Turkish Statistical Institute (Prime Ministry, the Republic of Turkey) and then multiplying by 10,000.
36
Table 2:
The ruling parties between 1983 and 2002
Notes: In paranthesis are the Turkish acronyms of political parties. Between November 1991 and February 1995 the Social Democratic Populist Party (SHP) was one of the two ruling parties. It joined the Republican People’s Party (CHP) in February 1995 after which the coalition government continued until March 1996 with the latter party as the official partner. The Democratic Left Party (DSP), Nationalist Action Party (MHP) and Motherland Party (ANAP) were the incumbents at the time of the earthquakes.
Source: Turkish Grand National Assembly web site (www.tbmm.gov.tr/kutuphane/hukumetler.html).
POLITICAL PARTIES
PERIODS
PRIME
MINISTER FROM THE
PARTY?
COALITION GOVERNMENT?
Motherland Party (ANAP)
Dec. 1983 – Nov. 1991 Mar. 1996 – June 1996 June 1997 – Jan. 1999 May 1999 – Nov. 2002
YES YES YES NO
NO YES YES YES
True Path Party (DYP)
Nov. 1991 – Mar. 1996 Mar. 1996 – June 1997
YES NO
YES YES
Republican People’s Party (CHP) / Social Democratic Populist Party (SHP)
Nov. 1991 – Mar. 1996
NO
YES
Welfare Party (RP)
June 1996 – June 1997
YES
YES
Democratic Left Party (DSP)
June 1997 – Jan. 1999 Jan. 1999 – Nov. 2002
NO YES
YES YES
Nationalist Action Party (MHP)
May 1999 – Nov. 2002
NO
YES
37
Table 3: Party affiliations of mayors of district centers in which at least 1% of the
residences suffered heavy earthquake damage in 1999
POLITICAL PARTIES
Number of Mayors
1989-1994
1994-1999
Motherland Party (ANAP)
7
13
True Path Party (DYP)
8
3
Republican People’s Party (CHP) & Social Democratic Populist Party (SHP)
11
2
Welfare Party (RP)
0
8
Democratic Left Party (DSP)
0
0
Nationalist Action Party (MHP)
0
1
TOTAL
26
27
Notes: District centers with more than 1 percent heavy damage are the following: Bolu, Düzce, Akçakoca Cumayeri, Çilimli, Gölyaka, Gümüşova, Kaynaşlı, Avcılar, Büyükçekmece, İzmit, Gölcük, Karamürsel, Körfez, Adapazarı, Akyazı, Geyve, Hendek, Karapürçek, Karasu, Kocaali, Sapanca, Yalova, Altınova, Çiftlikköy, Çınarcık and Termal. Between 1989 and 2002 the administrative division of the country has changed. The table is based on the structure prevailing in 2002. Termal was not within the boundaries of any municipality at the time of the 1989 election. Party affiliations of some mayors changed between two elections. The table reflects the distributions immediately after the elections in 1984 and 1989. In paranthesis are the Turkish acronyms of political parties. The Republican People’s Party was closed between 1983 and 1993. This party and the Social Democratic Populist Party entered the 1994 local elections seperately but they merged in 1995.
Source: Compiled by authors, using the data provided by the Turkish Statistical Institute (Prime Ministry, the Republic of Turkey) on the results of the 1984 and 1989 elections, and by Özmen (2000a and 2000b) on the property damage caused by the 1999 earthquakes.
38
Table 4: Descriptive Statistics
Independent Variables Mean Standard Deviation Minimum Maximum
AKP2002 28.59 9.05 7.07 44.22
ANAP2002 4.19 1.70 1.04 8.05
CHP2002 13.81 5.48 4.25 26.86
DSP2002 1.00 0.56 0.27 3.23
DYP2002 9.11 4.15 1.27 19.06
GP2002 5.12 3.70 0.84 20.80
MHP2002 7.60 2.56 3.16 15.74
NV2002 19.66 5.23 10.23 28.80
ANAP1999 10.72 3.46 4.52 19.32
CHP1999 7.22 3.14 2.33 16.34
DSP1999 17.13 8.90 3.00 39.91
DYP1999 11.81 3.72 4.38 21.57
FP1999 12.55 5.85 2.93 26.48
MHP1999 18.48 6.22 8.08 33.80
NVOTE1999 11.30 3.37 5.54 20.02
S 5.28 0.52 4.32 6.83
U 0.57 0.12 0.36 0.91
W 0.14 0.04 0.06 0.23
Q 0.36 1.40 0 8.58
G -7.63 6.10 -20.10 9.73
39
Notes: 2002 vote shares of the Justice and Development Party (AKP), Republican People’s Party (CHP), Young Party (GP), Democratic Left Party (DSP), Nationalist Action Party (MHP), Motherland Party (ANAP), True Path Party (DYP) and those not voted are represented by the symbols: AKP2002, CHP2002, GP2002, DSP2002, MHP2002, ANAP2002, DYP2002 and NV2002, respectively. Similarly, the 1999 vote shares of the Virtue Party (FP), CHP, DSP, MHP, ANAP, DYP and those not voted are represented by the symbols: FP1999, CHP1999, DSP1999, MHP1999, ANAP1999, DYP1999 and NV1999, respectively. S, U, and W represent the mean years of schooling, the urbanization rate, and the proportion of women in non-agricultural employment, respectively. G stands for the growth rate of per capita real GDP in 2001. Q stands for the number of residences and businesses which suffered heavy damage in the 1999 earthquakes, per hundred people. Sources of data: The vote shares of political parties are computed using the data provided by the Turkish Statistical Institute (Prime Ministry, the Republic of Turkey) on the results of the 1999 and 2002 elections. S, U, and W variables are computed utilizing the 2000 Census data provided by the Turkish Statistical Institute. In computing mean years of schooling (S) for each province, 15, 11, 8, and 5 years of schooling are attributed respectively, to university, high school, middle school, and primary school graduates in the province. Two years’ worth of schooling is assumed for those who are literate but not a graduate of any school. The Q variable is constructed by dividing the second column of Table 1 by 100.
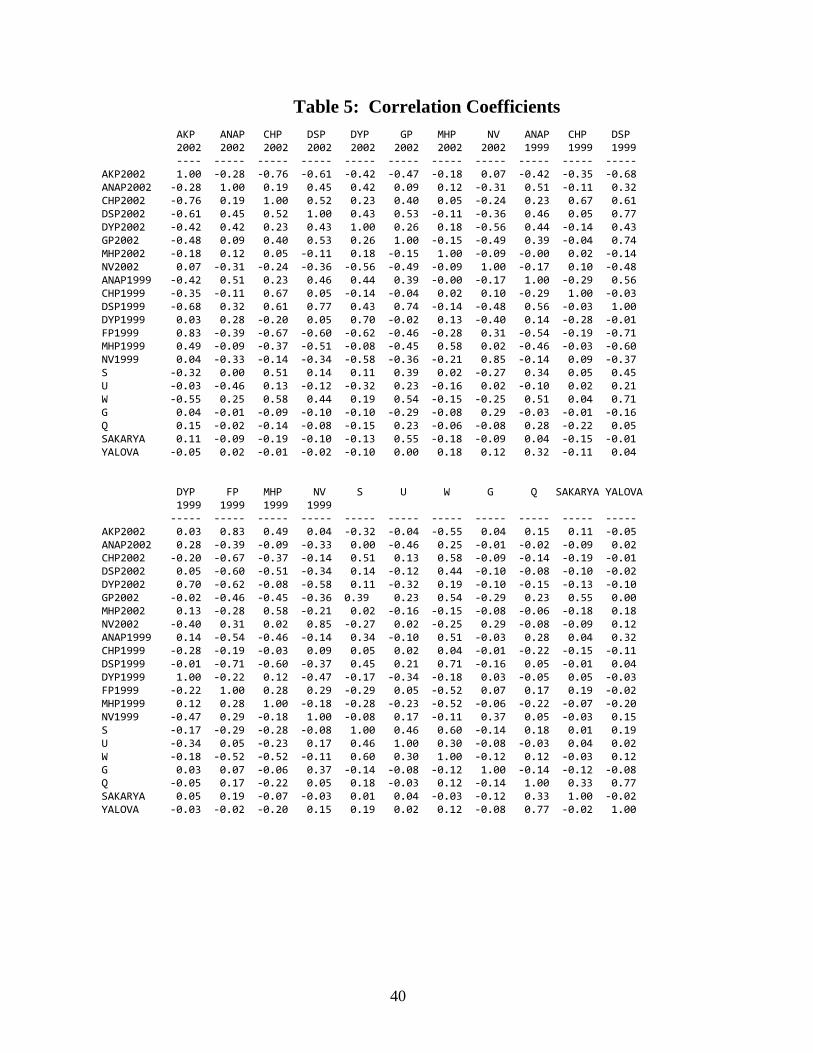
40
Table 5: Correlation Coefficients
AKP ANAP CHP DSP DYP GP MHP NV ANAP CHP DSP 2002 2002 2002 2002 2002 2002 2002 2002 1999 1999 1999 ---- ----- ----- ----- ----- ----- ----- ----- ----- ----- ----- AKP2002 1.00 -0.28 -0.76 -0.61 -0.42 -0.47 -0.18 0.07 -0.42 -0.35 -0.68 ANAP2002 -0.28 1.00 0.19 0.45 0.42 0.09 0.12 -0.31 0.51 -0.11 0.32 CHP2002 -0.76 0.19 1.00 0.52 0.23 0.40 0.05 -0.24 0.23 0.67 0.61 DSP2002 -0.61 0.45 0.52 1.00 0.43 0.53 -0.11 -0.36 0.46 0.05 0.77 DYP2002 -0.42 0.42 0.23 0.43 1.00 0.26 0.18 -0.56 0.44 -0.14 0.43 GP2002 -0.48 0.09 0.40 0.53 0.26 1.00 -0.15 -0.49 0.39 -0.04 0.74 MHP2002 -0.18 0.12 0.05 -0.11 0.18 -0.15 1.00 -0.09 -0.00 0.02 -0.14 NV2002 0.07 -0.31 -0.24 -0.36 -0.56 -0.49 -0.09 1.00 -0.17 0.10 -0.48 ANAP1999 -0.42 0.51 0.23 0.46 0.44 0.39 -0.00 -0.17 1.00 -0.29 0.56 CHP1999 -0.35 -0.11 0.67 0.05 -0.14 -0.04 0.02 0.10 -0.29 1.00 -0.03 DSP1999 -0.68 0.32 0.61 0.77 0.43 0.74 -0.14 -0.48 0.56 -0.03 1.00 DYP1999 0.03 0.28 -0.20 0.05 0.70 -0.02 0.13 -0.40 0.14 -0.28 -0.01 FP1999 0.83 -0.39 -0.67 -0.60 -0.62 -0.46 -0.28 0.31 -0.54 -0.19 -0.71 MHP1999 0.49 -0.09 -0.37 -0.51 -0.08 -0.45 0.58 0.02 -0.46 -0.03 -0.60 NV1999 0.04 -0.33 -0.14 -0.34 -0.58 -0.36 -0.21 0.85 -0.14 0.09 -0.37 S -0.32 0.00 0.51 0.14 0.11 0.39 0.02 -0.27 0.34 0.05 0.45 U -0.03 -0.46 0.13 -0.12 -0.32 0.23 -0.16 0.02 -0.10 0.02 0.21 W -0.55 0.25 0.58 0.44 0.19 0.54 -0.15 -0.25 0.51 0.04 0.71 G 0.04 -0.01 -0.09 -0.10 -0.10 -0.29 -0.08 0.29 -0.03 -0.01 -0.16 Q 0.15 -0.02 -0.14 -0.08 -0.15 0.23 -0.06 -0.08 0.28 -0.22 0.05 SAKARYA 0.11 -0.09 -0.19 -0.10 -0.13 0.55 -0.18 -0.09 0.04 -0.15 -0.01 YALOVA -0.05 0.02 -0.01 -0.02 -0.10 0.00 0.18 0.12 0.32 -0.11 0.04 DYP FP MHP NV S U W G Q SAKARYA YALOVA 1999 1999 1999 1999 ----- ----- ----- ----- ----- ----- ----- ----- ----- ----- ----- AKP2002 0.03 0.83 0.49 0.04 -0.32 -0.04 -0.55 0.04 0.15 0.11 -0.05 ANAP2002 0.28 -0.39 -0.09 -0.33 0.00 -0.46 0.25 -0.01 -0.02 -0.09 0.02 CHP2002 -0.20 -0.67 -0.37 -0.14 0.51 0.13 0.58 -0.09 -0.14 -0.19 -0.01 DSP2002 0.05 -0.60 -0.51 -0.34 0.14 -0.12 0.44 -0.10 -0.08 -0.10 -0.02 DYP2002 0.70 -0.62 -0.08 -0.58 0.11 -0.32 0.19 -0.10 -0.15 -0.13 -0.10 GP2002 -0.02 -0.46 -0.45 -0.36 0.39 0.23 0.54 -0.29 0.23 0.55 0.00 MHP2002 0.13 -0.28 0.58 -0.21 0.02 -0.16 -0.15 -0.08 -0.06 -0.18 0.18 NV2002 -0.40 0.31 0.02 0.85 -0.27 0.02 -0.25 0.29 -0.08 -0.09 0.12 ANAP1999 0.14 -0.54 -0.46 -0.14 0.34 -0.10 0.51 -0.03 0.28 0.04 0.32 CHP1999 -0.28 -0.19 -0.03 0.09 0.05 0.02 0.04 -0.01 -0.22 -0.15 -0.11 DSP1999 -0.01 -0.71 -0.60 -0.37 0.45 0.21 0.71 -0.16 0.05 -0.01 0.04 DYP1999 1.00 -0.22 0.12 -0.47 -0.17 -0.34 -0.18 0.03 -0.05 0.05 -0.03 FP1999 -0.22 1.00 0.28 0.29 -0.29 0.05 -0.52 0.07 0.17 0.19 -0.02 MHP1999 0.12 0.28 1.00 -0.18 -0.28 -0.23 -0.52 -0.06 -0.22 -0.07 -0.20 NV1999 -0.47 0.29 -0.18 1.00 -0.08 0.17 -0.11 0.37 0.05 -0.03 0.15 S -0.17 -0.29 -0.28 -0.08 1.00 0.46 0.60 -0.14 0.18 0.01 0.19 U -0.34 0.05 -0.23 0.17 0.46 1.00 0.30 -0.08 -0.03 0.04 0.02 W -0.18 -0.52 -0.52 -0.11 0.60 0.30 1.00 -0.12 0.12 -0.03 0.12 G 0.03 0.07 -0.06 0.37 -0.14 -0.08 -0.12 1.00 -0.14 -0.12 -0.08 Q -0.05 0.17 -0.22 0.05 0.18 -0.03 0.12 -0.14 1.00 0.33 0.77 SAKARYA 0.05 0.19 -0.07 -0.03 0.01 0.04 -0.03 -0.12 0.33 1.00 -0.02 YALOVA -0.03 -0.02 -0.20 0.15 0.19 0.02 0.12 -0.08 0.77 -0.02 1.00

41
Notes: 2002 vote shares of the Justice and Development Party (AKP), Republican People’s Party (CHP), Young Party (GP), Democratic Left Party (DSP), Nationalist Action Party (MHP), Motherland Party (ANAP), True Path Party (DYP) and those not voted are represented by the symbols: AKP2002, CHP2002, GP2002, DSP2002, MHP2002, ANAP2002, DYP2002 and NV2002, respectively. Similarly, the 1999 vote shares of the Virtue Party (FP), CHP, DSP, MHP, ANAP, DYP and those not voted are represented by the symbols: FP1999, CHP1999, DSP1999, MHP1999, ANAP1999, DYP1999 and NV1999, respectively. S, U, and W represent the mean years of schooling, the urbanization rate, and the proportion of women in non-agricultural employment, respectively. G stands for the growth rate of per capita real GDP in 2001. Q stands for the number of residences and businesses which suffered heavy damage in the 1999 earthquakes, per hundred people. SAKARYA and YALOVA are dummy variables which take on the value of one in case of the named province and zero otherwise.
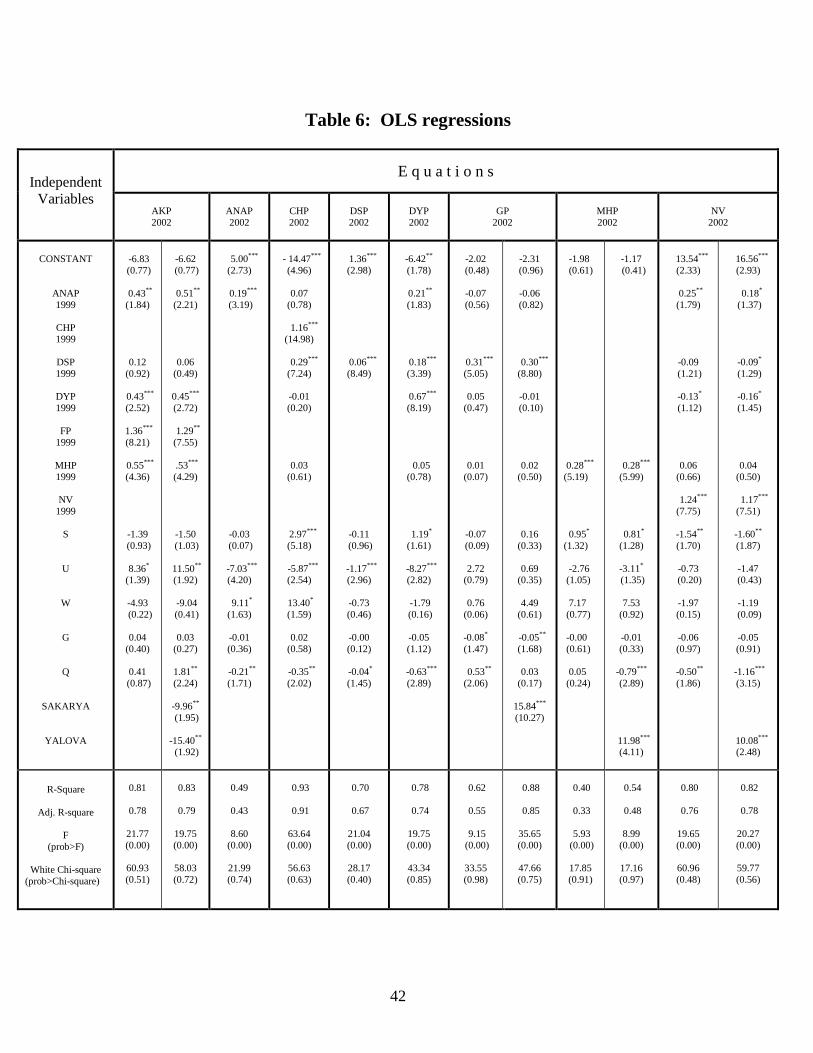
42
Table 6: OLS regressions
Independent Variables
E q u a t i o n s
AKP 2002
ANAP 2002
CHP 2002
DSP 2002
DYP 2002
GP
2002
MHP 2002
NV
2002
CONSTANT
ANAP 1999
CHP 1999
DSP 1999
DYP 1999
FP
1999
MHP 1999
NV
1999
S
U
W
G
Q
SAKARYA
YALOVA
-6.83 (0.77)
0.43** (1.84)
0.12 (0.92)
0.43*** (2.52)
1.36*** (8.21)
0.55*** (4.36)
-1.39 (0.93)
8.36* (1.39)
-4.93
(0.22)
0.04 (0.40)
0.41
(0.87)
-6.62
(0.77)
0.51** (2.21)
0.06 (0.49)
0.45*** (2.72)
1.29** (7.55)
.53*** (4.29)
-1.50 (1.03)
11.50** (1.92)
-9.04 (0.41)
0.03
(0.27)
1.81** (2.24)
-9.96** (1.95)
-15.40** (1.92)
5.00***
(2.73)
0.19*** (3.19)
-0.03 (0.07)
-7.03***
(4.20)
9.11* (1.63)
-0.01 (0.36)
-0.21** (1.71)
- 14.47***
(4.96)
0.07 (0.78)
1.16*** (14.98)
0.29***
(7.24)
-0.01 (0.20)
0.03 (0.61)
2.97*** (5.18)
-5.87***
(2.54)
13.40* (1.59)
0.02
(0.58)
-0.35** (2.02)
1.36***
(2.98)
0.06*** (8.49)
-0.11 (0.96)
-1.17***
(2.96)
-0.73 (0.46)
-0.00 (0.12)
-0.04* (1.45)
-6.42** (1.78)
0.21** (1.83)
0.18*** (3.39)
0.67***
(8.19)
0.05 (0.78)
1.19* (1.61)
-8.27***
(2.82)
-1.79 (0.16)
-0.05 (1.12)
-0.63***
(2.89)
-2.02
(0.48)
-0.07 (0.56)
0.31*** (5.05)
0.05
(0.47)
0.01 (0.07)
-0.07 (0.09)
2.72
(0.79)
0.76 (0.06)
-0.08* (1.47)
0.53** (2.06)
-2.31
(0.96)
-0.06 (0.82)
0.30*** (8.80)
-0.01
(0.10)
0.02 (0.50)
0.16 (0.33)
0.69
(0.35)
4.49 (0.61)
-0.05** (1.68)
0.03
(0.17)
15.84*** (10.27)
-1.98 (0.61) 0.28*** (5.19) 0.95* (1.32) -2.76 (1.05) 7.17 (0.77) -0.00 (0.61) 0.05 (0.24)
-1.17
(0.41)
0.28*** (5.99)
0.81* (1.28)
-3.11* (1.35)
7.53
(0.92)
-0.01 (0.33)
-0.79*** (2.89)
11.98*** (4.11)
13.54***
(2.33)
0.25** (1.79)
-0.09 (1.21)
-0.13* (1.12)
0.06 (0.66)
1.24***
(7.75)
-1.54** (1.70)
-0.73
(0.20)
-1.97 (0.15)
-0.06 (0.97)
-0.50**
(1.86)
16.56***
(2.93)
0.18* (1.37)
-0.09* (1.29)
-0.16* (1.45)
0.04 (0.50)
1.17***
(7.51)
-1.60** (1.87)
-1.47
(0.43)
-1.19 (0.09)
-0.05 (0.91)
-1.16*** (3.15)
10.08*** (2.48)
R-Square
Adj. R-square
F (prob>F)
White Chi-square
(prob>Chi-square)
0.81
0.78
21.77 (0.00)
60.93 (0.51)
0.83
0.79
19.75 (0.00)
58.03 (0.72)
0.49
0.43
8.60
(0.00)
21.99 (0.74)
0.93
0.91
63.64 (0.00)
56.63 (0.63)
0.70
0.67
21.04 (0.00)
28.17 (0.40)
0.78
0.74
19.75 (0.00)
43.34 (0.85)
0.62
0.55
9.15
(0.00)
33.55 (0.98)
0.88
0.85
35.65 (0.00)
47.66 (0.75)
0.40
0.33
5.93
(0.00)
17.85 (0.91)
0.54
0.48
8.99
(0.00)
17.16 (0.97)
0.80
0.76
19.65 (0.00)
60.96 (0.48)
0.82
0.78
20.27 (0.00)
59.77 (0.56)
43
Notes: The sample includes 61 provinces, excluding the following 20 provinces: Ağrı, Bingöl, Bitlis, Diyarbakır, Hakkari, Kars, Mardin, Muş, Rize, Siirt, Tunceli, Şanlıurfa, Van, Bayburt, Batman, Şırnak, Bartın, Ardahan, Iğdır, and Osmaniye. Only 10 percent of the registered voters resided in the latter provinces in 2002. In 1999 the administrative division of the country was slightly different. The structure prevailing in 2002 is used. The equations are estimated using Ordinary Least Squares method, utilizing the REG procedure of SAS (2008) statistical package. The numbers in parantheses below the parameter estimates are the t-values in absolute value. A superscript with a single asterisk refers to significance at 10 percent level, a superscript with a double asterisk, to significance at 5 percent level, and a superscript with triple asterisk to significance at 1 percent level (in one-tail tests). 2002 vote shares of the Justice and Development Party (AKP), Republican People’s Party (CHP), Young Party (GP), Democratic Left Party (DSP), Nationalist Action Party (MHP), Motherland Party (ANAP), True Path Party (DYP) and those not voted are represented by the symbols: AKP2002, CHP2002, GP2002, DSP2002, MHP2002, ANAP2002, DYP2002 and NV2002, respectively. Similarly, the 1999 vote shares of the Virtue Party (FP), CHP, DSP, MHP, ANAP, DYP and those not voted are represented by the symbols: FP1999, CHP1999, DSP1999, MHP1999, ANAP1999, DYP1999 and NV1999, respectively. S, U, and W represent the mean years of schooling, the urbanization rate, and the proportion of women in non-agricultural employment, respectively. G stands for the growth rate of per capita real GDP in 2001, and Q for the number of residences and businesses which suffered heavy damage in the 1999 earthquakes, per hundred people. SAKARYA and YALOVA are dummy variables which take on the value of one in case of the named province and zero otherwise.
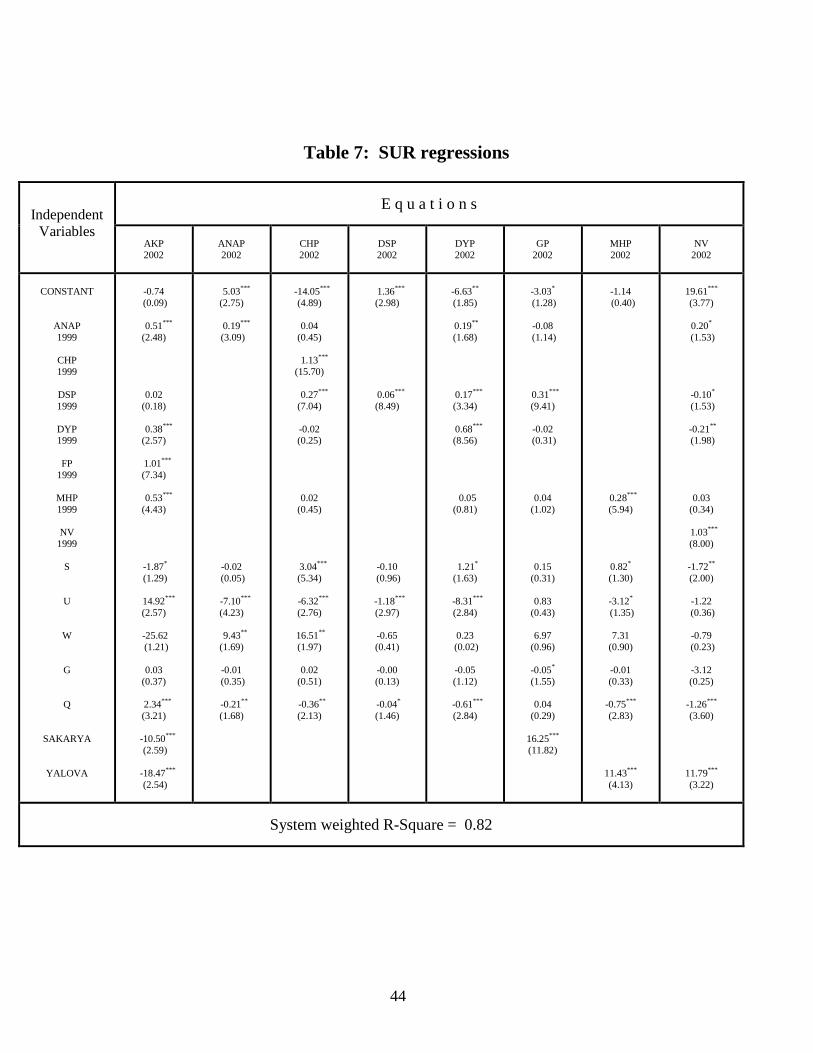
44
Table 7: SUR regressions
Independent Variables
E q u a t i o n s
AKP 2002
ANAP 2002
CHP 2002
DSP 2002
DYP 2002
GP
2002
MHP 2002
NV
2002
CONSTANT
ANAP 1999
CHP 1999
DSP 1999
DYP 1999
FP
1999
MHP 1999
NV
1999
S
U
W
G
Q
SAKARYA
YALOVA
-0.74
(0.09)
0.51*** (2.48)
0.02 (0.18)
0.38***
(2.57)
1.01*** (7.34)
0.53***
(4.43)
-1.87* (1.29)
14.92***
(2.57)
-25.62 (1.21)
0.03
(0.37)
2.34*** (3.21)
-10.50***
(2.59)
-18.47*** (2.54)
5.03***
(2.75)
0.19*** (3.09)
-0.02 (0.05)
-7.10***
(4.23)
9.43** (1.69)
-0.01
(0.35)
-0.21** (1.68)
-14.05***
(4.89)
0.04 (0.45)
1.13*** (15.70)
0.27***
(7.04)
-0.02 (0.25)
0.02 (0.45)
3.04*** (5.34)
-6.32***
(2.76)
16.51** (1.97)
0.02
(0.51)
-0.36** (2.13)
1.36***
(2.98)
0.06*** (8.49)
-0.10 (0.96)
-1.18***
(2.97)
-0.65 (0.41)
-0.00 (0.13)
-0.04* (1.46)
-6.63** (1.85)
0.19** (1.68)
0.17*** (3.34)
0.68***
(8.56)
0.05 (0.81)
1.21* (1.63)
-8.31***
(2.84)
0.23 (0.02)
-0.05 (1.12)
-0.61***
(2.84)
-3.03* (1.28)
-0.08
(1.14)
0.31*** (9.41)
-0.02
(0.31)
0.04 (1.02)
0.15 (0.31)
0.83
(0.43)
6.97 (0.96)
-0.05* (1.55)
0.04
(0.29)
16.25*** (11.82)
-1.14
(0.40)
0.28*** (5.94)
0.82* (1.30)
-3.12* (1.35)
7.31
(0.90)
-0.01 (0.33)
-0.75*** (2.83)
11.43*** (4.13)
19.61*** (3.77)
0.20*
(1.53)
-0.10* (1.53)
-0.21** (1.98)
0.03 (0.34)
1.03*** (8.00)
-1.72** (2.00)
-1.22
(0.36)
-0.79 (0.23)
-3.12 (0.25)
-1.26*** (3.60)
11.79*** (3.22)
System weighted R-Square = 0.82
45
Notes: The sample includes 61 provinces, excluding the following 20 provinces: Ağrı, Bingöl, Bitlis, Diyarbakır, Hakkari, Kars, Mardin, Muş, Rize, Siirt, Tunceli, Şanlıurfa, Van, Bayburt, Batman, Şırnak, Bartın, Ardahan, Iğdır, and Osmaniye. Only 10 percent of the registered voters resided in the latter provinces in 2002. In 1999 the administrative division of the country was slightly different. The structure prevailing in 2002 is used. The equations are estimated as system of seemingly unrelated regressions, utilizing the SUR procedure of SAS (2008) statistical package. The numbers in parantheses below the parameter estimates are the t-values in absolute value. A superscript with a single asterisk refers to significance at 10 percent level, a superscript with a double asterisk, to significance at 5 percent level, and a superscript with triple asterisk to significance at 1 percent level (in one-tail tests). 2002 vote shares of the Justice and Development Party (AKP), Republican People’s Party (CHP), Young Party (GP), Democratic Left Party (DSP), Nationalist Action Party (MHP), Motherland Party (ANAP), True Path Party (DYP) and those not voted are represented by the symbols: AKP2002, CHP2002, GP2002, DSP2002, MHP2002, ANAP2002, DYP2002 and NV2002, respectively. Similarly, the 1999 vote shares of the Virtue Party (FP), CHP, DSP, MHP, ANAP, DYP and those not voted are represented by the symbols: FP1999, CHP1999, DSP1999, MHP1999, ANAP1999, DYP1999 and NV1999, respectively. S, U, and W represent the mean years of schooling, the urbanization rate, and the proportion of women in non-agricultural employment, respectively. G stands for the growth rate of per capita real GDP in 2001. Q stands for the number of residences and businesses which suffered heavy damage in the 1999 earthquakes, per hundred people. SAKARYA and YALOVA are dummy variables which take on the value of one in case of the named province and zero otherwise.
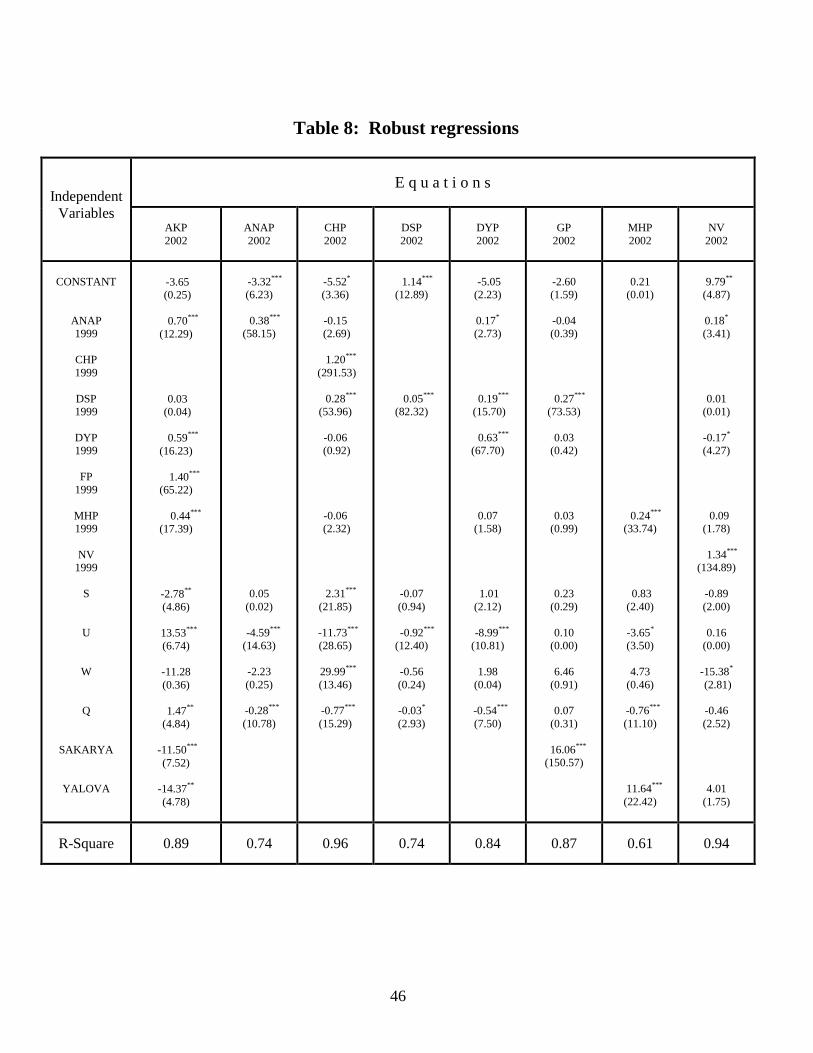
46
Table 8: Robust regressions
Independent Variables
E q u a t i o n s
AKP 2002
ANAP 2002
CHP 2002
DSP 2002
DYP 2002
GP
2002
MHP 2002
NV
2002
CONSTANT
ANAP 1999
CHP 1999
DSP 1999
DYP 1999
FP
1999
MHP 1999
NV
1999
S
U
W
Q
SAKARYA
YALOVA
-3.65 (0.25)
0.70***
(12.29)
0.03 (0.04)
0.59***
(16.23)
1.40*** (65.22)
0.44***
(17.39)
-2.78** (4.86)
13.53***
(6.74)
-11.28 (0.36)
1.47** (4.84)
-11.50***
(7.52)
-14.37** (4.78)
-3.32***
(6.23)
0.38*** (58.15)
0.05 (0.02)
-4.59*** (14.63)
-2.23 (0.25)
-0.28*** (10.78)
-5.52* (3.36)
-0.15
(2.69)
1.20*** (291.53)
0.28*** (53.96)
-0.06
(0.92)
-0.06 (2.32)
2.31*** (21.85)
-11.73***
(28.65)
29.99*** (13.46)
-0.77*** (15.29)
1.14*** (12.89)
0.05*** (82.32)
-0.07 (0.94)
-0.92***
(12.40)
-0.56 (0.24)
-0.03* (2.93)
-5.05 (2.23)
0.17* (2.73)
0.19*** (15.70)
0.63*** (67.70)
0.07 (1.58)
1.01 (2.12)
-8.99*** (10.81)
1.98
(0.04)
-0.54*** (7.50)
-2.60 (1.59)
-0.04 (0.39)
0.27*** (73.53)
0.03
(0.42)
0.03 (0.99)
0.23 (0.29)
0.10
(0.00)
6.46 (0.91)
0.07
(0.31)
16.06*** (150.57)
0.21
(0.01)
0.24*** (33.74)
0.83 (2.40)
-3.65* (3.50)
4.73
(0.46)
-0.76*** (11.10)
11.64*** (22.42)
9.79** (4.87)
0.18* (3.41)
0.01 (0.01)
-0.17* (4.27)
0.09 (1.78)
1.34*** (134.89)
-0.89 (2.00)
0.16
(0.00)
-15.38* (2.81)
-0.46 (2.52)
4.01 (1.75)
R-Square 0.89 0.74 0.96 0.74 0.84 0.87 0.61 0.94

47
Notes: The sample includes 61 provinces, excluding the following 20 provinces: Ağrı, Bingöl, Bitlis, Diyarbakır, Hakkari, Kars, Mardin, Muş, Rize, Siirt, Tunceli, Şanlıurfa, Van, Bayburt, Batman, Şırnak, Bartın, Ardahan, Iğdır, and Osmaniye. Only 10 percent of the registered voters resided in the latter provinces in 2002. In 1999, the administrative division of the country was slightly different. The structure prevailing in 2002 is used. The equations are estimated using the ROBUSTREG procedure of the SAS (2008) statistical package with METHOD=LTS (least trimmed squares) and FWLS (final weighted least squares) options. The following observations are picked by the algorithm as outliers: Adıyaman Gümüşhane and Kilis in the AKP equation, Antalya, Isparta, Kütahya, Karaman and Kırıkkale in the ANAP equation, Adıyaman, Denizli, Hatay, Isparta, Malatya, Zonguldak, Kırıkkale and Yalova in the CHP equation, Adıyaman, Edirne, Kastamonu, Kırklareli and Kilis in the DSP equation, Bilecik in the DYP equation, Artvin, Edirne and İzmir in the GP equation, Kırşehir and Mersin in the MHP equation, and Adıyaman, Çankırı, Erzurum, Kocaeli and Niğde,in the NV equation. The parameter values reported in the table are the final weighted least squares (FWLS) estimates. The numbers in parantheses below the parameter estimates are the chi-square values. A superscript with a single asterisk refers to significance at 10 percent level, a superscript with a double asterisk, to significance at 5 percent level, and a superscript with triple asterisk to significance at 1 percent level (in one-tail tests). 2002 vote shares of the Justice and Development Party (AKP), Republican People’s Party (CHP), Young Party (GP), Democratic Left Party (DSP), Nationalist Action Party (MHP), Motherland Party (ANAP), True Path Party (DYP) and those not voted are represented by the symbols: AKP2002, CHP2002, GP2002, DSP2002, MHP2002, ANAP2002, DYP2002 and NV2002, respectively. Similarly, the 1999 vote shares of the Virtue Party (FP), CHP, DSP, MHP, ANAP, DYP and those not voted are represented by the symbols: FP1999, CHP1999, DSP1999, MHP1999, ANAP1999, DYP1999 and NV1999, respectively. S, U, and W represent the mean years of schooling, the urbanization rate, and the proportion of women in non-agricultural employment, respectively. Q stands for the number of residences and businesses which suffered heavy damage in the 1999 earthquakes, per hundred people. SAKARYA and YALOVA are dummy variables which take on the value of one in case of the named province and zero otherwise.

48
FIGURE 1: PROVINCES WHICH SUFFERED HEAVY EARTHQUAKE DAMAGE IN 1999
Source: General Directorate of Disaster Affairs (Ministry of Public Works and Settlement, the Republic of Turkey)