Ernährung und Kachexie beim Tumorpatienten Das ...
61
Ernährung und Kachexie beim Tumorpatienten Das Aschenputtel der Hämato/Onkologie? 3. Medizinische Abteilung / Vorstand: Prim. Univ. Prof. Dr. Felix Keil / Seite 1
Transcript of Ernährung und Kachexie beim Tumorpatienten Das ...

Ernährung und Kachexie beim Tumorpatienten
Das Aschenputtel der Hämato/Onkologie?
3. Medizinische Abteilung / Vorstand: Prim. Univ. Prof. Dr. Felix Keil / Seite 1

Toxizität der Therapie Infektion
Kachexie
Katabolismus der konsumierenden Erkrankung
Obstruktion des Tumors 3. Medizinische Abteilung / Vorstand: Prim. Univ. Prof. Dr. Felix Keil / Seite 2
Tumorkachexie und prognostische Bedeutung
3. Medizinische Abteilung / Vorstand: Prim. Univ. Prof. Dr. Felix Keil / Seite 3

Die Tumorwachstum als Infiltrativer Prozess ist führt selten zum Tode
3. Medizinische Abteilung / Vorstand: Prim. Univ. Prof. Dr. Felix Keil / Seite 4

3. Medizinische Abteilung / Vorstand: Prim. Univ. Prof. Dr. Felix Keil / Seite 5

Tumorkachexie Kombination aus Mangelernährung, Verlust von Muskelmasse
und häufig systemischer Entzündungsreaktion: 1) Mangelernährung mit ungewolltem Gewichtsverlust von mind. 10
% des Ausgangsgewichts sowie Verlust von funktionellem Gewebe
2) Inflammation: Nachweis systemischer Entzündungsmarker, z. B. Anstieg von CRP und Abfall von Albumin
Führt zu Immobilisierung, Erschöpfung, Infektanfälligkeit und Bettlägrigkeit und vermehrter Therapieinduzierter Toxizität
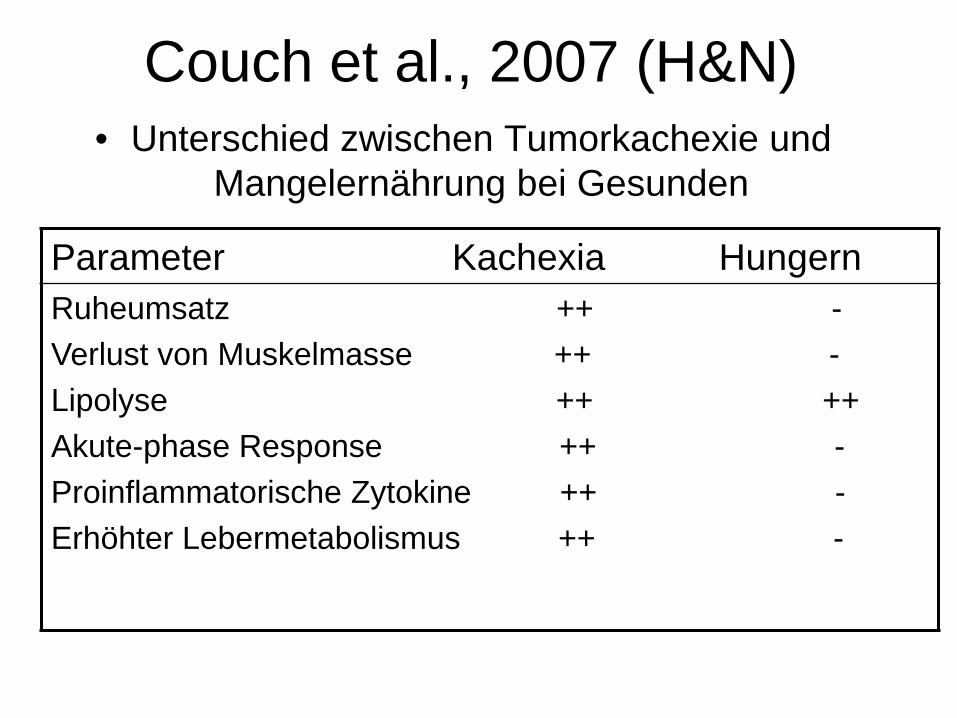
Couch et al., 2007 (H&N) • Unterschied zwischen Tumorkachexie und
Mangelernährung bei Gesunden
Parameter Kachexia Hungern Ruheumsatz ++ - Verlust von Muskelmasse ++ - Lipolyse ++ ++ Akute-phase Response ++ - Proinflammatorische Zytokine ++ - Erhöhter Lebermetabolismus ++ -

Metabolische Effekte des Tumors im Detail
Van Cutsem & Arends, Eur J Oncol Nurs 2005) 3. Medizinische Abteilung / Vorstand: Prim. Univ. Prof. Dr. Felix Keil / Seite 8
Lipolyse mobilisierende Faktoren
Proteolyse induzierende Faktoren
Insulin-resistenz
Amino-säuren
Lipolyse
Appetitlosigkeit
Gesteigerter Ruheumsatz
Akutphase-
Proteine ++
Protein-abbau ++ Skelett-
muskelabbau
Tumor
Leber
Fett

Lipase Aktivität ist im Fettgewebe von Tumorpatienten erhöht.
Das et al., Science;333(6039):233-8. 2011

Tumorkachexie häufig Folge einer systemischen inflammatorischen Reaktion des Körpers auf den
Tumor mit CRP Anstieg und Albumin Abfall
Konsumierende Erkrankung ähnlich wie bei TBC oder anderen chronische entzündlichen
Erkrankungen (COPD bei Rauchern)
3. Medizinische Abteilung / Vorstand: Prim. Univ. Prof. Dr. Felix Keil / Seite 10

Systemische Inflammatorische Reaktion auf den Tumor: Prognostisch relevant?
• Glasgow Prognostic score • CRP normal und Albumin : 0 • CRP elevated und Albumin normal: 1 • CRP elevated und Albumin lowt : 2
• Proctor et al. EJC: • 8759 Tumorpatienten mit Screening nach obrigen OParametren und
Follow up über 2 Jahre • GPS unabhängiger Prognosefaktor.

T
CRP und Albumin o.B.
CRP ++
CRP ++ und Albumin erniedrigt

Figure 1
Source: Clinical Nutrition 2005; 24:801-814 (DOI:10.1016/j.clnu.2005.05.001 ) Copyright © 2005 Elsevier Ltd Terms and Conditions
Häufigkeit von Gewichtsverlust nach Tumorart Oesophagus. > Magen Ca> ….. Prostats Ca
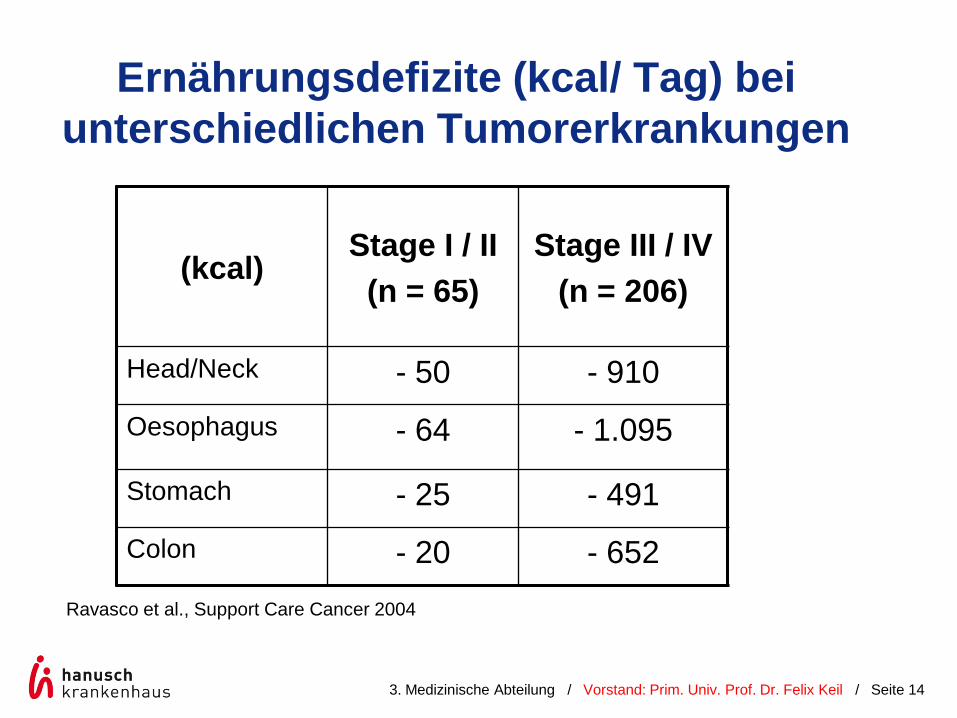
Ernährungsdefizite (kcal/ Tag) bei unterschiedlichen Tumorerkrankungen
Ravasco et al., Support Care Cancer 2004
(kcal) Stage I / II
(n = 65) Stage III / IV
(n = 206)
Head/Neck - 50 - 910 Oesophagus - 64 - 1.095
Stomach - 25 - 491 Colon - 20 - 652
3. Medizinische Abteilung / Vorstand: Prim. Univ. Prof. Dr. Felix Keil / Seite 14

Überleben bei Patienten mit metastasierten CRC mit Mangelernährung signifikant schlechter: Ergebnisse
einer multizenterischen AGEO Studie N=114
3. Medizinische Abteilung / Vorstand: Prim. Univ. Prof. Dr. Felix Keil / Seite 15
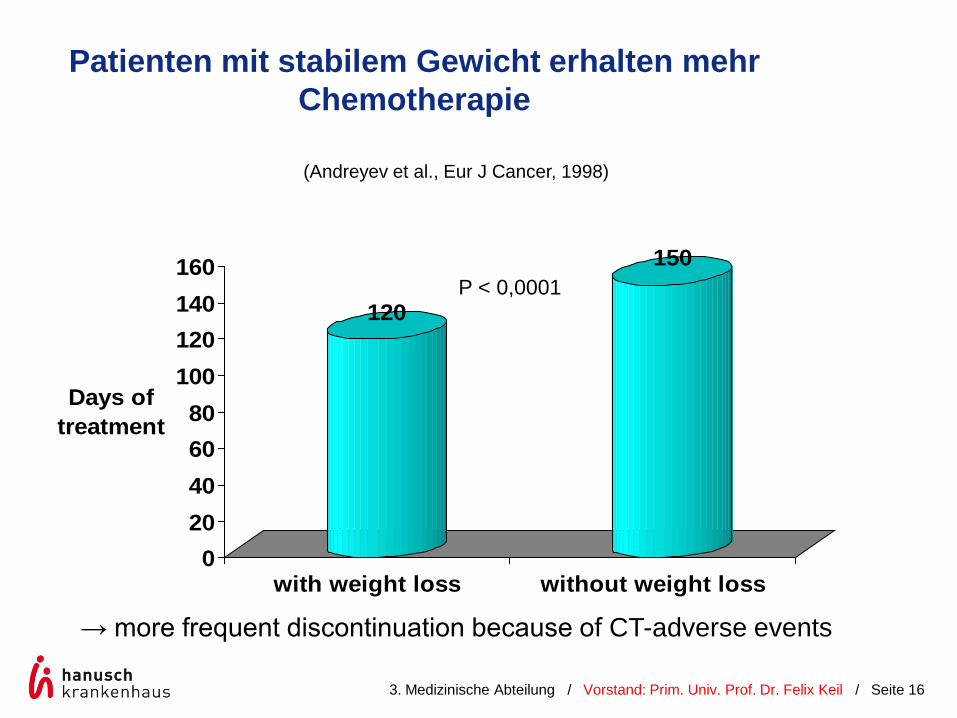
Patienten mit stabilem Gewicht erhalten mehr Chemotherapie
120
150
020406080
100120140160
Days of treatment
with weight loss without weight loss
P < 0,0001
→ more frequent discontinuation because of CT-adverse events
(Andreyev et al., Eur J Cancer, 1998)
3. Medizinische Abteilung / Vorstand: Prim. Univ. Prof. Dr. Felix Keil / Seite 16

Wie definieren wir Mangelernährung?

Normale Körperspeicher kg kcal
Fett (1kg Fett=1,1kg Fettgewebe) 15 141 000
Protein (1kg Protein=4kg Muskelgewebe)
12 40 000
Leberglykogen 0,2 400
Muskelglykogen 0,5 800
Blutglucose 0,02 80
3. Medizinische Abteilung / Vorstand: Prim. Univ. Prof. Dr. Felix Keil / Seite 18

Bei Diagnose- stellung
Während der Behandlung
Rasche & einfache Abschätzung durch…
Patientengespräch: Änderung in Appetit, Essverhalten,….?
Ungewollter Gewichtsverlust ? > 10 % des normalen Gewichts innerhalb 6 Monaten BMI (Body mass index): < 18,5 kg/m2 (Geriatrie: < 20 kg/m2)
Screening-Bögen: NRI – Nutritional Risk Index
BIA: Bioimpedanzanalyse
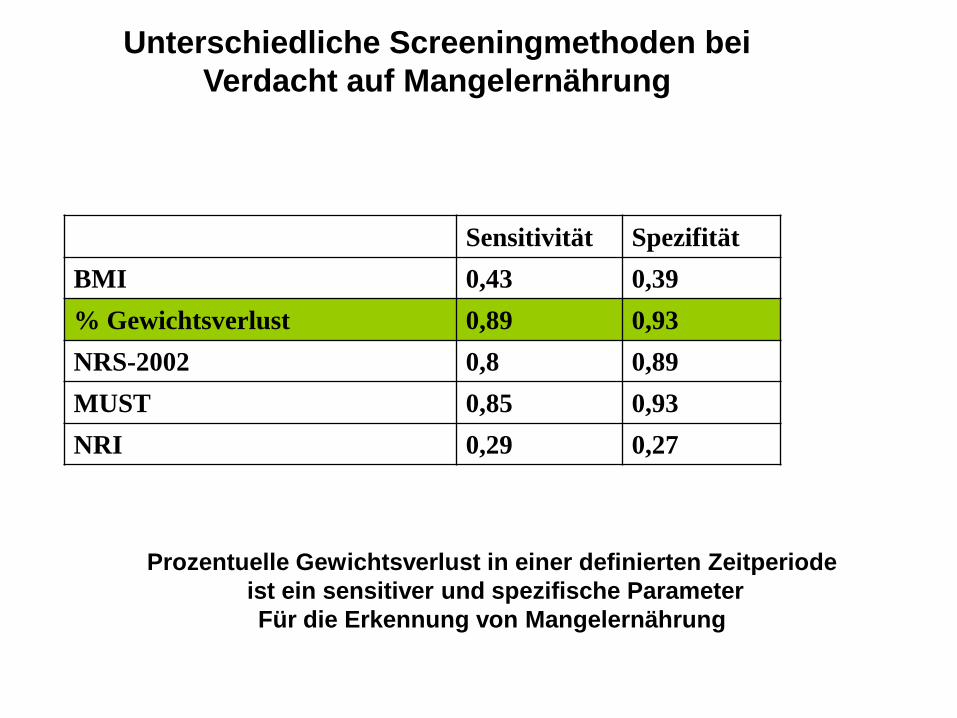
Sensitivität Spezifität BMI 0,43 0,39 % Gewichtsverlust 0,89 0,93 NRS-2002 0,8 0,89 MUST 0,85 0,93 NRI 0,29 0,27
Unterschiedliche Screeningmethoden bei Verdacht auf Mangelernährung
Prozentuelle Gewichtsverlust in einer definierten Zeitperiode ist ein sensitiver und spezifische Parameter Für die Erkennung von Mangelernährung
Ernährung onkologischer Patienten im Spital
3. Medizinische Abteilung / Vorstand: Prim. Univ. Prof. Dr. Felix Keil / Seite 21

22
Prävalenz der Mangelernährung und Screening
Risikoerkennung in Österreich • 30% der Stationen haben eine Screening-Routine • 18% der PatientInnen haben ein Ernährungsrisiko
Schindler et al. (2010) Clin Nutr
Mangelernährung bei stationärer Aufnahme: • Geriatrie 56.2% • Onkologie 37.6% • Gastroenterologie 32.6%
Pirlich et al. (2006) Clin Nutr
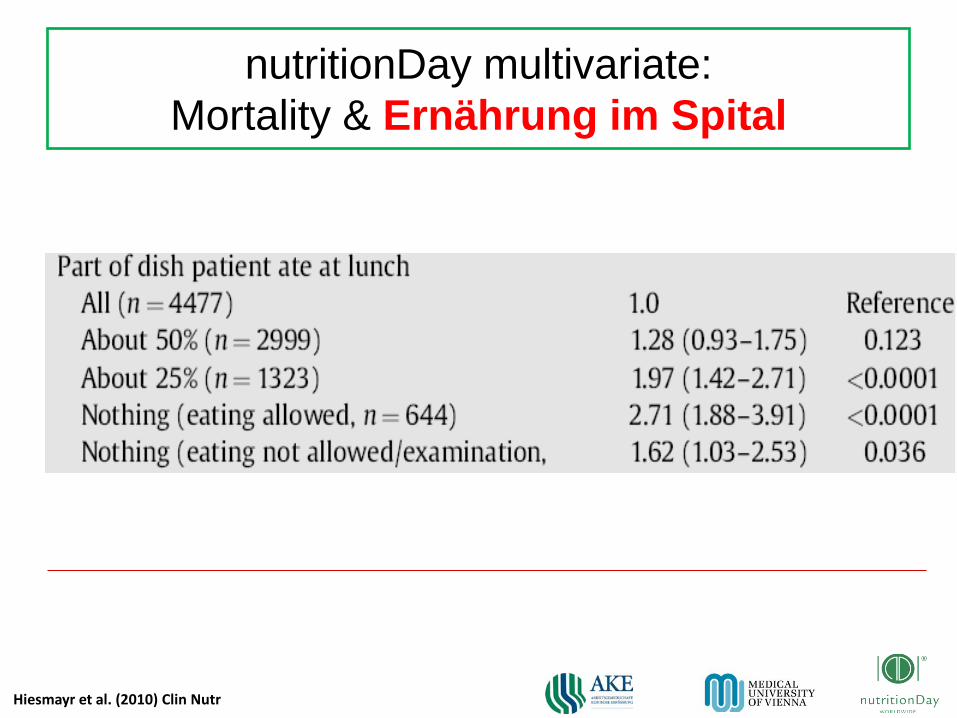
Hiesmayr et al. (2010) Clin Nutr
nutritionDay multivariate: Mortality & Ernährung im Spital

Gewichtsverlust 3-6 Monate
© mh Nutrition Day 2011
Onkologie

Ernährungstherapie onkologischer Patienten
3. Medizinische Abteilung / Vorstand: Prim. Univ. Prof. Dr. Felix Keil / Seite 25
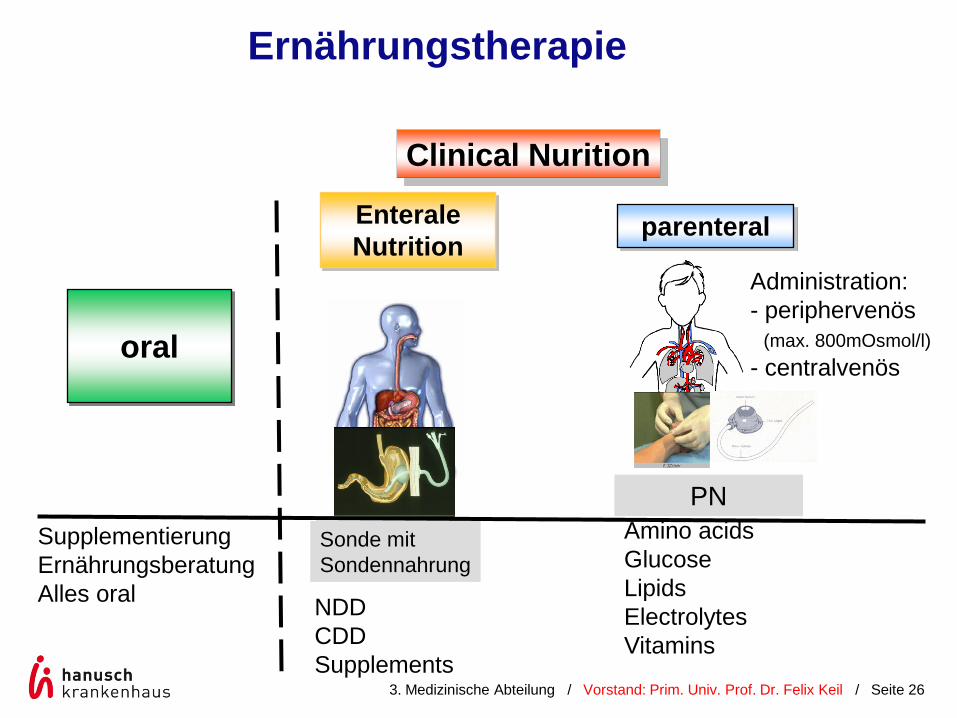
oral
Clinical Nurition
Supplementierung ErnährungsberatungAlles oral NDD
CDD Supplements
Enterale Nutrition
Sonde mit Sondennahrung
parenteral
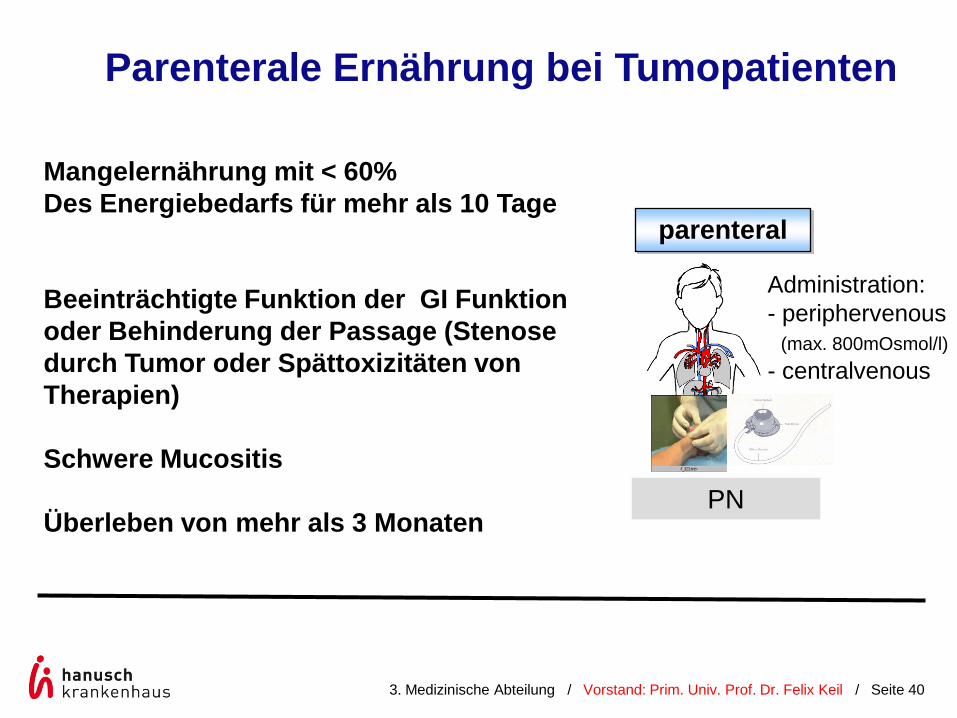
Administration: - periphervenös (max. 800mOsmol/l) - centralvenös
PN
Ernährungstherapie
Amino acids Glucose Lipids Electrolytes Vitamins
3. Medizinische Abteilung / Vorstand: Prim. Univ. Prof. Dr. Felix Keil / Seite 26
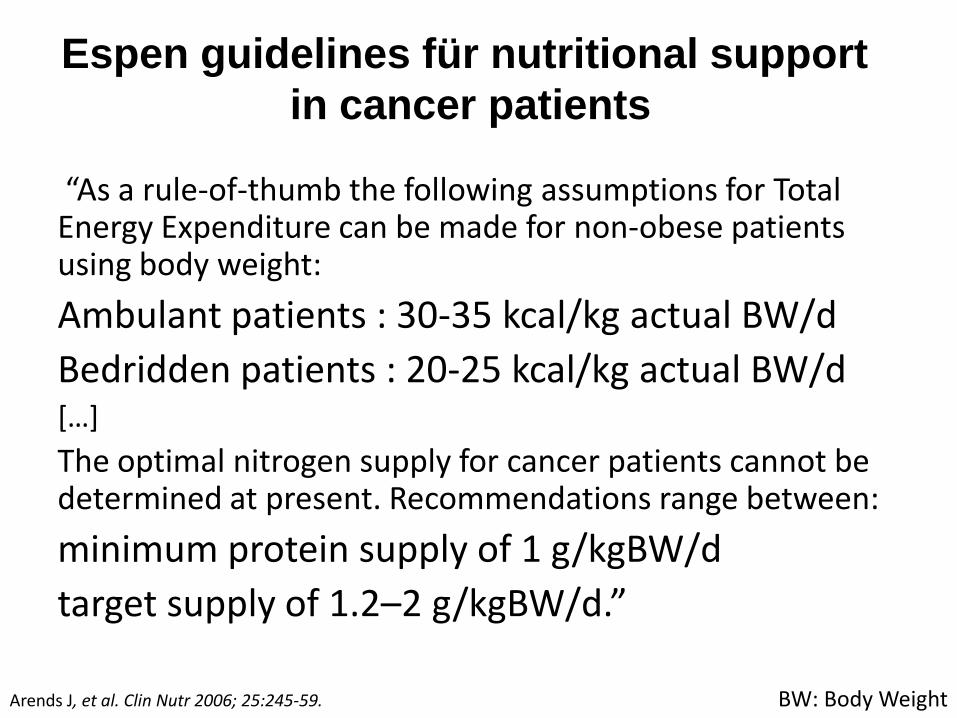
“As a rule-of-thumb the following assumptions for Total Energy Expenditure can be made for non-obese patients using body weight: Ambulant patients : 30-35 kcal/kg actual BW/d Bedridden patients : 20-25 kcal/kg actual BW/d […] The optimal nitrogen supply for cancer patients cannot be determined at present. Recommendations range between: minimum protein supply of 1 g/kgBW/d target supply of 1.2–2 g/kgBW/d.”
Arends J, et al. Clin Nutr 2006; 25:245-59. BW: Body Weight
Espen guidelines für nutritional support in cancer patients
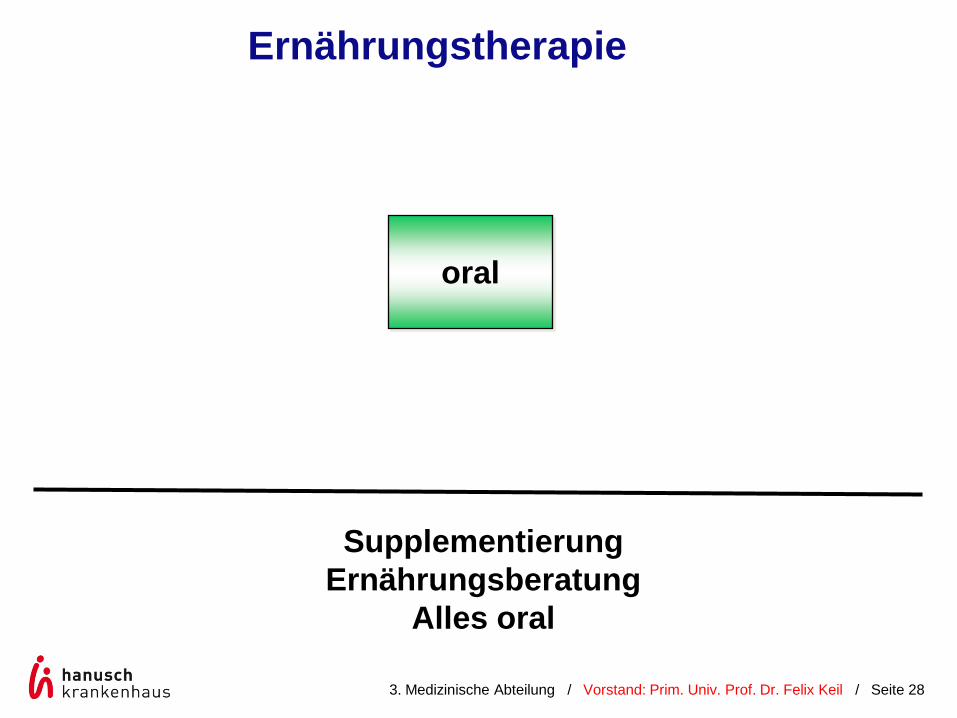
oral
Supplementierung Ernährungsberatung
Alles oral
Ernährungstherapie
3. Medizinische Abteilung / Vorstand: Prim. Univ. Prof. Dr. Felix Keil / Seite 28

Dietary counseling improves patient outcomes Ravasco P et al. JCO 2005;23:1431-1438
G1: Dietary counseling, regular foods
G2: protein supplements
G3: ad libitum intake
111 patients with colorectal cancer, stratified by staging All receive Outpatient treatment with Radiotherapy
Week 1 2 3 4 5 6 7 RX
3. Medizinische Abteilung / Vorstand: Prim. Univ. Prof. Dr. Felix Keil / Seite 29
Follow-up 3 months

.
Ravasco P et al. JCO 2005;23:1431-1438
Nutrition therapy in CRC patients during RTX
In G1 significant less morbidity toxicity of treatment and better QoL
3. Medizinische Abteilung / Vorstand: Prim. Univ. Prof. Dr. Felix Keil / Seite 30
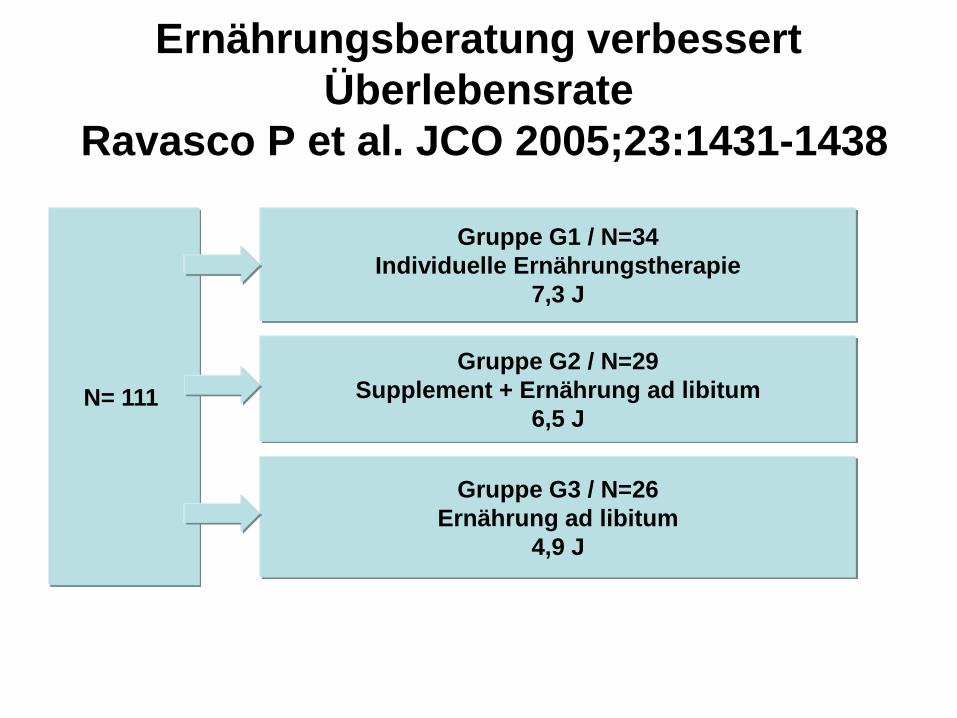
Ernährungsberatung verbessert Überlebensrate
Ravasco P et al. JCO 2005;23:1431-1438
Gruppe G1 / N=34 Individuelle Ernährungstherapie
7,3 J
Gruppe G2 / N=29 Supplement + Ernährung ad libitum
6,5 J
Gruppe G3 / N=26 Ernährung ad libitum
4,9 J
N= 111

0 1 2 3 4 5 6Time in years
0,0
0,2
0,4
0,6
0,8
1,0Fr
eque
ncy
of ev
ents
(%)
Group 1Group 2Group 3
Late RT toxicity Permanent mucosal lesion - symptoms
Ravasco P et al. (In press)
G1<G2≈G3, p=0.002

Quality of Life
G1 highest QoL scores similar to those at 3-mts follow-up QoL adequate nutritional intake + status p<0.05 G2+G3 all QoL scores worsened vs 3 mts follow-up p<0.05 Worse QoL deterioration nutritional intake+status p<0.01 G1>G2~G3 p<0.002
Ravasco P et al. (In press)

Oral nutritional interventions and mortality meta-analysis.
Baldwin C et al. JNCI J Natl Cancer Inst 2012;104:371-385
3. Medizinische Abteilung / Vorstand: Prim. Univ. Prof. Dr. Felix Keil / Seite 34

NDD CDD Supplements
Enterale Nutrition
Sonde mit Sondennahrung
Ernährungstherapie
3. Medizinische Abteilung / Vorstand: Prim. Univ. Prof. Dr. Felix Keil / Seite 35

Clinical determinants in patients receiving chemoirradiation for head and neck cancer: a
prospective longitudinal view (n=25) Kubrak et al. Baseline Mean ± SD
Posttreatment Mean ± SD
Energy intake, kcal/d 2565 ± 687 1351 ± 1018
Protein intake, g/d 108 ± 38 54 ± 37
CRP, mg/L 6.0 ± 9.3 23.4 ± 24.9
Loss of appetite score (1-5)
1.5 ± 1.0 3.5 ± 1.8
Pain score (1-5) 1.5 ± 1.0 3.8 ± 1.5
Swallowing capacity, mL/s
13.0 ± 4.7 5.6 ± 4.9
Oral mucositis score (0-9)
0.1 ± 0.37 3.5 ± 2.2
3. Medizinische Abteilung / Vorstand: Prim. Univ. Prof. Dr. Felix Keil / Seite 36
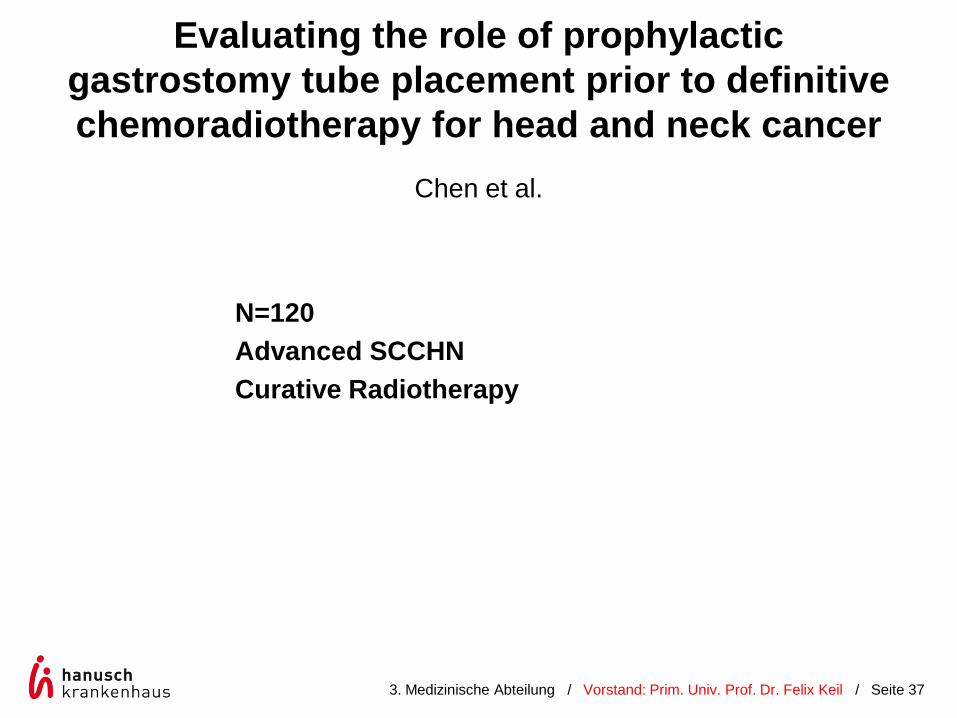
Evaluating the role of prophylactic gastrostomy tube placement prior to definitive chemoradiotherapy for head and neck cancer
Chen et al.
N=120 Advanced SCCHN Curative Radiotherapy
3. Medizinische Abteilung / Vorstand: Prim. Univ. Prof. Dr. Felix Keil / Seite 37
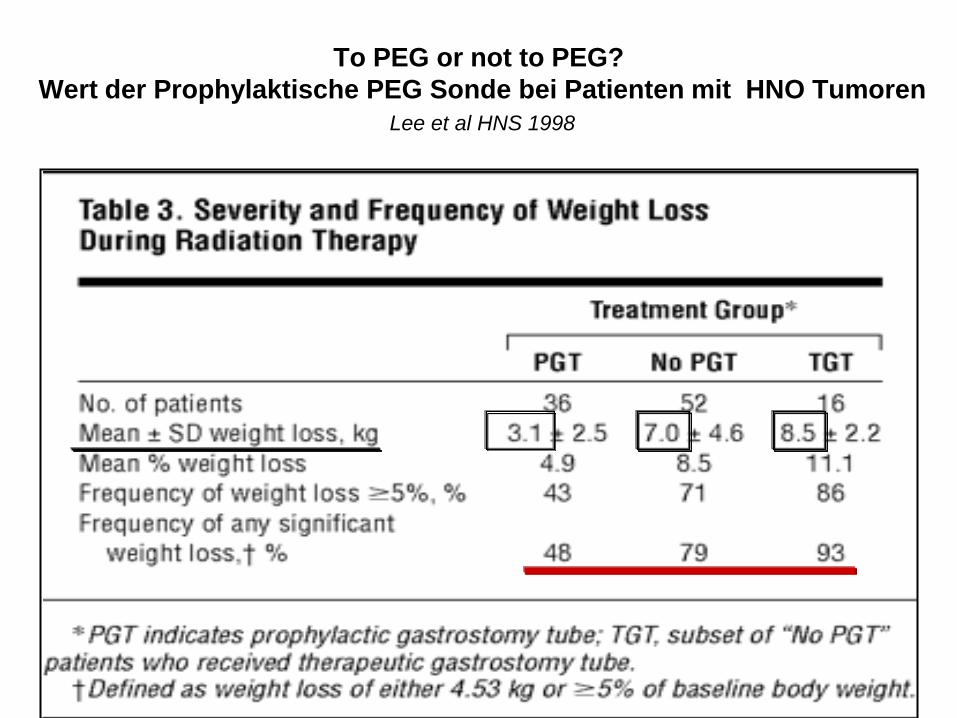
To PEG or not to PEG? Wert der Prophylaktische PEG Sonde bei Patienten mit HNO Tumoren
Lee et al HNS 1998

Proportion of surviving patients with Grade 3+ dysphagia after completion of radiation therapy in patients with and without GT placement
3. Medizinische Abteilung / Vorstand: Prim. Univ. Prof. Dr. Felix Keil / Seite 39
GT placement is associated with improved Nutritional status but significantly higher rates of functional impairment. No difference in OS
parenteral
Administration: - periphervenous (max. 800mOsmol/l) - centralvenous
PN
Parenterale Ernährung bei Tumopatienten
3. Medizinische Abteilung / Vorstand: Prim. Univ. Prof. Dr. Felix Keil / Seite 40
Mangelernährung mit < 60% Des Energiebedarfs für mehr als 10 Tage Beeinträchtigte Funktion der GI Funktion oder Behinderung der Passage (Stenose durch Tumor oder Spättoxizitäten von Therapien) Schwere Mucositis Überleben von mehr als 3 Monaten

Palliative nutritional intervention in patients with malignant disease: Effects on survival, metabolism,
and function Lundholm et al.
• N=309 • Most with advanced GI Cancer • No patients icluded with a life expectancy of less
than 6 mths • Control and study group well balanced for stage of
disease and nutrition status
3. Medizinische Abteilung / Vorstand: Prim. Univ. Prof. Dr. Felix Keil / Seite 41
Cancer Volume 100, Issue 9, pages 1967-1977, 24 MAR 2004 DOI:

Nutrition intervention in the study group
If food intake decreases to 90% of daily requirement nutritional counceling and supplements (600 kcal/day) are provided If food intake < 70% PN over night treatment with PE 20 kcal/kg b.w./day is started
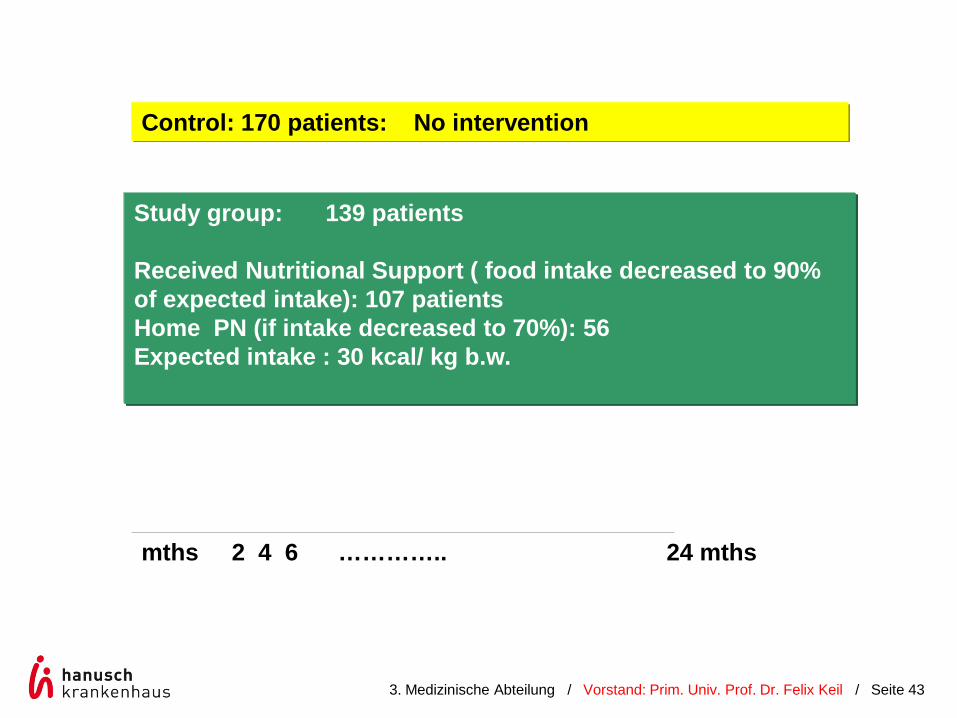
Control: 170 patients: No intervention
Study group: 139 patients Received Nutritional Support ( food intake decreased to 90% of expected intake): 107 patients Home PN (if intake decreased to 70%): 56 Expected intake : 30 kcal/ kg b.w.
mths 2 4 6 ………….. 24 mths
3. Medizinische Abteilung / Vorstand: Prim. Univ. Prof. Dr. Felix Keil / Seite 43

3. Medizinische Abteilung / Vorstand: Prim. Univ. Prof. Dr. Felix Keil / Seite 44
Caveat: 26 patients receiving unplanned NS in the control group and were excluded for analysis. No difference if analysed as ITT

Maximal exercise capacity in the study and control group over the course of follow up.
3. Medizinische Abteilung / Vorstand: Prim. Univ. Prof. Dr. Felix Keil / Seite 45

Source: Clinical Nutrition 2007; 26:667-676 (DOI:10.1016/j.clnu.2007.03.011 )
Physical activity level (PAL) = Gesamter Energieverbrauch/Ruheumsatz)
Bettlägriger Tumorpatient PAL<1,4
Angestellter (Verwaltung) mit 1h Sport/Tag Angestellter Ohne Sport 1 Stunde Laufen Fernsehen
PAL 1,7 -1,9 PAL 1,5 PAL 7 (700 kcal/100kcal) PAL 1,2
Profi Radfahrer oder Schwerste körperl. Arbeit
PAL>2,4
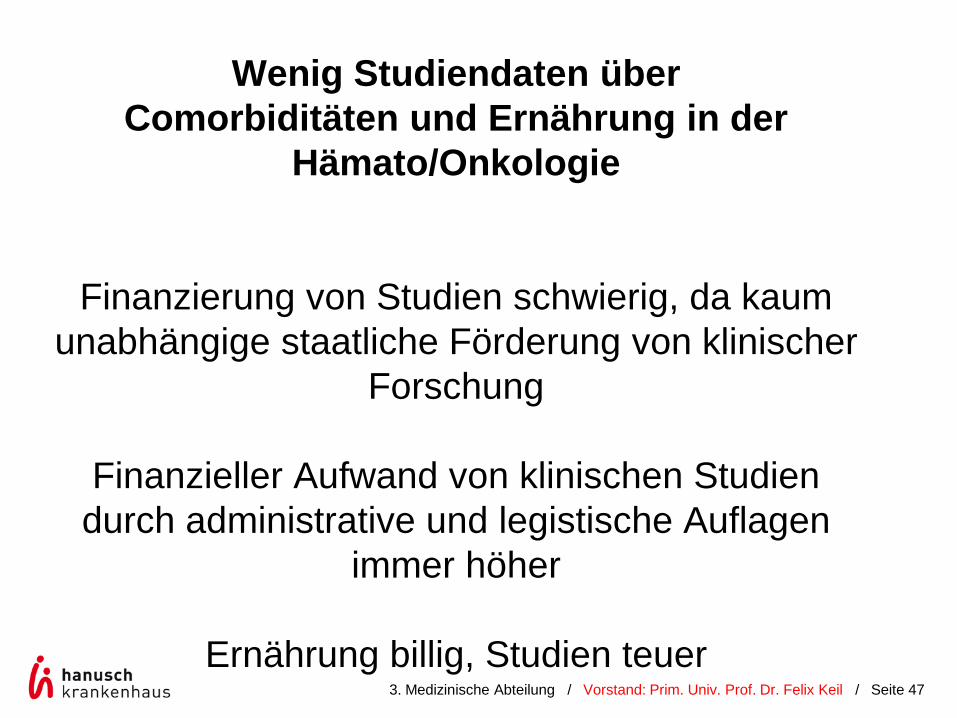
Wenig Studiendaten über
Comorbiditäten und Ernährung in der Hämato/Onkologie
Finanzierung von Studien schwierig, da kaum unabhängige staatliche Förderung von klinischer
Forschung
Finanzieller Aufwand von klinischen Studien durch administrative und legistische Auflagen
immer höher
Ernährung billig, Studien teuer 3. Medizinische Abteilung / Vorstand: Prim. Univ. Prof. Dr. Felix Keil / Seite 47

Fallbeispiel
• Pat; F.D. 73 Jahre 182 cm, 79 kg • CRC metastasiert ( Fil Hep) • CX: Xeloda plus Avastin • Nach 5 Wochen starke Diarrhoe mit
Mucositis und Übelkeit 72 kg • Stationär Rehydrierung und Beginn mit PE
über 4 Tage auf 15 kcal/ kg

• Beginn mit 40 ml/h bis 100 ml/h über Nacht
• Rasche Besserung mit Mobilisierung, Ernährungsberatung und Weiterführung der CX (Capecitabine Dosis reduziert) mit guter Response auf CX
• Nach 1 Monat Ausgangsgewicht wieder erreicht und mobil
• Ambulante Versorgung möglich

Funktioneller Ernährungsstatus
• Gewicht, BMI und Körperoberfläche sagen nichts über die Zusammensetzung des Körpers bzgl.. prozentueller Verteilung von Fett, Muskelmasse ect. aus
• Dosierungen von Chemotherapien, targeted Therapies und auch Ernährung berücksichtigen diese Faktoren nicht

R² = 0,4748
20
30
40
50
60
70
80
90
0 50 100 150
Body weight, kg
Fat f
ree
mas
s, k
g Eine 75 kg schwerer Patient hat eine FFM zwischen 30 und 65 kg!!!! Range Körperfett: 13% bis 70%!!!
Fett freie Masse und Körpergewicht bei 950 Patienten mit Lungenca*
*Population cohort. Continuing cohort of: Baracos et al. Am J Clin Nutr. 2010: 91:1133S-7S

Visceral Subcutaneous Intermuscular
Unterschiedlicher Fettmasse bei identer Muskelmasse Dosierung von CX oder Ernährung bisher nach kg KG
oder Oberfläche
Source: Clinical Nutrition (DOI:10.1016/j.clnu.2012.06.012 )
Terms and Conditions
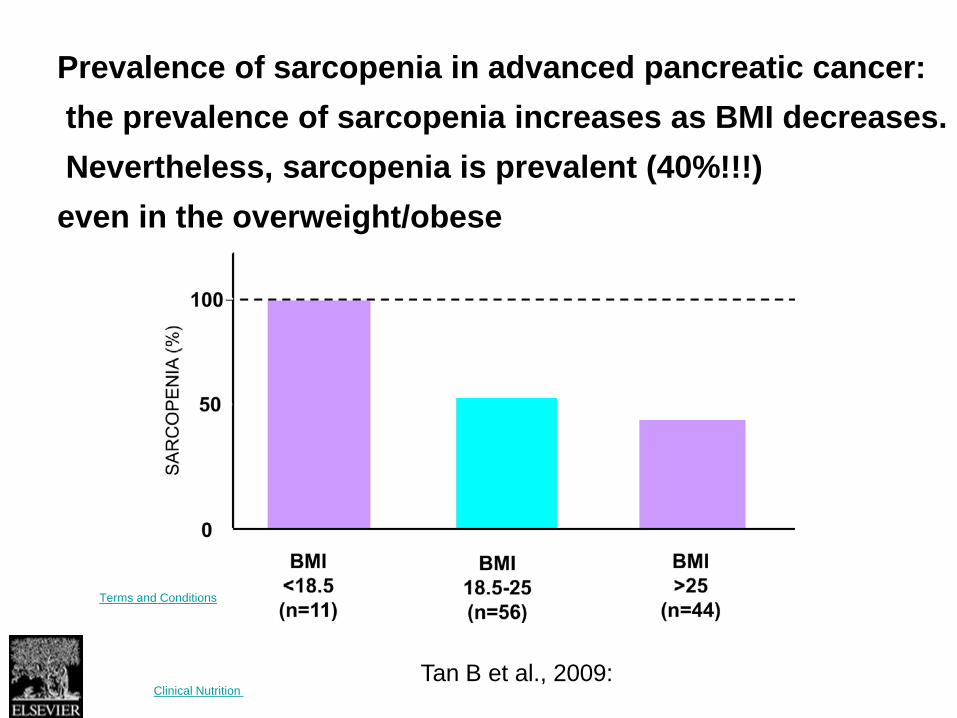
Tan B et al., 2009:
Prevalence of sarcopenia in advanced pancreatic cancer: the prevalence of sarcopenia increases as BMI decreases. Nevertheless, sarcopenia is prevalent (40%!!!) even in the overweight/obese

Der übergewichtige und sarkopenische mangelernährte Patient.
Tan B H et al. Clin Cancer Res 2009;15:6973-6979
©2009 by American Association for Cancer Research

Survival curves of patients with overweight/obese sarcopenia and patients without overweight/obese sarcopenia.
Tan B H et al. Clin Cancer Res 2009;15:6973-6979
©2009 by American Association for Cancer Research
Sarkopenie und Adipositas sind die ungünstigsten Prognosefaktoren!!! HR 2,01 Stadium der Erkrankung 1,7

Figure 1 Possible mechanisms linking obesity to cancer, including the influence of sex hormones, inflammation, cytokines, acute-phase
reactants and stress
Tao, W. & Lagergren, J. (2013) Clinical management of obese patients with cancer Nat. Rev. Clin. Oncol. doi:10.1038/nrclinonc.2013.120

Höhere Rezidivrate bei adipösen AML M3 Patienten
Breccia M et al. Blood 2012;119:49-54
©2012 by American Society of Hematology

Wann und wie sollen wir die Kachexie behandeln?
3. Medizinische Abteilung / Vorstand: Prim. Univ. Prof. Dr. Felix Keil / Seite 58


Modulating the Effects of Chemotherapy by Means of Fasting.
Laviano A, Rossi Fanelli F. N Engl J Med 2012;366:2319-2320.

![Schmerztherapie bei TumorpatientenSchmerztherapie bei Tumorpatienten Isny 19.11.2018 Skript [Kompatibilitätsmodus] Author peter.steffen Created Date 11/19/2018 2:18:37 PM ...](https://static.fdokument.com/doc/165x107/60c86fb6d66d84543d7c7d55/schmerztherapie-bei-tumorpatienten-schmerztherapie-bei-tumorpatienten-isny-19112018.jpg)