Schopfer Et Al IRMMS 2009 Repository
42
Provided by the author(s) and University College Dublin Library in accordance with publisher policies. Please cite the published version when available. Downloaded 2014-03-18T18:45:52Z Title The impact of porosity and crack density on the elasticity, strength and friction of cohesive granular materials : insights from DEM modelling Author(s) Schöpfer, Martin P. J.; Abe, Steffen; Childs, Conrad; Walsh, John J. Publication Date 2009-02 Publication information International Journal of Rock Mechanics and Mining Sciences, 46 (2): 250-261 Publisher Elsevier Link to publisher's version http://dx.doi.org/10.1016/j.ijrmms.2008.03.009 This item's record/more information http://hdl.handle.net/10197/3027 Rights This is the author’s version of a work t hat was accepted for publication in International Journal of Rock Mechanics and Mining Sciences. Changes resulting from the publishing process, such as peer review, editing, corrections, structural formatting, and other quality control mechanisms may not be reflected in this document. Changes may have been made to this work since it was submitted for publication. A definitive version was subsequently published in International Journal of Rock Mechanics and Mining Sciences Volume 46, Issue 2, February 2009, Pages 250-261 DOI#:10.1016/j.ijrmms.2008.03.009. DOI http://dx.doi.org/10.1016/j.ijrmms.2008.03.009
Transcript of Schopfer Et Al IRMMS 2009 Repository

8/11/2019 Schopfer Et Al IRMMS 2009 Repository
http://slidepdf.com/reader/full/schopfer-et-al-irmms-2009-repository 1/42
Provided by the author(s) and University College Dublin Library in accordance with publisher policies. Please
cite the published version when available.
Downloaded 2014-03-18T18:45:52Z
TitleThe impact of porosity and crack density on the elasticity,strength and friction of cohesive granular materials : insightsfrom DEM modelling
Author(s)Schöpfer, Martin P. J.; Abe, Steffen; Childs, Conrad; Walsh,John J.
PublicationDate
2009-02
Publicationinformation
International Journal of Rock Mechanics and Mining Sciences,46 (2): 250-261
Publisher Elsevier
Link topublisher's
version
http://dx.doi.org/10.1016/j.ijrmms.2008.03.009
This item'srecord/moreinformation
http://hdl.handle.net/10197/3027
Rights
This is the author’s version of a work that was accepted forpublication in International Journal of Rock Mechanics andMining Sciences. Changes resulting from the publishingprocess, such as peer review, editing, corrections, structuralformatting, and other quality control mechanisms may not bereflected in this document. Changes may have been made tothis work since it was submitted for publication. A definitiveversion was subsequently published in International Journal of Rock Mechanics and Mining Sciences Volume 46, Issue 2,February 2009, Pages 250-261DOI#:10.1016/j.ijrmms.2008.03.009.
DOI http://dx.doi.org/10.1016/j.ijrmms.2008.03.009

8/11/2019 Schopfer Et Al IRMMS 2009 Repository
http://slidepdf.com/reader/full/schopfer-et-al-irmms-2009-repository 2/42
Some rights reserved. For more information, please see the item record link above.

8/11/2019 Schopfer Et Al IRMMS 2009 Repository
http://slidepdf.com/reader/full/schopfer-et-al-irmms-2009-repository 3/42
The impact of porosity and crack density on the elasticity,1
strength and friction of cohesive granular materials: Insights2
from DEM modelling3
Martin P.J. Schöpfer *,1, Steffen Abe+,2, Conrad Childs1 and John J. Walsh1 4
1Fault Analysis Group, School of Geological Sciences, University College Dublin,5
Belfield, Dublin 4, Ireland.6
2 Seismology & Computational Rock Physics Laboratory, School of Geological7
Sciences, University College Dublin, Belfield, Dublin 4, Ireland.8
9
Abstract10
Empirical rock properties and continuum mechanics provide a basis for defining11
relationships between a variety of mechanical properties, such as strength, friction12
angle, Young’s modulus, Poisson’s ratio, on the one hand and both porosity and crack13
density, on the other. This study uses the Discrete Element Method (DEM), in which14
rock is represented by bonded, spherical particles, to investigate the dependence of15
elasticity, strength and friction angle on porosity and crack density. A series of16
confined triaxial extension and compression tests was performed on samples that were17
generated with different particle packing methods, characterised by differing particle18
size distributions and porosities, and with different proportions of pre-existing cracks,19
or uncemented grain contacts, modelled as non-bonded contacts. The 3D DEM model20
results demonstrate that the friction angle decreases (almost) linearly with increasing21
* Corresponding author. Tel.: +353 1 7162611; fax: +353 1 7162607
E-mail address: [email protected]
+ Present address: Geologie-Endogene Dynamik, RWTH Aachen University, Aachen, Germany
8/11/2019 Schopfer Et Al IRMMS 2009 Repository
http://slidepdf.com/reader/full/schopfer-et-al-irmms-2009-repository 4/42
porosity and is independent of particle size distribution. Young’s modulus, strength22
and the ratio of unconfined compressive strength to tensile strength (UCS/T) also23
decrease with increasing porosity, whereas Poisson’s ratio is (almost) porosity24
independent. The pre-eminent control on UCS/T is however the proportion of bonded25
contacts, suggesting that UCS/T increases with increasing crack density. Young’s26
modulus and strength decrease, while Poisson’s ratio increases with increasing crack27
density. The modelling results replicate a wide range of empirical relationships28
observed in rocks and underpin improved methods for the calibration of DEM model29
materials.30
31
Keywords: Discrete Element Method; Particle Flow Code; Porosity; Friction; Failure32
envelope;33
34

8/11/2019 Schopfer Et Al IRMMS 2009 Repository
http://slidepdf.com/reader/full/schopfer-et-al-irmms-2009-repository 5/42
1 Introduction35
Knowledge of the mechanical properties of rocks is fundamental for both Earth36
scientists and engineers. Failure envelopes and elastic parameters are crucial for37
modelling a wide range of geomechanical problems, including wellbore failure, slope38
stabilities and the stability of underground excavations [1]. Rock properties are39
obtained from in-situ tests and more commonly in the laboratory from samples that40
are loaded using stress and/or displacement controlled experiments. These tests have41
given many insights into the behaviour of rock and have shown, for example, that the42
elastic parameters and strength depend on porosity and cement content, though the43
details of these dependencies are also partly controlled by mineral composition (e.g.44
carbonate vs siliciclastic rocks; [2,3]). Obtaining core samples from depth for45
laboratory testing is both time-consuming and expensive. Hence rock physical46
properties are often estimated using empirical relations, such as the correlation47
between Young’s modulus and sonic velocity, or that between unconfined48
compressive strength and porosity [4]. Rock is, however, a heterogeneous material49
and even multiple samples obtained from a single slab of rock can exhibit significant50
compositional variability and hence mechanical behaviour [3]. Therefore some of the51
above mentioned empirical rock property relations are poorly constrained. One of the52
principal aims of this work is to investigate these empirical property relations in53
numerical rock analogues where the effects of compositional heterogeneity can be54
isolated.55
Numerical modelling offers a new avenue to better understand material56
property relations. An advantage of numerical modelling is that the user can examine57
systematically the effect of varying individual input parameters while keeping all58
other parameters constant; this is rarely possible with laboratory measurement. The59
8/11/2019 Schopfer Et Al IRMMS 2009 Repository
http://slidepdf.com/reader/full/schopfer-et-al-irmms-2009-repository 6/42
Discrete Element Method (DEM), where rock is represented as an assemblage of60
particles (spheres, ellipsoids, blocks) that interact with each other, is ideal for61
investigating mechanical property relations since the user predefines microproperties62
(particle and cement properties) and determines macroproperties (elastic and strength63
parameters) using numerical lab experiments [5]. The mechanical behaviour of the64
model material is not predefined, as in continuum approaches, but emerges from the65
interaction of particles and cement [6].66
The aim of this study is to investigate the impact of particle size distribution,67
porosity and cement content (i.e. proportion of bonded contacts) on the mechanical68
properties (elasticity, strength, ratio of unconfined compressive strength to tensile69
strength and friction angle) of DEM model materials in 3D. In the next section we70
provide a brief review of rock property relations which are relevant for this study. In71
the following sections we describe the results of the various numerical mechanical72
experiments conducted on samples generated using a range different packing methods73
and compare the observed failure envelopes, failure criteria and rock mechanical74
property relations (cement content, porosity) with those of rocks.75
76
2 Rock property relations and failure envelopes77
In this study we numerically investigate relations between porosity, cement content78
and rock mechanical properties. Here we summarise the most important empirical79
relations obtained from lab experiments (see Fig. 1), which provide the essential80
backdrop to the numerical modelling presented in Section 4.81
Probably the most commonly used failure criterion for rock is the Coulomb82
criterion, which, expressed in terms of the principal stresses σ 1 and σ 3 (σ 1 > σ 3 and83
compressive stresses positive throughout this paper), is written as84
8/11/2019 Schopfer Et Al IRMMS 2009 Repository
http://slidepdf.com/reader/full/schopfer-et-al-irmms-2009-repository 7/42
85
)2/45(tanUCS 2
31 iϕ σ σ +°+= , (1)86
87
where UCS is the unconfined compressive strength and ϕ i is the angle of88
internal friction, the tangent of which is called the coefficient of internal friction µ i 89
[1]. Experimental data and theoretical models [7] suggest, however, that a linear90
failure criterion is only valid over a limited range of confining pressures and that a91
non-linear failure envelope concave towards the minimum principal stress axis (in a92
σ 1 vs σ 3 plot) may prove to be the rule rather the exception [2]. An additional93
limitation of both linear and non-linear failure criteria is that they are often94
independent of the intermediate principal stress, σ 2 (Mohr criteria), whereas data from95
polyaxial tests suggests that many rock types exhibit a σ 2 dependence of strength96
[3,8]. Consequently peak stress data and associated failure envelopes obtained from97
triaxial extension and triaxial compression tests exhibit a mismatch, where the former98
plots above the latter in a σ 1 vs σ 3 plot (Fig. 1a). Under some circumstances this99
mismatch can be eliminated by using a criterion that takes the impact of σ 2 into100
account (Fig. 1b). Finally very few experimental data exist within the tensile field (σ 3 101
< 0; Fig. 1a) to define the transition from tensile to shear failure [9], though a102
parabolic failure envelope is most commonly used [10].103
Laboratory tests of rocks indicate that strength, angle of internal friction and104
Young’s modulus decrease with increasing porosity ([4,11-14]; Fig. 1c, d and e).105
Additionally the presence of pre-existing cracks, which have been simulated in the106
laboratory by cyclically heating the rock specimen before loading [15,16], has a107
significant impact on rock mechanical properties (Fig. 1f, g and h). For example,108
strength, the unconfined compressive strength, tensile strength (UCS / T) and Young’s109

8/11/2019 Schopfer Et Al IRMMS 2009 Repository
http://slidepdf.com/reader/full/schopfer-et-al-irmms-2009-repository 8/42
modulus decrease with increasing number of heating cycles, which can be related to110
the proportion of non-cohesive grain-grain contacts or crack density.111
112
3 Methods113
3.1
Discrete Element Method114
The results in this paper have been obtained using two different 3D implementations115
of the DEM for spherical particles, the Particle Flow Code (PFC3D; [5,17]) and116
ESyS-Particle (formerly LSMearth; [18,19]). Both codes implement a linear force-117
displacement contact law with Coulomb friction and a particle-particle bond model118
that transmits both force and moment. The majority of the results presented in this119
paper were obtained using PFC3D and the microproperties used are given in Table 1.120
The details of the contact and bond law implementation are slightly different in ESyS-121
Particle, hence only UCS/T ratios are given and compared to those obtained from122
PFC3D.123
As stated earlier, in a DEM model microproperties are defined and the124
macroproperties are obtained using numerical lab experiments, details of which are125
given in Section 3.3. The user therefore varies the microproperties systematically until126
the material exhibits the desired macroscopic mechanical behaviour. There are,127
however, two problems with calibrating DEM models consisting of spherical particles128
to match the response of real rock: (i) The (internal) friction angle of both cohesive129
and non-cohesive materials is typically too low, irrespective of the contact (i.e.130
particle-particle) friction coefficient [20]. Previous attempts to increase the friction131
angle have included modifications to the standard DEM approach including the use of132
clumped [5,21,22] or elliptical particles [23], implementing a rolling resistance [24]133
and explicitly prescribing the macroscopic failure criterion using hybrid methods [25].134

8/11/2019 Schopfer Et Al IRMMS 2009 Repository
http://slidepdf.com/reader/full/schopfer-et-al-irmms-2009-repository 9/42
(ii) The ratio of unconfined compressive strength to tensile strength (UCS/T) of DEM135
models of cohesive rock is too low (ca 3-4) compared to rock (> 10), an issue that has136
only recently been addressed in 2D [22,26]. We show later that both the low friction137
angles and low UCS/T ratios obtained in previous studies were partly a consequence138
of the particle packing methods used, which lead to porosities that were too high to139
achieve realistic properties without modifying the standard DEM. In this study, we140
show that different particle packing methods, and hence different particle size141
distribution and model porosity, combined with different proportions of bonded142
contacts can replicate the range of friction angles and UCS/T ratios associated with143
rocks.144
145
3.2 Model Generation and Packing Methods146
There are two end-member methods for generating random dense packing of spheres147
for DEM simulations, constructive and dynamic [27]. For this study we used one148
constructive method, the particle insertion method [28], one dynamic method, the149
specimen genesis procedure widely used by PFC3D users [5], and a hybrid of these150
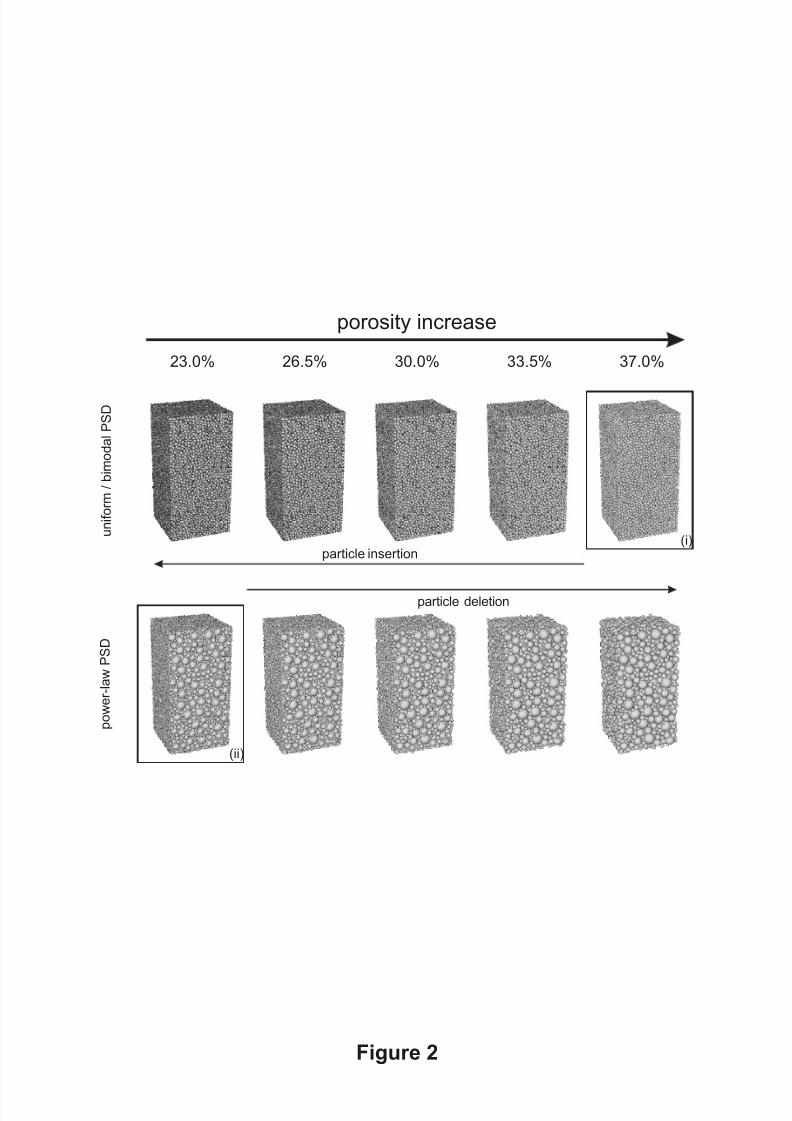
two (Fig. 2).151
The dynamic specimen genesis procedure used for this study, which is152
described in detail in Ref. 5, is based on a four-step process. (i) Particles with radii153
chosen randomly from a uniform size distribution are randomly generated within a154
volume bound by planar, frictionless walls. (ii) The system is allowed to adjust by155
particle movement under zero friction. (iii) A low isotropic stress is installed by156
modifying the radii of all particles simultaneously. (iv) The radii of particles that have157
less than three contacts are modified iteratively, so that these particles have at least158
three contacts (over 99% of particles have 4 or more contacts in the final model) and159

8/11/2019 Schopfer Et Al IRMMS 2009 Repository
http://slidepdf.com/reader/full/schopfer-et-al-irmms-2009-repository 10/42
their mean contact normal force is low in relation to the mean contact force of the160
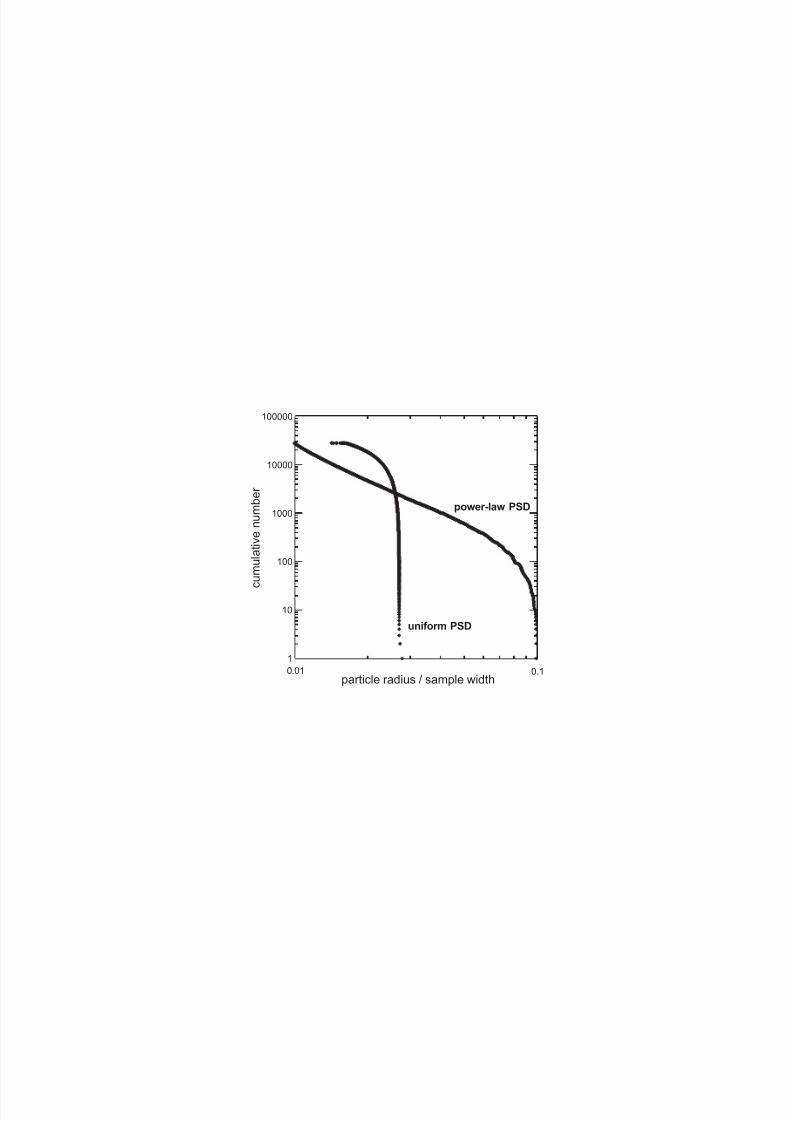
assembly. Models generated with the dynamic method had a uniform PSD with161
r max/r min of 1.66 (Fig. 3) and a porosity of ~37% (model i in Fig. 2).162
For the particle insertion method ‘seed’ particles are first generated within163
the specimen domain. The specimen is then filled up by iteratively inserting particles164
so that each new particle touches four neighbours. The filling-up of the specimen is165
completed when no further particles can be inserted. The number of particles and the166
final porosity that can be achieved with this method are a function of the predefined167
particle size range (r max/r min). Models generated with the particle insertion method had168
a power-law particle size distribution (PSD) with an exponent of ~3.0 (Fig. 3) and a169
porosity of ~23% if the maximum to minimum particle radius ratio (r max/r min) is 10170
(model ii in Fig. 2).171
Porosities between 23 and 37% were achieved in three different ways (Fig.172
2): (i) systematic deletion of the smallest particles from a power-law PSD model with173
23% porosity (2nd row in Fig. 2), (ii) direct generation of an assembly with power-law174
PSD using r max/r min < 10, and (iii) insertion of particles into a uniform PSD assembly175
with an initial porosity of 37% using the particle insertion method referred to above176
(1st row in Fig. 2). All specimens were rectangular parallelepipeds with a square base177
and a height to width ratio of 2.178
The average coordination numbers (i.e. number of contacts per particle) of179
the models range from 7.3 to 5.8, where the low porosity models have both a greater180
average and a greater range of coordination numbers. The average coordination181
numbers of the different PSD models are almost identical (within 10%) for a given182
porosity, though the range of coordination numbers is greater in the power-law PSD183
models than in the uniform/bimodal PSD models. For example, the greatest184
8/11/2019 Schopfer Et Al IRMMS 2009 Repository
http://slidepdf.com/reader/full/schopfer-et-al-irmms-2009-repository 11/42
coordination number in the 23% porosity power-law model is 131, whereas in the185
bimodal model with identical porosity it is 56. The mode of coordination numbers in186
all models is 4 (which is the value for a newly inserted particle in the particle insertion187
method explained above), except in the 37% porosity model with uniform PSD, in188
which the mode is 5. In summary, the average coordination numbers decrease slightly,189
whereas the range of coordination numbers decreases significantly with increasing190
porosity. A possible explanation for the observed relationship between mechanical191
properties and porosity is that the reduction in the number of contacts which192
accompanies an increase in porosity gives rise to an increase in the tortuosity of193
remaining force chains, causing a decrease in Young’s modulus, and an increase in194
the load they transmit causing a decrease in sample strength.195
While the model porosity values cannot be compared directly to those of real196
rocks, which are typically composed of non-spherical grains that can be packed better197
than spheres, and the effect of finite sized cement using bonds was not taken into198
account in the porosity calculations, the model results provide a means of exploring199
general mechanical consequences of porosity changes and cementation.200
201
3.3 Compression and Extension Tests202
Confined triaxial compression tests (σ 1 > σ 2 = σ 3) were performed by shortening the203
specimen along its long axis with top and bottom platens using a constant velocity204
that is slow enough to ensure quasi-static conditions, whilst maintaining a constant205
confining pressure between 0.1 and 40 MPa using servo-controlled lateral platens.206
The failure envelopes were constructed using the peak stress (σ 1) value of the stress207
strain curve at a given confining pressure (σ 3) and the angle of (internal) friction was208
calculated from the slope of the principal stress data (Eq.1).209
8/11/2019 Schopfer Et Al IRMMS 2009 Repository
http://slidepdf.com/reader/full/schopfer-et-al-irmms-2009-repository 12/42
Confined triaxial extension tests (σ 1 = σ 2 > σ 3) were performed using210
particles to apply boundary forces and velocities. The sample was first confined to the211
desired confining pressure using servo-controlled platens. Then particles touching the212
platens are identified, the platens are removed, one calculation cycle is performed, and213
the out-of-balance forces of the boundary particles are replaced by applied forces with214
the same magnitude but opposite direction. Particles of the upper and lower 10% of215
the sample are then combined to form two non-breakable clumps which are then216
pulled apart while the lateral forces are kept constant. Since a velocity is applied to all217
particles within the upper and lower portions of the model, stress concentrations that218
would arise if the model would be extended using clamps are eliminated. The219
stableness of the boundary condition used is supported by the fact that macroscopic220
failure never occurred along the edge of the clumps, but within the central part of the221
model, most likely due to elastic necking. The axial stress (σ 3) is computed by222
dividing the average out-of-balance force of the clumps by the cross-sectional area of223
the sample. Preliminary results suggest that comparison of the tensile strength values224
obtained from the direct tension tests with those derived from Brazilian disc tests is225
not straightforward, since the Brazilian strength values are sensitive to both disc226
thickness and the width of the loaded section, and disc failure occurs at the edge of the227
models, rather than in the centre of the disc, as predicted for materials with low228
UCS/T values [35].229
Young’s modulus and Poisson’s ratio were obtained from uniaxial strain tests230
(e1 ≠ 0, e2 = e3 = 0) by fixing the lateral platens and shortening the sample vertically231
(e1 > 0) until the first bond breakage occurs. The elastic parameters were calculated232
using the final stresses acting on the platens by [1]233
234

8/11/2019 Schopfer Et Al IRMMS 2009 Repository
http://slidepdf.com/reader/full/schopfer-et-al-irmms-2009-repository 13/42
11 )2( eG+= λ σ , 13221 )( eλ σ σ =+ , (2)235
236
where λ and G are Lame’s constants.237
238
4 Results and Discussion239
The models replicate a wide range of behaviours observed in laboratory deformation240
of rock, in terms of the stress-strain behaviour, the shapes of the failure envelopes and241
their dependence on the numbers of non-bonded contacts (cracks) and porosity. These242
aspects of the model results are discussed in sequence in the following sections.243
244
4.1 Stress-Strain Curves245
Stress difference and volumetric strain (volume decrease taken as negative) vs axial246
strain curves of the two end-member models (framed in Fig. 2) at various confining247
pressure are shown in Fig. 4. These curves show a variety of differences in248
mechanical behaviour between the high and low porosity models. The most obvious249
difference is that the slopes of the stress-strain curves and the peak stress values are250
much greater in the low porosity model. The slope of the stress-strain curve of a251
triaxial compression test is Young’s modulus (d σ 1/d e1 = E) and the slope of the252
volumetric strain curve is a function of Poisson’s ratio (d ev/d e1 = 2ν -1). The curves in253
Fig. 4 therefore show that, Young’s modulus is strongly dependent on porosity,254
moderately dependent on the percentage of bonded contacts and weakly dependent on255
confining pressure. The first two dependencies are discussed later; the pressure256
dependence of Young’s modulus is shown in Fig. 5a, together with the results257
obtained from uniaxial strain tests. Poisson’s ratio, however, is only weakly258
dependent on porosity and the percentage of bonded contacts, but very sensitive to259

8/11/2019 Schopfer Et Al IRMMS 2009 Repository
http://slidepdf.com/reader/full/schopfer-et-al-irmms-2009-repository 14/42
confining pressure. Especially at low confinement, Poisson’s ratio is much greater260
than the values obtained from the uniaxial strain tests (Fig. 5b). This pressure261
sensitivity of Poisson’s ratio is even more pronounced in partially bonded materials,262
which exhibit volume increase from the onset of axial shortening (dotted curves in263
Fig. 4b and e), hence Poisson’s ratios of >0.5 are obtained. These high values264
obtained from triaxial compression tests at low confinement are, however, not265
representative and therefore uniaxial strain test results are given throughout the paper.266
The stress-strain curves of the high and low porosity models do share,267
however, a number of similarities, e.g. the stress-difference and strain at failure268
increases with increasing confinement (Fig. 4). Additionally, the stress-drop after269
failure decreases and becomes less abrupt with both, increasing confinement and270
increasing number of non-bonded contacts, i.e. the material becomes less brittle. It is271
important to note, however, that Young’s modulus, strength and stress-drop can be272
increased by increasing both the particle stiffness and the bond strength without273
significantly modifying the friction angle and UCS/T as long as a load-bearing274
framework exists within the model. In the non-bonded models hardly any stress-drop275
is observed and these materials deform at an approximately constant stress-difference276
(although not constant volume) after an initial non-linear stress increase (Fig. 4c and277
f).278
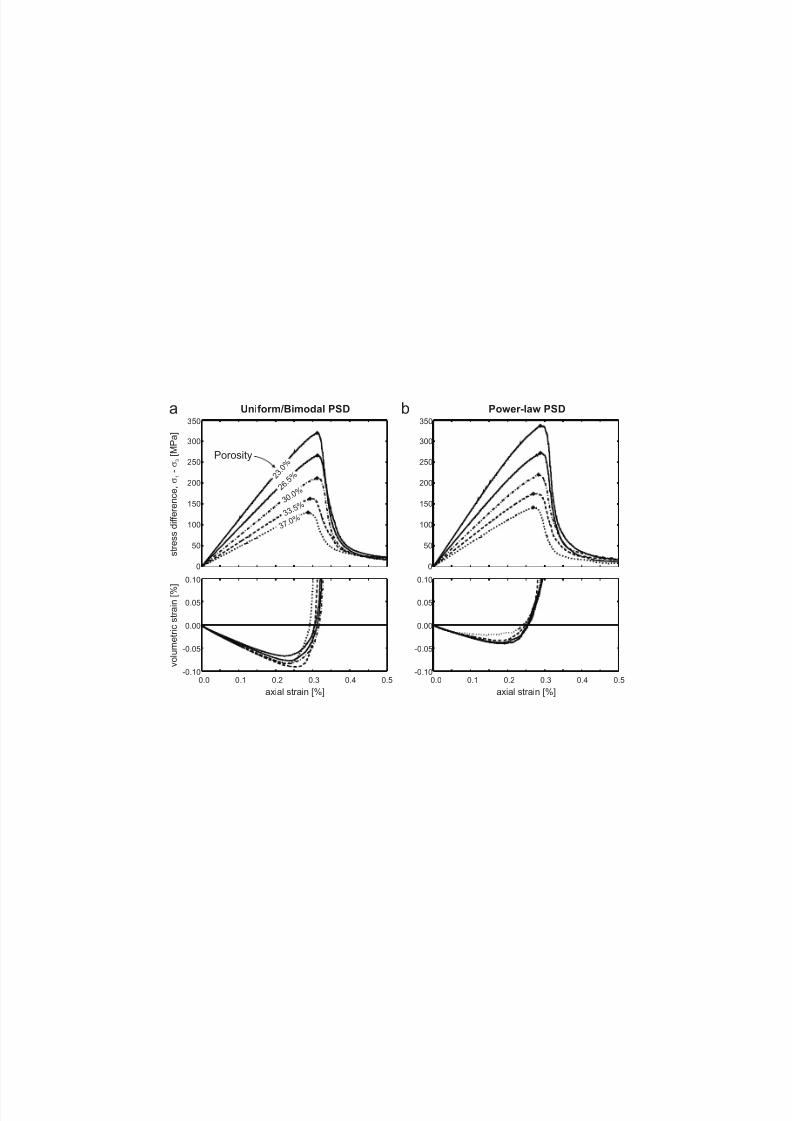
Stress-strain curves obtained from unconfined compression tests on the ten279
models shown in Fig. 2 are plotted in Fig. 6 (for fully bonded models). These curves280
illustrate that porosity has a strong impact on both peak stress and Young’s modulus.281
The particle size distribution (uniform/bimodal and power-law, Fig. 6a and b,282
respectively) has an impact on the elastic properties, where slightly higher Young’s283
moduli and (for low confinement) higher Poisson’s ratios are observed in the power-284

8/11/2019 Schopfer Et Al IRMMS 2009 Repository
http://slidepdf.com/reader/full/schopfer-et-al-irmms-2009-repository 15/42
law material. A more quantitative description of these mechanical properties/porosity285
relations is given in Section 4.5.286
287
4.2 Shape of Failure Envelopes288
Failure envelopes were constructed using peak stress values (dots in Figs. 4 and 6)289
and are plotted in principal stress diagrams in Fig. 7. The failure envelopes for the290
non-bonded materials are straight, i.e. the cohesionless materials exhibit Coulomb-291
type behaviour. The envelopes obtained from triaxial compression tests on bonded292
model materials are concave towards the minimum principal stress axis (the data293
points at σ 3 = 0 are the UCSs). Therefore, the addition of cohesion (i.e. cement) does294
not simply shift the straight failure envelope of the non-bonded material towards295
higher strength (σ 1) values, but also introduces a non-linear pressure strength296
dependence. As a consequence the angles of internal friction of the various bonded297
materials decrease non-linearly with increasing confinement, to values which are298
lower than the interlocking/sliding friction of the non-bonded material (Fig. 7c). Our299
model results are therefore in agreement with theoretical considerations [7], which300
suggest that the phenomenon of internal friction and the non-linearity of failure301
envelopes for rock can be explained by the frictional resistance to sliding offered by302
the fractured volume that comprises part of the incipient fault plane.303
The failure envelopes in the tensile field (σ 3 < 0) are non-linear and are304
‘overturned’ at low confining pressures (Fig. 7a and b). This strengthening effect is305
neither predicted from critically stressed crack theory (Griffith criterion) nor is it306
observed in lab experiments on low-porosity, crystalline rock [9,10]. However, an307
increase in tensile strength at low confining pressures was observed in confined308
triaxial extension tests on Berea sandstone (φ = ~19%; Fig. 1a [29]), which was309

8/11/2019 Schopfer Et Al IRMMS 2009 Repository
http://slidepdf.com/reader/full/schopfer-et-al-irmms-2009-repository 16/42
deformed using the same procedure as described in Ref. 9. The model failure310
envelopes shown in Fig. 7a and b illustrate that the strengthening effect becomes more311
pronounced with increasing porosity and increasing percentage of non-bonded312
contacts suggesting it is confinement related.313
The unconfined biaxial strength (σ 1 = σ 2 > 0, σ 3 = 0), which is the intercept314
of the triaxial extension failure envelope with the σ 1 axis, is greater than the UCS (σ 1 315
> 0, σ 2 = σ 3 = 0). This strength difference is due to a σ 2-dependence of strength;316
hence Mohr criteria cannot be used for fully describing failure envelopes of cohesive317
DEM materials, and more complicated criteria that take the effect of the intermediate318
stress on strength into account need to be considered, details of which are given in the319
next section.320
321
4.3 Failure Criterion322
The misfit between the triaxial extension and triaxial compression failure envelopes in323
Fig. 7a and b indicates that a Mohr criterion, where the maximum principal stress at324
failure is a function of the minimum principal stress only, can not be used to fit our325
model data. A variety of polyaxial criteria have been proposed in the past [3,8]: Here326
we use the Mogi 1967 empirical criterion [30] for quantifying the σ 2-dependence of327
strength, which is written as328
329
]2/)[(2/)( 32131 σ βσ σ σ σ ++=− f , (3)330
331
where β is a constant smaller than 1 that reflects the σ 2-dependence in332
strength, i.e. the criterion reduces to a Mohr criterion if β equals 0. f is some333
monotonically increasing function; linear, power-law and parabolic functions are the334

8/11/2019 Schopfer Et Al IRMMS 2009 Repository
http://slidepdf.com/reader/full/schopfer-et-al-irmms-2009-repository 17/42
most commonly used. The best-fit to our data was obtained using a parabolic335
function. Our analysis revealed that the best-fit β -values are independent of the336
percentage of non-bonded contacts, but are different for the two end-member porosity337
models, and are 0.19 for the 37% and 0.13 for the 23% porosity models (Fig. 8).338
Interestingly a parabolic function with a β -value of 0.14 gives a good fit to the triaxial339
extension and triaxial compression test results of Berea sandstone (φ = ~19%; Fig.340
1b). Those results provide some indication that porosity has an important control on341
the β -value. Additionally no polyaxial data, where all principal stresses are different,342
were used for determining the best-fit failure criterion in this study and it is likely that343
polyaxial data will reveal that a different criterion to that used here needs to be344
considered for fully describing the 3D failure envelope of cohesive DEM materials.345
346
4.4 Impact of Non-Bonded Contacts, or Pre-Existing ‘Cracks’347
From the failure envelopes shown in Fig. 7 and 8 it is clear that the strength of the348
model material not only depends on porosity but also on the relative abundance of349
non-bonded contacts. These non-bonded contacts could be considered to be analogous350
to non-cemented grain contacts in rock or perhaps more generally to closed, pre-351
existing cracks, where sliding occurs if a critical shear stress given by Coulomb352
friction is exceeded. The percentage of non-bonded contacts, which is the measure353
used throughout this paper to describe the proportion of cement, is clearly related to354
crack density as used in micromechanical models [1], but a direct quantitative355
comparison is difficult and beyond the scope of this study. Although we follow earlier356
analytical and laboratory studies by describing model results in terms of crack357
density, a direct link with uncemented grain-grain contacts is more valid (for example,358
high proportions of uncemented grain contacts are features of poorly lithified359

8/11/2019 Schopfer Et Al IRMMS 2009 Repository
http://slidepdf.com/reader/full/schopfer-et-al-irmms-2009-repository 18/42
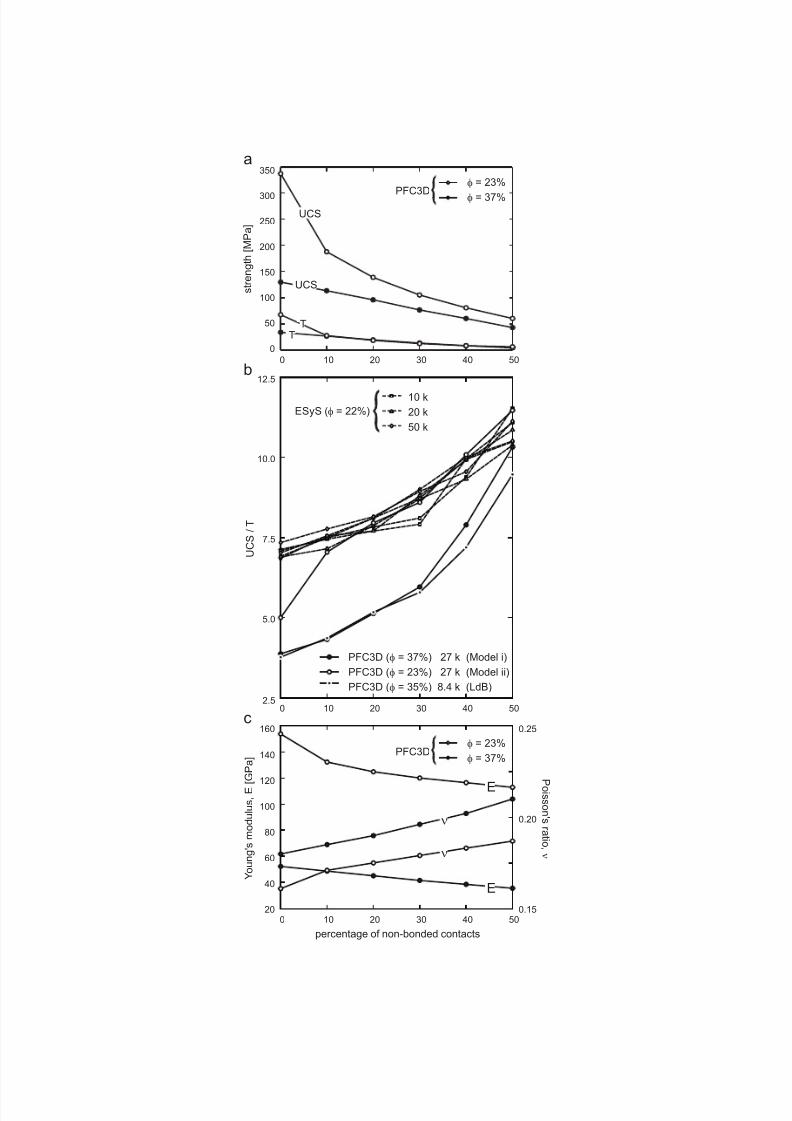
sandstones). The model results indicate that the strength of model materials decreases360
with increasing number of non-bonded contacts (Fig. 9a). Our models also show that361
the presence of non-bonded contacts has a greater impact on tensile strength than on362
compressive strength, a feature which reflects the fact that a non-bonded contact can363
bear some load in compression but no load in tension. Consequently the ratio of364
unconfined compressive strength to tensile strength (UCS/T) increases with365
increasing percentage of non-bonded contacts (Fig. 9b). A similar impact of pre-366
existing cracks on strength and UCS/T for rock was demonstrated in Ref. 16, where367
an increase of UCS/T from ~20 for intact sandstone to about 50 for sandstone with368
partially disintegrated grain boundaries is reported (Fig. 1f and g). Most importantly,369
the UCS/T ratios obtained from only partially bonded model materials are within the370
range of those described for rock, which tend to have strength ratios of ~10 [1].371
Fig. 9b shows that UCS/T also depends on model porosity, with higher372
UCS/T values obtained for lower porosity materials. The similarity between the373
UCS/T ratios for the 37% porosity PFC3D material used in this study and the 35%374
porosity model of Lac du Bonnet granite (see caption) with very different375
microproperties and sample shape is consistent with porosity exerting a significant376
control on UCS/T. The ESyS data show that UCS/T is, for the range of model sizes377
tested in this study, basically independent of model resolution. Low porosity (22-378
23%) PFC3D and ESyS data, apart from the fully bonded PFC3D model, exhibit379
identical ratios and trends, which suggests that the details of the contact and bond380
implementations have only marginal affects on UCS/T ratios of models with more381
than ca 10% non-bonded contacts. Significant differences of UCS/T for the fully382
bonded low-porosity models are only weakly dependent on porosity (Fig. 10b) and383

8/11/2019 Schopfer Et Al IRMMS 2009 Repository
http://slidepdf.com/reader/full/schopfer-et-al-irmms-2009-repository 19/42
therefore must reflect sensitivities in mechanical behaviour due to contact/bond384
implementations.385
The presence of non-bonded contacts also has an impact on the elastic386
properties (Fig. 9c): Young’s modulus ( E ) decreases whereas Poisson’s ratio (ν )387
increases with increasing percentage of non-bonded contacts. These general trends are388
also predicted by various micromechanical models for linear elastic materials389
containing randomly oriented, closed cracks (e.g. chapter 10 in Ref. 1) and similar390
relations were observed in cyclic loading experiments on granite [31], and391
experiments on sandstone with partially disintegrated grain boundaries (Fig. 1h; [16]).392
393
4.5 Porosity Relations394
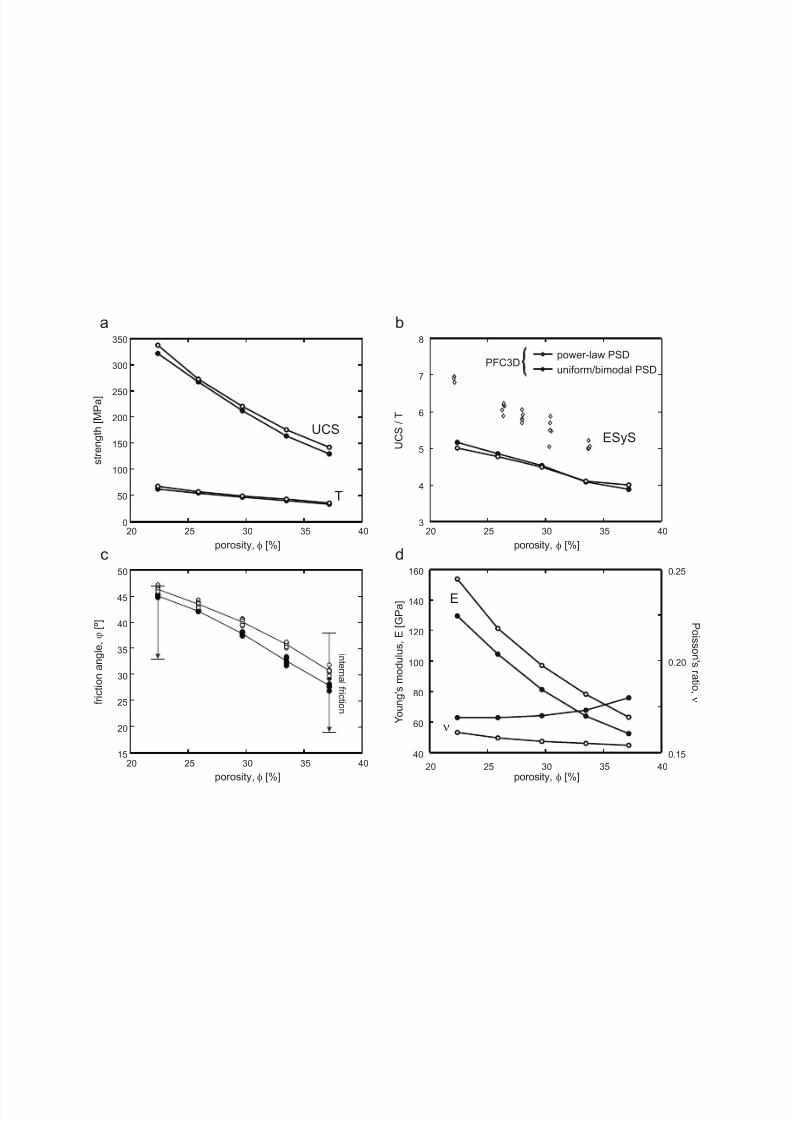
Both tensile strength (T) and unconfined compressive strength (UCS) decrease with395
increasing porosity and are basically independent of the PSD (Fig. 10a). This decrease396
in strength with increasing porosity is consistent with empirical rock property397
relations (Fig. 1c; [4]). In the models UCS, however, decreases more rapidly than T,398
and consequently UCS/T decreases with increasing porosity (Fig. 10b). The UCS/T399
ratios of the ESyS models exhibit a similar relation, though the ratios are, for a given400
porosity, greater than those obtained from PFC3D models, and also decrease more401
rapidly with increasing porosity (Fig. 10b). We believe that these results reflect the402
differences of the bond model implementations in PFC3D and ESyS.403
The friction angles for non-bonded materials with various PSDs and404
porosities are shown in Fig. 10c together with the range of internal friction angles405
determined for the fully bonded end-member models (Fig. 7c). The friction angles for406
the non-bonded materials decrease (almost) linearly with increasing porosity and are407
(almost) independent of the PSD (Fig. 10c). The internal friction angles suggest a408
8/11/2019 Schopfer Et Al IRMMS 2009 Repository
http://slidepdf.com/reader/full/schopfer-et-al-irmms-2009-repository 20/42
similar relation, though the scatter is significant due to non-linearity of the failure409
envelopes, especially at low confining pressures. Nevertheless, this general trend has410
also been described for natural rock (Fig. 1d; [4,14]). We believe that the decrease in411
friction angles with increasing porosity is due to a decrease of internal roughness,412
though future micromechanical studies are necessary to fully understand the relation413
of the angle of (internal) friction with porosity.414
Young’s modulus decreases significantly with increasing porosity, though415
the modulus is greater for the power-law than for the uniform and bimodal PSD416
models (Fig. 10d). Poisson’s ratio is (almost) independent of porosity, but higher for417
the uniform/bimodal than the power-law PSD models. The decrease in Young’s418
modulus with increasing porosity and the porosity-independence of Poisson’s ratio are419
consistent with micromechanical models [1], with data obtained from continuum420
method models [32], and with empirical rock property relations (Fig. 1e; [4]).421
Finally, as stated earlier, some of the Young’s modulus and strength values422
of the model materials are greater than those for real rock. However, since E and UCS423
(and T) are proportional to particle and bond stiffnesses, and to bond strengths,424
respectively, calibration of the model material to that of real rock (e.g. sandstone)425
should be straightforward and will be the aim of future studies.426
427
5 Summary and Conclusions428
The mechanical properties of rock and other materials are strongly dependent on429
porosity and crack density. In this study we investigate some of these dependencies430
using the Discrete Element Method (DEM) in 3D and a selection of results is shown431
in Fig. 11. Young’s modulus, strength, UCS/T and angle of (internal) friction decrease432
with increasing porosity. The elastic constants, however, also depend on confining433

8/11/2019 Schopfer Et Al IRMMS 2009 Repository
http://slidepdf.com/reader/full/schopfer-et-al-irmms-2009-repository 21/42
pressure, where Young’s modulus and Poisson’s ratio increase and decrease with434
increasing pressure, respectively. The failure envelopes of the cohesive materials are435
non-linear and the observed misfit between triaxial extension and compression436
envelopes is due to a σ 2-dependence in strength, which is more pronounced in the437
high porosity materials. Young’s modulus, strength and UCS/T decrease whereas438
Poisson’s ratio increases with decreasing cement content (increasing ‘crack’ density).439
While we have not attempted to match the range of properties of any440
particular rock, our numerical test results replicate both qualitatively and441
quantitatively the range of mechanical behaviours observed for brittle rock. Perhaps442
most importantly, by varying porosity and the proportion of bonded contacts in DEM443
materials comprised of spherical particles, it is possible to achieve the high UCS/T444
ratios and the range of angles of internal friction that are observed in rocks. These445
high UCS/T ratios and friction angles were previously only reproducible by446
modifying the DEM (using irregular shaped particles, or implementing rolling447
resistance).448
Many low-porosity, crystalline rocks exhibit UCS/T ratios greater than 10,449
i.e. greater than those achieved using the particle and bond properties of the present450
study. Although UCS/T > 10 can be easily achieved by using a greater proportion of451
non-bonded contacts (Fig. 9b), the stress and especially the volumetric strain452
behaviour becomes less similar to that observed in brittle rock (though, as expected,453
the behaviour does match that of poorly lithified, granular materials). In low-porosity454
crystalline rocks that exhibit UCS/T >10, grain interlocking and the resistance to grain455
rolling are important mechanisms that increase both friction and UCS/T. Hence it456
might be necessary to use irregular shaped particles or a particle rolling resistance457
method for modelling such low-porosity rocks. These methods have, however,458

8/11/2019 Schopfer Et Al IRMMS 2009 Repository
http://slidepdf.com/reader/full/schopfer-et-al-irmms-2009-repository 22/42
associated disadvantages, for example the lateral strains are not matched if459
unbreakable clumps are used [5, 22]. The decision as to whether to use these460
approaches or the methods outlined in this article depends on which aspects of the461
rock mechanical behaviour need to be captured in the model.462
Our study highlights the fact that both porosity and the proportion of bonded463
contacts (crack density) are important parameters that should be considered during the464
calibration of DEM materials to rocks. Including these two parameters provides a465
means of modelling a wider range of rock types than was previously possible [33].466
The relationships we observed between these two parameters and a range of467
mechanical properties closely replicate the equivalent relationships determined468
experimentally for rocks.469
470
Acknowledgments471
Childs, Schöpfer and Walsh acknowledge funding from a Science Foundation Ireland472
(SFI) grant, an Irish Research Council for Science, Engineering and Technology473
(IRCSET) Embark initiative postdoctoral research grant and financial support from474
ExxonMobil and Shell. Abe acknowledges funding from the EU-SPICE project.475
Abe’s ESyS simulations were performed on the computing cluster of the Seismology476
& Computational Rock Physics Laboratory at University College Dublin. Stimulating477
discussions with P. Cundall, M. Pierce and D. Potyondy (HCItasca) and T. Manzocchi478
(Fault Analysis Group) are gratefully acknowledged. Constructive comments of two479
anonymous reviewers and the editorial advice of R. Zimmerman are acknowledged.480
481
References 482

8/11/2019 Schopfer Et Al IRMMS 2009 Repository
http://slidepdf.com/reader/full/schopfer-et-al-irmms-2009-repository 23/42
[1] Jaeger JC, Cook NGW, Zimmerman RW. Fundamentals of rock mechanics. 4th 483
edition, Blackwell Publishing, Oxford, 2007.484
[2] Paterson, MS, Wong T-F. Experimental rock deformation – the brittle field.485
Springer, Berlin-Heidelberg, 2005.486
[3] Mogi K. Experimental rock mechanics. Geomechanics Research Series 3. Taylor487
& Francis Group, London, 2007.488
[4] Chang C, Zoback MD, Khaksar A. Empirical relations between rock strength and489
physical properties in sedimentary rocks. J Petr Sci Eng 2006;51:223-37.490
[5] Potyondy DO, Cundall PA. A bonded-particle model for rock. Int J Rock Mech491
Min Sci 2004;41:1329-64.492
[6] Cundall PA. A discontinuous future for numerical modelling in geomechanics?493
Geotech Eng 2001;149:41-47.494
[7] Savage, JC, Byerlee JD, Lockner DA. Is internal friction friction? Geophy. Res495
Let 1996;23:487-90.496
[8] Colmenares LB, Zoback MD. A statistical evaluation of intact rock failure criteria497
constrained by polyaxial test data for five different rocks. Int J Rock Mech Min Sci498
2002;39:695-729.499
[9] Ramsey JM, Chester FM. Hybrid fracture and the transition from extension500
fracture to shear fracture. Nature 2004;428:63-66.501
[10] Engelder T. Transitional-tensile fracture propagation: a status report. J Struct502
Geol 1999;21:1049-55.503
[11] Vernik L, Bruno M, Bovberg C. Empirical relations between compressive504
strength and porosity of siliciclastic rocks. Int J Rock Mech Min Sci 1993;30:677-505
80.506
8/11/2019 Schopfer Et Al IRMMS 2009 Repository
http://slidepdf.com/reader/full/schopfer-et-al-irmms-2009-repository 24/42
[12] Bell FG, Lindsay P. The petrographic and geomechanical properties of some507
sandstones from the Newspaper Member of the Natal Group near Durban, South508
Africa. Eng Geol 1999;53:57-81.509
[13] Palchik V. Influence of porosity and elastic modulus on uniaxial compressive510
strength in soft brittle porous sandstones. Rock Mech Rock Engng 1999;32:303-09.511
[14] Palchik V. Application of Mohr–Coulomb failure theory to very porous sandy512
shales. Int J Rock Mech Min Sci 2006;43:1153-62.513
[15] Rosengren KJ, Jaeger JC. The mechanical properties of an interlocked low-514
porosity aggregate. Géotechnique 1968;18:317-26.515
[16] Mahmutoglu Y. Mechanical behaviour of cyclically heated fine grained rock.516
Rock Mech Rock Eng 1998;31:169-79.517
[17] PFC3D (Particle Flow Code in Three Dimensions). Version 3.1. Minneapolis:518
Itasca Consulting Group, 2005.519
[18] Abe S, Place D Mora P. A parallel implementation of the lattice solid model for520
the simulation of rock mechanics and earthquake dynamics. PAGEOPH521
2004;161:2265-77.522
[19] Wang Y, Abe S, Latham S, Mora P. Implementation of particle-scale rotation in523
the 3-D Lattice Solid Model. PAGEOPH 2006;163:1769-85.524
[20] Thornton C. Numerical simulations of deviatoric shear deformation of granular525
media. Géotechnique 2000;50:43-53.526
[21] Boutt DF, McPherson BJOL. Simulation of sedimentary rock deformation: Lab-527
scale model calibration and parameterization. Geophys Res Lett 2002;29:1054.528
[22] Cho N, Martin CD, Sego DC. A clumped particle model for rock. Int J Rock529
Mech Min Sci 2007;44:997-1010.530

8/11/2019 Schopfer Et Al IRMMS 2009 Repository
http://slidepdf.com/reader/full/schopfer-et-al-irmms-2009-repository 25/42
[23] Ting JM, Khwaja M, Meachum LR, Rowell JD. An ellipse-based discrete531
element model for granular materials. Int J Numer Anal Methods Geomech532
1993;17:603–23.533
[24] Iwashita K, Oda M. Rolling resistance at contacts in simulation of shear band534
development by DEM. J Engrg Mech 1998;124:285-92.535
[25] Egholm DL. A new strategy for discrete element numerical models: 1. Theory. J536
Geophys Res 2007;112:B05203.537
[26] Fakhimi A. Application of slightly overlapped circular particles assembly in538
numerical simulation of rocks with high friction angles. Eng Geol 2004;74:129-38.539
[27] Bagi K. An algorithm to generate random dense arrangements for discrete540
element simulations of granular assemblies. Granular Matter 2005;7:31-43.541
[28] Place D, Mora P. A random lattice solid model for simulation of fault zone542
dynamics and fracture process. In: Bifurcation and Localisation Theory in543
Geomechanics, Balkema Rotterdam/Brookfield, 2001.544
[29] Bobich JK. Experimental analysis of the extension to shear fracture transition in545
Berea Sandstone. MSc thesis, Dept of Geol & Geophys, University of Texas at546
Austin, 2005.547
[30] Mogi K. Effect of intermediate principal stress on rock failure. J Geophys Res548
1967;72:5117-31.549
[31] Faulkner DR, Mitchell TM, Healy D, Heap MJ. Slip on 'weak' faults by the550
rotation of regional stress in the fracture damage zone. Nature 2006;444:922-25.551
[32] Avar BB, Hudymab N, Karakouziana M. Porosity dependence of the elastic552
modulus of lithophysae-rich tuff: numerical and experimental investigations. Int J553
Rock Mech Min Sci 2003;40:919-28.554
8/11/2019 Schopfer Et Al IRMMS 2009 Repository
http://slidepdf.com/reader/full/schopfer-et-al-irmms-2009-repository 26/42
[33] Yoon J. Application of experimental design and optimization to PFC model555
calibration in uniaxial compression simulation. Int J Rock Mech Min Sci556
2007;44:871-889.557
[34] Wong T-F, David C, Zhu W. The transition from brittle faulting to cataclastic558
flow in porous sandstones: Mechanical deformation. J Geophys Res559
1997;102:3009-25.560
[35] Fairhurst C. On the validity of the ‘Brazilian’ test for brittle materials. Int J Rock561
Mech Min Sci 1964;1:535-546.562
563

8/11/2019 Schopfer Et Al IRMMS 2009 Repository
http://slidepdf.com/reader/full/schopfer-et-al-irmms-2009-repository 27/42
Figure captions564
565
Fig. 1. Failure envelopes and rock property relations of siliciclastic rocks. (a) Peak566
stress data obtained from triaxial extension tests on Berea sandstone at various567
confining pressures plotted in principal stress diagram. (b) Data shown in (a) together568
with results from triaxial compression tests on Berea sandstone plotted on a maximum569
shear stress vs mean stress diagram. Best-fit parabolic Mogi 1967 failure criterion570
[30] is shown (Texas A&M data from Ref. 29, Wong et al. data from Ref. 34). (c)571
Strength at various confining pressure (labelled curves), (d) friction angle and (e)572
Young’s modulus vs porosity for Donetsk sandstone (data in (c) and (d) from Ref. 14,573
and data in (e) from Ref. 13). (f) Unconfined compressive and tensile strength (UCS574
and T, respectively), (g) UCS/T and (h) Young’s modulus vs number of heating575
cycles for Buchberger sandstone (data from Ref. 16).576
577
Fig. 2. PFC3D models used in this study. The two end-member models (i and ii) are578
comprised of ~27,000 particles and their particle size distributions are shown in Fig.579
3.580
581
Fig. 3. Plot of cumulative number of particles vs particle radius normalised to the582
sample width for the two end-member models (framed in Fig. 2).583
584
Fig. 4. Stress difference and volumetric strain vs axial strain curves obtained from585
triaxial compression tests at different confining pressures. Plots in left column are for586
high porosity end-member (model i in Fig. 2) and the plots in the right column are for587
low porosity end-member (model ii in Fig. 2). Model results in the first row were588
8/11/2019 Schopfer Et Al IRMMS 2009 Repository
http://slidepdf.com/reader/full/schopfer-et-al-irmms-2009-repository 28/42
obtained from fully bonded models, results in second row from models with half of589
the particle-particle contacts bonded, and results in third row from non-bonded590
models. The open dots are the peak stress values which were used for constructing the591
failure envelopes shown in Fig. 7.592
593
Fig. 5. (a) Young’s modulus and (b) Poisson’s ratio vs confining pressure obtained594
from the slopes of the stress-strain curves shown in Fig. 4a and d (fully bonded595
models). Open and filled symbols are data from low and high porosity models,596
respectively. Elastic properties were determined at an axial strain of a tenth of the597
strain at peak stress. Circles and squares denote tangent and secant moduli,598
respectively. The dashed horizontal lines in each graph are the elastic property values599
obtained from the uniaxial strain tests.600
601
Fig. 6. Stress difference and volumetric strain vs axial strain curves obtained from602
unconfined compression tests on the models shown in the (a) first and (b) second row603
of Fig. 2. Open dots are peak stress values, which are plotted vs porosity in Fig. 10a.604
605
Fig. 7. (a and b) Failure envelopes of the two end-member models (framed in Fig. 2)606
in principal stress diagrams, and (c) friction angle (obtained from the slopes of triaxial607
compression failure envelopes) vs average confining pressure. Labels ranging from 10608
to 50 are percentages of non-bonded contacts. For clarity envelopes obtained from609
triaxial extension tests are cut off at the σ 1 axis. The misfit between the triaxial610
extension and triaxial compression envelopes is due to a σ 2 dependence of strength.611
612

8/11/2019 Schopfer Et Al IRMMS 2009 Repository
http://slidepdf.com/reader/full/schopfer-et-al-irmms-2009-repository 29/42
Fig. 8. Data shown in Fig. 7 plotted in maximum shear stress vs mean stress diagrams613
(same line styles as in Fig. 7) for (a) a power-law PSD material with 23% porosity614
and (b) a uniform PSD material with 37% porosity. Labels ranging from 10 to 50 are615
percentages of non-bonded contacts. The curves are best-fit parabolic functions that616
were obtained using a least-square regression and by systematically varying the β -617
value given in Eq. (3).618
619
Fig. 9. (a) Unconfined compressive and tensile strength (UCS and T, respectively),620
(b) UCS/T, and (c) elastic properties vs percentage of non-bonded contacts. Keys to621
the curves are shown: the numbers followed by a k (= thousand) is the approximate622
number of particles comprising the models, and φ is the porosity. LdB are UCS/T data623
from PFC3D models of cylindrical specimens of Lac du Bonnet granite provided by624
David Potyondy (microproperties given in Ref. 5).625
626
Fig. 10. Plots of (a) unconfined compressive and tensile strength (UCS and T,627
respectively), (b) UCS/T, (c) friction angle, and (d) elastic properties vs porosity. Data628
in (a, b and d) were obtained from fully bonded materials and data in (c) from non-629
bonded materials (using the same range of confining pressure as in Fig. 7c). The bars630
in (c) indicate the range of internal friction angles obtained for fully bonded materials631
(Fig. 7c); arrows point towards increasing confinement. ESyS models (UCS/T data in632
b) with various porosities were generated by varying the particle size range for the633
particle insertion method (see text for details).634
635
Fig. 11. Chart summarizing some of the mechanical property relations obtained in this636
study. σ = stress/strength, ε = strain, P = confining pressure, E = Young’s modulus, ν 637

8/11/2019 Schopfer Et Al IRMMS 2009 Repository
http://slidepdf.com/reader/full/schopfer-et-al-irmms-2009-repository 30/42
= Poisson’s ratio, ϕ = friction angle, and ρ crks = ‘crack density’ or percentage of non-638
bonded contacts. Solid curves are for fully or partially bonded materials, dashed639
curves for non-bonded materials. The graphs are selected results from Figs. 4, 5, 7 and640
9. See text for further explanation.641

8/11/2019 Schopfer Et Al IRMMS 2009 Repository
http://slidepdf.com/reader/full/schopfer-et-al-irmms-2009-repository 31/42
Table 1642
PFC3D microproperties643
Symbol Descriptiona Value
E c, GPa Young’s modulus of particles 50
k n / k s ratio of particle normal to shear stiffness 2.5
µ c particle contact friction coefficient 0.5
c E , GPa
cement (i.e. bond) modulus 50
nk /
sk
ratio of bond normal to shear stiffness 2.5
cσ , MPa average tensile bond strength (standard deviation) 100 (20)
cτ , MPa average shear bond strength (standard deviation) 100 (20)
λ bond width multiplier 1
a Definition of microproperties and modulus-stiffness scaling relations are given in644
Ref 5.645

8/11/2019 Schopfer Et Al IRMMS 2009 Repository
http://slidepdf.com/reader/full/schopfer-et-al-irmms-2009-repository 32/42
15 0
0
0
2
2
2
4
4
4
6
6
6
8
8
8
10
10
10
12
12
12
14
14
14
16
16
16
18
18
18
20 25 30 35 40 45 50 550 0
10
21.0
0 0
50
0 50 100 150 200 250 300 350 400
100
150
200
20
40
60
80
100
120
140
160
180
1.5
2.0
2.5
3.0
4
6
8
10
12
20
30
40
50
60
20
40
60
80
100
10
20
30
40
50
60
70
80
porosity [%]
porosity [%]
porosity [%] number of heating cycles
number of heating cycles
number of heating cycles
s t r e n g t h [ M P a ]
s t r e n g t h [ M P a ]
Y o u n g ' s m o d u l u s [ G P a
]
Y o u n g ' s m o d u l u s [ G P a
]
[ M P a ]
1
=
-
[ M P a ]
m a x
1
) / 2 3
[MPa]3 = (+ 0.14+m 1 2 )/2 [MPa]3
f r i c t i o n a n g l e , [ º ]
U C S / T
15
15
-10 -5 0 5 10 15
20
20
25
25
30
30
35
35
40
40
45
45
50
50
55
55
35
40
45
50
55
60
65
UCS
T
= -0.001+ 0.811+ 7.018max m m
2
2
3
0
1
23
confining pressure [MPa]
a b
f c
gd
he
triaxial extensiontriaxial compressiontriaxial compression
Texas A&M
Wong et al.
8/11/2019 Schopfer Et Al IRMMS 2009 Repository
http://slidepdf.com/reader/full/schopfer-et-al-irmms-2009-repository 33/42
porosity increase
u n i f o r m /
b i m o d a l P S D
p o w e r - l a w
P S D
particle insertion
particle deletion
(i)
(ii)
23.0% 26.5% 30.0% 33.5% 37.0%
Figure 2
8/11/2019 Schopfer Et Al IRMMS 2009 Repository
http://slidepdf.com/reader/full/schopfer-et-al-irmms-2009-repository 34/42
1
10
100
1000
10000
100000
0.10.01
c u m u l a t i v e n u m b e r
particle radius / sample width
uniform PSD
power-law PSD

8/11/2019 Schopfer Et Al IRMMS 2009 Repository
http://slidepdf.com/reader/full/schopfer-et-al-irmms-2009-repository 35/42
0
0
0
0
0
0
0.0
0.0
0.0
0.0
0.0
0.0
-0.1
-0.1
-0.1
-0.1
-0.1
-0.1
-0.2
-0.2
-0.2
-0.2
-0.2
-0.2
-0.3
-0.3
-0.3
-0.3
-0.3
-0.3
0.1
0.1
0.1
0.1
0.1
0.1
0.2
0.2
0.2
0.2
0.2
0.2
100
100
100
100
100
100
200
200
200
200
200
200
300
300
300
300
300
300
400
400
400
400
400
400
500
500
500
500
500
500
0.0
0.0
0.0
0.0
0.0
0.0
0.1
0.1
0.1
0.1
0.1
0.1
0.2
0.2
0.2
0.2
0.2
0.2
0.3
0.3
0.3
0.3
0.3
0.3
0.4
0.4
0.4
0.4
0.4
0.4
0.5
0.5
0.5
0.5
0.5
0.5
s t r e s s d i f f e r e n c e , -
[ M P a ]
1
3
s t r e s s d i f f e r e n c e ,
-
[ M P a ]
1
3
s t r e s s d i f f e r e n c e ,
-
[ M P a ]
1
3
s t r e s s d i f f e r e n c e , -
[ M P a ]
1
3
s t r e s s d i f f e r e n c e ,
-
[ M P a ]
1
3
s t r e s s d i f f e r e n c e ,
-
[ M P a ]
1
3
v o l u m e t r i c s t r a i n [ % ]
v o l u m e t r i c s t r a i n [ % ]
v o l u m e t r i c s t r a i n [ % ]
v o l u m e t r i c s t r a i n [ % ]
v o l u m e t r i c s t r a i n [ % ]
v o l u m e t r i c s t r a i n [ % ]
axial strain [%]
axial strain [%]
axial strain [%]
axial strain [%]
axial strain [%]
axial strain [%]
f u l l y b o n d e d
5 0 %
b o n d e d c o n t a c t s
n o n - b o n d e d
5
1
15
2
25
3
35
4
1
5
1015
20
2530
35
40
0.1
confining pressure
peak stress
a d
b e
c f
Uniform particle size distribution
Porosity= 37%
Power-law particle size distribution
Porosity= 23%

8/11/2019 Schopfer Et Al IRMMS 2009 Repository
http://slidepdf.com/reader/full/schopfer-et-al-irmms-2009-repository 36/42
0
0
0
0.00
0.25
0.50
20
40
60
80
100
120
140
160
180
5
5
10
10
15
15
20
20
25
25
30
30
35
35
40
40
Y o u n g ' s m o d u l u s [ G P a ]
P o i s s o n ' s r a t i o
confining pressure [MPa]
= 23%
= 23%
= 37%
= 37%
a
b
uni ax i al s t r ai n t e s t r e s ul t s
tangent
secant
8/11/2019 Schopfer Et Al IRMMS 2009 Repository
http://slidepdf.com/reader/full/schopfer-et-al-irmms-2009-repository 37/42
0.00 0.00
0.05 0.05
-0.05 -0.05
0.10 0.10
-0.10 -0.100.0 0.00.1 0.10.2 0.20.3 0.30.4 0.40.5 0.5
0 0
50 50
100 100
150 150
200 200
250 250
300 300
350 350
s t r e s s d i f f e r e n c e ,
-
[ M P a ]
1
3
v o l u m e t r i c s t r a i n [ % ]
axial strain [%] axial strain [%]
2
3
0
2
6
5
3
0
0
3
3
5
3
7
0
Porosity
a bUniform/Bimodal PSD Power-law PSD
2 3 . 0 %
2 6 . 5 %
3 0. 0 %
3 3. 5 %
3 7. 0 %

8/11/2019 Schopfer Et Al IRMMS 2009 Repository
http://slidepdf.com/reader/full/schopfer-et-al-irmms-2009-repository 38/42
-80 -80-40 -40-60 -60-20 -200 020 2040 40
500 500
400 400
300 300
200 200
100 100
0 0
minimum principal stress,[MPa]3 minimum principal stress,[MPa]3
m a x i m u m p
r i n c i p a l s t r e s s ,
[ M P a ]
1
m a x i m u m p
r i n c i p a l s t r e s s ,
[ M P a ]
1
ba
c
triaxial extension
triaxial compression
triaxial extension
triaxial compression
fully bonded
fully bonded
fully bonded
fully bonded
non-bonded
non-bonded
non-bonded
non-bonded
010
20
30
40
50
10 20 30 40
a n g l e
o f ( i n t e r n a l ) f r i c t i o n ,
[ ° ]
average confining pressure [MPa]
Uniform particle size distribution
Porosity= 37%
Power-law particle size distribution
Porosity= 23%
2
4
1 0
2 0
3 0
4 0
5 0
2
4
5
1 0
2 0
3 0
4 0
5 0
= 23%
= 37%
10
2 0
3 0
4 0
5 0
1 0
2030
405 0

8/11/2019 Schopfer Et Al IRMMS 2009 Repository
http://slidepdf.com/reader/full/schopfer-et-al-irmms-2009-repository 39/42
-25 0
0-50 50 100 150 200 250 300
0
0
50
100
150
200
250
25
50
75
100
125
25 50 75 100 125 150
m a x . s h e a r s t r e s s ,
= (
-
) / 2 [ M P a ]
m a x
1
3
m a x . s h e a r s t r e s s ,
= ( -
) / 2 [ M P a ]
m a x
1
3
mean stress,= (+ 0.13+)/2 [MPa]m 1 2 3
mean stress,= (+ 0.19+)/2 [MPa]m 1 2 3
a
b Uniform particle size distribution
Porosity= 37%
Power-law particle size distribution
Porosity= 23%
= a+ bmax m + cm
2
= a+ bmax m + cm
2
triaxial extensiontriaxial compression
triaxial extensiontriaxial compression
fully bonded
fully bonded
non-bonded
non-bonded
1 0
1 0
2 0
2 0
3 0
3 0
4 0
4 0
5 0
5 0
8/11/2019 Schopfer Et Al IRMMS 2009 Repository
http://slidepdf.com/reader/full/schopfer-et-al-irmms-2009-repository 40/42
0
0
0
10
10
10
20
20
20
30
30
30
40
40
40
50
50
50
2.5
5.0
7.5
10.0
12.5
percentage of non-bonded contacts
U C S / T
10 k
20 k
50 k
ESyS (= 22%)
= 23%PFC3D
= 37%
PFC3D (= 23%) 27 k (Model ii)
PFC3D (= 37%) 27 k (Model i)
PFC3D (= 35%) 8.4 k (LdB)
Y o u n g ' s m o d u l u s ,
E [ G P a ]
s t r e n g t h [ M P a ]
P oi s s on' s r a t i o ,
20
0
50
100
150
200
250
300
350
40
60
80
100
120
140
160
0.15
0.20
0.25
E
E
a
b
c
= 23%
PFC3D = 37%
U SUCS
U SUCS
TTTT
8/11/2019 Schopfer Et Al IRMMS 2009 Repository
http://slidepdf.com/reader/full/schopfer-et-al-irmms-2009-repository 41/42
0.15
0.20
0.25
40
0
50
100
150
200
250
300
350
60
80
100
120
140
160
20
20
25
25
30
30
35
35
40
40
Y o u n g ' s m o d u l u s ,
E [ G P a ]
P oi s s on' s r a t i o ,
E
porosity,[%]
porosity,[%]
porosity,[%]
porosity,[%]
s t r e n g t h [ M P a ]
UCS
T
a
c
b
d
3
4
5
6
7
8
20
20
25
25
30
30
35
35
40
40
U C S / T
f r i c t i o n a n g l e , [ º ]
ESyS
50
45
40
35
30
25
20
15
power-law PSD
uniform/bimodal PSDPFC3D
i n t er n al f r i c t i on

8/11/2019 Schopfer Et Al IRMMS 2009 Repository
http://slidepdf.com/reader/full/schopfer-et-al-irmms-2009-repository 42/42
-
1
3
1 1
3 3
-
1
3
v o l
v o l
high porosity
-T
UCS
P
P
P
P
crks
crks
crks
crks
E
E
E
E
UCSUCS
TT
E
E
E
E
low porosity
s t r e s s v s a x i a l s t r a i n a n d
v o l u m e t r i c s t r a i n v s s t r a i n
e l a s t i c p r o
p e r t i e s v s
c o n f i n i n g
p r e s s u r e
f a i l u r e e n v e l o p e s i n
p r i n c i p a l s t r e s s d i a g r a m
f r i c t i o n a n g l e v s
c o n f i n i n g p r e s s u r e
u n c o n f i n e d s t r e n g t h v s
' c r a
c k ' d e n s i t y
e l a s t i c p r o p e r t i e s v s
' c r a c k ' d e n s i t y