
Study on Preparation and Characterization of Monolithic...
137
Justus-Liebig-Universität Gießen Study on Preparation and Characterization of Monolithic Silica Capillary Columns for High Separation Efficiency in High Performance Liquid Chromatography Dissertation zur Erlangung des akademischen Grades „doctor rerum naturalium” (Dr. rer. nat.) in der Wissenschaftsdisziplin „Physikalische Chemie” eingereicht an der Naturwissenschaftlichen Fakultät Justus-Liebig-Universität Gießen von Takeshi Hara Gießen, im Oktober 2012
Transcript of Study on Preparation and Characterization of Monolithic...

Justus-Liebig-Universität Gießen
Study on Preparation and Characterization of
Monolithic Silica Capillary Columns for High
Separation Efficiency in High Performance Liquid
Chromatography
Dissertation
zur Erlangung des akademischen Grades
„doctor rerum naturalium”
(Dr. rer. nat.)
in der Wissenschaftsdisziplin „Physikalische Chemie”
eingereicht an der
Naturwissenschaftlichen Fakultät
Justus-Liebig-Universität Gießen
von
Takeshi Hara
Gießen, im Oktober 2012


- III -
“Monolith”: Ayer’s rock in middle of Australia
“I do not know what I may appear to the world, but to myself I seem to have been only like a
boy playing on the seashore, and diverting myself in now and then finding a smoother pebble
or a prettier shell than ordinary, whilst the great ocean of truth lay all undiscovered before
me.”
- Issac Newton -
私が世界にどう写っているかわからないが、自分自身は浜辺で遊んでいる子供のように思
える。より丸い石か、より綺麗な貝殻を探すのに没頭している間にも、大いなる真実の海は
私の前にまだ発見されずにいるのだ。
アイザック・ニュートン

- IV -
Dean / Dekan
Reviewer / Gutachter Prof. Dr. Bernd Michael Smarsly
Reviewer / Gutachter Prof. Dr. Ulrich Tallarek
Submitted / Eingereicht:

- V -
The present thesis was prepared in the period of 1.4.2008 – 30.9.2012 at the Institute of
Physical Chemistry of Justus‐Liebig‐University Giessen under the supervision and
guidance of Prof. Dr. Bernd Michael Smarsly.
I declare:
The present thesis was prepared by myself and without illicit help from others. Any citations
being included literally or by adaptation from the literature or personal communication, have
been marked appropriately. The principles of best practice in academia, as documented in the
respective charter of the Justus‐Liebig‐University have been applied in all investigations
constituting this thesis.
Die vorliegende Arbeit wurden in der Zeit vom 1.4.2008 – 30.9.2012 am Physikalisch‐
Chemischen Institut der Justus‐Liebig‐Universität Gießen bei Prof. Dr. Bernd Michael
Smarsly durchgeführt.
Ich erkläre:
Ich habe die vorgelegte Dissertation selbständig und ohne unerlaubte fremde Hilfe und nur
mit den Hilfen angefertigt, die ich in der Dissertation angegeben habe. Alle Textstellen, die
wörtlich oder sinngemäß aus veröffentlichten Schriften entnommen sind, und alle Angaben,
die auf mündlichen Auskünften beruhen, sind als solche kenntlich gemacht. Bei den von mir
durchgeführten und in der Dissertation erwähnten Untersuchungen habe ich die Grundsätze
guter wissenschaftlicher Praxis eingehalten, wie sie in der „Satzung der Justus‐Liebig‐
Universität Gießen zur Sicherung guter wissenschaftlicher Praxis“ niedergelegt sind.
Gießen, den 17. Oktober 2012
Takeshi Hara

- VI -
- VII -
Abstract
This thesis addresses the preparation and characterization of monolithic silica capillary
columns to examine column performance in high performance liquid chromatography. The
monolithic silica capillaries and monolithic silica rods, prepared under similar preparation
conditions, were evaluated. The most important findings in this thesis are as follows:
First, it was successful to control retention ability and retention selectivity of solutes in
reversed-phase liquid chromatography by changing the composition of the preparation feed
solution. The hybrid columns prepared with tetramethoxysilane and methyltrimethoxysilane
under the present preparation conditions were able to show higher column efficiency than the
hybrid columns reported previously, while maintaining the retention factors in a similar range
by reducing the concentration of methyltrimethoxysilane and increasing the total silane
concentration in the feed solution.
Second, the effects of hydrothermal treatments at 80 °C and 120 °C on mesoporosity of
monolithic silica were investigated. The results of pore characterization of the capillary
columns by inverse size exclusion chromatography were compatible with those of the
nitrogen physisorption measurements performed on the silica rods regarding pore size
distribution. The effect of hydrothermal treatment or silica precursor on mesopore size and
surface area could be detected. In reversed-phase liquid chromatography, the hybrid column
treated at 80 °C showed low column efficiency for large molecules (e.g. insulin), but not for
small molecules (alkylbenzenes), because of the absence of the additional hydrothermal
treatment at 120 °C. In contrast, for pure silica columns produced with tetramethoxysilane
only, no significant difference in column efficiency was observable. The aforementioned
difference supported the results of the examination by inverse size exclusion chromatography
and the nitrogen physisorption measurement performed on the hybrid silica, treated at 80 °C
only, showing the presence of a large volume of small pores below 60 Å. Consequently, it
was suggested that the hydrothermal treatment at 120 °C has a stronger influence on the
hybrid column in comparison with the pure silica column, to provide higher column
efficiency with an increase in molecular size of solute.

- VIII -
-Contents-
Page
1 Introduction 1
1.1 Overview 1
1.2 Motivation
7
1.2.1 Motivation for Characterization of Monolithic Silica Rods 7
1.2.2 Motivation for Investigation of Hybrid Monolithic Silica Capillary
Columns Prepared by Changing MTMS Concentration 9
1.2.3 Motivation for Study on Effect of Mesoporosity on Column Performance 11
2 Fundamental Theory of Liquid Chromatography 13
2.1 Plate Theory 13
2.2 Chromatographic Parameters in HPLC 16
2.3 Rate Theory 21
3 Principle of Preparation of Monolithic Silica 23
3.1 Formation of Macropores in Monolithic Silica 23
3.2 Formation of Mesopores in Monolithic Silica 27
4 Preparation Process 29
4.1 Pretreatment of Fused-Silica Capillary 29
4.2 Preparation of TMOS Monolithic Silica Capillary Column 30
4.3 Preparation of Hybrid Monolithic Silica Capillary Column 32
4.4 Preparation of Monolithic Silica Rod 33
4.5 Silylation of Monolithic Silica 34
4.5.1 Octadecylsilylation of Monolithic Silica Capillary Column 34
4.5.2 Endcapping of Monolithic Silica Capillary Column 35
4.5.3 Octadecylsilylation of Monolithic Silica Rod 36
5 Measurements 37
5.1 Reversed-Phase Liquid Chromatography 37
- IX -
5.2 Size Exclusion Chromatography 38
5.3 Scanning Electron Microscopy 39
5.4 Mercury Intrusion Porosimetry 40
5.5 Nitrogen Physisorption Method 41
5.6 Infrared Adsorption Spectroscopy 43
5.7 Thermal Analysis 45
5.8 Elemental Analysis 47
6 Results and Discussions 48
6.1 Characterization of Monolithic Silica Rods 48
6.1.1 SEM Observation for Monolithic Silica Rods 48
6.1.2 Mercury Intrusion Porosimetry for Monolithic Silica Rods 49
6.1.3 Nitrogen Physisorption Measurements of Monolithic Silica Rods 53
6.1.3.1 Importance of Hydrothermal Treatment with Urea 53
6.1.3.2 Examination of Porosity of TMOS and Hybrid Monolithic Silica
Rods 54
6.1.3.3 Effect of MTMS Concentration on Mesoporosity 57
6.1.4 IR Adsorption Spectroscopy for Monolithic Silica Rods 58
6.1.4.1 KBr Tablet Method 58
6.1.4.2 ATR Method 59
6.1.5 Thermal Analysis of Monolithic Silica Rods 60
6.1.6 Elemental Analysis of Monolithic Silica Rods 62
6.1.6.1 Elemental Analysis of Bare Monolithic Silica Rods 62
6.1.6.2 Elemental Analysis of ODS-Modified Monolithic Silica Rods 63
6.1.7 Conclusions 67
6.2 Investigation of Hybrid Monolithic Silica Capillary Columns Prepared by
Changing MTMS Concentration 69
6.2.1 Feed Composition for Monolithic Silica Capillary Columns 69
6.2.2 SEM Observation for Monolithic Silica Capillary Columns 70
6.2.3 Characterization of Monolithic Silica Capillary Columns by SEC 74
6.2.4 Steric Selectivity for o-Terphenyl and Triphenylene with Monolithic Silica
Columns 79
6.2.5 Evaluation of Column Efficiency with Monolithic Silica Columns 82

- X -
6.2.6 Comparison of Column Pressure Drop with Monolithic Silica Columns 85
6.2.7 Van Deemter Plots for Monolithic Silica Columns 86
6.2.8 Kinetic Plots for Monolithic Silica Columns 88
6.2.9 Conclusions 90
6.3 Study on Effect of Mesoporosity on Column Performance 91
6.3.1 Preparation Conditions for Monolithic Silica Capillary Columns 91
6.3.2 Characterization of Monolithic Silica Capillary Columns by Inverse Size
Exclusion Chromatography 92
6.3.3 Effect of Hydrothermal Treatment on Retention Factors for Alkylbenzenes 95
6.3.4 SEM Observation and Examination of Permeability with Monolithic
Silica Columns 97
6.3.5 Comparison of Column Efficiency with Alkylbenzenes 102
6.3.6 Comparison of Column Efficiency with Peptides 104
6.3.7 Conclusions 109
7 Summary and Outlook 110
8 Acknowledgements 112
9 Appendices 113
9.1 Chemicals and Instruments 113
9.1.1 Reagents for Preparation of Monolithic Silica 113
9.1.2 Reagents for Surface Modification 113
9.1.3 Solutes for Evaluation of Column Performance 113
9.1.4 Solvents for Measurements in HPLC 114
9.1.5 Fused-Silica Capillary 114
9.1.6 Instruments for Preparation of Monolithic Silica 114
9.1.7 HPLC Instruments 115
9.1.8 Syringe Pump for Surface Modification 115
9.1.9 SEM Instruments 115
9.1.10 Mercury Intrusion Porosimeter 115
9.1.11 Nitrogen Physisorption Instruments 115
9.1.12 Commission Analysis 115

- XI -
9.2 Estimation of Carbon Content of ODS Groups for Hybrid Silica 116
9.3 References 119
9.4 Abbreviations 126

Chapter 1
- 1 -
1 Introduction
1.1 Overview
High performance liquid chromatography (HPLC) has been applied widely to separation,
identification, and quantitative analysis of chemical substances in many industries. In most
cases, HPLC analysis has been carried out in reversed-phase liquid chromatography (RPLC)
using non-polar stationary phase and polar solvents as mobile phase. In general, inorganic
and organic polymer gel particles, packed into a stainless column, are utilized as a
separation medium in RPLC. For example, styrene-divinylbenzene copolymer or glycidyl
methacrylate-ethylene dimethacrylate copolymer is applied as a synthetic polymer gel to
separate chemical compounds [1‒3]. In the case of a synthetic polymer gel, the insertion of a
functional group into the material as well as the control of mesoporosity is possible. In
addition, a polymer gel commonly possesses high chemical stability, which allows for the use
of the material in a wide range of pH values [2]. However, there is a constraint on the use of
polymer gels because of the low mechanical stability under high pressure in a HPLC
measurement. Additionally, shrinkage or swelling of polymer particles is caused by organic
solvent in the mobile phase, resulting in change of the packing condition inside a column.
On the other hand, silica gel particles are available as an inorganic packing material in HPLC.
For stationary phases with respect to silica gel particles, it is established that the surface
modification can be carried out by a silylation to introduce a functional group. For instance, the
surfaces on silica particles can be modified by octyl chain (C8) or octadecyl chain (ODS: C18)
groups [2]. Besides the silylation, a supporting stationary phase of polysaccharides such as
cellulose and amylose derivatives on the surface can be used [4, 5]. Furthermore, polymerization
methods of monomers to the anchors introduced on silica surfaces have been studied [6, 7].
Chemically-modified silica gel particles enable the application of a variety of organic
solvents as mobile phase, because the influence of shrinkage or swelling is negligible in a
HPLC measurement. Silica gel particles possess high mechanical strength to withstand high
pressure. This can provide the advantage of packing small particles into a column in order to
result in high column performance. However, a silica material is chemically unstable in
measurement conditions at high pH value because of the dissolution of silica gel. Moreover,
there is a problem about separation of basic compounds, which is due to the presence of
residual silanol groups on the silica surface. To improve the performance, there is considerable
interest in developments such as, e.g. silicone coating on silica surfaces [8, 9], introduction of
Chapter 1
- 2 -
stationary phase possessing a polar functional group inside an alkyl chain [10, 11] and preparation
of organic-inorganic hybrid silica gel particles [12].
Fast and high efficiency separations are desired in many applications of HPLC. Especially,
the requirements to HPLC are practically important with respect to drug development in
pharmaceutical chemistry, quality control in food chemistry, and biologically relevant
proteome analysis as well as metabolome analysis, etc.
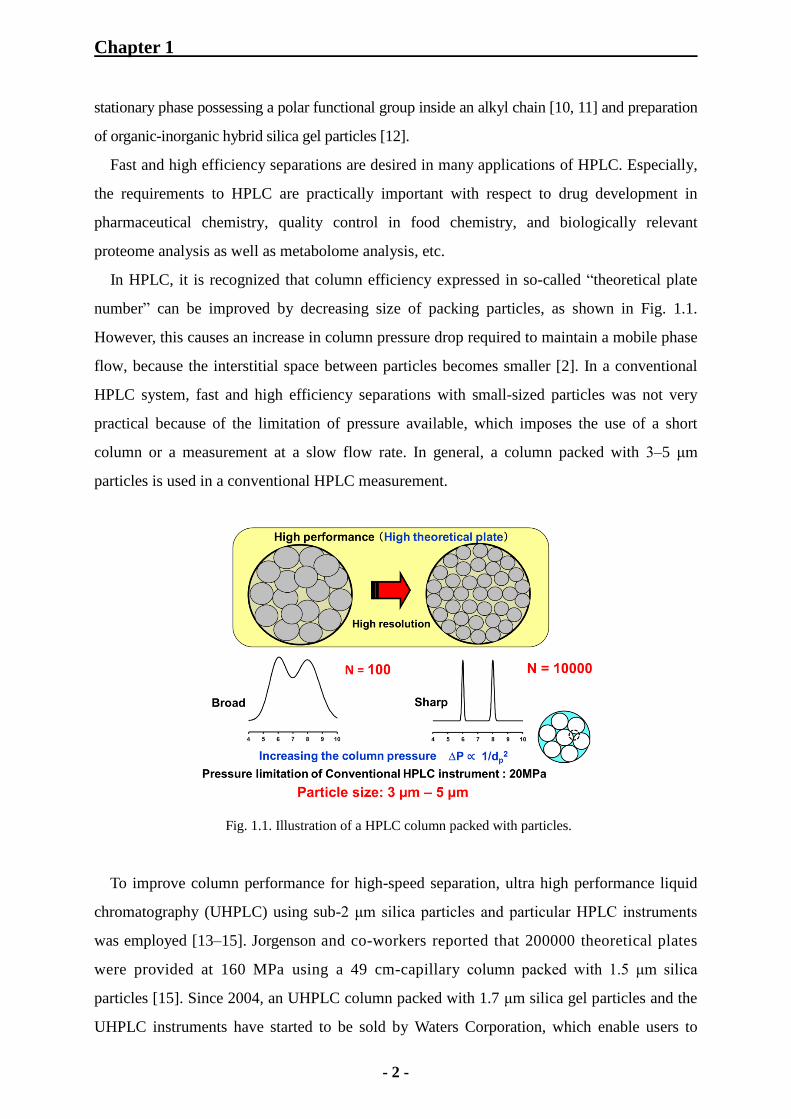
In HPLC, it is recognized that column efficiency expressed in so-called “theoretical plate
number” can be improved by decreasing size of packing particles, as shown in Fig. 1.1.
However, this causes an increase in column pressure drop required to maintain a mobile phase
flow, because the interstitial space between particles becomes smaller [2]. In a conventional
HPLC system, fast and high efficiency separations with small-sized particles was not very
practical because of the limitation of pressure available, which imposes the use of a short
column or a measurement at a slow flow rate. In general, a column packed with 3‒5 μm
particles is used in a conventional HPLC measurement.
Fig. 1.1. Illustration of a HPLC column packed with particles.
To improve column performance for high-speed separation, ultra high performance liquid
chromatography (UHPLC) using sub-2 μm silica particles and particular HPLC instruments
was employed [13–15]. Jorgenson and co-workers reported that 200000 theoretical plates
were provided at 160 MPa using a 49 cm-capillary column packed with 1.5 μm silica
particles [15]. Since 2004, an UHPLC column packed with 1.7 μm silica gel particles and the
UHPLC instruments have started to be sold by Waters Corporation, which enable users to

Chapter 1
- 3 -
carry out the measurements up to 100 MPa [16]. Columns packed with sub-2 μm particles
have received considerable attention.
Furthermore, fused-core silica particles (superficially porous silica particles) possessing a
solid core and a porous shell have been reported by Kirkland and co-workers [17‒20]. Fig. 1.2
shows the structure of a 2.7 μm fused-core silica particle [21]. The characteristic structure
with short diffusion path can reduce contribution of the slow mass transfer of a solute inside
the particles while maintaining the inherent permeability from an overall particle size of sub-3
μm. Thus, a column packed with the fused-core particles can result in the breakthrough to
realize fast and high efficiency separations in a conventional HPLC system [20‒22]. It has
been proved that the column can provide higher performance than a column packed with fully
porous particles of similar size [20‒23].
Fig.1.2. Structures of a fused-core silica particle (left) and a totally full porous particle (right) [21].
On the other hand, monolithic silica columns have been studied as another candidate for
high-speed and high-efficiency separations. It has been demonstrated that the columns
provide larger permeability and higher column efficiency simultaneously compared to a
particulate column [24–27]. The advantage of a monolithic silica material is that the size of
through-pore and that of silica skeleton can be controlled independently by changing
preparation conditions [25, 26]. It is possible to produce the continuous structure possessing a
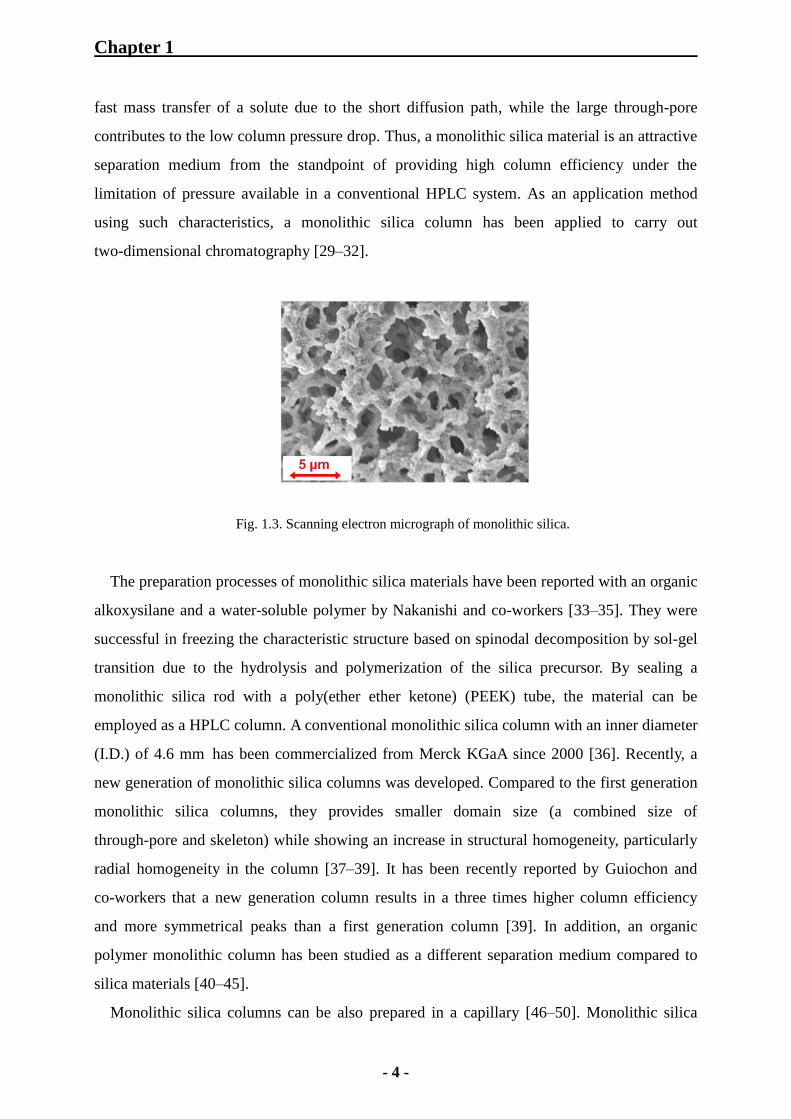
thin skeleton combined with a large through-pore, as shown in Fig. 1.3. The comparison of a
monolithic silica column to a particulate column illustrates that the small skeleton size
corresponds to the small particle size, and the large through-pore to the large interstitial space
between the particles [28]. The thin skeleton provides high column efficiency because of the
Chapter 1
- 4 -
fast mass transfer of a solute due to the short diffusion path, while the large through-pore
contributes to the low column pressure drop. Thus, a monolithic silica material is an attractive
separation medium from the standpoint of providing high column efficiency under the
limitation of pressure available in a conventional HPLC system. As an application method
using such characteristics, a monolithic silica column has been applied to carry out
two-dimensional chromatography [29‒32].
Fig. 1.3. Scanning electron micrograph of monolithic silica.
The preparation processes of monolithic silica materials have been reported with an organic
alkoxysilane and a water-soluble polymer by Nakanishi and co-workers [33‒35]. They were
successful in freezing the characteristic structure based on spinodal decomposition by sol-gel
transition due to the hydrolysis and polymerization of the silica precursor. By sealing a
monolithic silica rod with a poly(ether ether ketone) (PEEK) tube, the material can be
employed as a HPLC column. A conventional monolithic silica column with an inner diameter
(I.D.) of 4.6 mm has been commercialized from Merck KGaA since 2000 [36]. Recently, a
new generation of monolithic silica columns was developed. Compared to the first generation
monolithic silica columns, they provides smaller domain size (a combined size of
through-pore and skeleton) while showing an increase in structural homogeneity, particularly
radial homogeneity in the column [37‒39]. It has been recently reported by Guiochon and
co-workers that a new generation column results in a three times higher column efficiency
and more symmetrical peaks than a first generation column [39]. In addition, an organic
polymer monolithic column has been studied as a different separation medium compared to
silica materials [40‒45].
Monolithic silica columns can be also prepared in a capillary [46‒50]. Monolithic silica

Chapter 1
- 5 -
capillary columns, even longer ones, are accessible by a facile procedure compared to a
particulate column requiring frits to keep particles and high pressure to pack small particles in
a long capillary. Moreover, the preparation of a capillary column is successful without
cladding by a PEEK tube to seal the monolithic silica structure inside a conventional column.
As shown in Fig. 1.4, the size of a monolithic silica capillary column is much smaller than
that of a conventional column. The use of a capillary column is expected to decrease the
consumption in terms of mobile phase and sample amount in a HPLC measurement.
Fig. 1.4. Comparison of column size between conventional and capillary columns.
For a monolithic silica capillary it is crucial to control the shrinkage of the silica gel so that
the structure can remain connected to the inner wall of the capillary. Some results have been
reported to control the shrinkage by using methyltrimethoxysilane (MTMS) [50–53]. It is
feasible to prepare a monolithic silica column with a maximum I.D. of 530 μm [54].
Owing to the high column permeability, long monolithic silica capillaries can be employed
in HPLC, resulting in high theoretical plate numbers [55‒59]. In a simple HPLC system, a
long monolithic silica capillary is useful to carry out high resolution analysis of a target
sample including numerous compounds as a protein. As an application in proteome analysis
by a μ-LC/MS/MS system, Ishihama and co-workers recently reported that the identification of
more than 26000 peptides from Escherichia coli cells were carried out using an ODS-modified
long capillary column with 3.5 m, providing more than 400000 theoretical plates for small

Chapter 1
- 6 -
molecules at less than 20MPa [58]. This demonstrates the aforementioned advantages of
monolithic silica capillary columns: high separation efficiency combined with lower column
pressure drop is attainable compared to a particulate column. Regarding fast and high
efficiency separations, it was reported that a monolithic silica capillary column can provide
high column efficiency which is comparable with that of a column packed with 2–2.5 μm
particles, while the column pressure drop is similar to that of a column packed with 5 μm
particles [60].
The approaches to a high efficiency column in HPLC are mainly related to reducing the
resistance against mass transfer of a solute based on a small skeleton size or particle size, or
even a thin porous shell. The interpretation of column efficiency on the basis of the Van
Deemter equation (see Section 2.3) shows that the challenges are how to control the A-term
(eddy diffusion) and the C-term (mass transfer in mobile phase and in stationary phase), that
are directly related to the through-pore size and the skeleton size (particle size) as well as the
structural homogeneity [61‒64].
The present studies are dedicated to the preparation and characterization of monolithic
silica materials to improve the column performance of monolithic silica capillaries in HPLC.
The motivations of this thesis are shown in Section 1.2.

Chapter 1
- 7 -
1.2 Motivation
1.2.1 Motivation for Characterization of Monolithic Silica Rods
For a monolithic silica capillary column, it is still not applicable to determine directly
chemical and physical properties of the monolithic silica by some instruments, because a
microgram (~μg) of silica in the capillary is inadequate for the measurements. In general, a
monolithic silica rod can be prepared in a plastic or glass tube. In this thesis, the examination
of the monolithic silica rod, produced under similar preparation conditions for a monolithic
silica capillary column, is proposed to reflect the properties of the monolithic silica in the
capillary. Therefore, the characterization of monolithic silica rods was carried out according to
following purposes:
(1) Scanning electron microscopy (SEM)
Scanning electron microscopy (SEM) was applied to characterizing the macropore
structures in monolithic silica rods.
(2) Mercury intrusion porosimetry
The macroporosity of monolithic silica rods was investigated quantitatively by mercury
intrusion porosimetry.
(3) Nitrogen physisorption method
The mesoporosity of monolithic silica rods was evaluated by nitrogen physisorption
method.
(4) Infrared (IR) adsorption spectroscopy
IR adsorption measurements were performed to identify the absorption bands due to the
vibrations of methyl groups in hybrid monolithic silica rods, prepared with tetramethoxysilane
(TMOS) and MTMS.
(5) Thermal analysis
Thermogravimetry (TG) and differential scanning calorimetry (DSC) was used for
determining thermal stability of methyl groups in a hybrid monolithic silica rod. In other words,
it was confirmed whether the heat treatment at 330 °C for the hybrid silica material was proper

Chapter 1
- 8 -
in the preparation process.
(6) Elemental analysis
Elemental analysis was applied to measure the carbon content (%C) of bare (non-modified)
monolithic silica rods. Additionally, the measurements of ODS-modified monolithic silica
rods were carried out for the assessment of the carbon content (%C) of the ODS groups,
introduced on the silica surfaces by octadecylsilylation.
Chapter 1
- 9 -
1.2.2 Motivation for Investigation of Hybrid Monolithic Silica Capillary Columns
Prepared by Changing MTMS Concentration
The comparison of columns packed with small particles, fused-core particles, and
monolithic columns have been reported previously [37‒39, 65‒75]. Desmet and co-workers
examined the column efficiency between particulate columns and monolithic silica columns,
using kinetic plots [70, 71]. They demonstrated that the column efficiency of a monolithic
silica capillary column was inferior to that of a particulate column packed with sub-3 μm
particles in a region below 80000 theoretical plates at 40 MPa pressure limit, or at relatively
high linear velocity. This is because it had not been feasible to prepare a monolithic silica
column with a small domain size that could provide high column efficiency per unit time,
which is comparable with the efficiency of a column packed with small particles. Such a
monolithic column must possess high structural homogeneity.
Other problems of a monolithic silica capillary column are the smaller retention factors and
the lower sample loading capacity than those provided by a particulate column. Compared to a
particulate column, a monolithic silica column shows smaller retention factors that contribute to
the poorer resolution. The latter problem was observed obviously in terms of a large-volume
injection or the injection of a strong solvent [76]. These problems are related to the high
porosity of a monolithic silica capillary column (about 95 %) [60], which leads to small phase
ratios resulting in small retention factors and a low sample loading capacity [48, 55]. In other
words, the column porosity should be reduced to provide large retention factors and a high
sample loading capacity.
To improve the efficiency at high speed and the sample loading capacity, monolithic silica
columns was prepared with increased silane concentrations in the feed solution by 40‒60 % in
comparison with the concentration of the monolithic silica column produced from TMOS in
the preceding study [60]. The columns provided larger retention factors accordingly and
greater numbers of theoretical plates than previous columns. The performance was similar to
that of a column packed with 2‒2.5 μm particles. These results agreed with the suggestion
given by Desmet and co-workers, recommending the reduction in column porosity to result in
higher column efficiencies at high speed [68, 70]. However, the retention factors provided by
a monolithic silica capillary column prepared from TMOS were still much smaller than those
obtainable with a particulate column in RPLC.
In general, hybrid monolithic silica columns prepared from a mixture of TMOS and MTMS
can possess higher phase ratios, leading to greater retention factors than those prepared from

Chapter 1
- 10 -
TMOS in RPLC after octadecylsilylation [50], although lower column efficiency was
observed with the hybrid silica columns, so far similar to a column packed with 3.5‒4 μm
particles [70]. In this thesis, hybrid monolithic silica columns were prepared by changing the
MTMS/TMOS ratio and the total silane concentrations in the feed solution, in order to
investigate whether it is possible to achieve as high column efficiency per unit time as shown
by the previous TMOS monolithic silica columns having increased phase ratios while
maintaining the larger retention factors of the hybrid monolithic silica columns. Then, the
characterization of the monolithic silica capillary columns with an I.D. of 100 μm was
performed by size exclusion chromatography (SEC) using polystyrene standard (PSS)
samples in tetrahydrofuran (THF) and the chromatographic performance was examined in
RPLC.
Chapter 1
- 11 -
1.2.3 Motivation for Study on Effect of Mesoporosity on Column Performance
The elucidation of the relationship between porosity and HPLC performance is of vital
importance for the development or improvement of monolithic silica columns. However,
especially for capillaries, the precise characterization of the porosity (pore volume, surface area,
size distribution of meso- and macropores) is still a challenge because of the very low amount
of material available in one particular capillary.
One of the main objectives of the present study is to correlate HPLC properties to
variations in porosity of monolithic silica capillaries, applying suitable methods to the
characterization of meso- and macroporosity. A conventional technique to analyse the
porosity of monolithic silica materials is mercury intrusion porosimetry [25, 26, 33, 77‒79],
but recently transmission electron microscopy (TEM) and confocal laser scanning microscopy
(CLSM) have been introduced as valuable characterization methods for the macroporosity of
the capillary column [80–84]. For the characterization of mesoporosity, physisorption method
is often employed, mainly using nitrogen at 77 K.
Several studies have already addressed the influence of porosity parameters on HPLC
properties. Regarding the characterization of monolithic silica rods by nitrogen physisorption
method, it was reported that the mesopore sizes or pore size distribution (PSD) can be
controlled by treatment with ammonia solution after the phase separation [85, 86]. In that case,
the formation of mesopores in the monolithic silica strongly depends on pH value, time, and
temperature for the immersion in ammonia solution, which is governed by Ostwald ripening
[85–89]. To examine column efficiency of conventional monolithic silica columns with
different pore sizes, Guiochon and co-workers have reported the effect on mass transfer of
solute in mesopores in HPLC [64]. For the protein separation with a monolithic silica column,
the influence of mesopore size on separation efficiency was already described [90]. The
aforementioned studies are essential to understand the effect of hindrance of solute diffusion
inside pores, associated with the relationship between molecular size of solute and porosity in
separation medium.
As a particularly suitable approach for characterization of column porosity in HPLC,
inverse size exclusion chromatography (ISEC) can be used [91–95]. ISEC allows for the
determination of PSD of a porous material using precisely defined PSS samples with known
molecular weight, dissolved in THF. This method is based on the relationship between the
rotational coil diameter of polystyrene in a solvent and the corresponding pores in silica [91].
For conventional monolithic silica columns, the pore characterization has already been
Chapter 1
- 12 -
performed by ISEC [77, 96]. It was demonstrated by Thommes and co-workers that there is a
reasonable correlation for monolithic silica rods between the PSD mathematically estimated
by ISEC and the PSD obtained by nitrogen physisorption method [97]. Thus, ISEC can be
assumed as a practicable method to examine the mesoporosity of a capillary column, because
it is accessible to characterize the mesoporosity directly from HPLC measurements. In this
thesis, ISEC was applied to the characterization of monolithic silica capillaries in terms of
following aspects.
First, the validity of the PSD determined by ISEC was assessed in comparison with the
results obtained by nitrogen physisorption method using monolithic silica rods, prepared by
the similar procedures as the monolithic silica capillaries under study.
Second, ISEC was employed to investigate the influence of hydrothermal treatment on the
mesoporosity of the monolithic silica capillaries. Hydrothermal treatment involves the generation
of mesopores and is one of the few methods allowing a fine tuning of the mesoporosity of
monolithic silica. As an example, Demesmay and co-workers performed the characterization for
TMOS monolithic silica capillary columns using ISEC and RPLC, to simplify the preparation
process [98]. However, in their work, only small molecules, e.g. alkylbenzenes and polynuclear
aromatic hydrocarbons (PAHs), were utilized to evaluate the column performance in HPLC. A
comprehensive understanding of the effect of hydrothermal treatment on column efficiency
requires the employment of solutes with different molecular sizes, as mentioned above [64].
As third objective the differences in the impact of hydrothermal treatment between TMOS
monolithic silica columns and hybrid monolithic silica columns were examined. In Section 6.2,
the hybrid monolithic silica columns provide an interesting approach to study HPLC
performance by demonstrating the influence of MTMS concentration on column efficiency.
Monolithic silica capillaries with an I.D. of 100 μm and monolithic silica rods were
prepared with TMOS and a mixture of MTMS and TMOS. The hydrothermal treatment with
urea was carried out at 80 °C and 120 °C to form mesopores. For the examination of
mesoporosity, ISEC was applied to the characterization of the bare monolithic silica capillary
columns with PSS samples in THF, and nitrogen physisorption method to that of the silica
rods, to compare the results between them. To determine the effect of hydrothermal treatment
on the column efficiency correlating with mass transfer of solute inside pores, the evaluation
of monolithic capillary columns modified by octadecylsilylation was performed with
alkylbenzenes, leucine-enkephalin, angiotensin II, and insulin in RPLC.

Chapter 2
- 13 -
2 Fundamental Theory of Liquid Chromatography
2.1 Plate Theory
It is stated in the definition of chromatography that “the solutes will elute in order of their
increasing distribution coefficients with respect to the stationary phase.” [99]. Fig. 2.1
illustrates that this is related to the difference in compatibility of solutes with the stationary
phase in a column. It follows that the relative retention of two compounds (difference in
elution time) in a chromatographic system will determine how well they are separated.
Difference in compatibility between solute A and B with stationary phase
Difference in distribution coefficient
Difference in mobility
Fig. 2.1. Separation of compounds in liquid chromatography.
Plate theory is essential to interpret chromatographic retention of solute and column
efficiency for separation. The theory assumes that the solute is always in equilibrium with
mobile and stationary phase during its passage through the column. However, the
continuous equilibrium between the phases never actually occurs in chromatographic systems.
To accommodate this non-equilibrium condition, the concept established in distillation theory
is adopted. The column is supposed to be divided into a number of cells or plates, as shown in
Fig. 2.2. Each cell possesses a specific length and the solute will spend a finite time in each
cell accordingly. The cell is chosen to possess such size as to provide the solute with adequate

Chapter 2
- 14 -
residence time to establish equilibrium with the two phases. Consequently, as the cell is found
to be smaller, the equilibrium will be achieved faster and the total plate number in the column
will be increased. This indicates that the number of theoretical plates given by a column will
be directly related to equilibrium rate. For this reason, theoretical plate number (N) has been
termed column efficiency [99]. It is established that the peak width (peak spreading) is
inversely proportional to the square root of the column efficiency [2]. With an increase in the
efficiency, the peak becomes narrower in a chromatogram.
Fig. 2.2. Consecutive theoretical plates in a column [99].
In plate theory, as the zone of solute is passed through the first several plates, a highly
discontinuous concentration profile is obtained with solute distributed in plates following
the Poisson function [99]. However, in most chromatographic systems, the concentration
profile is reasonably smooth and continuous if the plate number (n) >> 100 is achieved, and
peak elution profile can be considered as Gaussian function. Therefore, various simplified
expressions for a Gaussian profile are generally applicable in HPLC.
On the other hand, retention volume represents the volume of the eluent (mobile phase) which is
required so that a solute can pass through a column between the injection point and the detection
point. According to plate theory, retention volume (Vr) is determined by Eq. (2.1) [2, 99]:

Chapter 2
- 15 -
smr KVVV (Distribution coefficient:
m
s
C
CK ) (2.1)
where Vm denotes the total pore volume (the volume occupied by mobile phase) in a column, Vs
the total volume of stationary phase, and K the distribution coefficient (partition coefficient) of
solute between mobile phase and stationary phase. In addition, Cm is the concentration of solute
in mobile phase and Cs that concentration in stationary phase. Eq. (2.1) shows that the function
for retention volume is straightforward and depends solely on the partition coefficient and the
volume of two phases in a column. This shows that the retention volume is strongly influenced
by the nature of a compound. An eluted compound is identified by its corrected retention
volume, which is calculated from its corrected retention time in a chromatography system. It
indicates that the validity of an examination result depends on the measurement conditions,
particularly the constancy of flow rate of mobile phase. To eliminate the error due to a
variation of flow rate in each measurement, retention factor (k) is generally applied to the
identification of solute. Retention factor is represented by Eq. (2.2).
m
s
V
VKk (Phase ratio:
m
s
V
V) (2.2)
By using Eq. (2.1) and Eq. (2.2), Eq. (2.3) is obtained to express retention factor with Vr and Vm.
m
mr
V
VVk
(2.3)
However, in general, it is feasible to calculate a retention factor directly from the elution
time in a chromatogram provided by a data processer in HPLC software. The interpretation
for retention factor is shown in Section 2.2.

Chapter 2
- 16 -
2.2 Chromatographic Parameters in HPLC
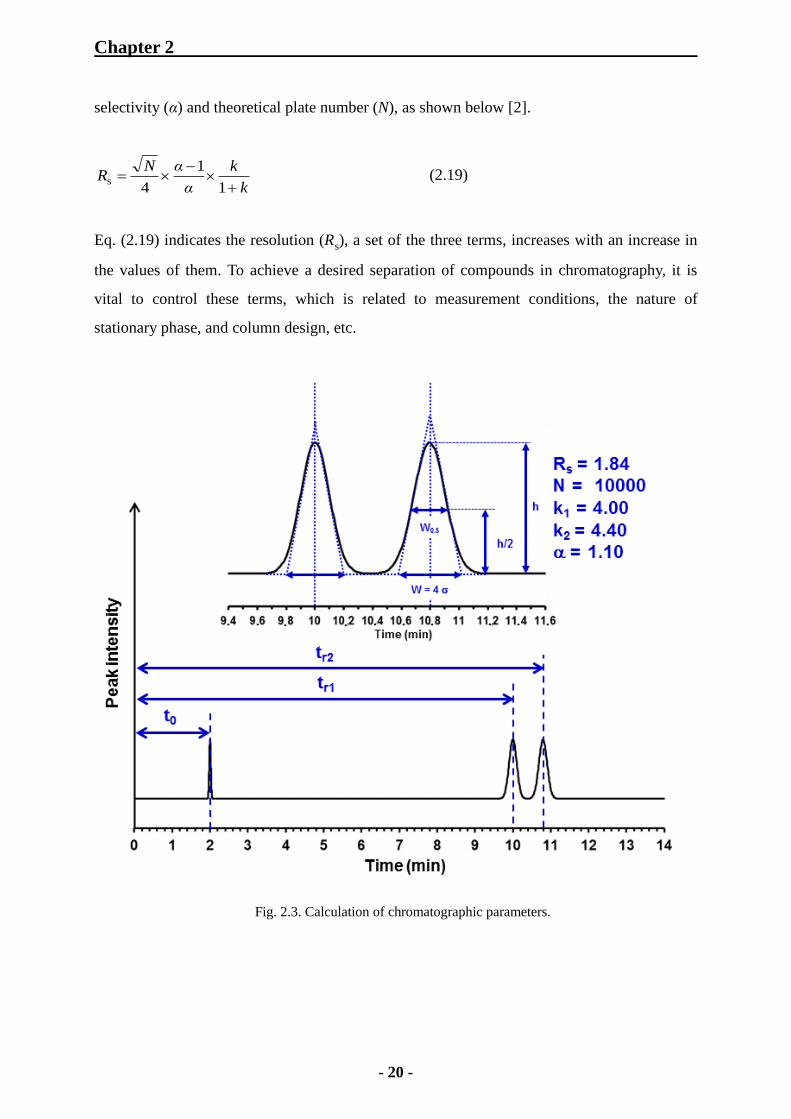
Fundamental chromatographic parameters obtained from a chromatogram are introduced in
this section. Fig. 2.3 shows the simplified illustration of a chromatogram.
(1) Linear velocity (u): HPLC users need to select a flow rate of mobile phase for setting up
a chromatographic method in the measurement. Linear velocity (u) is often adopted and it is
the result obtained from dividing column length by the elution time (t0) for a non-retentive
solute.
0t
Lu (2.4)
(L: Column length, t0: Elution time for non-retentive solute)
Moreover, the relationship between flow rate (F) and linear velocity (u) is represented as
below.
2t rπε
Fu
(2.5)
(F: Flow rate of mobile phase, εt: Total porosity in column, r: Radius diameter of column)
(2) Retention factor (k): In general, an eluted compound can be identified by the retention
factor (k), as explained in Section 2.1. The retention factor (k) for a compound is expressed by
Eq. (2.6).
m
s
0
0r
t
t
t
ttk
(2.6)
(tr: Elution time for retentive solute)
Eq. (2.6) indicates that the non-retentive solute spends all its time in the mobile phase,
whereas the retentive solute spends all its time in both the mobile phase and the stationary

Chapter 2
- 17 -
phase. Provided that there is no size exclusion effect from all or part of the pores, any solutes
migrating through the column will spend the same amount of time in mobile phase as the
non-retentive solute. The difference in elution time (tr ‒ t0) between the non-retentive solute and
the retentive solute shows the time (ts) that the retentive solute remains in the stationary phase.
Consequently, the retention factor (k) is expressed as the ratio of the sojourn time (ts) for a
solute in the stationary phase to its sojourn time (tm) in the mobile phase. This interpretation
represents the existence probability of a solute between the two phases, which is associated with
the distribution coefficient (partition coefficient) (K) in Eq. (2.2) (see Section 2.1). Therefore, it
is recognized that the retention factor (k) of a solute reflects the chemical and thermodynamic
properties in chromatography.
On the other hand, a retention volume (Vi) can be calculated by using flow rate of mobile
phase (F) and elution time (ti), as described below.
ii FtV (2.7)
Vm and Vr can be represented by Eq. (2.8) and (2.9), respectively. Thus, Eq. (2.3) can be
obtained by substituting them into Eq. (2.7) (see Section 2.1).
0m FtV (2.8)
rr FtV (2.9)
(3) Relative retention (α): Relative retention (α) (Selectivity) is assessed as the ratio of
retention factors for two solutes. In general, the retention factor (k) for a later-eluting solute is
in the numerator to provide the value with larger than 1. The relative retention (α) correlates
with a chemical or thermodynamic entity for separation
1
2
k
kα (k 2 > k 1) (2.10)
(k 1: Retention factor for solute 1, k 2: Retention factor for solute 2)

Chapter 2
- 18 -
(4) Plate Height (H): In general, a chromatographic band is regard as statistical distribution.
When a chromatographic peak is symmetric, the distribution can be considered as Gaussian
distribution. Plate height (H) is defined by using second moment (σ L2: variance) and column
length (L). It is equivalent to the column length that can provide one theoretical plate number
(N). As described in Section 2.1, this shows that plate height (H) corresponds to each cell size
in a column in plate theory. Therefore, it means that higher column efficiency is achieved with
smaller value of plate height. In this thesis, this parameter is used for comparing normalized
column efficiency.
N
L
L
σH
2L
(2.11)
(σL: Standard deviation (length unit) in Gaussian distribution, N: Theoretical plate number)
(5) Theoretical plate number (N): As explained in Section 2.1, theoretical plate number (N)
is an essential parameter to represent column efficiency as well as plate height (H). According
to the definition of plate height (H), theoretical plate number is given by Eq. (2.12).
2
L
σ
LN (2.12)
Eq. (2.12) can be converted into Eq. (2.13) by using retention time and variance (σt2: time
unit) of peak.
2
t
r
σ
tN (2.13)
For a typical chromatographic peak (Gaussian distribution curve), the theoretical plate
number (N) can be calculated from the peak width (W) on the baseline, as shown in Fig. 2.3.
In the tangent method, tangents are drawn to the inflection points and the peak width is
determined from intersection points of the tangents with the baseline. The peak width at
baseline is equivalent to four standard deviations (4σt) of Gaussian distribution curve, as

Chapter 2
- 19 -
represented by Eq. (2.14).
t4σW (2.14)
Eq. (2.15) is derived from the relationship between Eq. (2.13) and Eq. (2.14).
2
r16
W
tN (2.15)
In addition, the peak width at half peak height (W0.5) is expressed by Eq. (2.16).
28 2250 lnσW . (2.16)
(W0.5: Peak width at half peak height)
Consequently, the theoretical plate number can be calculated from the half peak height (W0.5).
2
50
r545
.W
t.N (2.17)
In general, Eq. (2.15) or Eq. (2.17) has been adopted to calculate theoretical plate number, for
instance, in pharmaceutical chemistry. In this thesis, Eq. (2.17) was applied to the calculation
of theoretical plate number of peaks in a chromatogram.
(6) Resolution (Rs): Resolution (Rs) for closely eluting solutes, 1 and 2, is defined by
dividing the elution time interval by the mean peak width.
21
1r2rs 2
WW
ttR (2.18)
This equation can be expressed by the aforementioned parameters, retention factor (k),
Chapter 2
- 20 -
selectivity (α) and theoretical plate number (N), as shown below [2].
k
k
α
αNR
1
1
4s (2.19)
Eq. (2.19) indicates the resolution (Rs), a set of the three terms, increases with an increase in
the values of them. To achieve a desired separation of compounds in chromatography, it is
vital to control these terms, which is related to measurement conditions, the nature of
stationary phase, and column design, etc.
Fig. 2.3. Calculation of chromatographic parameters.

Chapter 2
- 21 -
2.3 Rate Theory
Rate theory has been introduced to elucidate the mechanism of peak spreading (band
broadening) from the relationship between plate height (H) and mobile phase flow. In rate
theory, the mechanism is explained by three major factors with respect to flowing, diffusion,
and mass transfer. In general, the Van Deemter equation has been used for representing the
relationship between plate height (H) and linear velocity (u) (mobile phase flow), dividing the
effects on peak spreading into eddy diffusion (A-term), longitudinal diffusion (B-term), and
mass transfer in mobile phase and in stationary phase (C-term), as shown in Fig. 2.4 [2, 99].
Cuu
BAH
(2.20)
(A: Eddy diffusion, B: Longitudinal diffusion, C: Mass transfer in mobile phase and in
stationary phase, u: Linear velocity)
Fig. 2.4. Peak spreading model based on Van Deemter theory.
The A-term correlating with the structural homogeneity shows that different flow pathways of a
solute result in the band broadening. The B-term is attributed to the molecular diffusion in
longitudinal direction in a column by the spontaneous diffusional phenomenon. The C-term
strongly depends on particle size, because the contribution of slow diffusion (slow mass transfer) of
a solute inside pores becomes smaller with a decrease in diffusion path in particles. For example, the
C-term is approximately proportional to the square of a particle size [2]. Therefore, it is possible to
provide higher column efficiency by decreasing particle size, as described in Section 1.1.
Chapter 2
- 22 -
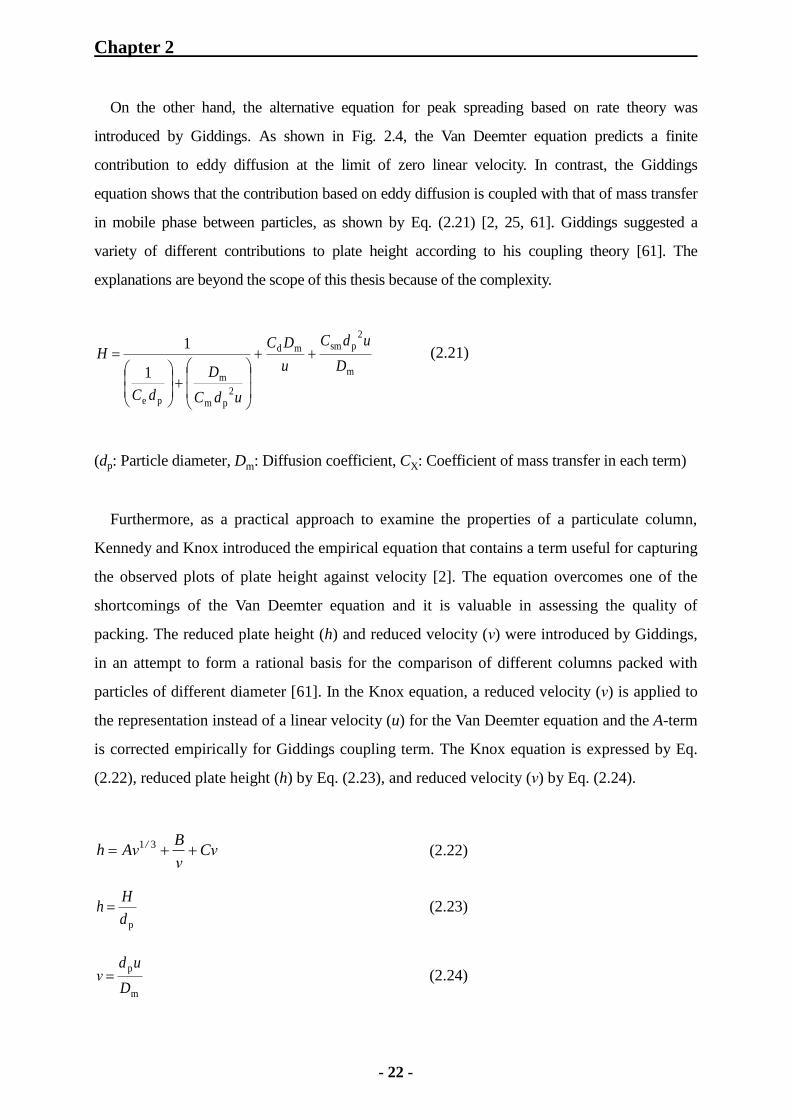
On the other hand, the alternative equation for peak spreading based on rate theory was
introduced by Giddings. As shown in Fig. 2.4, the Van Deemter equation predicts a finite
contribution to eddy diffusion at the limit of zero linear velocity. In contrast, the Giddings
equation shows that the contribution based on eddy diffusion is coupled with that of mass transfer
in mobile phase between particles, as shown by Eq. (2.21) [2, 25, 61]. Giddings suggested a
variety of different contributions to plate height according to his coupling theory [61]. The
explanations are beyond the scope of this thesis because of the complexity.
m
2psmmd
2pm
m
pe
1
1
D
udC
u
DC
udC
D
dC
H
(2.21)
(dp: Particle diameter, Dm: Diffusion coefficient, CX: Coefficient of mass transfer in each term)
Furthermore, as a practical approach to examine the properties of a particulate column,
Kennedy and Knox introduced the empirical equation that contains a term useful for capturing
the observed plots of plate height against velocity [2]. The equation overcomes one of the
shortcomings of the Van Deemter equation and it is valuable in assessing the quality of
packing. The reduced plate height (h) and reduced velocity (ν) were introduced by Giddings,
in an attempt to form a rational basis for the comparison of different columns packed with
particles of different diameter [61]. In the Knox equation, a reduced velocity (ν) is applied to
the representation instead of a linear velocity (u) for the Van Deemter equation and the A-term
is corrected empirically for Giddings coupling term. The Knox equation is expressed by Eq.
(2.22), reduced plate height (h) by Eq. (2.23), and reduced velocity (ν) by Eq. (2.24).
νCν
BνAh / 31
(2.22)
pd
Hh (2.23)
m
p
D
udν (2.24)

Chapter 3
- 23 -
3 Principle of Preparation of Monolithic Silica
3.1 Formation of Macropores in Monolithic Silica
Nakanishi and co-workers have reported that monolithic silica materials possessing bimodal
structure (meso- and macropores) can be prepared via sol-gel processing [24‒28, 33‒35]. The
monolithic silica is produced by freezing the structure during sol-gel transition when the
phase separation based on spinodal decomposition is induced simultaneously. The sol-gel
transition is caused by the hydrolysis and condensation, as shown in Fig. 3.1.
Fig. 3.1. Sol-gel processing.
To determine the morphology of monolithic silica, it is important to control the pH of the
reaction solution. For example, the gelation time for amorphous silica is longest around the
isoelectric point in the range of pH = 2–3, because the polycondensation rate is slowest. The
gelation time becomes shorter toward both directions of the pH axis [35, 88, 89, 100]. The
macropore formation of monolithic silica is represented as a competitive process between phase
separation and sol-gel transition. The dynamic behaviors regarding the formation of monolithic
silica structure are affected by the molecular weight and its distribution of silica oligomers,
compatibility between the solvent mixtures and the oligomers, and the gelation rate, etc. Therefore,
the resultant morphology of monolithic silica strongly depends on the compositions, catalyst
concentration in a preparation feed solution [33, 35]. The compatibility of a system containing at
least one kind of polymeric species can be estimated by Flory-Huggins formulation. According to
Flory-Huggins theory, the Gibbs free energy change (ΔG) of mixing for a binary system can be
expressed:
21122
2
21
1
1ΔΔΔ ΦΦχΦlnP
ΦΦln
P
ΦRTHSTG (3.1)
Entropic terms Enthalpic term
Chapter 3
- 24 -
where Φi and Pi (i = 1, 2) denote the volume fraction and the degree of polymerization of each
component, and χ12 the interaction parameter (Flory-Huggins parameter) between the components.
The former two terms in the bracket express the contributions to entropy, whereas the latter term
represents enthalpic contribution. It is recognized that the mixture becomes less compatible with
increasing degree of polymerization of either component since a decrease in absolute value of
negative entropic terms results in the destabilization of the system (see Eq. (3.1)). When the Gibbs
free energy change (ΔG) turns from negative to positive value in the system, a driving force of
phase separation arises. This demonstrates that an initially single-phase solution containing a
polymerizing component becomes less stable with the progress of the polymerization reaction,
resulting in the phase separation. A polymerization reaction which consumes polar parts, for
instance, the reaction between silanol groups, mediated in a polar solvent, influences the
substantial change of enthalpic term (ΔH) during the polymerization.
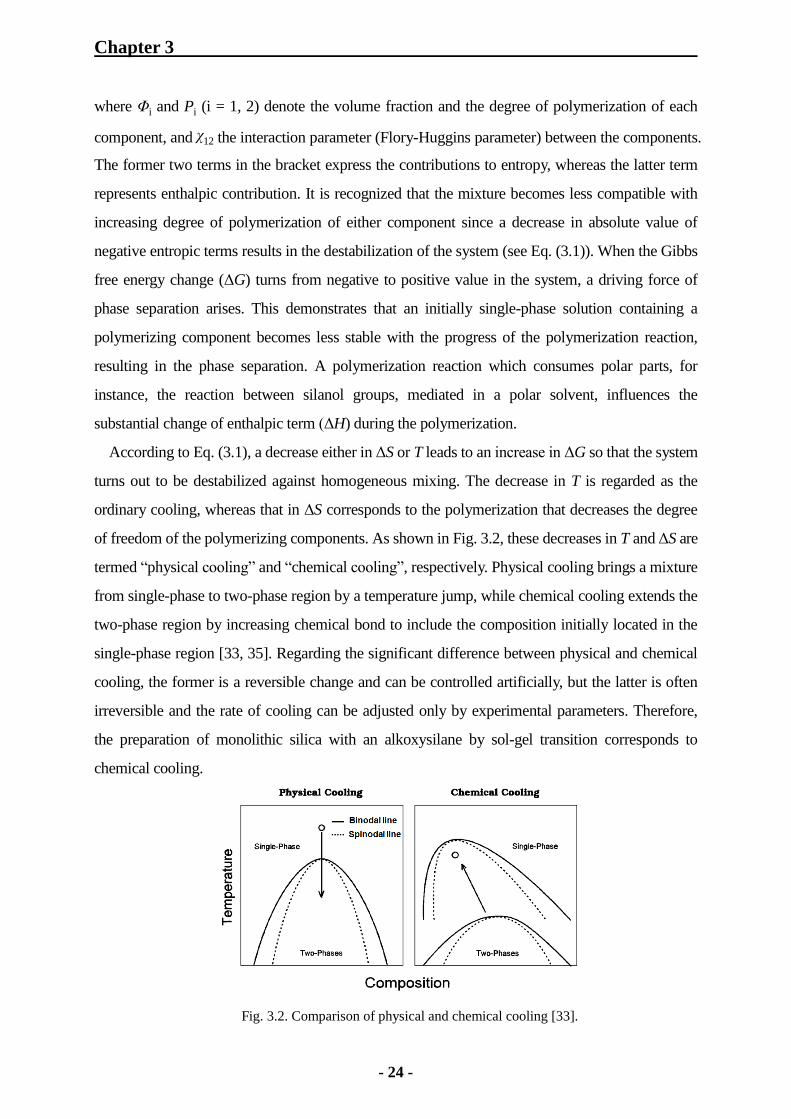
According to Eq. (3.1), a decrease either in ΔS or T leads to an increase in ΔG so that the system
turns out to be destabilized against homogeneous mixing. The decrease in T is regarded as the
ordinary cooling, whereas that in ΔS corresponds to the polymerization that decreases the degree
of freedom of the polymerizing components. As shown in Fig. 3.2, these decreases in T and ΔS are
termed “physical cooling” and “chemical cooling”, respectively. Physical cooling brings a mixture
from single-phase to two-phase region by a temperature jump, while chemical cooling extends the
two-phase region by increasing chemical bond to include the composition initially located in the
single-phase region [33, 35]. Regarding the significant difference between physical and chemical
cooling, the former is a reversible change and can be controlled artificially, but the latter is often
irreversible and the rate of cooling can be adjusted only by experimental parameters. Therefore,
the preparation of monolithic silica with an alkoxysilane by sol-gel transition corresponds to
chemical cooling.
Fig. 3.2. Comparison of physical and chemical cooling [33].

Chapter 3
- 25 -
Phase separation in a binary system is experimentally observed as a formation of two
conjugate phase regions possessing different chemical compositions, which is so-called
“phase domains” [33, 35]. For the preparation of monolithic silica, the domain formation
induced by the spinodal decomposition includes competitive processes between the
coarsening and sol-gel transition. In the coarsening process, the characteristic size of
bicontinuous structure grows from a shorter to a longer length scale with passage of time. On
the other hand, the mobility within the network becomes restricted from a longer to a shorter
length scale during the polymerization reaction. Thus, the resulting morphology is determined
by the timing of structure freezing relative to onset and development process of the domain
formation during phase separation, as shown in Fig. 3.3.
Fig. 3.3. Illustration of coarsening of phase separated domains [101].
An alkoxysilane-based sol-gel process is often used under presence of a water-soluble
polymer, for example, polyethylene glycol (PEG), poly(acrylic acid), poly(acrylamide), and
poly(vinylpyrrolidone), to induce the phase separation [28, 33‒35]. In the preparation process
with PEG, the siloxane oligomers interacting with PEG by hydrogen bonding become
relatively hydrophobic with respect to polar solvent during the polymerization, resulting in the
phase separation based on spinodal decomposition. Fig. 3.4 shows the relationship between
the starting feed composition and the resultant gel morphology in PEG system. By changing a
concentration of solvent, alkoxysilane, PEG, it is possible to control macropore size
(through-pore size), skeleton size, macropore volume of monolithic silica. In this system, the
fluid phase occupied by a solvent turns into the macropore phases after drying. The
macropore volume is determined by changing the concentration of solvent in a preparation
feed solution (Macropore volume increases toward the upper direction in Fig. 3.4). On the
other hand, the macropore size or domain size is controlled by changing the ratio of PEG to
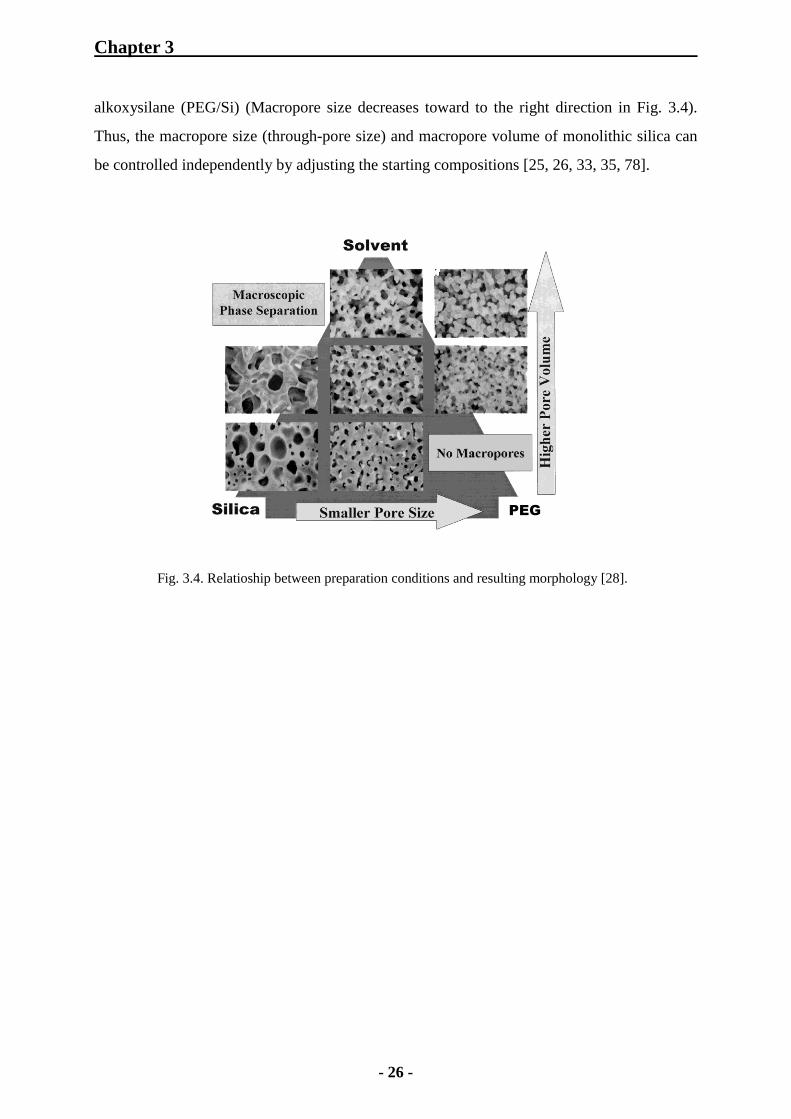
Chapter 3
- 26 -
alkoxysilane (PEG/Si) (Macropore size decreases toward to the right direction in Fig. 3.4).
Thus, the macropore size (through-pore size) and macropore volume of monolithic silica can
be controlled independently by adjusting the starting compositions [25, 26, 33, 35, 78].
Fig. 3.4. Relatioship between preparation conditions and resulting morphology [28].
PEGPEG

Chapter 3
- 27 -
3.2 Formation of Mesopores in Monolithic Silica
It is established that the formation of mesopores in a monolithic silica material can be
performed by treatments under a basic condition after the gelation. In this case, the formation
of mesopores is governed by classical Ostwald ripening [33, 35, 85‒89, 100].
Fig. 3.5. Mesopores in monolithic silica.
The mechanism controlled by Ostwald ripening correlates with the solubility of solid as a
function of the surface roughness. In this process, material dissolves from the surface of large
particles and deposits on the initially narrow “necks” which join particles to each other, as
shown in Fig. 3.6.
Fig. 3.6. Radius of curvature of particles and “necks” [100].
The surface of an individual particle has a positive radius of curvature (r+), while that of the
narrow neck between particles is regarded as a negative radius of curvature (r-). If it is
assumed that solid spherical particles possess a very small radius (r) as nucleus, the solubility of
a particle S(r) is represented by Ostwald‒Freundlich equation [35, 87‒89, 100]:
RTr
Vγ expS S(r) mSL
0
2 (3.2)

Chapter 3
- 28 -
where S0 denotes the solubility of a flat plate, SL the solid-liquid interfacial energy, Vm the
molar volume of the solid, R the ideal gas constant, and T the temperature. Eq. (3.2) shows
that the solubility is higher on the sharp points with smaller positive curvature, whereas the
reprecipitation is more pronounced at the cavities with smaller negative curvature [35, 99].
This is related to the strength of the solid while contributing to change of mesoporosity. For
a silica material, the particle size depends on the pH of the solution as well as the
temperature and pressure. As a consequence, with a passage of aging under a basic
condition, the roughness becomes smooth and the whole surface is reorganized into that
with only larger points and cavities. In this process, smaller pores are removed and the
whole pore system is reorganized into that with larger pores [35]. For the preparation of a
monolithic silica rod, an ammonia solution is often applied in the hydrothermal treatments
in the basic conditions [24‒28, 33‒35, 85, 86].
To form the mesopores in a monolithic silica capillary column, urea is utilized for the
hydrothermal treatment instead of an ammonia solution [47‒50, 60]. In that case,
decomposition of urea in an aqueous solution by heating generates ammonia and carbon
dioxide (an aqueous solution of ammonium carbonate), which results in a basic condition, as
shown in Fig. 3.7.
Fig. 3.7. Decomposition of urea by heating.
Chapter 4
- 29 -
4 Preparation Process
4.1 Pretreatment of Fused-Silica Capillary
The pretreatments for a fused-silica capillary were performed as shown below:
(1) A 1 M aqueous sodium hydroxide solution was charged into a fused-silica capillary tube
with an I.D. of 100 μm (1.5‒2 m in length) by a syringe and then the filled condition was kept
at room temperature for 3 hours.
(2) Afterwards, the capillary tube was washed with pure water and then a 1 M hydrochloric
acid solution was charged into the capillary. Then, the filled condition was kept at room
temperature for 3 hours.
(3) As the following process, the capillary was washed with water and then with acetone.
After washing, air was flushed to remove the residual acetone by a syringe.
Chapter 4
- 30 -
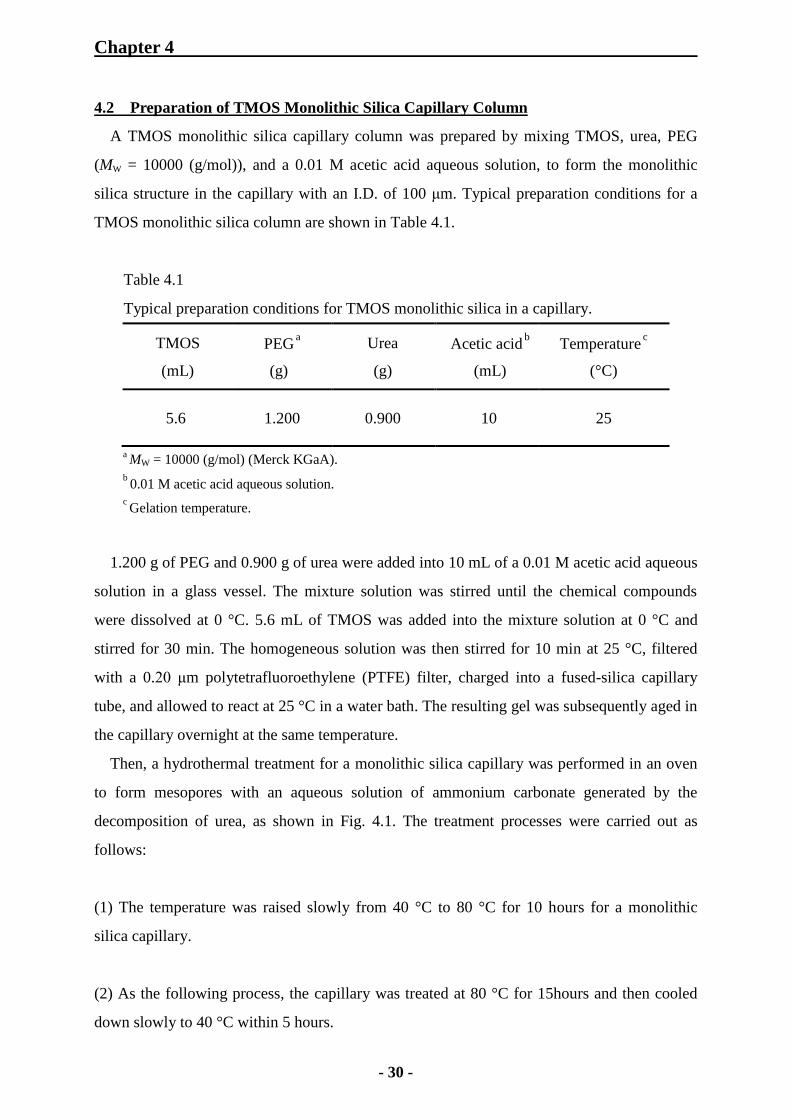
4.2 Preparation of TMOS Monolithic Silica Capillary Column
A TMOS monolithic silica capillary column was prepared by mixing TMOS, urea, PEG
(MW = 10000 (g/mol)), and a 0.01 M acetic acid aqueous solution, to form the monolithic
silica structure in the capillary with an I.D. of 100 μm. Typical preparation conditions for a
TMOS monolithic silica column are shown in Table 4.1.
Table 4.1
Typical preparation conditions for TMOS monolithic silica in a capillary.
a MW = 10000 (g/mol) (Merck KGaA).
b 0.01 M acetic acid aqueous solution.
c Gelation temperature.
1.200 g of PEG and 0.900 g of urea were added into 10 mL of a 0.01 M acetic acid aqueous
solution in a glass vessel. The mixture solution was stirred until the chemical compounds
were dissolved at 0 °C. 5.6 mL of TMOS was added into the mixture solution at 0 °C and
stirred for 30 min. The homogeneous solution was then stirred for 10 min at 25 °C, filtered
with a 0.20 μm polytetrafluoroethylene (PTFE) filter, charged into a fused-silica capillary
tube, and allowed to react at 25 °C in a water bath. The resulting gel was subsequently aged in
the capillary overnight at the same temperature.
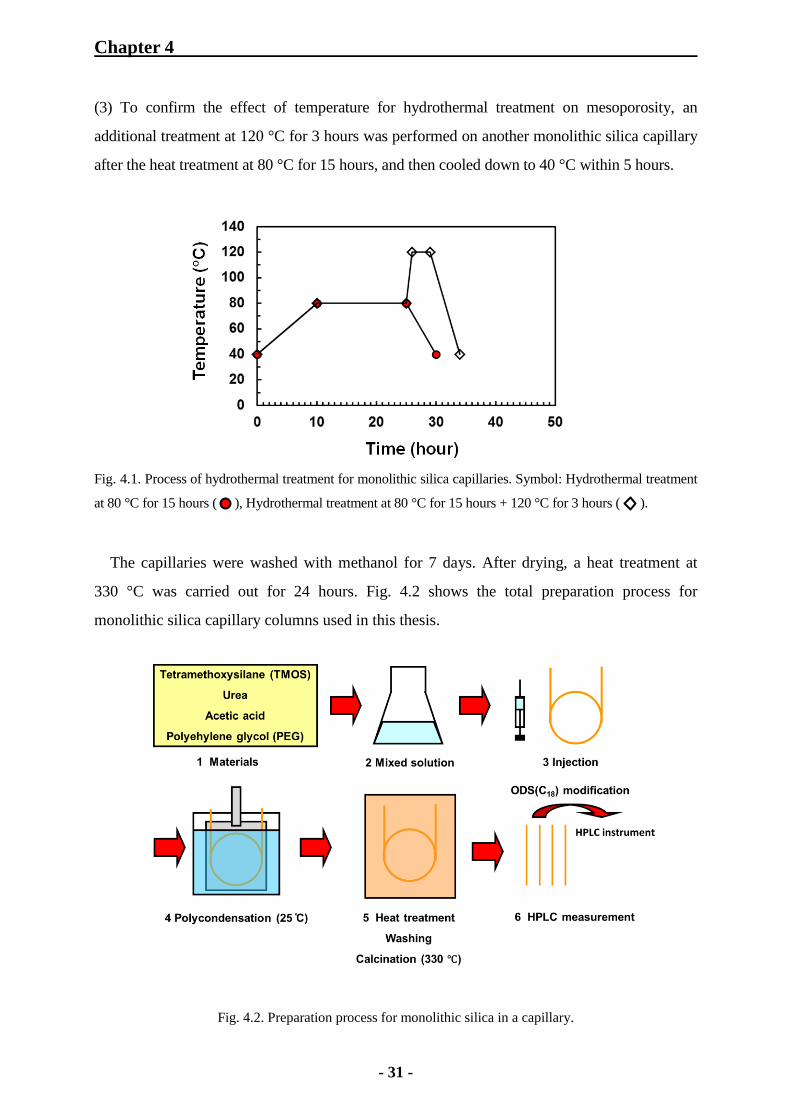
Then, a hydrothermal treatment for a monolithic silica capillary was performed in an oven
to form mesopores with an aqueous solution of ammonium carbonate generated by the
decomposition of urea, as shown in Fig. 4.1. The treatment processes were carried out as
follows:
(1) The temperature was raised slowly from 40 °C to 80 °C for 10 hours for a monolithic
silica capillary.
(2) As the following process, the capillary was treated at 80 °C for 15hours and then cooled
down slowly to 40 °C within 5 hours.
TMOS
(mL)
PEG a
(g)
Urea
(g)
Acetic acid b
(mL)
Temperature c
(°C)
5.6 1.200 0.900 10 25
Chapter 4
- 31 -
(3) To confirm the effect of temperature for hydrothermal treatment on mesoporosity, an
additional treatment at 120 °C for 3 hours was performed on another monolithic silica capillary
after the heat treatment at 80 °C for 15 hours, and then cooled down to 40 °C within 5 hours.
Fig. 4.1. Process of hydrothermal treatment for monolithic silica capillaries. Symbol: Hydrothermal treatment
at 80 °C for 15 hours ( ), Hydrothermal treatment at 80 °C for 15 hours + 120 °C for 3 hours (
).
The capillaries were washed with methanol for 7 days. After drying, a heat treatment at
330 °C was carried out for 24 hours. Fig. 4.2 shows the total preparation process for
monolithic silica capillary columns used in this thesis.
Fig. 4.2. Preparation process for monolithic silica in a capillary.
Chapter 4
- 32 -
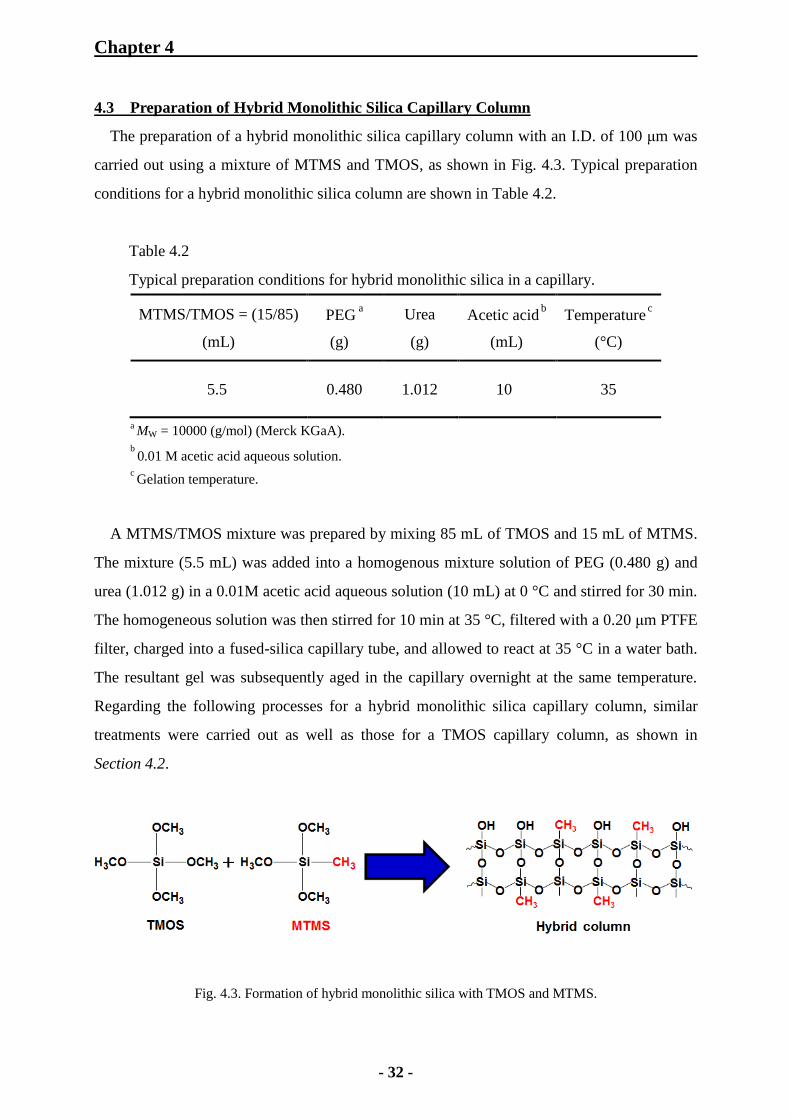
4.3 Preparation of Hybrid Monolithic Silica Capillary Column
The preparation of a hybrid monolithic silica capillary column with an I.D. of 100 μm was
carried out using a mixture of MTMS and TMOS, as shown in Fig. 4.3. Typical preparation
conditions for a hybrid monolithic silica column are shown in Table 4.2.
Table 4.2
Typical preparation conditions for hybrid monolithic silica in a capillary.
MTMS/TMOS = (15/85)
(mL)
PEG a
(g)
Urea
(g)
Acetic acid b
(mL)
Temperature c
(°C)
5.5 0.480 1.012 10 35
a MW = 10000 (g/mol) (Merck KGaA).
b 0.01 M acetic acid aqueous solution.
c Gelation temperature.
A MTMS/TMOS mixture was prepared by mixing 85 mL of TMOS and 15 mL of MTMS.
The mixture (5.5 mL) was added into a homogenous mixture solution of PEG (0.480 g) and
urea (1.012 g) in a 0.01M acetic acid aqueous solution (10 mL) at 0 °C and stirred for 30 min.
The homogeneous solution was then stirred for 10 min at 35 °C, filtered with a 0.20 μm PTFE
filter, charged into a fused-silica capillary tube, and allowed to react at 35 °C in a water bath.
The resultant gel was subsequently aged in the capillary overnight at the same temperature.
Regarding the following processes for a hybrid monolithic silica capillary column, similar
treatments were carried out as well as those for a TMOS capillary column, as shown in
Section 4.2.
Fig. 4.3. Formation of hybrid monolithic silica with TMOS and MTMS.

Chapter 4
- 33 -
4.4 Preparation of Monolithic Silica Rod
Monolithic silica rods were produced under the similar preparation conditions for
monolithic silica capillary columns (see Section 4.2). 7 mL of a preparation feed solution was
stored in a polypropylene plastic tube and then the gelation occurred in a water bath for one
day. The hydrothermal treatment for a silica rod at 80 °C for 15 hours was carried out directly
in a polypropylene plastic tube. For the additional hydrothermal treatment at 120 °C, a TMOS
silica rod was stored in the solution of urea (0.09 g/mL) prepared with a 0.01 M acetic acid
aqueous solution in a glass container which can withstand the increased pressure at 120 °C,
and a hybrid silica rod in another solution of urea (0.10 g/mL). In this case, such solutions
kept in glass containers were put in an oven, to decompose the urea simultaneously during the
hydrothermal treatment process at 80 °C for a silica rod in the plastic tube. Then, the
treatment at 120 °C for a silica rod was carried out in 50 mL of that solution for 3 or 4 hours.
Afterwards, the silica rods were washed with methanol in a glass vessel for 10 days, and heat
treatment was carried out at 330 °C for 24 hours in an oven. Fig. 4.4 shows a piece of
monolithic silica rod as an example.
Fig. 4.4. Photograph of monolithic silica rod.

Chapter 4
- 34 -
4.5 Silylation of Monolithic Silica
4.5.1 Octadecylsilylation of Monolithic Silica Capillary Column
The octadecylsilylation of a monolithic silica capillary column was carried out as follows:
(1) A bare monolithic silica capillary column with an I.D. of 100 μm was washed with THF at
a flow rate of 0.2 μL/min by a syringe pump for 3 hours, and then with toluene at the same
flow rate for 3 hours.
(2) A 20 % octadecyldimethyl-N,N-diethylaminosilane (ODS-DEA) solution in toluene
(VODS-DEA/VToluene = 20/80: volume ratio) was prepared and then charged into the monolithic
silica capillary column with an I.D. of 100 μm at a flow rate of 0.1 μL/min by a syringe pump.
The octadecylsilylation was carried out at 65 °C in an oven for longer than 24 hours, as shown
in Fig. 4.5.
(3) After the modification with the ODS-DEA solution, the capillary column was washed with
toluene at a flow rate of 0.2 μL/min by a syringe pump for 3 hours, and then with THF at the
same flow rate for 3 hours.
Fig. 4.5. Octadecylsilylation of monolithic silica.

Chapter 4
- 35 -
4.5.2 Endcapping of Monolithic Silica Capillary Column
The endcapping (trimethylsilylation) of an ODS-modified monolithic silica capillary column
was performed as below:
(1) An ODS-modified monolithic silica capillary column with an I.D. of 100 μm was washed
with acetonitrile at a flow rate of 0.2 μL/min by a syringe pump for 3 hours.
(2) A 20 % N-(trimethylsilyl)imidazole (TMSI: see Fig. 4.6) solution in acetonitrile
(VTMSI/VAcetonitrile = 20/80: volume ratio) was prepared and then charged into the monolithic
silica capillary column with an I.D. of 100 μm at a flow rate of 0.1 μL/min by a syringe pump.
The reaction was carried out at 60 °C in an oven for longer than 24 hours.
(3) After the modification with the TMSI solution, the capillary column was washed with
acetonitrile at a flow rate of 0.2 μL/min by a syringe pump for 3 hours.
Fig. 4.6. Chemical structure of TMSI.
In this thesis, the endcapping with TMSI was carried out for the HPLC measurements with
the peptides (see Section 6.3), to prevent peak tailing phenomenon by the interaction between
silanol groups and amino groups in the peptides.

Chapter 4
- 36 -
4.5.3 Octadecylsilylation of Monolithic Silica Rod
The octadecylsilylation of a monolithic silica rod was performed as follows:
(1) Crushed bare monolithic silica was dried at 120 °C in an oven for 6 hours.
(2) Afterwards, 100 mg of bare monolithic silica was put into a glass container (50 mL) and
then 16 mL of toluene was added into the container.
(3) To prepare the 20% ODS-DEA solution in toluene, 4 mL of ODS-DEA was added into the
container.
(4) The octadecylsilylation of monolithic silica was carried out at 65 °C in an oil bath for 1‒100
hours.
(5) The ODS-modified silica was washed with toluene in a glass container (10mL) for 5 days
as the solvent was exchanged every day. Then, the silica was washed with THF for one day.

Chapter 5
- 37 -
5 Measurements
5.1 Reversed-Phase Liquid Chromatography
HPLC instruments were set up to evaluate the column performance of monolithic silica
capillary columns. Typical measurement conditions are as follows: HPLC pump was L-7100
pump (Hitachi) or LC-20A pump (Shimadzu) and a Rheodyne 7125 (Rheodyne) was used in
split injection/flow system. The spilt ratio was controlled at about 1/1000 for a capillary
column with an I.D. of 100 μm in order to maintain the high efficiency and reproducibility of
the pump above flow rate of 0.3 mL/min [50]. For the peak detection, MU701 UV-VIS detector
with a 2 nL of UV capillary cell (GL Sciences) was employed in a RPLC measurement. The
chromatographic data were processed with D-7000 HSM software (Hitachi). For the
measurements of an ODS-modified monolithic silica capillary column in RPLC, alkylbenzenes
(n = 0–6) were utilize to examine the column performance. Uracil or thiourea was used as t0
maker to calculate linear velocity, as explained in Section 2.2 (see Eq. (2.4)). Methanol/water
(V/V) = 80/20 or acetonitrile/water (V/V) = 80/20, prepared by mixing the solvents, was applied
to the measurements as mobile phase. The measurements were carried out at 30 C. Fig. 5.1
shows the illustration of split injection system with a monolithic silica capillary column in the
measurement.
Fig. 5.1. Schematic representation of split injection system with a capillary column.
Chapter 5
- 38 -
5.2 Size Exclusion Chromatography
Size exclusion chromatography (SEC) was performed with polystyrene standard (PSS)
samples in THF at 30 °C in order to examine porosity of a monolithic silica capillary column.
The chromatographic measurements were carried out by split injection/flow system, as
described in Section 5.1. UV detector K-2501 (Knauer) was employed for SEC measurements.
A linear velocity was set to 1.0 mm/s in the SEC measurements. For the peak detection, a
fused-silica capillary with an I.D. of 30 μm was utilized as a UV capillary cell. The cell length
from column outlet to the detection window was always kept at 3.4 cm in order to determine
column porosity exactly.
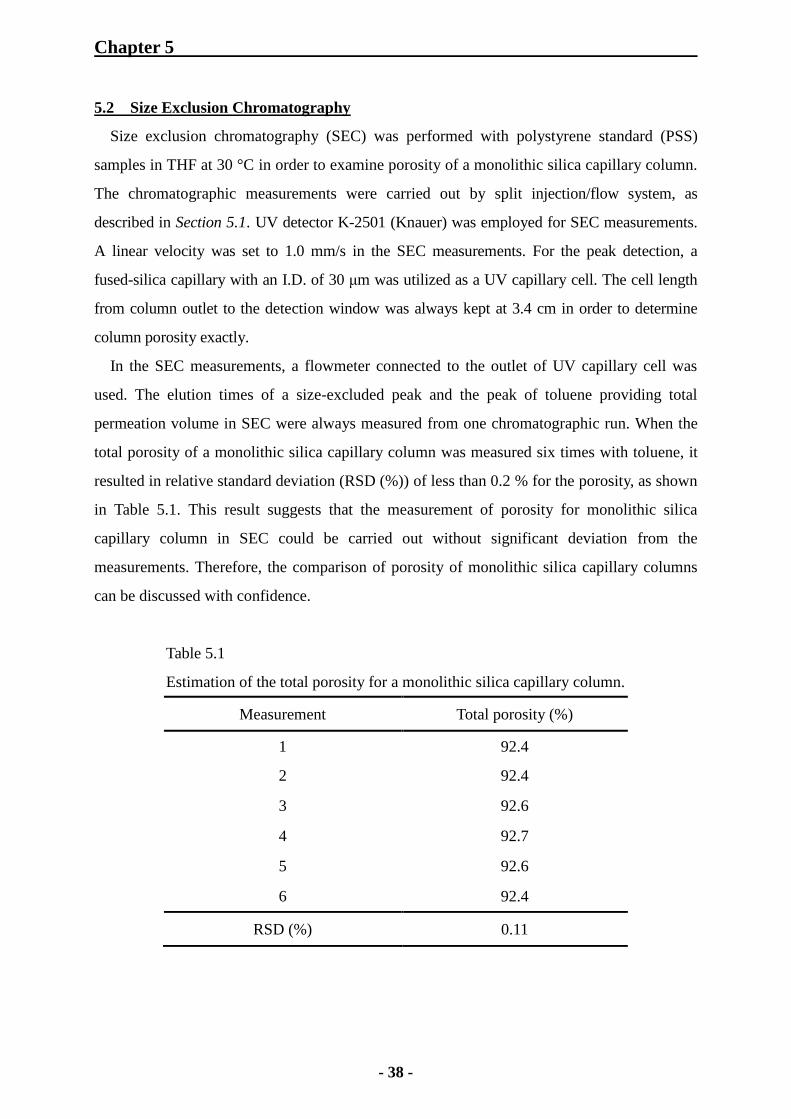
In the SEC measurements, a flowmeter connected to the outlet of UV capillary cell was
used. The elution times of a size-excluded peak and the peak of toluene providing total
permeation volume in SEC were always measured from one chromatographic run. When the
total porosity of a monolithic silica capillary column was measured six times with toluene, it
resulted in relative standard deviation (RSD (%)) of less than 0.2 % for the porosity, as shown
in Table 5.1. This result suggests that the measurement of porosity for monolithic silica
capillary column in SEC could be carried out without significant deviation from the
measurements. Therefore, the comparison of porosity of monolithic silica capillary columns
can be discussed with confidence.
Table 5.1
Estimation of the total porosity for a monolithic silica capillary column.
Measurement Total porosity (%)
1 92.4
2 92.4
3 92.6
4 92.7
5 92.6
6 92.4
RSD (%) 0.11
Chapter 5
- 39 -
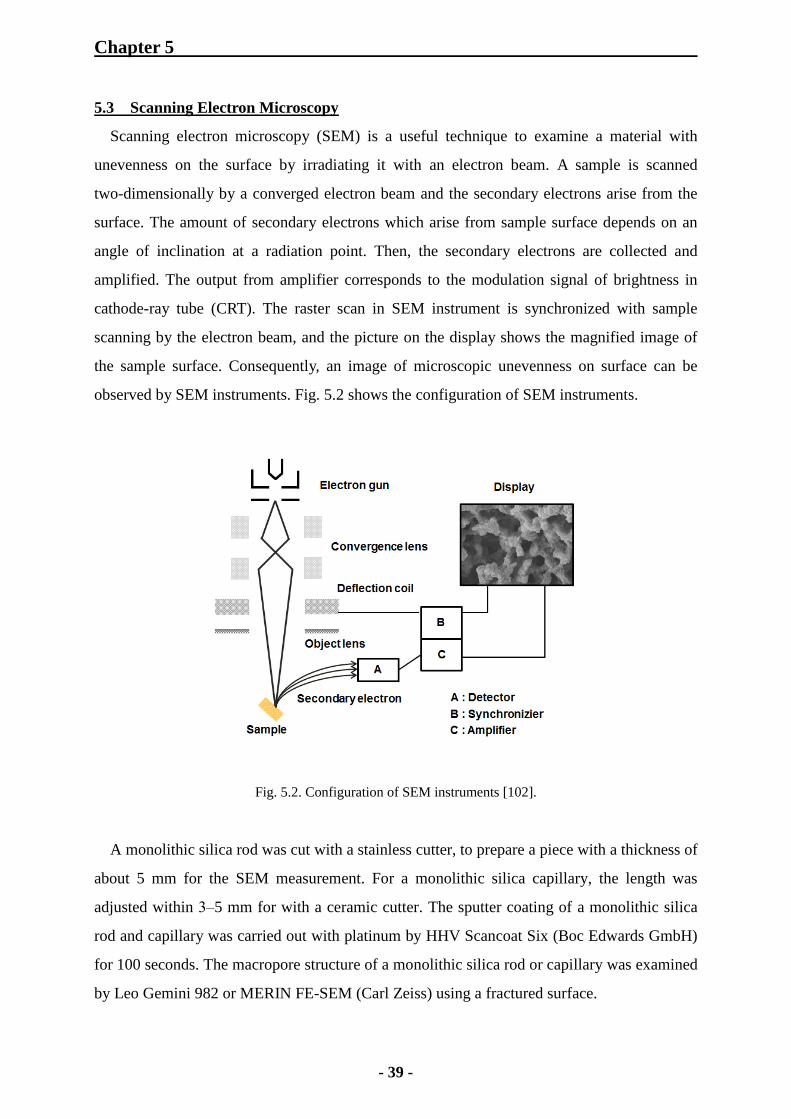
5.3 Scanning Electron Microscopy
Scanning electron microscopy (SEM) is a useful technique to examine a material with
unevenness on the surface by irradiating it with an electron beam. A sample is scanned
two-dimensionally by a converged electron beam and the secondary electrons arise from the
surface. The amount of secondary electrons which arise from sample surface depends on an
angle of inclination at a radiation point. Then, the secondary electrons are collected and
amplified. The output from amplifier corresponds to the modulation signal of brightness in
cathode-ray tube (CRT). The raster scan in SEM instrument is synchronized with sample
scanning by the electron beam, and the picture on the display shows the magnified image of
the sample surface. Consequently, an image of microscopic unevenness on surface can be
observed by SEM instruments. Fig. 5.2 shows the configuration of SEM instruments.
Fig. 5.2. Configuration of SEM instruments [102].
A monolithic silica rod was cut with a stainless cutter, to prepare a piece with a thickness of
about 5 mm for the SEM measurement. For a monolithic silica capillary, the length was
adjusted within 3‒5 mm for with a ceramic cutter. The sputter coating of a monolithic silica
rod and capillary was carried out with platinum by HHV Scancoat Six (Boc Edwards GmbH)
for 100 seconds. The macropore structure of a monolithic silica rod or capillary was examined
by Leo Gemini 982 or MERIN FE-SEM (Carl Zeiss) using a fractured surface.
Chapter 5
- 40 -
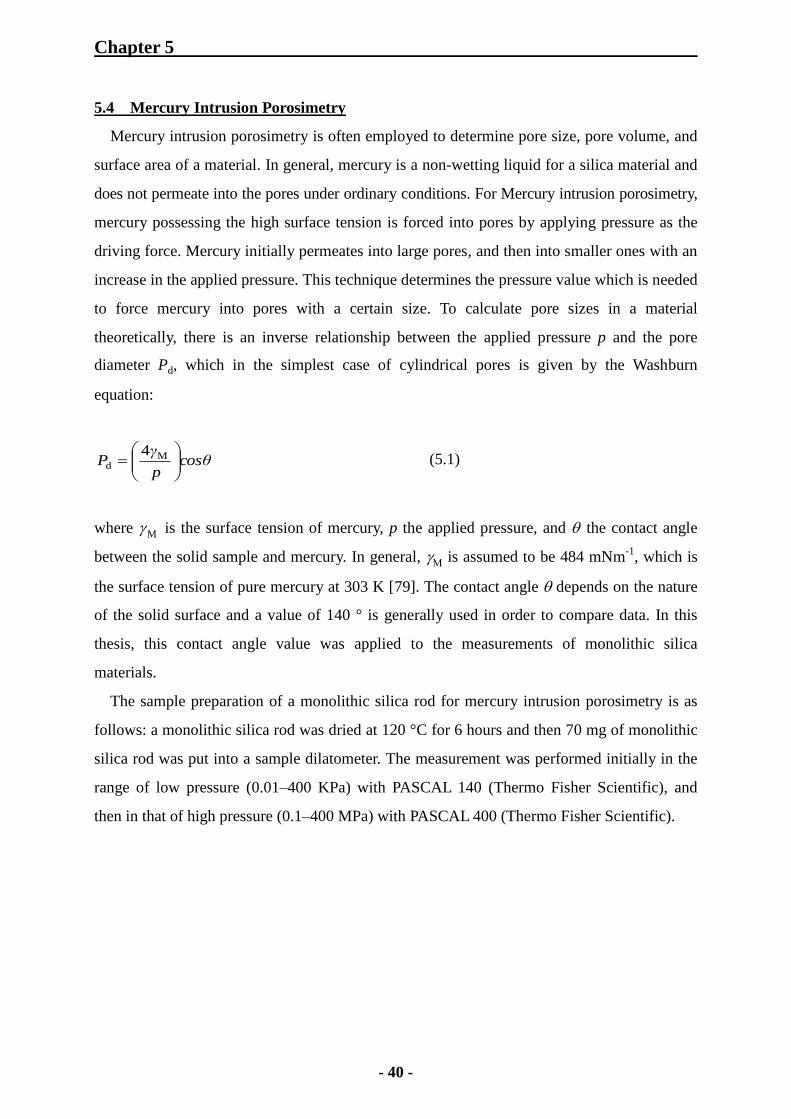
5.4 Mercury Intrusion Porosimetry
Mercury intrusion porosimetry is often employed to determine pore size, pore volume, and
surface area of a material. In general, mercury is a non-wetting liquid for a silica material and
does not permeate into the pores under ordinary conditions. For Mercury intrusion porosimetry,
mercury possessing the high surface tension is forced into pores by applying pressure as the
driving force. Mercury initially permeates into large pores, and then into smaller ones with an
increase in the applied pressure. This technique determines the pressure value which is needed
to force mercury into pores with a certain size. To calculate pore sizes in a material
theoretically, there is an inverse relationship between the applied pressure p and the pore
diameter Pd, which in the simplest case of cylindrical pores is given by the Washburn
equation:
cosθp
γP
M
d
4 (5.1)
where M is the surface tension of mercury, p the applied pressure, and the contact angle
between the solid sample and mercury. In general, is assumed to be 484 mNm-1
, which is
the surface tension of pure mercury at 303 K [79]. The contact angle depends on the nature
of the solid surface and a value of 140 ° is generally used in order to compare data. In this
thesis, this contact angle value was applied to the measurements of monolithic silica
materials.
The sample preparation of a monolithic silica rod for mercury intrusion porosimetry is as
follows: a monolithic silica rod was dried at 120 °C for 6 hours and then 70 mg of monolithic
silica rod was put into a sample dilatometer. The measurement was performed initially in the
range of low pressure (0.01‒400 KPa) with PASCAL 140 (Thermo Fisher Scientific), and
then in that of high pressure (0.1‒400 MPa) with PASCAL 400 (Thermo Fisher Scientific).

Chapter 5
- 41 -
5.5 Nitrogen Physisorption Method
This gas adsorption method is applied to the characterization of mesoporous materials.
Adsorption is the enrichment of molecules on an interfacial layer and desorption is the reverse
process of adsorption. The adsorption process is divided into physisorption and chemisorption:
physisorption is the adsorption due to van der Waals’ force, resulting in reversible change,
whereas chemisorption is irreversible change based on formation of new types of electronic
bonds (ionic or covalent) between the adsorptive and surface. In general, the physisorption
method is widely used for determining surface area, mesopore size, PSD, and mesopore volume
of a solid material and the chemisorption method is employed for measuring the dispersity of
metal in a catalyst [103, 104].
In the physisorption method at constant measurement temperature, the amount of gas
adsorbed in a material only depends on the applied pressure. When the progress of gas
adsorption stops at certain pressure (the numbers of adsorption molecules = the numbers of
desorption molecules), the pressure is called “equilibrium pressure (P)”. Generally,
“Equilibrium relative pressure (P/P0)” is applied to the physisorption measurement, ranging
from 0 to 1, where P0 is the saturation pressure of a pure adsorptive at a measurement
temperature. In the measurement, an isotherm curve is obtained from plotting the amount of
adsorptive (y-axis) against the relative pressure (P/P0) (x-axis). The characteristic of isotherm
curve is a function of pore size, pore volume, and adsorption energy, etc. The types of
isotherm curves are classified by International Union of Pure and Applied Chemistry (IUPAC),
as shown in Fig. 5.3 [104].
Fig. 5.3. Types of physisorption isotherms [104].
Chapter 5
- 42 -
For the classification of isotherms, Type I isotherm is typical of adsorption in microporous
materials (pore size < 2 nm), which cannot be analyzed by the common Brunauer-Emmett-Teller
(BET) equation. Type II isotherm is characteristic for non-porous or macroporous absorbents
(pore size > 50 nm). This isotherm represents unrestricted monolayer-multilayer adsorption.
As shown in Fig. 5.3, the stage at which monolayer coverage is complete and multiplayer
adsorption is about to begin, indicated by Point B (beginning of the almost linear middle
section of the isotherm). Types III and V isotherms are obtained for very weak adsorption
interactions, the fundamentals of which are not understood very well, and these types are
uncommon.
Type IV isotherm is generally observed for mesoporous materials (2 nm < pore size < 50
nm) [89, 103, 104]. Its hysteresis loop is associated with capillary condensation taking place
in mesopores, and the limiting uptake over a range of high relative pressure (P/P0). The initial
point of Type IV isotherm is attributed to monolayer-multilayer adsorption, because it follows
the same path as the corresponding part of Type II isotherm shown by the given adsorptive on
the same surface area of a non-porous absorbent.
Type VI isotherm depends on the system and the temperature, which represents stepwise
multilayer adsorption on a uniform non-porous surface. The best examples of Type VI
isotherms are those obtained with argon or krypton on graphitized carbon blacks at liquid
nitrogen temperature [104]. The nitrogen physisorption method is commonly applied to the
characterization of a solid porous material. In most cases, the isotherms can be identified as
Type I, II, and IV.
The nitrogen physisorption measurements were performed on monolithic silica rods in an
automated gas adsorption station (Autosorb-1-MP, Quantachrome Corporation). The device
was utilized for standard characterization measurements of nanostructured matter by nitrogen
sorption isotherms at 77 K. The instrument software supported the standard data reduction
algorithms such as BET and Barett-Joyner-Halenda (BJH) method for typical pore geometries.
Monolithic silica rods were put into standard glass tubes and were stabilized at the
measurement temperature (77 K) kept by liquid nitrogen in standard cryostats. The isotherms
were measured up to 0.95 at the relative pressure (P/P0). Before the measurements, the
crushed monolithic silica rods were evacuated for 6 h at 120 °C.
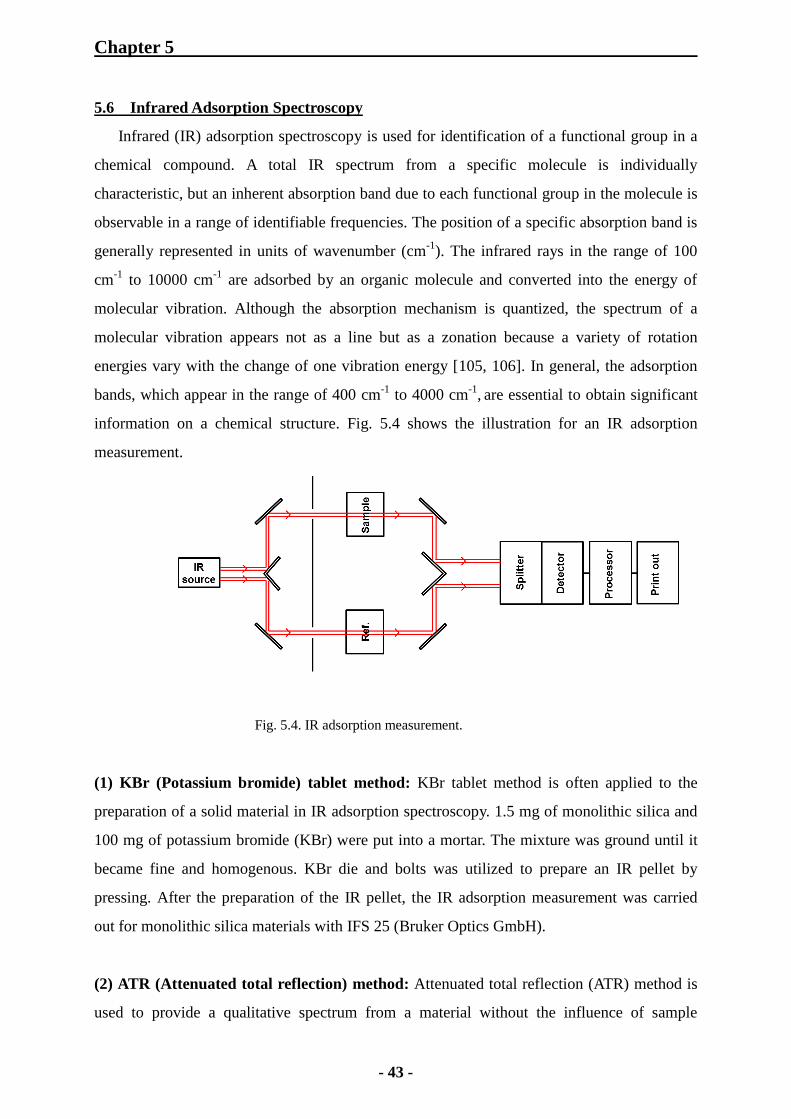
Chapter 5
- 43 -
5.6 Infrared Adsorption Spectroscopy
Infrared (IR) adsorption spectroscopy is used for identification of a functional group in a
chemical compound. A total IR spectrum from a specific molecule is individually
characteristic, but an inherent absorption band due to each functional group in the molecule is
observable in a range of identifiable frequencies. The position of a specific absorption band is
generally represented in units of wavenumber (cm-1
). The infrared rays in the range of 100
cm-1
to 10000 cm-1
are adsorbed by an organic molecule and converted into the energy of
molecular vibration. Although the absorption mechanism is quantized, the spectrum of a
molecular vibration appears not as a line but as a zonation because a variety of rotation
energies vary with the change of one vibration energy [105, 106]. In general, the adsorption
bands, which appear in the range of 400 cm-1
to 4000 cm-1
, are essential to obtain significant
information on a chemical structure. Fig. 5.4 shows the illustration for an IR adsorption
measurement.
Fig. 5.4. IR adsorption measurement.
(1) KBr (Potassium bromide) tablet method: KBr tablet method is often applied to the
preparation of a solid material in IR adsorption spectroscopy. 1.5 mg of monolithic silica and
100 mg of potassium bromide (KBr) were put into a mortar. The mixture was ground until it
became fine and homogenous. KBr die and bolts was utilized to prepare an IR pellet by
pressing. After the preparation of the IR pellet, the IR adsorption measurement was carried
out for monolithic silica materials with IFS 25 (Bruker Optics GmbH).
(2) ATR (Attenuated total reflection) method: Attenuated total reflection (ATR) method is
used to provide a qualitative spectrum from a material without the influence of sample
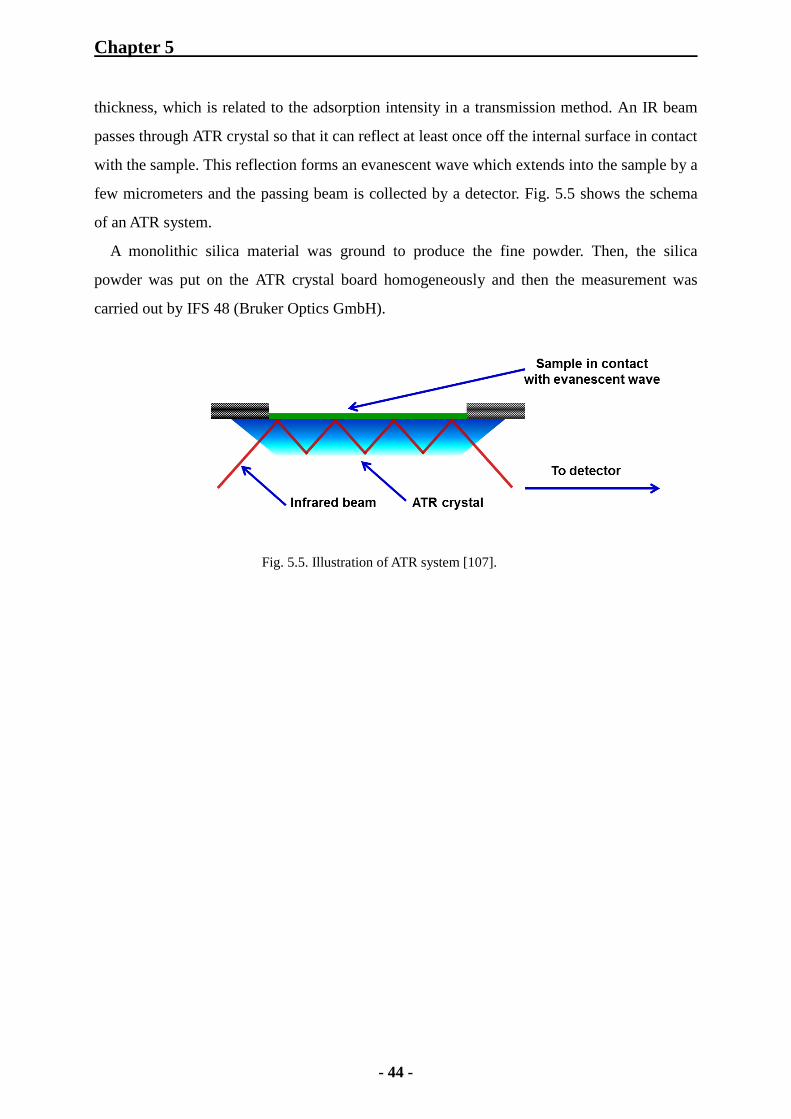
Chapter 5
- 44 -
thickness, which is related to the adsorption intensity in a transmission method. An IR beam
passes through ATR crystal so that it can reflect at least once off the internal surface in contact
with the sample. This reflection forms an evanescent wave which extends into the sample by a
few micrometers and the passing beam is collected by a detector. Fig. 5.5 shows the schema
of an ATR system.
A monolithic silica material was ground to produce the fine powder. Then, the silica
powder was put on the ATR crystal board homogeneously and then the measurement was
carried out by IFS 48 (Bruker Optics GmbH).
Fig. 5.5. Illustration of ATR system [107].

Chapter 5
- 45 -
5.7 Thermal Analysis
Thermal analysis is defined by International Confederation for Thermal Analysis and
Calorimetry (ICTAC). In this thesis, thermogravimetry (TG) and differential scanning calorimetry
(DSC) were applied to the thermal analysis of hybrid monolithic silica, to confirm the thermal
stability of methyl group inside the hybrid material. The definitions and utilities of TG and
DSC are shown as follows [108]:
(1) Thermogravimetry (TG): “A technique in which the mass of the sample is monitored against
time or temperature while the temperature of the sample, in a specified atmosphere, is
programmed.” The variations in sample weight, induced by oxidation-reduction, thermal
decomposition and adsorption-desorption, can be examined. TG is applied to the evaluation for
the thermal stability and analysis of reaction rate. Fig. 5.6(a) shows a TG instrument for
thermal analysis.
(2) Differential scanning calorimetry (DSC): “A technique in which the temperature of the sample
unit, formed by a sample and a reference material, is varied in a specified program, and the
temperature difference between the sample and the reference material is measured as a
function of temperature.” (In this thesis, the Heat Flux DSC method is used [108]). The
difference in temperature provides the information on thermal transformation and reaction
induced by heat. DSC enables the examination of the transitions, e.g. meltdown, glass
transition, and crystallization. Furthermore, the chemical reactions with respect to thermal
curing, specific heat capacity and purity analysis are also measureable. As another
measurement method, differential thermal analysis (DTA) also detects the difference in
temperature between a sample and a reference as well as DSC. However, the measurement
objective is the same for DSC and DTA. In the case of DSC analysis, the temperature
difference is expressed as a heat capacity per unit time (W = J/sec). Fig. 5.6(b) shows
schematics of a DSC instrument.
Typically, the thermal stability of 50 mg of monolithic silica was examined by using TG
and DSC. The measurements were carried out in atmospheric conditions at a heating rate of
5 °C/min by Netzsch STA 409 PC (Netzsch).
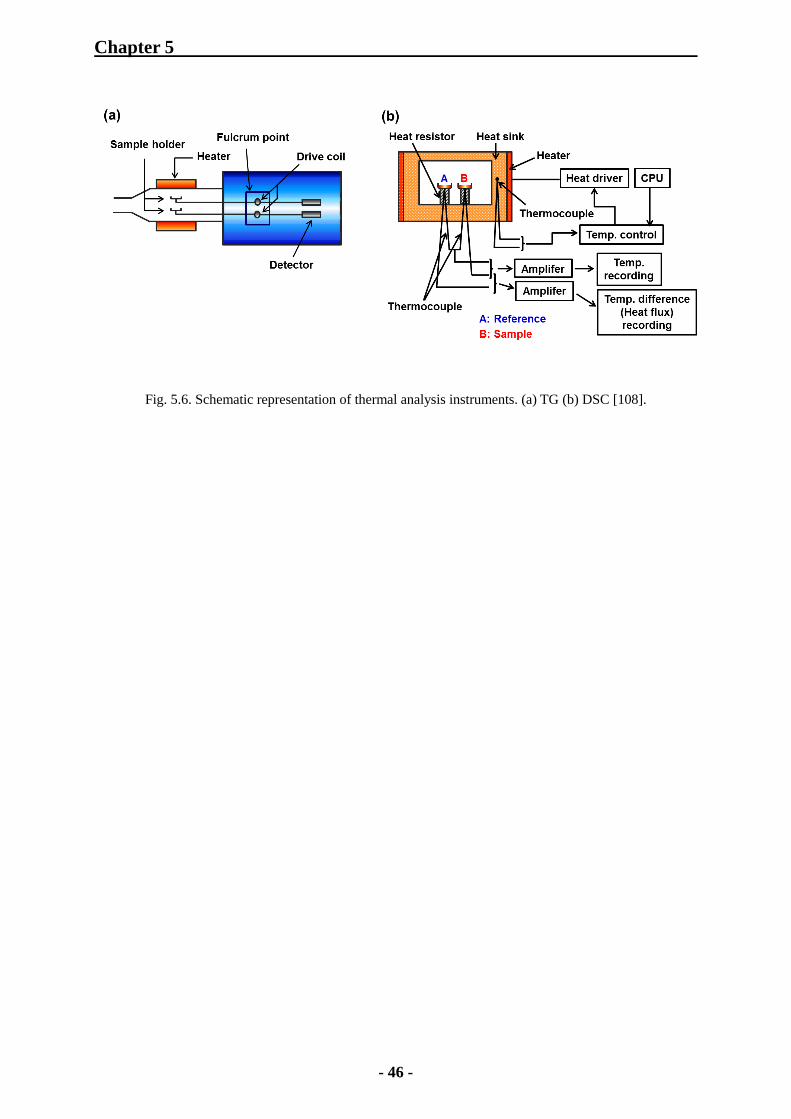
Chapter 5
- 46 -
Fig. 5.6. Schematic representation of thermal analysis instruments. (a) TG (b) DSC [108].
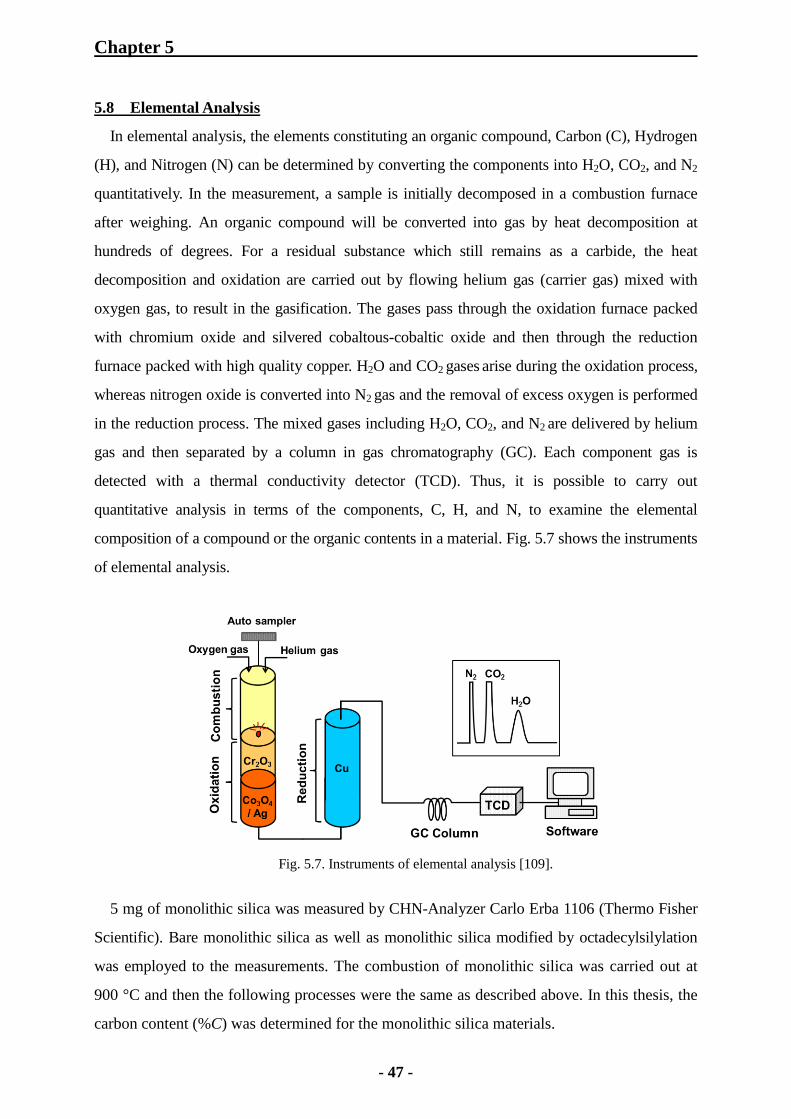
Chapter 5
- 47 -
5.8 Elemental Analysis
In elemental analysis, the elements constituting an organic compound, Carbon (C), Hydrogen
(H), and Nitrogen (N) can be determined by converting the components into H2O, CO2, and N2
quantitatively. In the measurement, a sample is initially decomposed in a combustion furnace
after weighing. An organic compound will be converted into gas by heat decomposition at
hundreds of degrees. For a residual substance which still remains as a carbide, the heat
decomposition and oxidation are carried out by flowing helium gas (carrier gas) mixed with
oxygen gas, to result in the gasification. The gases pass through the oxidation furnace packed
with chromium oxide and silvered cobaltous-cobaltic oxide and then through the reduction
furnace packed with high quality copper. H2O and CO2 gases arise during the oxidation process,
whereas nitrogen oxide is converted into N2 gas and the removal of excess oxygen is performed
in the reduction process. The mixed gases including H2O, CO2, and N2 are delivered by helium
gas and then separated by a column in gas chromatography (GC). Each component gas is
detected with a thermal conductivity detector (TCD). Thus, it is possible to carry out
quantitative analysis in terms of the components, C, H, and N, to examine the elemental
composition of a compound or the organic contents in a material. Fig. 5.7 shows the instruments
of elemental analysis.
Fig. 5.7. Instruments of elemental analysis [109].
5 mg of monolithic silica was measured by CHN-Analyzer Carlo Erba 1106 (Thermo Fisher
Scientific). Bare monolithic silica as well as monolithic silica modified by octadecylsilylation
was employed to the measurements. The combustion of monolithic silica was carried out at
900 °C and then the following processes were the same as described above. In this thesis, the
carbon content (%C) was determined for the monolithic silica materials.
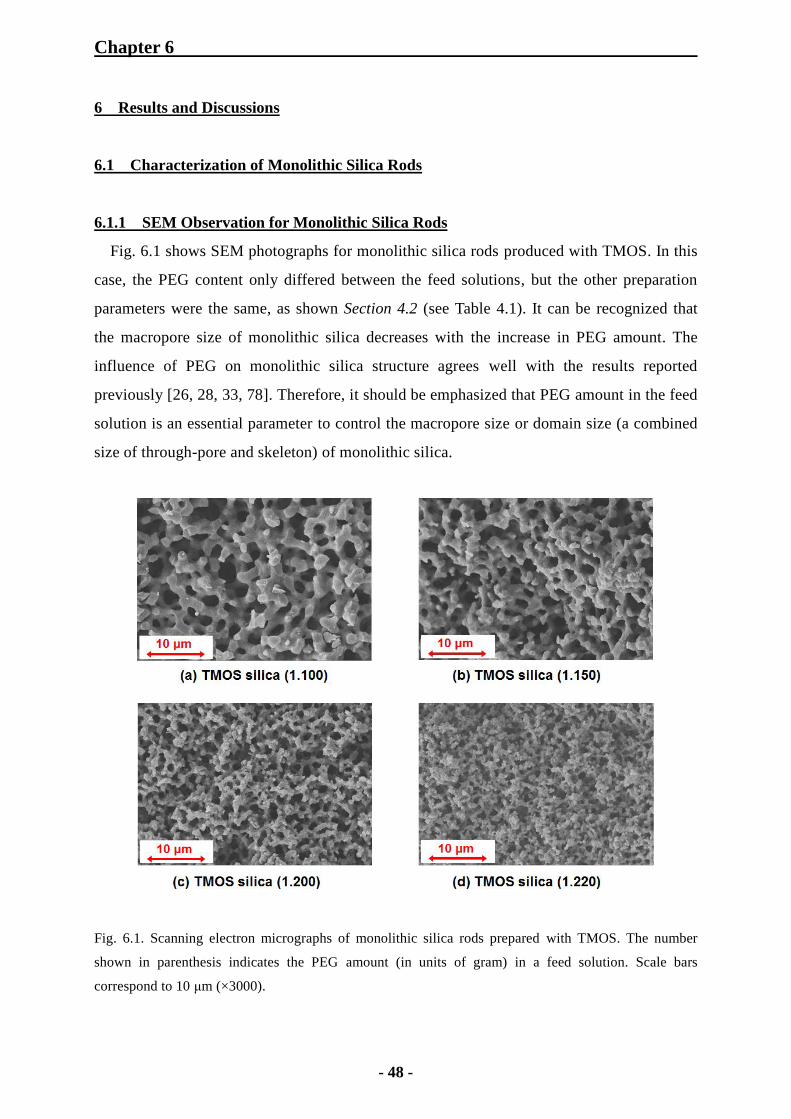
Chapter 6
- 48 -
6 Results and Discussions
6.1 Characterization of Monolithic Silica Rods
6.1.1 SEM Observation for Monolithic Silica Rods
Fig. 6.1 shows SEM photographs for monolithic silica rods produced with TMOS. In this
case, the PEG content only differed between the feed solutions, but the other preparation
parameters were the same, as shown Section 4.2 (see Table 4.1). It can be recognized that
the macropore size of monolithic silica decreases with the increase in PEG amount. The
influence of PEG on monolithic silica structure agrees well with the results reported
previously [26, 28, 33, 78]. Therefore, it should be emphasized that PEG amount in the feed
solution is an essential parameter to control the macropore size or domain size (a combined
size of through-pore and skeleton) of monolithic silica.
Fig. 6.1. Scanning electron micrographs of monolithic silica rods prepared with TMOS. The number
shown in parenthesis indicates the PEG amount (in units of gram) in a feed solution. Scale bars
correspond to 10 μm (×3000).

Chapter 6
- 49 -
6.1.2 Mercury Intrusion Porosimetry for Monolithic Silica Rods
Fig. 6.2 shows the relationship between cumulative pore volume and pore diameter with the
TMOS monolithic silica rods which were used for the SEM measurements. Mercury intrusion
porosimetry is useful to examine the change of porosity of the monolithic silica rods quantitatively,
which is due to different amounts of PEG in a preparation feed solution [25, 33, 78]. As seen in
Fig. 6.2, it is possible to observe that the macropore size decreases from 2.1 μm to 0.6 μm
significantly by increasing the PEG amount from 1.100 g to 1.220 g. This proves that the
macropore size decrease with the increase in PEG amount, as confirmed by SEM [26, 78]. In
addition, the mesopore size showed the similar value (5–6 nm) for all the silica rods.
Furthermore, the total cumulative pore volume (meso- and macropore volume) was similar
(2830–2940 mm3/g), because both the macro- and mesopore volume for all the silica rods
showed no significant variation despite the change of the PEG amount. In this case, the same
preparation procedures were employed for all the silica rods except for the change of PEG
amount in the feed solutions. Therefore, this result demonstrates that the change of PEG
amount provides no significant influence on both the macro- and mesopore volume and the
mesopore size, but affects the macropore size or domain size. The same influence of PEG on
monolithic silica structure was reported previously by Nakanishi and co-workers [26, 33].
With respect to an accurate evaluation of mesopore size distribution of the monolithic silica,
the adjustment of contact angle between mercury and solid sample was suggested by Unger and
co-workers (see Section 5.4) [79]. The effect of contact angle at = 140 ° (standard angle for
silica material) and = 145 ° on PSD was examined by the aforementioned authors. It was
shown that the results obtained from an angle of = 145 ° corresponded well to those obtained
by nitrogen physisorption method. However, it should be emphasized that the consideration
about adjustment of contact angle is far from the objective in this thesis. In the present study, the
measurements of monolithic silica by mercury intrusion porosimetry were dedicated to show
the similarity regarding mesopore volume and mesopore size for the TMOS silica rods.
On the other hand, for a hybrid monolithic silica rod prepared with TMOS and MTMS, it was
not possible to correlate mesopore size to that obtained by using nitrogen physisorption (The
peak was distorted significantly or disappeared). This phenomenon has not been observed for
TMOS monolithic silica. It can be suggested that the structure might have collapsed during the
measurement. The low mechanical stability can be ascribed to the lack of siloxane networks
because of the presence of methyl groups in a hybrid material. For example, the measurement of
mesopores below 20 nm needs higher intrusion pressure than 100 MPa, to force mercury into

Chapter 6
- 50 -
the pores. Therefore, for hybrid monolithic silica, the examination by mercury intrusion
porosimetry should be dedicated to observe macropores.
Fig. 6.2. Cumulative pore volume of TMOS monolithic silica rods by mercury intrusion porosimetry.
Symbol: TMOS silica (1.100) ( ), TMOS silica (1.150) ( ), TMOS silica (1.200) ( ), TMOS silica
(1.220) ( ). Hydrothermal treatment at 80 °C for 15 hours was carried out for all the silica rods, as
described in Section 4.4.
Fig. 6.3 shows the comparison of cumulative pore volume of the TMOS monolithic silica
rods in the range of 50 nm to 3000 nm. The slope of the curves tends to be steeper with the
decrease in the macropore size, as shown by the ellipsoidal mark with dashed line in Fig. 6.3.
Moreover, the measurements of macropores (pore size > 50 nm) were carried out below 30
MPa. Even for hybrid monolithic silica columns, it has never been observed that the loss of
column performance results from the collapse of structure up to 40 MPa in HPLC [55, 56]. It
supports that the collapse of monolithic silica structure was negligible during the
measurements of macropores by mercury intrusion porosimetry. Consequently, it is suggested
that it is still hard to control the structural homogeneity of macropores when the macropore
size (or domain size) decreases with the increase in PEG amount in the feed solution, as
reported previously by Cabrera and co-workers [78].
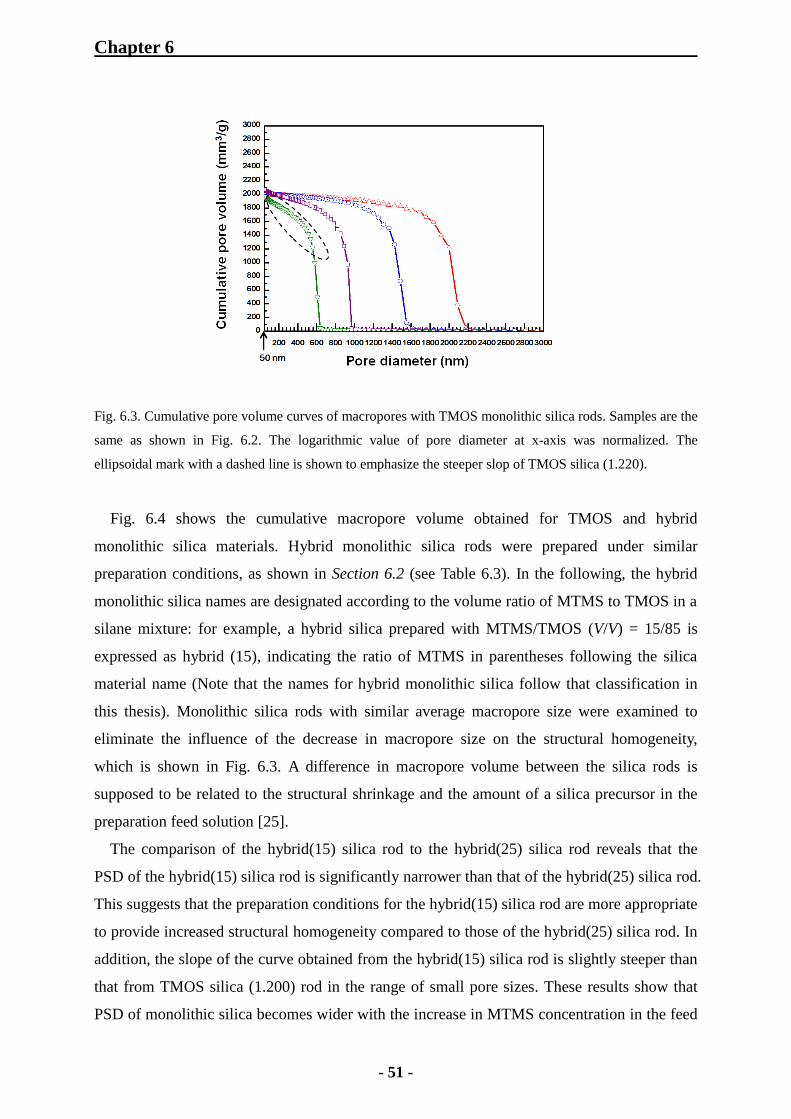
Chapter 6
- 51 -
Fig. 6.3. Cumulative pore volume curves of macropores with TMOS monolithic silica rods. Samples are the
same as shown in Fig. 6.2. The logarithmic value of pore diameter at x-axis was normalized. The
ellipsoidal mark with a dashed line is shown to emphasize the steeper slop of TMOS silica (1.220).
Fig. 6.4 shows the cumulative macropore volume obtained for TMOS and hybrid
monolithic silica materials. Hybrid monolithic silica rods were prepared under similar
preparation conditions, as shown in Section 6.2 (see Table 6.3). In the following, the hybrid
monolithic silica names are designated according to the volume ratio of MTMS to TMOS in a
silane mixture: for example, a hybrid silica prepared with MTMS/TMOS (V/V) = 15/85 is
expressed as hybrid (15), indicating the ratio of MTMS in parentheses following the silica
material name (Note that the names for hybrid monolithic silica follow that classification in
this thesis). Monolithic silica rods with similar average macropore size were examined to
eliminate the influence of the decrease in macropore size on the structural homogeneity,
which is shown in Fig. 6.3. A difference in macropore volume between the silica rods is
supposed to be related to the structural shrinkage and the amount of a silica precursor in the
preparation feed solution [25].
The comparison of the hybrid(15) silica rod to the hybrid(25) silica rod reveals that the
PSD of the hybrid(15) silica rod is significantly narrower than that of the hybrid(25) silica rod.
This suggests that the preparation conditions for the hybrid(15) silica rod are more appropriate
to provide increased structural homogeneity compared to those of the hybrid(25) silica rod. In
addition, the slope of the curve obtained from the hybrid(15) silica rod is slightly steeper than
that from TMOS silica (1.200) rod in the range of small pore sizes. These results show that
PSD of monolithic silica becomes wider with the increase in MTMS concentration in the feed

Chapter 6
- 52 -
solution. Therefore, it is assumed that the control of hybrid monolithic silica structure is more
difficult than that of TMOS monolithic silica structure because of the difference in reactivity
between TMOS and MTMS.
Fig. 6.4. Cumulative pore volume curves of macropores with TMOS and hybrid monolithic silica rods.
Symbol: TMOS silica (1,200) ( ), hybrid(15) silica ( ), hybrid(25) silica ( ). The MTMS content (%) in
a feed solution is shown in parentheses following the silica material name.
Fig. 6.5 shows the SEM photographs to investigate the structures for the TMOS and hybrid
monolithic silica rods. It is seen that the structural homogeneity of monolithic silica decreases
with the increase in MTMS concentration, as demonstrated by mercury intrusion porosimetry. For
monolithic silica capillary columns, similar results are obtained in Section 6.2 (see Fig. 6.22).
Fig. 6.5. Scanning electron micrographs of monolithic silica rods. Samples are the same as shown in Fig. 6.4.
Scale bars correspond to 10 μm (×3000).
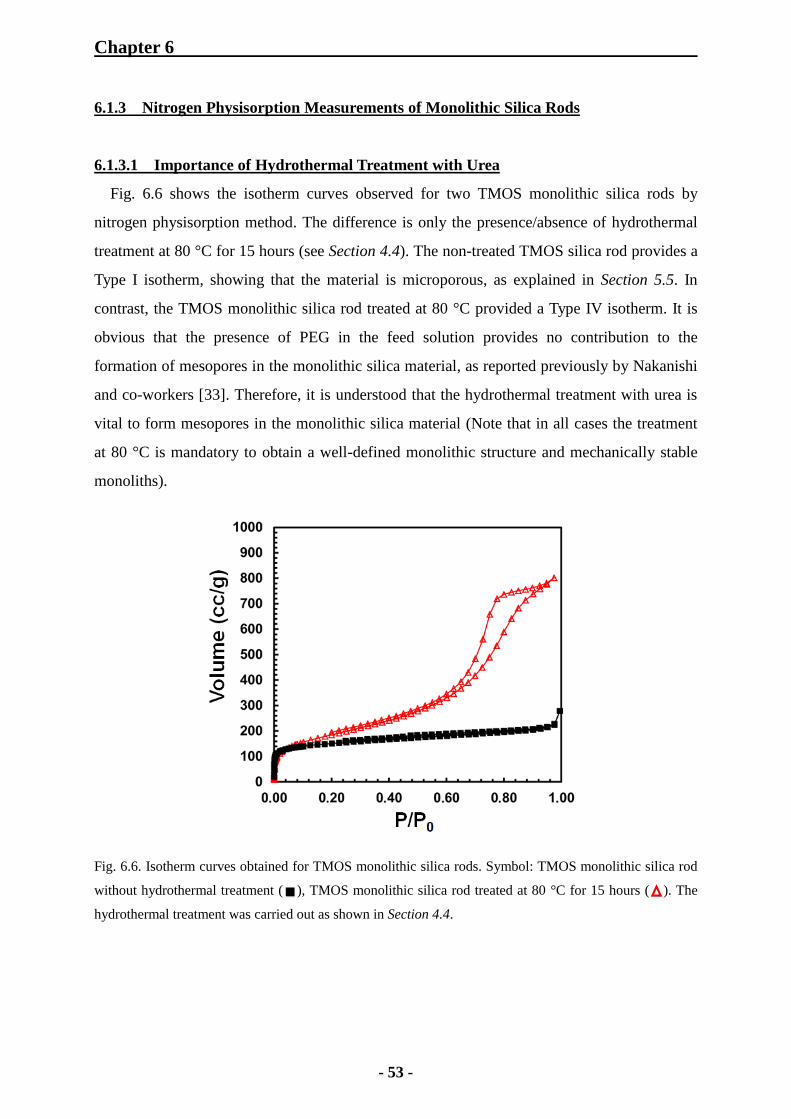
Chapter 6
- 53 -
6.1.3 Nitrogen Physisorption Measurements of Monolithic Silica Rods
6.1.3.1 Importance of Hydrothermal Treatment with Urea
Fig. 6.6 shows the isotherm curves observed for two TMOS monolithic silica rods by
nitrogen physisorption method. The difference is only the presence/absence of hydrothermal
treatment at 80 °C for 15 hours (see Section 4.4). The non-treated TMOS silica rod provides a
Type I isotherm, showing that the material is microporous, as explained in Section 5.5. In
contrast, the TMOS monolithic silica rod treated at 80 °C provided a Type IV isotherm. It is
obvious that the presence of PEG in the feed solution provides no contribution to the
formation of mesopores in the monolithic silica material, as reported previously by Nakanishi
and co-workers [33]. Therefore, it is understood that the hydrothermal treatment with urea is
vital to form mesopores in the monolithic silica material (Note that in all cases the treatment
at 80 °C is mandatory to obtain a well-defined monolithic structure and mechanically stable
monoliths).
Fig. 6.6. Isotherm curves obtained for TMOS monolithic silica rods. Symbol: TMOS monolithic silica rod
without hydrothermal treatment ( ), TMOS monolithic silica rod treated at 80 °C for 15 hours ( ). The
hydrothermal treatment was carried out as shown in Section 4.4.
■

Chapter 6
- 54 -
6.1.3.2 Examination of Porosity of TMOS and Hybrid Monolithic Silica Rods
In order to investigate the influence of hydrothermal treatment on mesoporosity, monolithic
silica rods were prepared under different hydrothermal conditions, as shown in Section 4.4
(Note that the treatment conditions for monolithic silica rods correspond to those for the
capillary columns used in Section 6.3). In this case, the hydrothermal treatment procedures
differ only in the presence/absence of an additional treatment at 120 °C for 3 hours or 4 hours.
Fig. 6.7(a) and 6.7(b) show the nitrogen physisorption isotherm curves obtained for TMOS
and hybrid(15) monolithic silica rods. All the silica rods show Type IV isotherms according to
the classification of IUPAC. The additional hydrothermal treatment at 120 °C for 3 or 4 hours
significantly changes the isotherm curves, thus influencing the mesoporosity. This trend was
observed for both TMOS and hybrid(15) silica rods.
Fig. 6.8(a) and 6.8(b) show the PSD observed for the monolithic silica rods by the BJH method
(desorption) and the plots of cumulative pore volume against pore diameters, respectively. The
additional treatment at 120 °C for TMOS and hybrid(15) rods provided larger pores and a wider
PSD than the hydrothermal treatment at 80 °C, as shown in Fig. 6.8(a). When the pH value of a
solution of urea (0.09 g/mL) in a 0.01 M acetic acid aqueous solution was examined at 23 °C, the
solution exposed to hydrothermal treatment at 80 °C for 15 hours provided pH = 9.8, and the
solution treated additionally at 120 °C for 3 hours yielded pH = 10.2. The high pH values result
from the transformation from a solution of urea to an aqueous solution of ammonium carbonate
by heating (see Section 3.2). This interpretation is supported by the observation that a solution
heated from room temperature to 80 °C during 10 hours possessed a pH value of 8.1, which
changed from pH = 3.7 of the non-heated solution. These results show that the solutions of urea
can provide basic conditions required for generating mesopores in silica. The PSD becomes
wider and the average mesopore size does larger with higher temperature and a larger pH
value by Ostwald ripening. This agrees well with the results obtained from an ammonia
solution which was used in the previous reports [85, 86].
The present study also allowed for the comparison of TMOS and hybrid(15) silica rods
regarding the influence of the additional hydrothermal treatment at 120 °C. The influence of
methyl groups on the formation of mesopores was already described for MTMS monolithic
silica [53]. The result shown in Fig. 6.8 suggests that it is more difficult to obtain hybrid(15)
monolithic silica rods featuring well-defined mesopores of 12‒13 nm, which is the common
mesopore size of monolithic silica separation media in HPLC. The additional treatment at
120 °C results in an increased mesopore size, but the PSD for hybrid(15) silica rod is
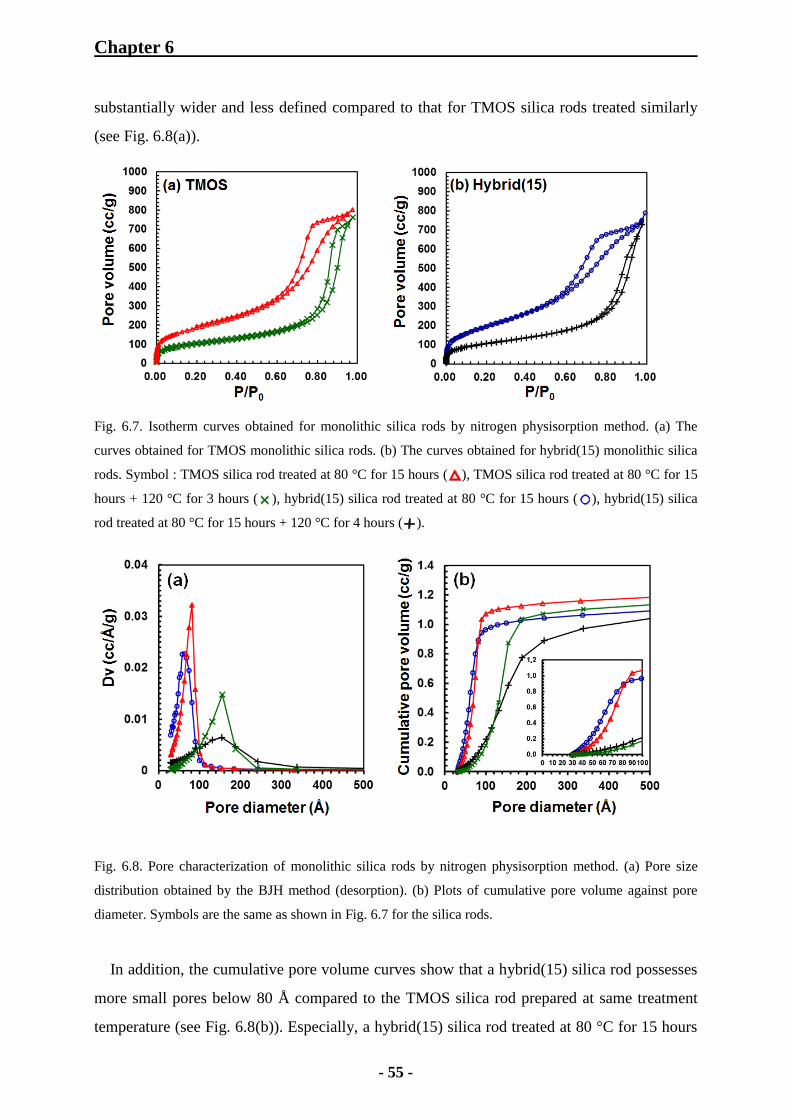
Chapter 6
- 55 -
substantially wider and less defined compared to that for TMOS silica rods treated similarly
(see Fig. 6.8(a)).
Fig. 6.7. Isotherm curves obtained for monolithic silica rods by nitrogen physisorption method. (a) The
curves obtained for TMOS monolithic silica rods. (b) The curves obtained for hybrid(15) monolithic silica
rods. Symbol : TMOS silica rod treated at 80 °C for 15 hours ( ), TMOS silica rod treated at 80 °C for 15
hours + 120 °C for 3 hours ( ), hybrid(15) silica rod treated at 80 °C for 15 hours ( ), hybrid(15) silica
rod treated at 80 °C for 15 hours + 120 °C for 4 hours ( ).
Fig. 6.8. Pore characterization of monolithic silica rods by nitrogen physisorption method. (a) Pore size
distribution obtained by the BJH method (desorption). (b) Plots of cumulative pore volume against pore
diameter. Symbols are the same as shown in Fig. 6.7 for the silica rods.
In addition, the cumulative pore volume curves show that a hybrid(15) silica rod possesses
more small pores below 80 Å compared to the TMOS silica rod prepared at same treatment
temperature (see Fig. 6.8(b)). Especially, a hybrid(15) silica rod treated at 80 °C for 15 hours
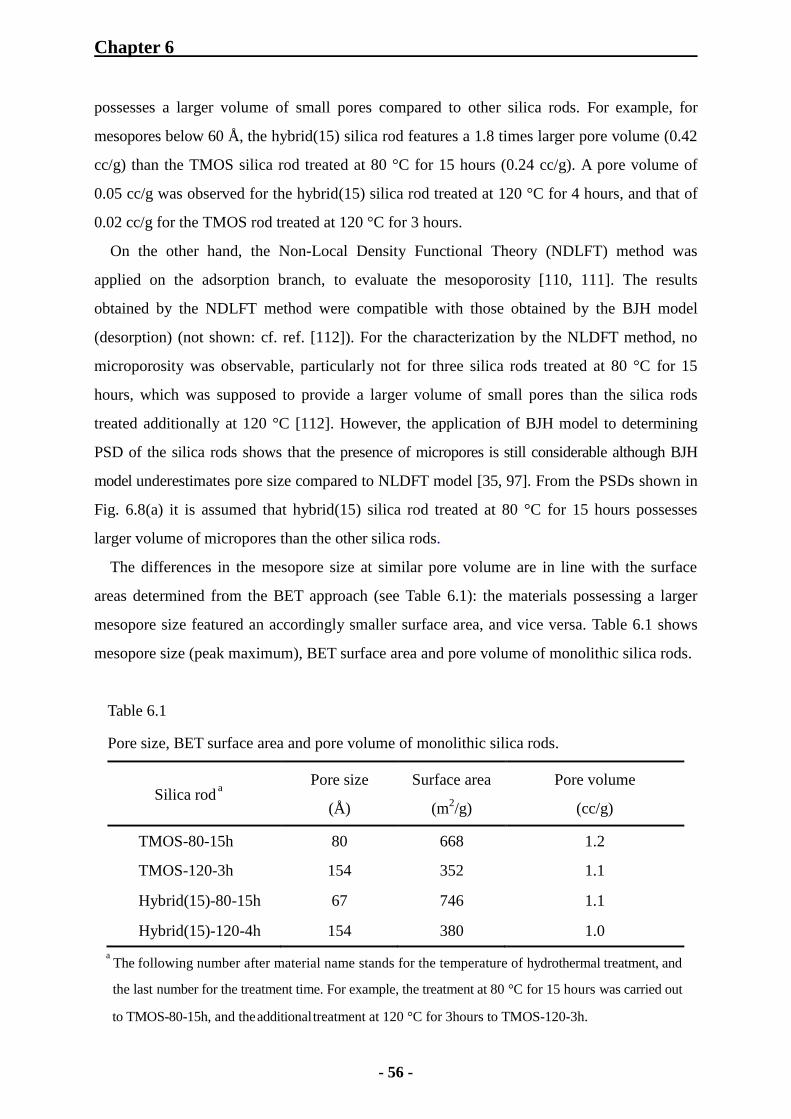
Chapter 6
- 56 -
possesses a larger volume of small pores compared to other silica rods. For example, for
mesopores below 60 Å, the hybrid(15) silica rod features a 1.8 times larger pore volume (0.42
cc/g) than the TMOS silica rod treated at 80 °C for 15 hours (0.24 cc/g). A pore volume of
0.05 cc/g was observed for the hybrid(15) silica rod treated at 120 °C for 4 hours, and that of
0.02 cc/g for the TMOS rod treated at 120 °C for 3 hours.
On the other hand, the Non-Local Density Functional Theory (NDLFT) method was
applied on the adsorption branch, to evaluate the mesoporosity [110, 111]. The results
obtained by the NDLFT method were compatible with those obtained by the BJH model
(desorption) (not shown: cf. ref. [112]). For the characterization by the NLDFT method, no
microporosity was observable, particularly not for three silica rods treated at 80 °C for 15
hours, which was supposed to provide a larger volume of small pores than the silica rods
treated additionally at 120 °C [112]. However, the application of BJH model to determining
PSD of the silica rods shows that the presence of micropores is still considerable although BJH
model underestimates pore size compared to NLDFT model [35, 97]. From the PSDs shown in
Fig. 6.8(a) it is assumed that hybrid(15) silica rod treated at 80 °C for 15 hours possesses
larger volume of micropores than the other silica rods.
The differences in the mesopore size at similar pore volume are in line with the surface
areas determined from the BET approach (see Table 6.1): the materials possessing a larger
mesopore size featured an accordingly smaller surface area, and vice versa. Table 6.1 shows
mesopore size (peak maximum), BET surface area and pore volume of monolithic silica rods.
Table 6.1
Pore size, BET surface area and pore volume of monolithic silica rods.
Silica rod a
Pore size
(Å)
Surface area
(m2/g)
Pore volume
(cc/g)
TMOS-80-15h 80 668 1.2
TMOS-120-3h 154 352 1.1
Hybrid(15)-80-15h 67 746 1.1
Hybrid(15)-120-4h 154 380 1.0
a The following number after material name stands for the temperature of hydrothermal treatment, and
the last number for the treatment time. For example, the treatment at 80 °C for 15 hours was carried out
to TMOS-80-15h, and the additional treatment at 120 °C for 3hours to TMOS-120-3h.
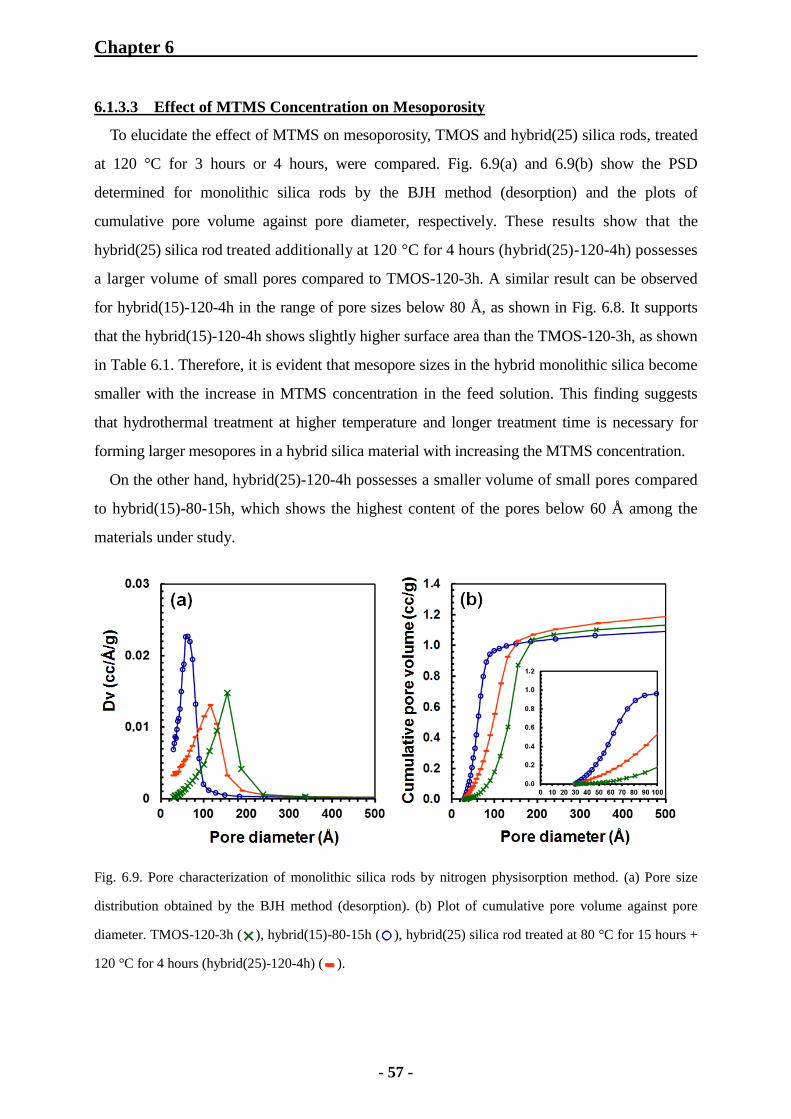
Chapter 6
- 57 -
6.1.3.3 Effect of MTMS Concentration on Mesoporosity
To elucidate the effect of MTMS on mesoporosity, TMOS and hybrid(25) silica rods, treated
at 120 °C for 3 hours or 4 hours, were compared. Fig. 6.9(a) and 6.9(b) show the PSD
determined for monolithic silica rods by the BJH method (desorption) and the plots of
cumulative pore volume against pore diameter, respectively. These results show that the
hybrid(25) silica rod treated additionally at 120 °C for 4 hours (hybrid(25)-120-4h) possesses
a larger volume of small pores compared to TMOS-120-3h. A similar result can be observed
for hybrid(15)-120-4h in the range of pore sizes below 80 Å, as shown in Fig. 6.8. It supports
that the hybrid(15)-120-4h shows slightly higher surface area than the TMOS-120-3h, as shown
in Table 6.1. Therefore, it is evident that mesopore sizes in the hybrid monolithic silica become
smaller with the increase in MTMS concentration in the feed solution. This finding suggests
that hydrothermal treatment at higher temperature and longer treatment time is necessary for
forming larger mesopores in a hybrid silica material with increasing the MTMS concentration.
On the other hand, hybrid(25)-120-4h possesses a smaller volume of small pores compared
to hybrid(15)-80-15h, which shows the highest content of the pores below 60 Å among the
materials under study.
Fig. 6.9. Pore characterization of monolithic silica rods by nitrogen physisorption method. (a) Pore size
distribution obtained by the BJH method (desorption). (b) Plot of cumulative pore volume against pore
diameter. TMOS-120-3h ( ), hybrid(15)-80-15h ( ), hybrid(25) silica rod treated at 80 °C for 15 hours +
120 °C for 4 hours (hybrid(25)-120-4h) ( ).

Chapter 6
- 58 -
6.1.4 IR Adsorption Spectroscopy for Monolithic Silica Rods
6.1.4.1 KBr Tablet Method
Fig. 6.10 shows the IR spectra of monolithic silica rods investigated by using the KBr tablet
method. Different MTMS concentrations in the feed solution were employed to produce four kinds
of monolithic silica rods, according to the similar preparation conditions shown in Section 6.2 (see
Table 6.3). The broad adsorption bands at 3200–3700 cm-1
and 1640 cm-1
are ascribed to the
vibrations of Si-OH groups, which are associated with adsorbed water. (Note that in the case of the
KBr tablet method, the specific absorption bands generally appear at 3450 cm-1
and 1640 cm-1,
because KBr adsorbs water from atmosphere easily [106]). The absorption bands at 2980–2850
cm-1
are attributed to symmetric and asymmetric stretching of C-H groups, and those at 1420,
1277, and around 800 cm-1
to the vibrations of Si-CH3 terminals [105, 106, 113‒117]. In addition,
the broad adsorption bands at 1000–1200 cm-1
and the band at around 800 cm-1
were provided by
the vibrations of Si-O-Si groups [106, 114, 115, 117]. Although the adsorption bands at around
800 cm-1
overlap the bands of Si-CH3 groups, it is possible to observe the shape variations of the
bands in the range of 750‒850 cm-1
. With the increase in MTMS concentration in the feed
solution, the intensities of the adsorption bands due to Si-CH3 groups were increased significantly,
especially for the band at 1277 cm-1
. Therefore, this finding suggests that more methyl groups
(-CH3) can be introduced into the monolithic silica by increasing MTMS concentration in the feed
solution.
Fig. 6.10. Infrared spectra of monolithic silica rods by KBr tablet method. Sample: (A) TMOS silica, (B)
hybrid(10) silica, (C) hybrid(15) silica, (D) hybrid(25) silica. The wavenumber ranges of the bands due to
Si-CH3 groups are represented with yellow color.

Chapter 6
- 59 -
6.1.4.2 ATR Method
Compared to the KBr tablet method, the ATR method enables the elimination of the
influence of water adsorbed by KBr tablet in the measurements. Thus, it is assumed that the
effect of water on a spectrum shown by the ATR method depends on the adsorbed amount due
to the nature of a monolithic silica material.
Fig. 6.11 shows the IR spectra obtained for monolithic silica rods by the ATR method. The
adsorption bands due to Si-OH groups were detected at 3200–3700 cm-1
and 1640 cm-1
, and
the bands of Si-CH3 groups were observed at 1277 cm-1
and 750–850 cm-1
, as seen by the
KBr tablet method. An increase in MTMS concentration in a feed solution leads to lower
intensities of the adsorption bands at 3200–3700 cm-1
and 1640 cm-1
. For the characteristic
bands at 1277 cm-1
and 750–850 cm-1
, the same trends were observed compared to the results
obtained by KBr method. These results show that the amount of methyl groups increases with
the decrease in adsorbed water content on the silica surface. It is suggested that the
hydrophobicity of the hybrid silica, supposed to hinder the adsorption of water on the surface,
increases with increasing the content of methyl groups (-CH3) introduced by MTMS.
Therefore, it is concluded that the hydrophobicity of the hybrid monolithic silica is enhanced
with the increase in the MTMS concentration.
Fig. 6.11. Infrared spectra of monolithic silica rods by ATR method. Samples are the same as those shown in
Fig. 6.10. The wavenumber ranges of the bands due to Si-CH3 groups are represented with yellow color.
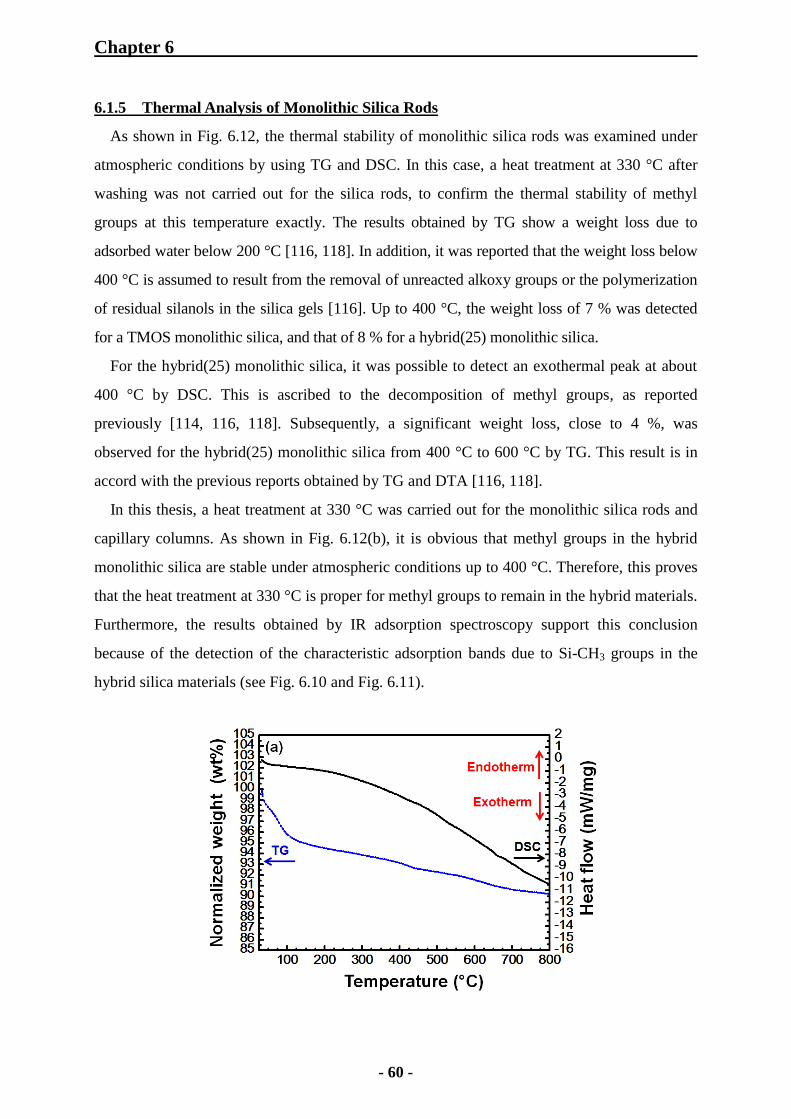
Chapter 6
- 60 -
6.1.5 Thermal Analysis of Monolithic Silica Rods
As shown in Fig. 6.12, the thermal stability of monolithic silica rods was examined under
atmospheric conditions by using TG and DSC. In this case, a heat treatment at 330 °C after
washing was not carried out for the silica rods, to confirm the thermal stability of methyl
groups at this temperature exactly. The results obtained by TG show a weight loss due to
adsorbed water below 200 °C [116, 118]. In addition, it was reported that the weight loss below
400 °C is assumed to result from the removal of unreacted alkoxy groups or the polymerization
of residual silanols in the silica gels [116]. Up to 400 °C, the weight loss of 7 % was detected
for a TMOS monolithic silica, and that of 8 % for a hybrid(25) monolithic silica.
For the hybrid(25) monolithic silica, it was possible to detect an exothermal peak at about
400 °C by DSC. This is ascribed to the decomposition of methyl groups, as reported
previously [114, 116, 118]. Subsequently, a significant weight loss, close to 4 %, was
observed for the hybrid(25) monolithic silica from 400 °C to 600 °C by TG. This result is in
accord with the previous reports obtained by TG and DTA [116, 118].
In this thesis, a heat treatment at 330 °C was carried out for the monolithic silica rods and
capillary columns. As shown in Fig. 6.12(b), it is obvious that methyl groups in the hybrid
monolithic silica are stable under atmospheric conditions up to 400 °C. Therefore, this proves
that the heat treatment at 330 °C is proper for methyl groups to remain in the hybrid materials.
Furthermore, the results obtained by IR adsorption spectroscopy support this conclusion
because of the detection of the characteristic adsorption bands due to Si-CH3 groups in the
hybrid silica materials (see Fig. 6.10 and Fig. 6.11).
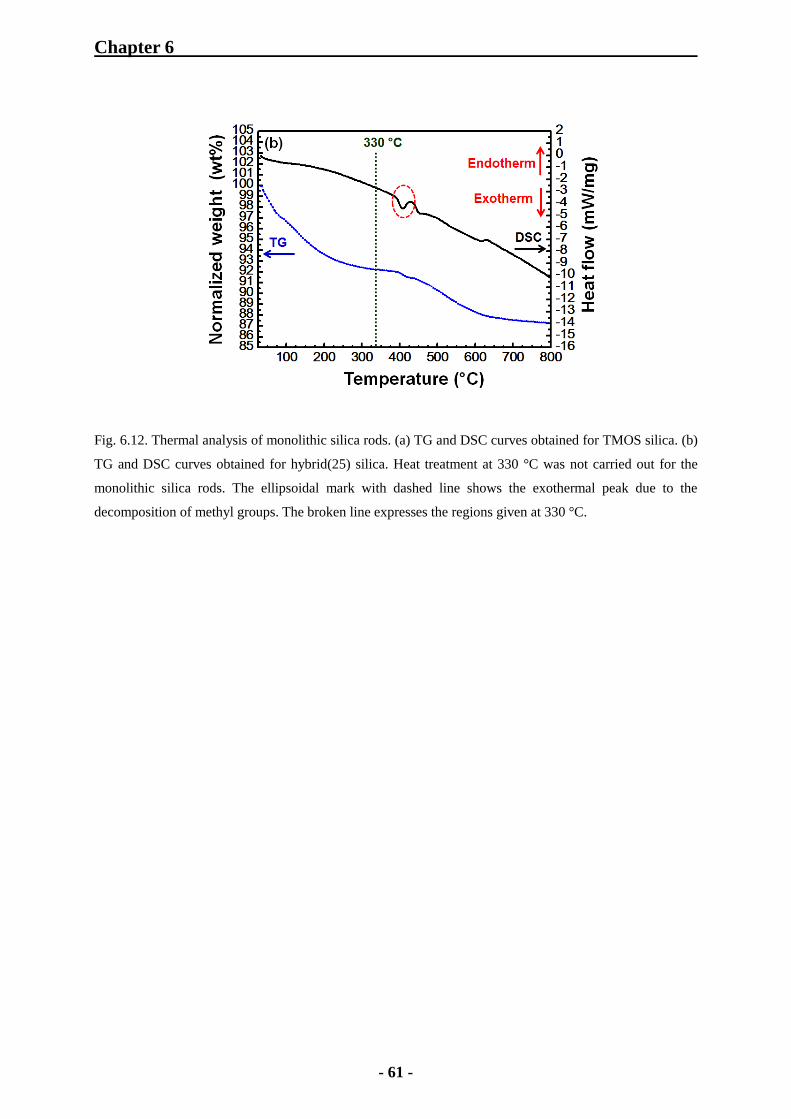
Chapter 6
- 61 -
Fig. 6.12. Thermal analysis of monolithic silica rods. (a) TG and DSC curves obtained for TMOS silica. (b)
TG and DSC curves obtained for hybrid(25) silica. Heat treatment at 330 °C was not carried out for the
monolithic silica rods. The ellipsoidal mark with dashed line shows the exothermal peak due to the
decomposition of methyl groups. The broken line expresses the regions given at 330 °C.
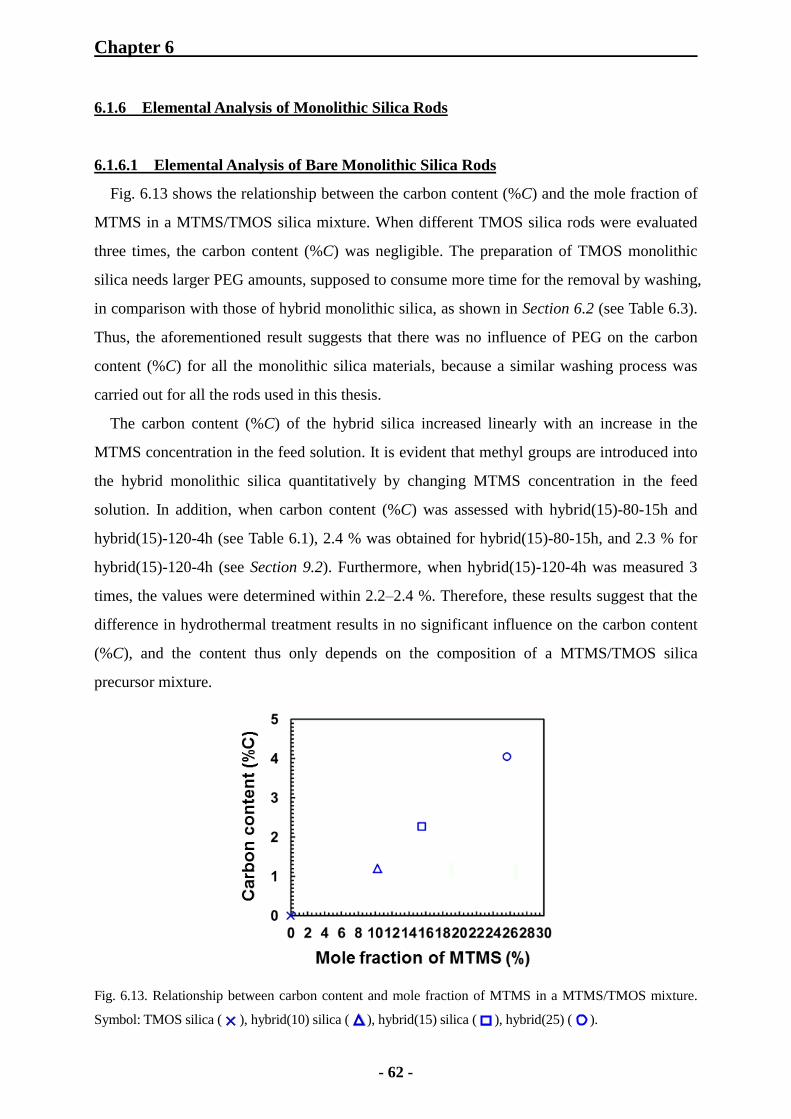
Chapter 6
- 62 -
6.1.6 Elemental Analysis of Monolithic Silica Rods
6.1.6.1 Elemental Analysis of Bare Monolithic Silica Rods
Fig. 6.13 shows the relationship between the carbon content (%C) and the mole fraction of
MTMS in a MTMS/TMOS silica mixture. When different TMOS silica rods were evaluated
three times, the carbon content (%C) was negligible. The preparation of TMOS monolithic
silica needs larger PEG amounts, supposed to consume more time for the removal by washing,
in comparison with those of hybrid monolithic silica, as shown in Section 6.2 (see Table 6.3).
Thus, the aforementioned result suggests that there was no influence of PEG on the carbon
content (%C) for all the monolithic silica materials, because a similar washing process was
carried out for all the rods used in this thesis.
The carbon content (%C) of the hybrid silica increased linearly with an increase in the
MTMS concentration in the feed solution. It is evident that methyl groups are introduced into
the hybrid monolithic silica quantitatively by changing MTMS concentration in the feed
solution. In addition, when carbon content (%C) was assessed with hybrid(15)-80-15h and
hybrid(15)-120-4h (see Table 6.1), 2.4 % was obtained for hybrid(15)-80-15h, and 2.3 % for
hybrid(15)-120-4h (see Section 9.2). Furthermore, when hybrid(15)-120-4h was measured 3
times, the values were determined within 2.2–2.4 %. Therefore, these results suggest that the
difference in hydrothermal treatment results in no significant influence on the carbon content
(%C), and the content thus only depends on the composition of a MTMS/TMOS silica
precursor mixture.
Fig. 6.13. Relationship between carbon content and mole fraction of MTMS in a MTMS/TMOS mixture.
Symbol: TMOS silica ( ), hybrid(10) silica ( ), hybrid(15) silica ( ), hybrid(25) ( ).

Chapter 6
- 63 -
6.1.6.2 Elemental Analysis of ODS-Modified Monolithic Silica Rods
In Fig. 6.14, the carbon content (%C) of TMOS monolithic silica rods, modified with
ODS-DEA in toluene, is plotted against the reaction time. An increase in carbon content (%C)
corresponds to a larger amount of ODS groups which were introduced on the silica surface. It
can be recognized that the carbon content (%C) becomes higher with extending the reaction
time. The difference in carbon content (%C) between ODS-modified TMOS-80-15h and
ODS-modified TMOS-120-3h silica rods can be explained by the difference in surface area of
bare monolithic silica. The surface area of TMOS-80-15h showed 668 m2/g, while that of
TMOS-120-3h was 352 m2/g, because the different hydrothermal treatments were performed,
as shown in the preceding section (see Table 6.1). In general, it is established that higher
surface area can contribute to larger content of functional groups grafted on silica surface by
chemical surface modification [2].
At longer reaction time than 24 hours, it is seen that the curves of the carbon content almost
reach the plateaus without relation to the difference in mesopore size. Therefore, this suggests
that the octadecylsilylation of monolithic silica at 65 °C for longer time than 24 hours is
adequate to introduce ODS groups into the monolithic silica.
Fig. 6.14. Plots of carbon content against reaction time with ODS-modified TMOS monolithic silica rods.
Symbols: ODS-modified TMOS-80-15h silica rod (80 Å, 668 m2/g) ( ), ODS-modified TMOS-120-4h
silica rod (154 Å, 352 m2/g) ( ).

Chapter 6
- 64 -
Furthermore, octadecylsilylation was carried out for hybrid monolithic silica rods as well as
TMOS monolithic silica rods. Surface coverage (μmol/m2) of ODS groups in ODS-modified
monolithic silica was calculated by Eq. (6.1) [2]:
12
1
100
%112100
%
nC
MWCSAnC
Cχ (6.1)
where %C is the carbon content obtained by elemental analysis, SA is the BET surface area of
the bare silica (the parent silica), MW is the molecular weight of the attached ligand by
modification, and nC is the number of carbon atoms in the functional group (For
ODS-modified hybrid monolithic silica, the estimation of carbon content (%C (ODS)) of the
ODS groups is shown in Section 9.2). Table 6.2 summarizes the information on ODS-modified
monolithic silica rods, provided by the nitrogen physisorption method and elemental analysis.
Table 6.2
Pore size, BET surface area, carbon content, and surface coverage determined for ODS-modified
monolithic silica rods.*
Silica rod Pore size a
(Å)
Surface area
(m2/g)
Carbon content b
(%C)
Surface coverage c
(μmol/m2)
TMOS-80-15h 80 668 24.6 2.25
TMOS-80-25h 82 582 22.7 2.31
TMOS-120-3h 154 352 17.2 2.61
Hybrid(15)-80-15h 67 746 23.8 (25.5) 1.92
Hybrid(15)-120-4h 154 380 15.8 (17.6) 2.17
Hybrid(25)-120-4h 114 551 17.7 (20.8) 1.73
* All the silica rods were modified with ODS-DEA in toluene at 65 °C for longer than 24 hours, as shown
in Section 4.5.
a The pore size of bare silica rods were determined by the BJH method (desorption).
b The carbon content of ODS groups (%C (ODS)) was estimated and the number in parentheses shows total
carbon content (%C (total)) from the ODS groups and methyl groups in a hybrid monolithic silica material.
c Surface coverage of ODS groups.
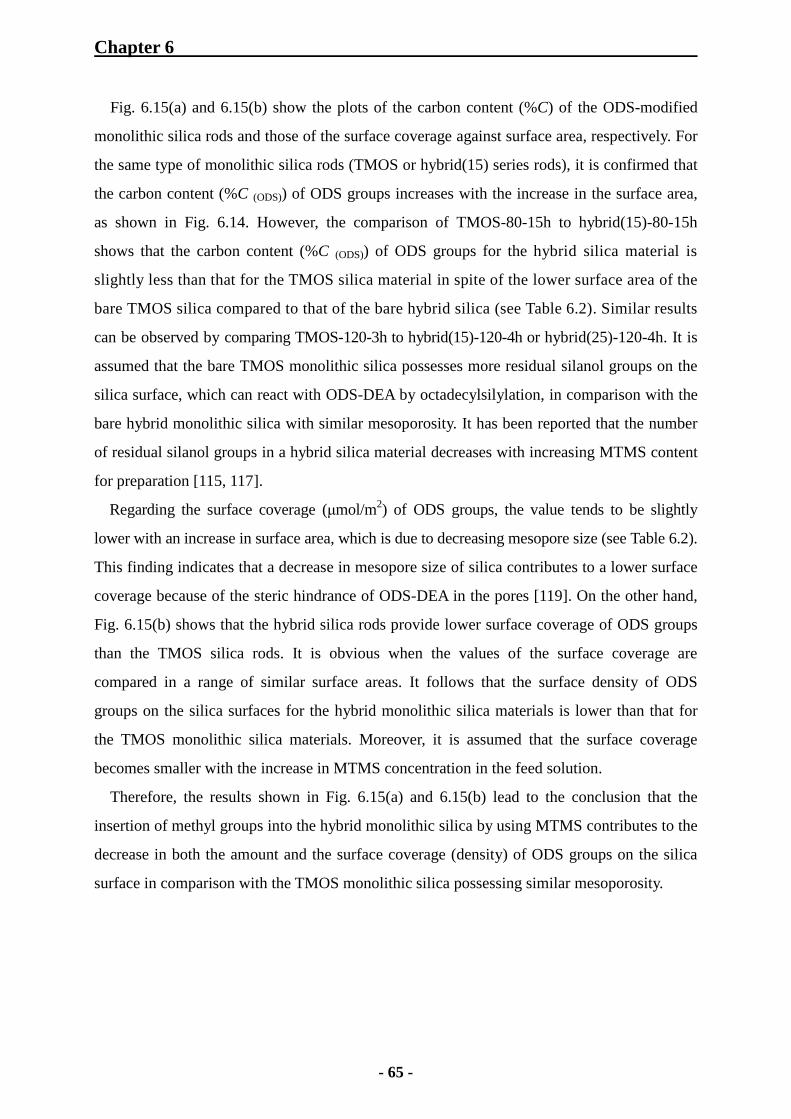
Chapter 6
- 65 -
Fig. 6.15(a) and 6.15(b) show the plots of the carbon content (%C) of the ODS-modified
monolithic silica rods and those of the surface coverage against surface area, respectively. For
the same type of monolithic silica rods (TMOS or hybrid(15) series rods), it is confirmed that
the carbon content (%C (ODS)) of ODS groups increases with the increase in the surface area,
as shown in Fig. 6.14. However, the comparison of TMOS-80-15h to hybrid(15)-80-15h
shows that the carbon content (%C (ODS)) of ODS groups for the hybrid silica material is
slightly less than that for the TMOS silica material in spite of the lower surface area of the
bare TMOS silica compared to that of the bare hybrid silica (see Table 6.2). Similar results
can be observed by comparing TMOS-120-3h to hybrid(15)-120-4h or hybrid(25)-120-4h. It is
assumed that the bare TMOS monolithic silica possesses more residual silanol groups on the
silica surface, which can react with ODS-DEA by octadecylsilylation, in comparison with the
bare hybrid monolithic silica with similar mesoporosity. It has been reported that the number
of residual silanol groups in a hybrid silica material decreases with increasing MTMS content
for preparation [115, 117].
Regarding the surface coverage (μmol/m2) of ODS groups, the value tends to be slightly
lower with an increase in surface area, which is due to decreasing mesopore size (see Table 6.2).
This finding indicates that a decrease in mesopore size of silica contributes to a lower surface
coverage because of the steric hindrance of ODS-DEA in the pores [119]. On the other hand,
Fig. 6.15(b) shows that the hybrid silica rods provide lower surface coverage of ODS groups
than the TMOS silica rods. It is obvious when the values of the surface coverage are
compared in a range of similar surface areas. It follows that the surface density of ODS
groups on the silica surfaces for the hybrid monolithic silica materials is lower than that for
the TMOS monolithic silica materials. Moreover, it is assumed that the surface coverage
becomes smaller with the increase in MTMS concentration in the feed solution.
Therefore, the results shown in Fig. 6.15(a) and 6.15(b) lead to the conclusion that the
insertion of methyl groups into the hybrid monolithic silica by using MTMS contributes to the
decrease in both the amount and the surface coverage (density) of ODS groups on the silica
surface in comparison with the TMOS monolithic silica possessing similar mesoporosity.
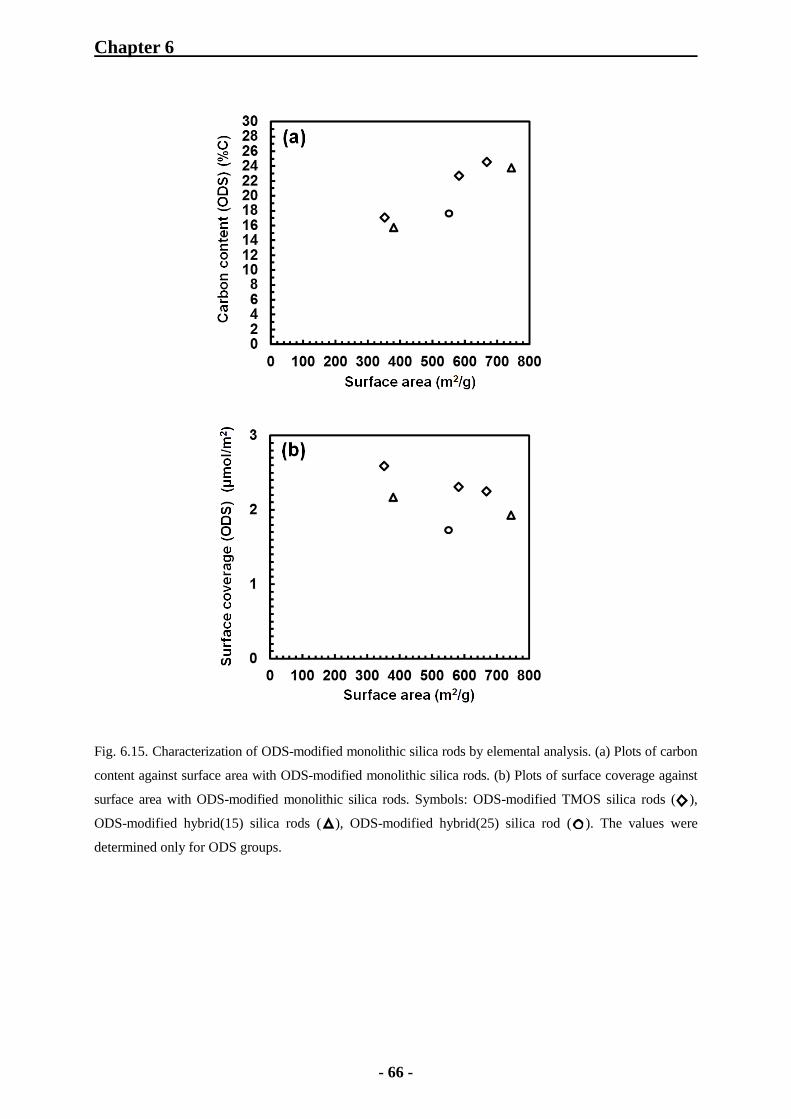
Chapter 6
- 66 -
Fig. 6.15. Characterization of ODS-modified monolithic silica rods by elemental analysis. (a) Plots of carbon
content against surface area with ODS-modified monolithic silica rods. (b) Plots of surface coverage against
surface area with ODS-modified monolithic silica rods. Symbols: ODS-modified TMOS silica rods ( ),
ODS-modified hybrid(15) silica rods ( ), ODS-modified hybrid(25) silica rod ( ). The values were
determined only for ODS groups.
Chapter 6
- 67 -
6.1.7 Conclusions
(1) SEM observation and mercury intrusion porosimetry
The results obtained by SEM and mercury intrusion porosimetry demonstrated that the
macropore size (or domain size) can be controlled by changing the PEG amount, as shown in
previous reports. It was suggested that it is harder to control the structural homogeneity of
monolithic silica with a decrease in the macropore size. Moreover, comparing the TMOS
silica rod to the hybrid monolithic silica rods showed that structural homogeneity decreases
with the increase in MTMS concentration in the feed solution.
(2) Nitorogen physisorption method
It was confirmed that urea can decompose to result in basic conditions for forming
mesopores in the monolithic silica by heating. The additional hydrothermal treatment at
120 °C for 3 or 4 hours resulted in an increased mesopore size and significantly wider PSD
for both the TMOS and hybrid silica rods. Furthermore, it was suggested that it is more
difficult for hybrid monolithic silica to form well-defined mesopores in comparison with
those in TMOS monolithic silica, because it is harder to eliminate small pores with the
increase in MTMS concentration in the feed solution.
(3) IR adsorption spectroscopy
Using the KBr tablet method revealed that the intensity of the specific adsorption bands due
to methyl groups (-CH3) increases with the increase in MTMS concentration in the feed solution,
showing that a higher content of methyl groups can be introduced into the hybrid monolithic
silica. In addition, the result obtained by the ATR method indicated that the hydrophobicity of
hybrid silica increases with increasing the content of methyl groups (-CH3) provided by
MTMS.
(4) Thermal analysis
It was confirmed that methyl groups in the hybrid monolithic silica are stable up to 400 °C,
proving that the heat treatment at 330 °C is appropriate for the monolithic silica.
(5) Elemental analysis
The results of the measurements showed that the carbon content (%C) of methyl groups in
the bare hybrid silica increases with an enhanced MTMS concentration in the feed solution.
Chapter 6
- 68 -
This suggested that methyl groups can be introduced into the hybrid monolithic silica
quantitatively by changing the MTMS concentration.
For ODS-modified monolithic silica, the difference in carbon content (%C (ODS)) of ODS groups
was found to correspond to the difference in surface area, caused by changing mesopore size. The
comparison of ODS-modified TMOS and hybrid monolithic silica revealed that the carbon
content (%C (ODS)) of ODS groups in a hybrid silica rod was slightly less than the content for a
TMOS silica rod possessing a slightly lower surface area than that of the hybrid silica. It was
assumed that the TMOS monolithic silica provides more residual silanol groups on the surface,
which can react with ODS-DEA by octadecylsilylation, than the hybrid monolithic silica with
similar mesoporosity. Regarding the surface coverage (density) of ODS groups on silica
surface, it was suggested that the insertion of methyl groups into the hybrid monolithic silica
by using MTMS contributes to a decrease in the surface coverage.
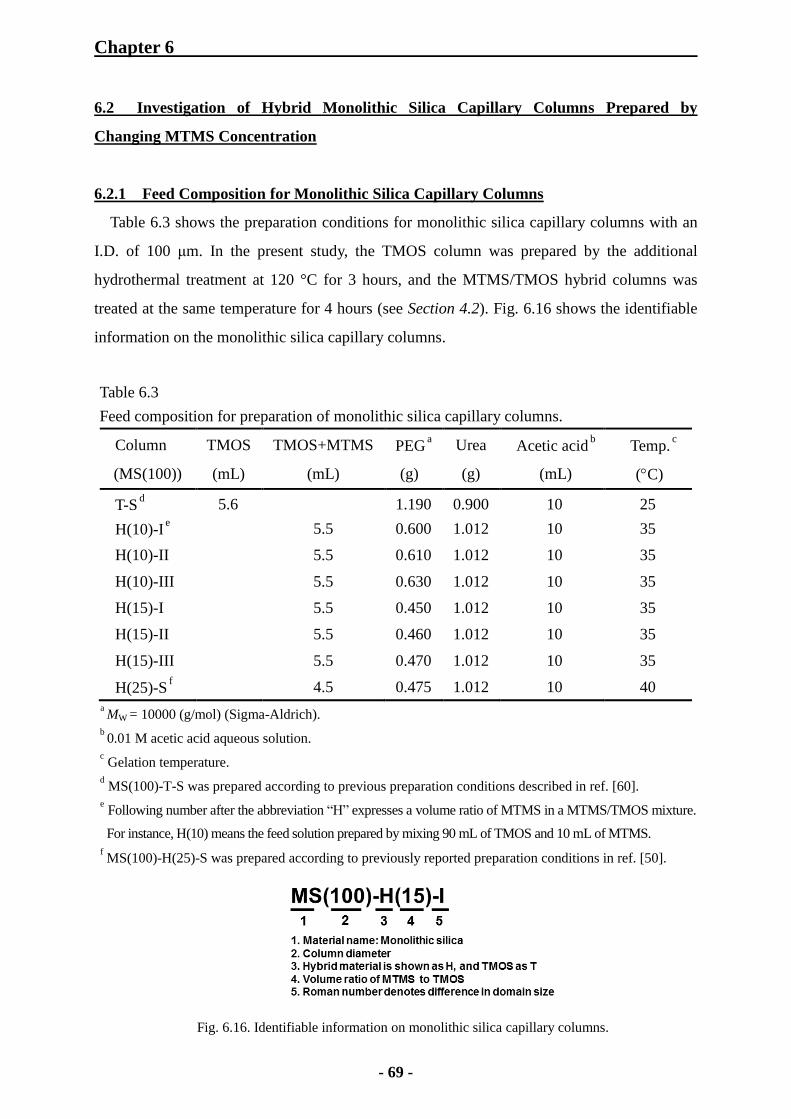
Chapter 6
- 69 -
6.2 Investigation of Hybrid Monolithic Silica Capillary Columns Prepared by
Changing MTMS Concentration
6.2.1 Feed Composition for Monolithic Silica Capillary Columns
Table 6.3 shows the preparation conditions for monolithic silica capillary columns with an
I.D. of 100 μm. In the present study, the TMOS column was prepared by the additional
hydrothermal treatment at 120 °C for 3 hours, and the MTMS/TMOS hybrid columns was
treated at the same temperature for 4 hours (see Section 4.2). Fig. 6.16 shows the identifiable
information on the monolithic silica capillary columns.
Table 6.3
Feed composition for preparation of monolithic silica capillary columns.
Column
(MS(100))
TMOS
(mL)
TMOS+MTMS
(mL)
PEG a
(g)
Urea
(g)
Acetic acid b
(mL)
Temp. c
(C)
T-S d 5.6 1.190 0.900
10 25
H(10)-I e 5.5 0.600 1.012
10 35
H(10)-II
5.5 0.610 1.012 10 35
H(10)-III 5.5 0.630 1.012 10 35
H(15)-I 5.5 0.450 1.012 10 35
H(15)-II 5.5 0.460 1.012 10 35
H(15)-III 5.5 0.470 1.012 10 35
H(25)-S f 4.5 0.475 1.012
10 40
a MW
= 10000 (g/mol) (Sigma-Aldrich).
b 0.01 M acetic acid aqueous solution.
c Gelation temperature.
d MS(100)-T-S was prepared according to previous preparation conditions described in ref. [60].
e Following number after the abbreviation “H” expresses a volume ratio of MTMS in a MTMS/TMOS mixture.
For instance, H(10) means the feed solution prepared by mixing 90 mL of TMOS and 10 mL of MTMS.
f MS(100)-H(25)-S was prepared according to previously reported preparation conditions in ref. [50].
Fig. 6.16. Identifiable information on monolithic silica capillary columns.
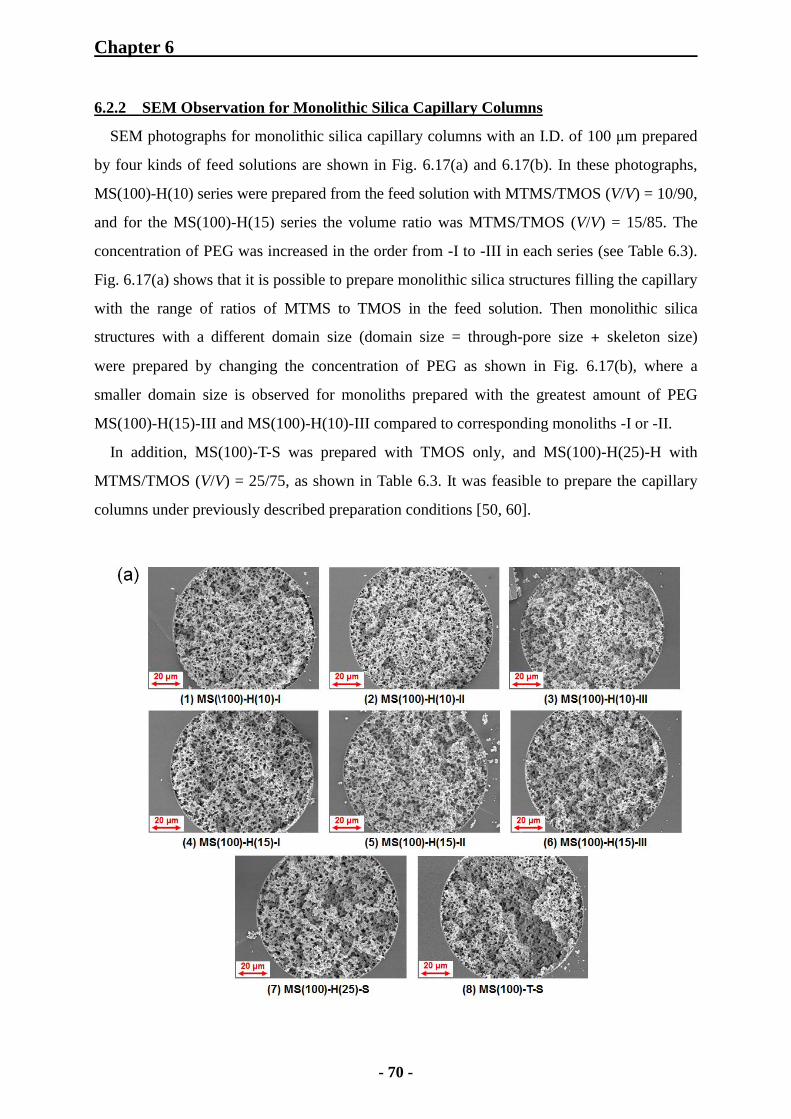
Chapter 6
- 70 -
6.2.2 SEM Observation for Monolithic Silica Capillary Columns
SEM photographs for monolithic silica capillary columns with an I.D. of 100 μm prepared
by four kinds of feed solutions are shown in Fig. 6.17(a) and 6.17(b). In these photographs,
MS(100)-H(10) series were prepared from the feed solution with MTMS/TMOS (V/V) = 10/90,
and for the MS(100)-H(15) series the volume ratio was MTMS/TMOS (V/V) = 15/85. The
concentration of PEG was increased in the order from -I to -III in each series (see Table 6.3).
Fig. 6.17(a) shows that it is possible to prepare monolithic silica structures filling the capillary
with the range of ratios of MTMS to TMOS in the feed solution. Then monolithic silica
structures with a different domain size (domain size = through-pore size + skeleton size)
were prepared by changing the concentration of PEG as shown in Fig. 6.17(b), where a
smaller domain size is observed for monoliths prepared with the greatest amount of PEG
MS(100)-H(15)-III and MS(100)-H(10)-III compared to corresponding monoliths -I or -II.
In addition, MS(100)-T-S was prepared with TMOS only, and MS(100)-H(25)-H with
MTMS/TMOS (V/V) = 25/75, as shown in Table 6.3. It was feasible to prepare the capillary
columns under previously described preparation conditions [50, 60].

Chapter 6
- 71 -
Fig. 6.17. Scanning electron micrographs of monolithic silica prepared from TMOS and MTMS in a
capillary with an I.D. of 100 μm. (a) Scale bars correspond to 20 μm (×1000). (b) Scale bars correspond to
10 μm (×3000). Column: (1)‒(3) MS(100)-H(10)-I‒III, (4)–(6) MS(100)-H(15)-I–III (7) MS(100)-H(25)-S,
(8) MS(100)-T-S. The smaller scale bar shown in each photograph corresponds to the domain size of the
monolithic silica.
Table 6.4 lists the domain size calculated from SEM photographs and the permeability in
methanol/water (V/V) = 80/20 mobile phase at 30 °C for capillary columns after octadecylsilylation.
The permeability (B0) based on Darcy’s law was expressed by Eq. (6.2) [2, 61, 74]:
P
LηuεB
Δ
t0 (6.2)
where u is the linear velocity, η the viscosity of a mobile phase, L the column length, and
tthe total porosity, respectively. With respect to the monolithic silica capillary columns
under study, the parameters in Eq. (6.2) can be regarded as constant at a regular linear velocity
except for column pressure drop P and length L, because the total porosity after
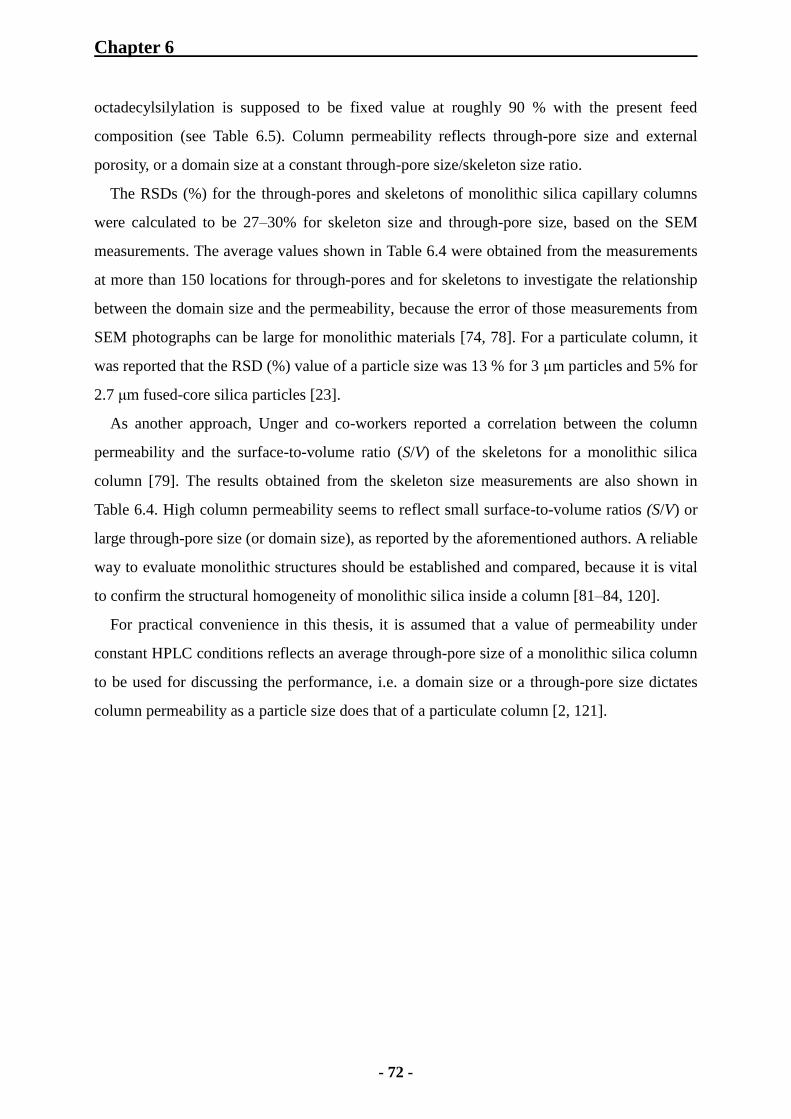
Chapter 6
- 72 -
octadecylsilylation is supposed to be fixed value at roughly 90 % with the present feed
composition (see Table 6.5). Column permeability reflects through-pore size and external
porosity, or a domain size at a constant through-pore size/skeleton size ratio.
The RSDs (%) for the through-pores and skeletons of monolithic silica capillary columns
were calculated to be 27‒30% for skeleton size and through-pore size, based on the SEM
measurements. The average values shown in Table 6.4 were obtained from the measurements
at more than 150 locations for through-pores and for skeletons to investigate the relationship
between the domain size and the permeability, because the error of those measurements from
SEM photographs can be large for monolithic materials [74, 78]. For a particulate column, it
was reported that the RSD (%) value of a particle size was 13 % for 3 μm particles and 5% for
2.7 μm fused-core silica particles [23].
As another approach, Unger and co-workers reported a correlation between the column
permeability and the surface-to-volume ratio (S/V) of the skeletons for a monolithic silica
column [79]. The results obtained from the skeleton size measurements are also shown in
Table 6.4. High column permeability seems to reflect small surface-to-volume ratios (S/V) or
large through-pore size (or domain size), as reported by the aforementioned authors. A reliable
way to evaluate monolithic structures should be established and compared, because it is vital
to confirm the structural homogeneity of monolithic silica inside a column [81‒84, 120].
For practical convenience in this thesis, it is assumed that a value of permeability under
constant HPLC conditions reflects an average through-pore size of a monolithic silica column
to be used for discussing the performance, i.e. a domain size or a through-pore size dictates
column permeability as a particle size does that of a particulate column [2, 121].
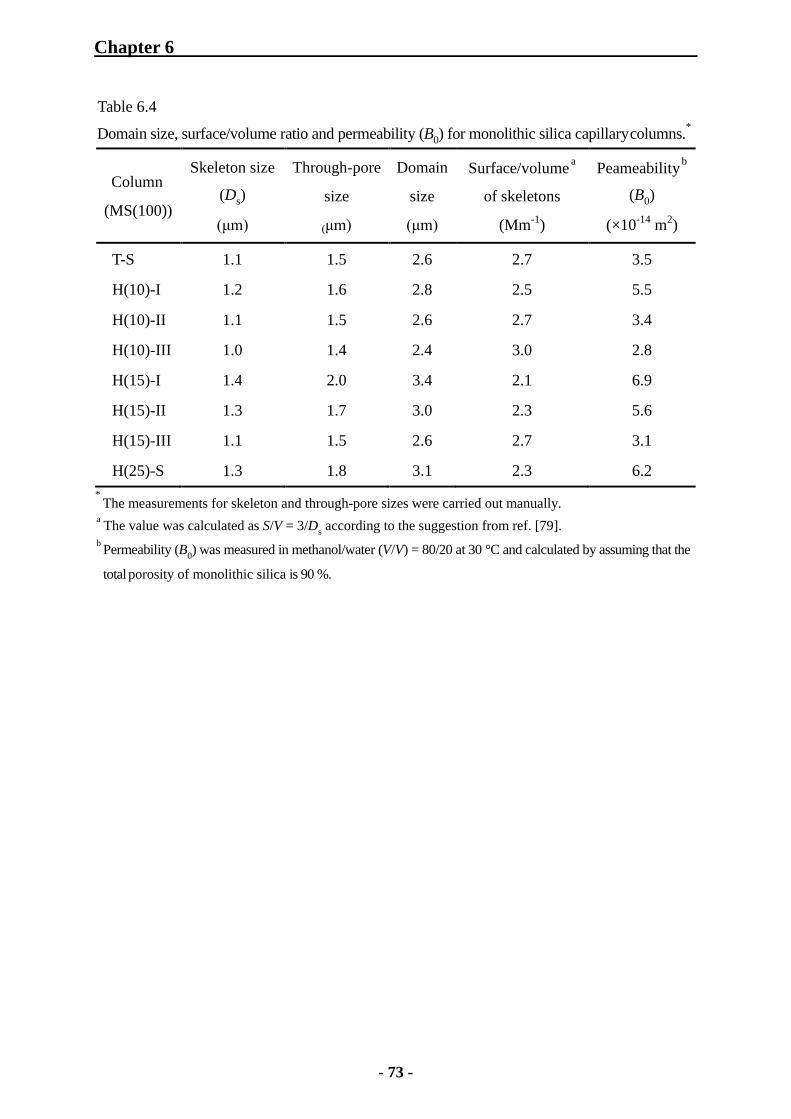
Chapter 6
- 73 -
Table 6.4
Domain size, surface/volume ratio and permeability (B0) for monolithic silica capillary columns.*
Column
(MS(100))
Skeleton size
(Ds)
(μm)
Through-pore
size
(μm)
Domain
size
(μm)
Surface/volume a
of skeletons
(Mm-1
)
Peameability b
(B0)
(×10-14
m2)
T-S
1.1 1.5 2.6 2.7 3.5
H(10)-I 1.2 1.6 2.8 2.5 5.5
H(10)-II
1.1 1.5 2.6 2.7 3.4
H(10)-III 1.0 1.4 2.4 3.0 2.8
H(15)-I 1.4 2.0 3.4 2.1 6.9
H(15)-II 1.3 1.7 3.0 2.3 5.6
H(15)-III 1.1 1.5 2.6 2.7 3.1
H(25)-S 1.3 1.8 3.1 2.3 6.2
* The measurements for skeleton and through-pore sizes were carried out manually.
a The value was calculated as S/V = 3/D
s according to the suggestion from ref. [79]. b
Permeability (B0) was measured in methanol/water (V/V) = 80/20 at 30 °C and calculated by assuming that the
total
porosity of monolithic silica is 90 %.

Chapter 6
- 74 -
6.2.3 Characterization of Monolithic Silica Capillary Columns by SEC
As shown in Fig. 6.18, the relationship between elution volume in THF and molecular
weight of polystyrene standard (PSS) sample was observed for the non-modified and modified
columns by the octadecylsilylation, MS(100)-H(10)-I, MS(100)-H(15)-II, and MS(100)-H(25)-S.
Although the total porosity found was similar (ca. 93%) for MS(100)-H(10)-I and MS(100)-H-
(15)-II, that of MS(100)-H(25)-S was found to be ca. 92% despite the lower silane concentrations
in the feed solution (Note that this result implies the deviation of column diameter. The
calculation of column porosity is carried out by assuming a column diameter of 100 μm, but
there is a certain deviation in the diameter caused by the manufacturing process. However, it
should be emphasized that this deviation is negligible for the interpretation of the results in
this thesis, because the total porosity (absolute value) of a monolithic silica capillary column
is extremely high (> 90 %)). The results obtained from these relationships are summarized in
Table 6.5, including the results of TMOS column used in the previous study [60].
Fig. 6.18. Selective permeation of polystyrene standard samples in THF with monolithic silica columns.
Symbol: diamonds: MS(100)-H(10)-I ( ,
), triangles: MS(100)-H(15)-II ( ,
), and squares:
MS(100)-H(25)-S (
,
). Solid symbols stand for bare silica columns, and open symbols for
ODS-modified monolithic silica columns.
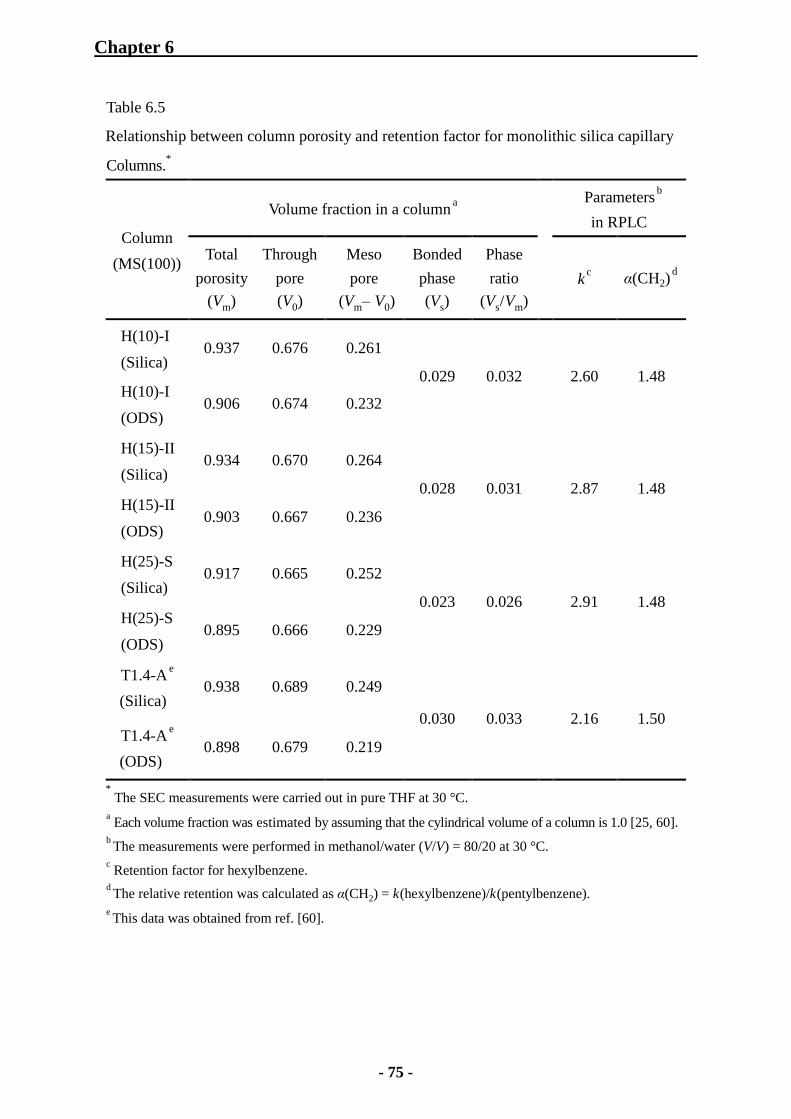
Chapter 6
- 75 -
Table 6.5
Relationship between column porosity and retention factor for monolithic silica capillary
Columns.
*
Column
(MS(100))
Volume fraction in a column a
Parameters b
in RPLC
Total
porosity
(Vm)
Through
pore
(V0)
Meso
pore (Vm‒ V0)
Bonded
phase
(Vs)
Phase
ratio
(Vs/Vm)
k c α(CH2)
d
H(10)-I
(Silica) 0.937 0.676 0.261
0.029 0.032
2.60 1.48 H(10)-I
(ODS) 0.906 0.674 0.232
H(15)-II
(Silica) 0.934 0.670 0.264
0.028 0.031
2.87 1.48 H(15)-II
(ODS) 0.903 0.667 0.236
H(25)-S
(Silica) 0.917 0.665 0.252
0.023 0.026
2.91 1.48 H(25)-S
(ODS) 0.895 0.666 0.229
T1.4-A e
(Silica) 0.938 0.689 0.249
0.030 0.033
2.16 1.50 T1.4-A
e
(ODS) 0.898 0.679 0.219
* The SEC measurements were carried out in pure THF at 30 °C.
a Each volume fraction was estimated by assuming that the cylindrical volume of a column is 1.0 [25, 60].
b The measurements were performed in methanol/water (V/V) = 80/20 at 30 °C.
c Retention factor for hexylbenzene.
d The relative retention was calculated as α(CH2) = k(hexylbenzene)/k(pentylbenzene).
e This data was obtained from ref. [60].

Chapter 6
- 76 -
The difference in mesopore volume before and after ODS modification can be regarded as
the volume occupied by the ODS moieties inside a column. The phase ratio (Vs/Vm) was
calculated by dividing the volume of the stationary phase by the total pore volume obtained
from the elution volume of benzene, as represented in Section 2.1 (see Eq. (2.2)).
In Table 6.5, it can be recognized that the volume occupied by ODS groups (the amount of
stationary phase provided by ODS groups) depends on silane concentration in the feed
solution. For example, MS(100)-H(25)-S was prepared with a lower silane concentration
compared to the other columns (see Table 6.3). The amount of the bonded stationary phase
was smaller than those of the other columns, presumably because the amount of silanol
groups on the silica surface could be smaller, attributed to the smaller amount of silica in the
column [60]. It is seen that the amount of bonded phase moieties provide no strong dependence
on the MTMS concentrations in the feed solution when the three other columns are compared
except for MS(100)-H(25)-S.
Moreover, the results obtained by elemental analysis of ODS-modified monolithic silica rods,
which are shown in Section 6.1 (see Table 6.2), support the interpretation about ODS-modified
capillary columns. Regarding the ODS-modified silica rods prepared by similar hydrothermal
treatment for the capillary columns, the carbon content of ODS groups was 17.2 % for
ODS-modified TMOS-120-3h, 15.8 % for ODS-modified hybrid(15)-120-4h, and 17.7 % for
ODS-modified hybrid(25)-120-4h. As discussed above, the influence of total silane
concentration in the feed solution should be taken into account, because it is directly related to
the amount of the resulting monolithic silica in the column [60]. The results obtained by
calculating molar quantities of silica precursors in 10 mL of a 0.01M acetic acid aqueous
solution show 3.80 × 10⁻²
mole under the preparation conditions for TMOS-120-3h, 3.75 ×
10-2
mole for hybrid(15)-120-4h, and 3.05 × 10⁻²
mole for hybrid(25)-120-4h. The molar
quantities of silica precursor in the feed solution are comparable between TMOS-120-3h and
hybrid(15)-120-4h, but the quantity calculated for hybrid(25)-120-4h is about 80 % compared
to that for the TMOS silica. Thus, the carbon content (%C) of ODS groups for
hybrid(25)-120-4h can be normalized from 17.7 % to 14.2 % by assuming that the molar
quantity of silica precursor in the feed solution, which is supposed to correspond to the
amount of silica in a column, is proportional to the carbon content of ODS groups (the amount
of ODS groups). The comparison of the ODS-modified silica rods indicates that the carbon
content (%C) of ODS groups for hybrid(15)-120-4h corresponds to about 92 %, and that for
hybrid(25)-120-4h does to about 83 % in relation to the value for TMOS-120-3h.
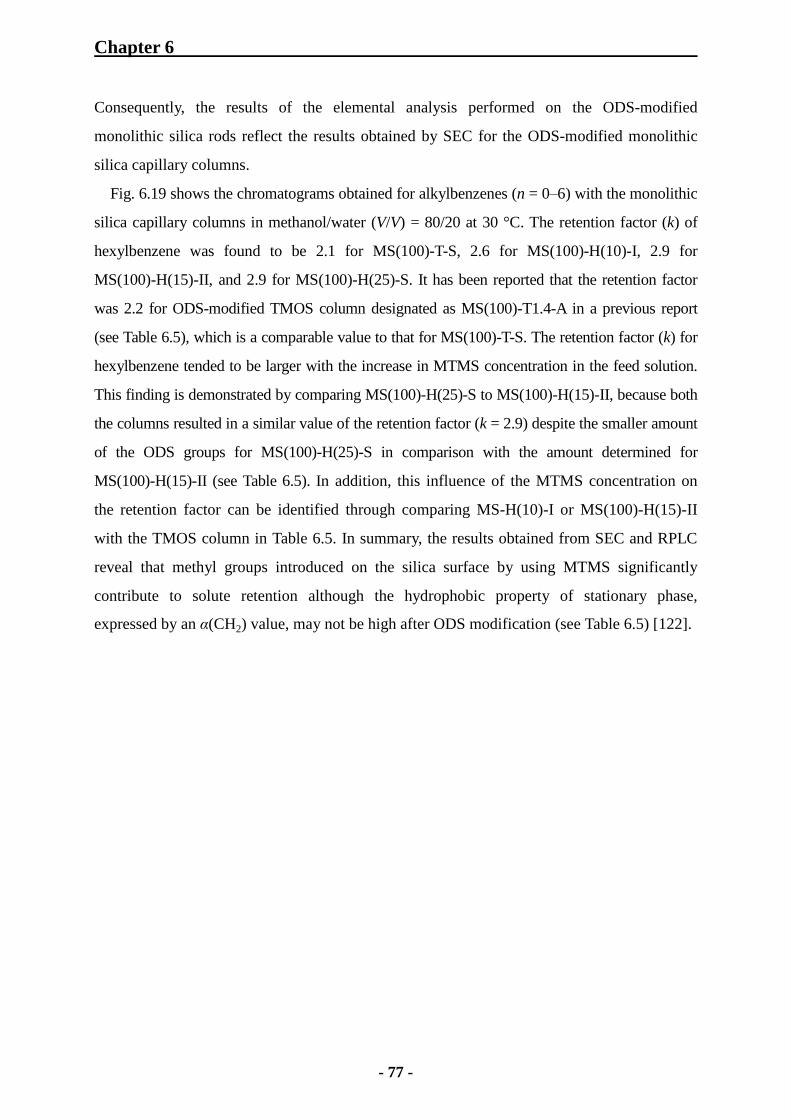
Chapter 6
- 77 -
Consequently, the results of the elemental analysis performed on the ODS-modified
monolithic silica rods reflect the results obtained by SEC for the ODS-modified monolithic
silica capillary columns.
Fig. 6.19 shows the chromatograms obtained for alkylbenzenes (n = 0–6) with the monolithic
silica capillary columns in methanol/water (V/V) = 80/20 at 30 °C. The retention factor (k) of
hexylbenzene was found to be 2.1 for MS(100)-T-S, 2.6 for MS(100)-H(10)-I, 2.9 for
MS(100)-H(15)-II, and 2.9 for MS(100)-H(25)-S. It has been reported that the retention factor
was 2.2 for ODS-modified TMOS column designated as MS(100)-T1.4-A in a previous report
(see Table 6.5), which is a comparable value to that for MS(100)-T-S. The retention factor (k) for
hexylbenzene tended to be larger with the increase in MTMS concentration in the feed solution.
This finding is demonstrated by comparing MS(100)-H(25)-S to MS(100)-H(15)-II, because both
the columns resulted in a similar value of the retention factor (k = 2.9) despite the smaller amount
of the ODS groups for MS(100)-H(25)-S in comparison with the amount determined for
MS(100)-H(15)-II (see Table 6.5). In addition, this influence of the MTMS concentration on
the retention factor can be identified through comparing MS-H(10)-I or MS(100)-H(15)-II
with the TMOS column in Table 6.5. In summary, the results obtained from SEC and RPLC
reveal that methyl groups introduced on the silica surface by using MTMS significantly
contribute to solute retention although the hydrophobic property of stationary phase,
expressed by an α(CH2) value, may not be high after ODS modification (see Table 6.5) [122].
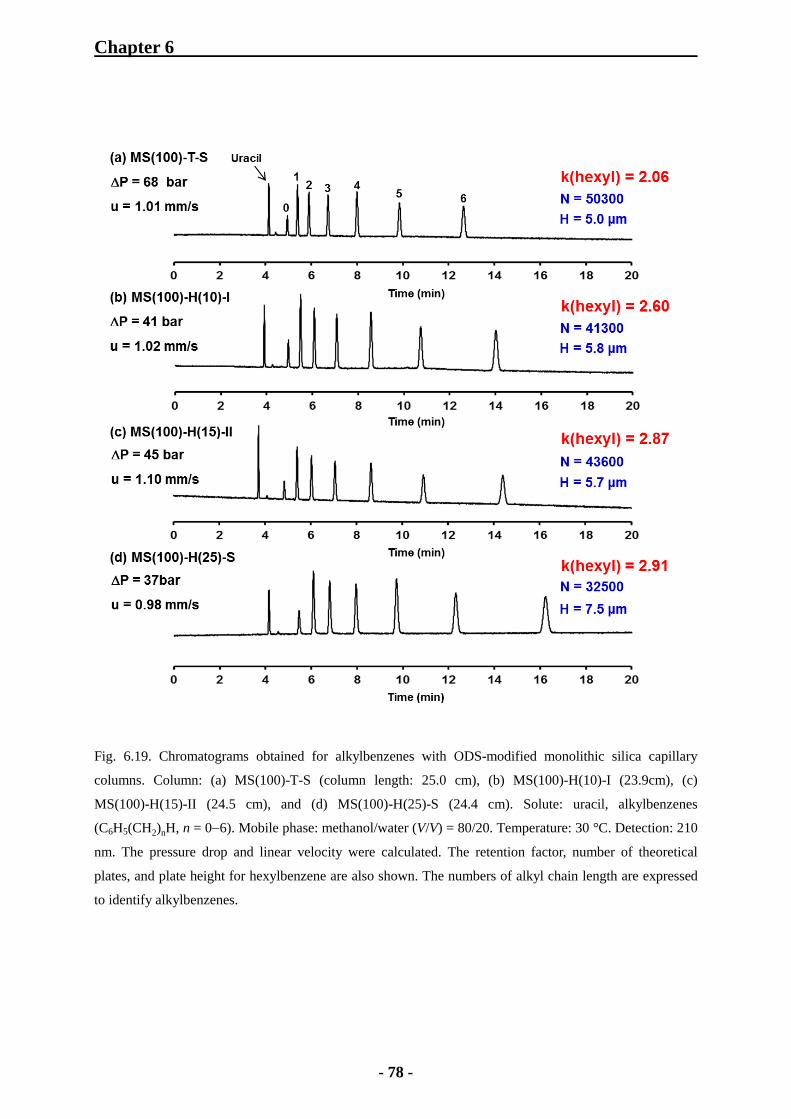
Chapter 6
- 78 -
Fig. 6.19. Chromatograms obtained for alkylbenzenes with ODS-modified monolithic silica capillary
columns. Column: (a) MS(100)-T-S (column length: 25.0 cm), (b) MS(100)-H(10)-I (23.9cm), (c)
MS(100)-H(15)-II (24.5 cm), and (d) MS(100)-H(25)-S (24.4 cm). Solute: uracil, alkylbenzenes
(C6H5(CH2)nH, n = 06). Mobile phase: methanol/water (V/V) = 80/20. Temperature: 30 °C. Detection: 210
nm. The pressure drop and linear velocity were calculated. The retention factor, number of theoretical
plates, and plate height for hexylbenzene are also shown. The numbers of alkyl chain length are expressed
to identify alkylbenzenes.
Chapter 6
- 79 -
6.2.4 Steric Selectivity for o-Terphenyl and Triphenylene with Monolithic Silica Columns
It has been reported that ODS columns show steric selectivity for planar compounds such
as PAHs compared to a bulky aromatic compound of similar hydrophobic property [123, 124],
and that the difference in the selectivity between a TMOS and hybrid monolithic silica
column is related to a presence of methyl group on the silica surface [125]. In this thesis,
o-terphenyl (O) and triphenylene (T) were employed as solutes in order to investigate the
dependency of the steric selectivity α(T/O) on the difference in the surface concentration of
methyl groups, caused by the change in MTMS concentration for preparation.
Fig. 6.20 shows the chromatograms obtained for o-terphenyl (O) and triphenylene (T) in
methanol/water (V/V) = 80/20 at 30 °C. It is seen that the steric selectivity α(T/O) decreases
with the increase in the methyl group content in monolithic silica, based on the starting
MTMS concentrations in the feed solution. Generally, the steric selectivity α(T/O) is
dependent on surface coverage of ODS groups on silica surface and the length of alkyl chains
in the stationary phase [122, 124]. It has been reported that the selectivity tends to be larger
with longer alkyl chains, and becomes smaller by endcapping with trimethylchlorosilane
(TMS-Cl) [122].
Moreover, a small separation factor ascribed to the presence of methyl groups was reported
for a monolithic silica capillary column prepared from MTMS only [126]. For the hybrid
silica under study, it is confirmed that methyl groups in the material prepared from TMOS and
MTMS are stable below 400 °C, as shown by IR adsorption spectroscopy and thermal
analysis (see Section 6.1). In addition, the results obtained by elemental analysis and IR
adsorption spectroscopy indicate that the amount of methyl groups on the silica surface
increases with increasing the MTMS concentration. In this thesis, the heat treatment at 330 °C
was carried out for all the capillary columns, but trimethylsylilation or endcapping was not
performed for the columns used in the present examination. Therefore, in the case of the
hybrid columns, it is evident that the steric selectivity based on the ODS groups is reduced by
the presence of the methyl groups derived from MTMS. In other words, methyl groups
contribute to the retention of hydrophobic species, but not discriminate planar and nonplanar
compounds as TMS groups.
Furthermore, it was reported that an α(CH2) value for an ODS column tends to increase
after endcapping due to the conversion of silanol groups into TMS groups [122]. The amount
of ODS groups is nearly the same between MS(100)-T1.4-A, MS(100)-H(10)-I and
MS(100)-H(15)-II (see Table 6.5). The results shown in Table 6.5 suggest that the surface

Chapter 6
- 80 -
coverage (density) of ODS groups for the hybrid columns is lower than the coverage for the
TMOS column, because α(CH2) values for the hybrid columns possessing methyl groups tend
to be slightly smaller than that of the TMOS column. Regarding the surface coverage of ODS
groups for the corresponding monolithic silica rods, 2.6 μmol/m2 was obtained for
ODS-modified TMOS-120-3h, 2.2 μmol/m2 for ODS-modified hybrid(15)-120-4h, and 1.7
μmol/m2 for ODS-modified hybrid(25)-120-4h, as shown in Section 6.1 (see Table 6.2). It can
be recognized that the surface coverage becomes lower with the increase in MTMS
concentration in the feed solution. Consequently, it is assumed that the change in α(T/O) value
for the ODS-modified hybrid columns correlates with that in the surface coverage of ODS
groups, which is controlled by changing the MTMS concentration.
Table 6.6 shows the retention factor (k) for hexylbenzene, α(CH2), and α(T/O) for the all
monolithic silica capillary columns used in the present study. The results represent the
dependency of retention characteristics on the MTMS concentration in a feed solution rather
than the amount of ODS groups bonded.
Table 6.6
Retention factor (k), α(CH2), and α(T/O) for monolithic silica capillary columns.*
Column k(hexylbenzene) α(CH2) α(T/O) Temp. (°C)
MS(100)-T-S 2.06 1.49 1.54 29.8
MS(100)-H(10)-I 2.60 1.48 1.43 29.9
MS(100)-H(10)-II
2.53 1.48 1.40 29.9
MS(100)-H(10)-III 2.65 1.48 1.41 29.9
MS(100)-H(15)-I 2.91 1.49 1.40 29.8
MS(100)-H(15)-II 2.87 1.48 1.38 29.9
MS(100)-H(15)-III 2.84 1.48 1.39 29.9
MS(100)-H(25)-S 2.91 1.48 1.30 30.0
*α(CH2) value was calculated from k(hexylbenzene)/k(pentylbenzene), and α(T/O) value from
k(triphenylene)/k(o-terphenyl) in methanol/water (V/V) = 80/20 at 30 °C.
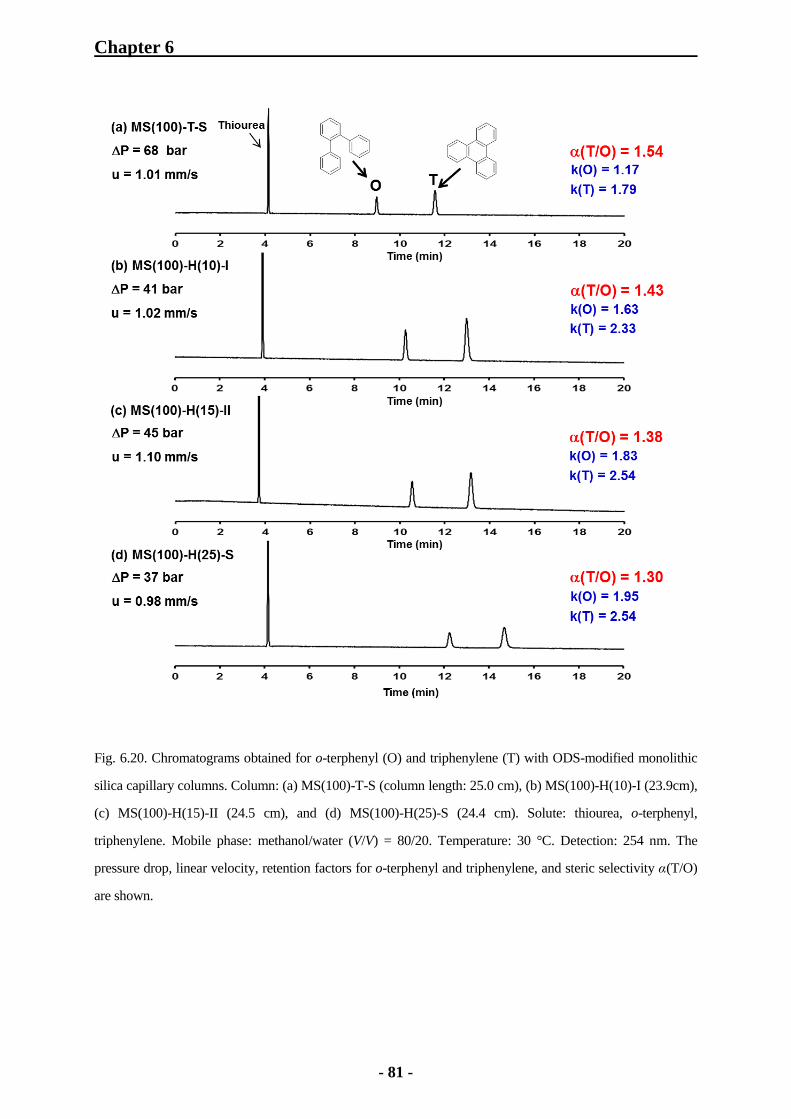
Chapter 6
- 81 -
Fig. 6.20. Chromatograms obtained for o-terphenyl (O) and triphenylene (T) with ODS-modified monolithic
silica capillary columns. Column: (a) MS(100)-T-S (column length: 25.0 cm), (b) MS(100)-H(10)-I (23.9cm),
(c) MS(100)-H(15)-II (24.5 cm), and (d) MS(100)-H(25)-S (24.4 cm). Solute: thiourea, o-terphenyl,
triphenylene. Mobile phase: methanol/water (V/V) = 80/20. Temperature: 30 °C. Detection: 254 nm. The
pressure drop, linear velocity, retention factors for o-terphenyl and triphenylene, and steric selectivity α(T/O)
are shown.
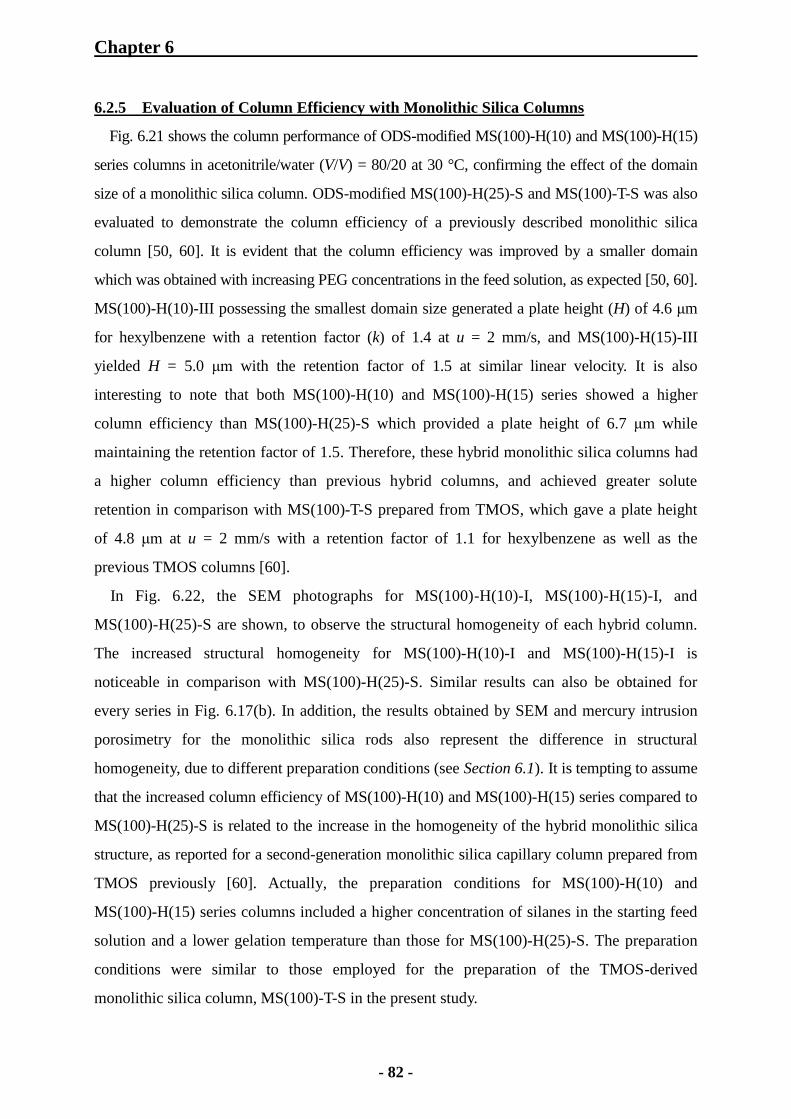
Chapter 6
- 82 -
6.2.5 Evaluation of Column Efficiency with Monolithic Silica Columns
Fig. 6.21 shows the column performance of ODS-modified MS(100)-H(10) and MS(100)-H(15)
series columns in acetonitrile/water (V/V) = 80/20 at 30 °C, confirming the effect of the domain
size of a monolithic silica column. ODS-modified MS(100)-H(25)-S and MS(100)-T-S was also
evaluated to demonstrate the column efficiency of a previously described monolithic silica
column [50, 60]. It is evident that the column efficiency was improved by a smaller domain
which was obtained with increasing PEG concentrations in the feed solution, as expected [50, 60].
MS(100)-H(10)-III possessing the smallest domain size generated a plate height (H) of 4.6 μm
for hexylbenzene with a retention factor (k) of 1.4 at u = 2 mm/s, and MS(100)-H(15)-III
yielded H = 5.0 μm with the retention factor of 1.5 at similar linear velocity. It is also
interesting to note that both MS(100)-H(10) and MS(100)-H(15) series showed a higher
column efficiency than MS(100)-H(25)-S which provided a plate height of 6.7 μm while
maintaining the retention factor of 1.5. Therefore, these hybrid monolithic silica columns had
a higher column efficiency than previous hybrid columns, and achieved greater solute
retention in comparison with MS(100)-T-S prepared from TMOS, which gave a plate height
of 4.8 μm at u = 2 mm/s with a retention factor of 1.1 for hexylbenzene as well as the
previous TMOS columns [60].
In Fig. 6.22, the SEM photographs for MS(100)-H(10)-I, MS(100)-H(15)-I, and
MS(100)-H(25)-S are shown, to observe the structural homogeneity of each hybrid column.
The increased structural homogeneity for MS(100)-H(10)-I and MS(100)-H(15)-I is
noticeable in comparison with MS(100)-H(25)-S. Similar results can also be obtained for
every series in Fig. 6.17(b). In addition, the results obtained by SEM and mercury intrusion
porosimetry for the monolithic silica rods also represent the difference in structural
homogeneity, due to different preparation conditions (see Section 6.1). It is tempting to assume
that the increased column efficiency of MS(100)-H(10) and MS(100)-H(15) series compared to
MS(100)-H(25)-S is related to the increase in the homogeneity of the hybrid monolithic silica
structure, as reported for a second-generation monolithic silica capillary column prepared from
TMOS previously [60]. Actually, the preparation conditions for MS(100)-H(10) and
MS(100)-H(15) series columns included a higher concentration of silanes in the starting feed
solution and a lower gelation temperature than those for MS(100)-H(25)-S. The preparation
conditions were similar to those employed for the preparation of the TMOS-derived
monolithic silica column, MS(100)-T-S in the present study.

Chapter 6
- 83 -
However, to elucidate the relationship between the column performance and the structural
homogeneity, the radial heterogeneity in a column should be investigated quantitatively, as
reported by using confocal laser scanning microscopy (CLSM) [84, 120]. Moreover, as a
complementary technique to mercury intrusion porosimetry, capillary flow porosimetry was
recently applied to the characterization of capillary columns by Lee and co-workers [127, 128].
These characterization methods will be crucial to examine the structural homogeneity of
monolithic silica capillary columns.
Fig. 6.21. Chromatograms obtained for alkylbenzenes with ODS-modified monolithic silica columns.
Column: (a) MS(100)-H(10)-I (column length: 23.9 cm) (b) MS(100)-H(10)-II (23.5 cm), (c)
MS(100)-H(10)-III (19.6 cm), (d) MS(100)-H(15)-I (24.9 cm), (e) MS(100)-H(15)-II (24.5 cm), (f)
MS(100)-H(15)-III (20.0 cm), (g) MS(100)-H(25)-S (24.4 cm), (h) MS(100)-T-S (23.5 cm). Solute: thiourea,
alkylbenzenes (C6H5(CH2)nH, n = 06). Mobile phase: acetonitrile/water (V/V) = 80/20. Temperature: 30
°C.
Detection: 210 nm. The pressure drop, linear velocity, the number of theoretical plates and plate height for
hexylbenzene are shown. The numbers of alkyl chain length are expressed to identify alkylbenzenes.
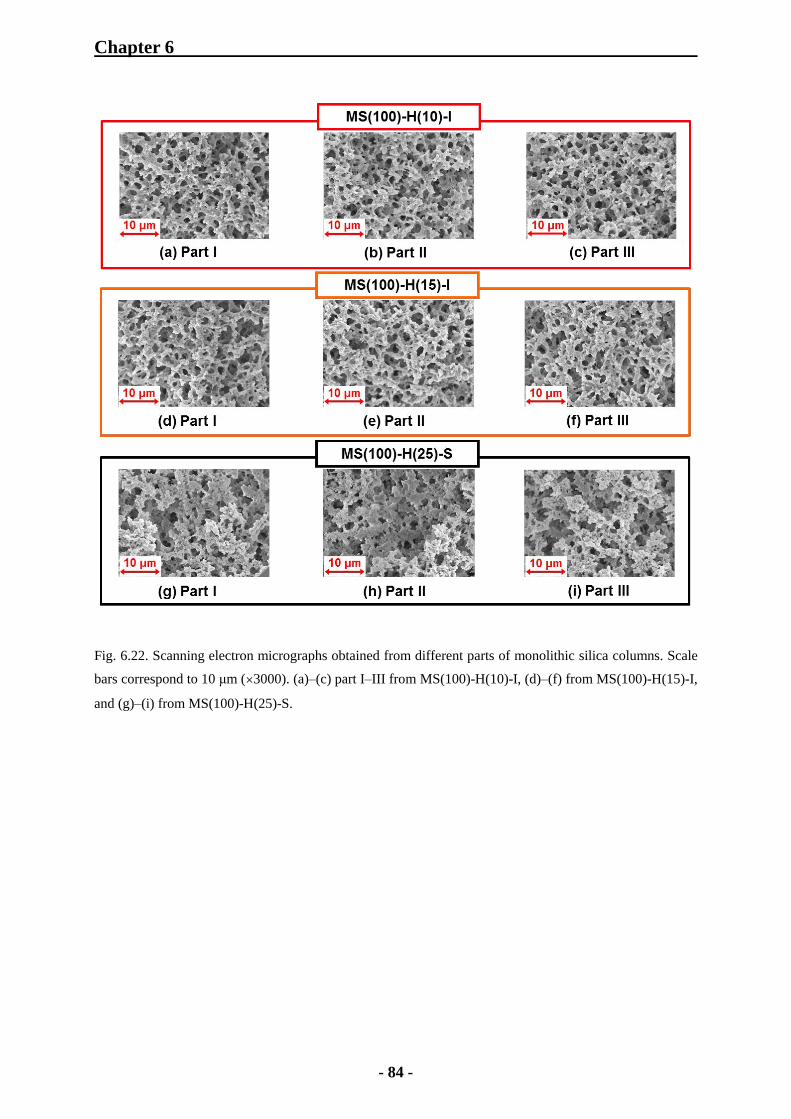
Chapter 6
- 84 -
Fig. 6.22. Scanning electron micrographs obtained from different parts of monolithic silica columns. Scale
bars correspond to 10 μm (×3000). (a)–(c) part I–III from MS(100)-H(10)-I, (d)–(f) from MS(100)-H(15)-I,
and (g)–(i) from MS(100)-H(25)-S.

Chapter 6
- 85 -
6.2.6 Comparison of Column Pressure Drop with Monolithic Silica Columns
Fig. 6.23 shows the relationship between a linear velocity and column pressure drop for a
monolithic silica capillary column and a particulate column in acetonitrile/water (V/V) =
80/20 at 30 °C. An increase in column pressure drop corresponds to a decrease in domain size
or permeability shown in Table 6.4. The permeability (column pressure drop) values provided
by MS(100)-T-S or MS(100)-H(10)-II were comparable to that of a column packed with 5 μm
particles. In general, changing the amount of PEG contributes to a change in domain size or
that in silica skeleton size and through-pore size simultaneously [25, 60, 78]. As shown in
Table 6.4, permeability can be regarded as the parameter indicating an average domain size.
Therefore, the results shown in Fig. 6.23 suggest that MS(100)-H(10) series provide a slight
higher column efficiency for hexylbenzene than MS(100)-H(15) series with similar column
permeability, when comparison is performed between MS(100)-H(10)-I and MS(100)-H(15)-II
or MS(100)-H(10)-II and MS(100)-H(15)-III in Fig. 6.21.
Fig. 6.23. Plots of column pressure drop against linear velocity of mobile phase. Columns: Mightysil RP
18 column packed with 5 μm ODS-modified silica particles ( ), MS(100)-T-S ( ), MS(100)-H(10)-I
( ), MS(100)-H(10)-II ( ), MS(100)-H(10)-III ( ), MS(100)-H(15)-I ( ), MS(100)-H(15)-II ( ),
MS(100)-H(15)-III ( ), MS(100)-H(25)-S ( ). Solute: thiourea. Mobile phase: acetonitrile/water (V/V) =
80/20.Temperature: 30
°C.
Chapter 6
- 86 -
6.2.7 Van Deemter Plots for Monolithic Silica Columns
Fig. 6.24 shows the plot of plate height (H) against linear velocity (u) for hexylbenzene in
acetonitrile/water (V/V) = 80/20. Smaller minimum plate height and a shift of the optimum
linear velocity toward a higher value are observed with the decrease in domain size. It has
been reported that the domain size of a monolithic silica column corresponds to the size of
particles generating similar column efficiency [25]. MS(100)-H(10)-III and MS(100)-H(15)-III
provided plate height values expected for a column packed with 2.5 μm silica particles or smaller.
However, the performance of the hybrid columns is still lower than that of MS(100)-T-S at
higher linear velocity. Plate height values obtained with hexylbenzene are 4.8, 4.6, and 5.0 μm
at 2 mm/s, but 6.6, 6.9, and 7.8 μm at 8 mm/s for MS(100)-T-S, MS(100)-H(10)-III, and
MS(100)-H(15)-III, respectively. Despite the similar or lower permeability compared to that of
MS(100)-T-S, the efficiency of hybrid columns decreases at higher linear velocity. A similar
result can be also observed through the comparison of MS(100)-H(10)-I and MS(100)-H(15)-II.
It is established that the presence of small pores contributes to slow mass transfer due to the
hindrance of diffusion of a solute within pores [2, 61, 129]. As shown in Section 6.1., hybrid
silica rods treated at 120 °C possess smaller pores than TMOS silica rod treated at 120 °C.
Especially, the comparison of TMOS-120-3h silica rod to hybrid(25)-120-4h silica rod shows a
significant difference regarding mesopore size distribution (see Fig. 6.9). It was reported by
Unger and co-workers that the mesopore size of a monolithic silica capillary column is roughly
similar to that of a conventional monolithic silica column (a monolithic silica rod prepared
under similar preparation conditions) by applying ISEC [77]. The aforementioned report
indicates that MS(100)-H(25)-S possesses a larger volume of small pores below 100 Å
compared to the other columns employed in the present study, as determined for the
corresponding monolithic silica rods used in Section 6.1 (see Fig. 6.8 and Fig 6.9). However, it
is confirmed that hybrid(15)80-15h silica rod possesses a larger quantity of small pores below
60 Å than hybrid(25)-120-4h silica rod (see Fig. 6.9). In the following section, it is shown that
the effect of mesoporosity on column efficiency for alkylbenzenes is negligible for the
corresponding monolithic silica capillary column (MS(100)-H(15)80-15h) (see Section 6.3).
This result suggests that the effect of mesoporosity on column efficiency is negligible in the
present examination using hexylbenzene. Therefore, it is assumed that the structural
homogeneity regarding the through-pores and silica skeletons decreases with the increase in
MTMS concentration in the feed solution because of the difference in hydrolysis and
condensation rates between TMOS and MTMS [35, 89, 130].

Chapter 6
- 87 -
When the column efficiency of MS(100)-H(15)-I is compared to that of MS(100)-H(25)-S
prepared by the previously reported preparation method [50], the former can generate higher
efficiency than the latter, although the former has a larger domain size, showing higher
permeability (see Table 6.4). In addition, both the columns gave a similar retention factor for
hexylbenzene in acetonitrile/water (V/V) = 80/20. The results imply that the monolithic silica
structure of MS(100)-H(15)-I is more homogeneous than that of MS(100)-H(25)-S. Tables 6.3
and 6.5 show that the large retention factor on MS(100)-H(25)-S was obtained by increasing
MTMS concentrations in the feed mixture. Moreover, by increasing the total silane
concentrations for preparation, an enhanced retention on MS(100)-H(15)-I and -II was
provided. Therefore, it is suggested that the preparation method for MS(100)-H(10) series or
MS(100)-H(15) series, featuring an increased silane concentration, achieved a higher
homogeneity of the monolithic silica structures in comparison with the hybrid materials in the
past [50], as shown in Fig. 6.22.
Fig. 6.24. Van Deemter plots obtained for ODS-modified monolithic silica columns with hexylbenzene as
solute. Columns: Mightysil RP 18 column packed with 5 μm ODS-modified silica particles ( ), MS(100)-T-S
( ), MS(100)-H(10)-I ( ), MS(100)-H(10)-II ( ), MS(100)-H(10)-III ( ), MS(100)-H(15)-I ( ),
MS(100)-H(15)-II ( ), MS(100)-H(15)-III ( ), MS(100)-H(25)-S ( ). Mobile phase: acetonitrile/water
(V/V) = 80/20. Temperature: 30
°C.

Chapter 6
- 88 -
6.2.8 Kinetic Plots for Monolithic Silica Columns
Fig. 6.25 shows the plot of the log (t0/N2) values against log(N), so-called kinetic plots,
proposed by Desmet and co-workers [70], where t0 is the column dead time and N the number
of theoretical plates. The plots are useful to compare the performance of various types of
columns in terms of achievable N and t0 at a specified pressure [60, 70, 131, 132]. The
performance of particulate columns packed with various particle sizes was estimated by using
the Knox equation, h = Aν1/3
+ B/ν + Cν [2, 60], where h is the reduced plate height, ν the
reduced velocity, and A, B, and C the coefficients describing the contribution of each term
(see Section 2.2). In this thesis, the values for A = 0.65, B = 2, and C = 0.08, based on the
result obtained from Mightysil-RP18 packed with 5 μm particles are employed [60], which
demonstrates a higher column efficiency than that shown by Poppe using A = 1.0, B = 1.5, and
C = 0.05 [65]. The diffusion coefficient of hexylbenzene in acetonitrile/water (V/V) = 80/20 was
calculated by Wilke-Chang equation [2, 61]. According to these parameters, the plots for
particulate columns were made at a pressure of 20 MPa, because most HPLC measurements
have been performed at a pressure of 20 MPa or lower. In the kinetic plots, if a curve obtained
for one column shows a smaller value of log (t0/N2) (downward direction of y-axis) at the
same value of log N compared to the other curves, it means that the former column is superior
to the other columns in order to achieve fast and high efficiency separations. For instance, in
Fig. 6.25, the plot observed for MS(100)-H(25)-S made for a previous preparation merges
that of the particulate columns at t0 = 40 s or N = 27000, while that for MS(100)-H(15)-I with
the largest domain size in the present study coincides with it at t0 = 26 s or N = 22000. This
comparison reveals that MS(100)-H(15)-I is more appropriate for achieving fast and high
efficiency separation than MS(100)-H(25)-S.
As in the case of Fig. 6.24, a higher performance than that of a column packed with 2.0 μm
particles was observed for MS(100)-H(10)-III, possessing the smallest domain size, in the
range of N = 16000 or more at around t0 = ~15 s or longer, and for MS(100)-H(15)-III in the
range of N = 19000 or more at t0 = ~20 s or longer in Fig. 6.25. These results suggest that the
monolithic silica columns would provide higher performance than particulate columns if more
than 20000 theoretical plates were desired at 20 MPa. However, it can be recognized that the
column performance for the monolithic silica columns tends to be lower with an increase in
MTMS concentrations in the feed solution. MS(100)-T-S can generate N = 14000 at t0 = 10 s
as reported previously [60], which showed similar performance as a column packed with
2–2.5 μm particles while maintaining a comparable column pressure drop to a column

Chapter 6
- 89 -
packed with 5 μm particles. MS(100)-H(10)-III can generate N = 12000 and MS(100)-H(15)-III
can yield N = 10000 at t0 = 10 s, although its domain size or the permeability is similar to or
smaller than that of MS(100)-T-S (see Table 6.4 and Fig. 6.23). The results suggest that it is
necessary to achieve higher structural homogeneity for hybrid columns possessing such small
domain sizes in comparison with TMOS-derived columns. Therefore, in the range of N < 20000
at a pressure of 20 MPa, a column packed with sub-2 μm particles or MS(100)-T-S produced
from TMOS is superior to the hybrid monolithic silica series. In addition, Miyazaki and
co-workers recently reported that a column packed with 2.6 μm fused-core silica particles can
provide higher column efficiency than a monolithic silica column, using a kinetic plot [133]. As
confirmed by mercury intrusion porosimetry in Section 6.1 (see Fig. 6.3), it is still challenging
to improve the structural homogeneity of monolithic silica with a small domain size, which
would provide higher kinetic performance than that of MS(100)-T-S. The preparation method
of the monolithic silica columns still needs improvement and a further study is required for the
development of monolithic silica columns with a smaller domain size and greater retention
ability.
Fig. 6.25. Plots of log (t0/N2) against log (N) for the columns examined. The curves for particulate columns
were obtained by assuming the following parameters, η = 0.00046 Pa s, φ = 700, Dm
= 2.22 × 10- 9
m2/s, and
Knox equation, h = 0.65ν1/3
+ 2/ν + 0.08ν [60]. Maximum pressure: 20 MPa. Particle diameter: (A) 5 μm, (B)
3 μm, (C) 2.5 μm, (D) 2 μm (E) 1.4 μm. Experimental data: Columns: Mightysil RP 18 column packed with
5 μm ODS-modified silica particles ( ), MS(100)-T-S ( ), MS(100)-H(10)-I ( ), MS(100)-H(10)-II
( ), MS(100)-H(10)-III ( ), MS(100)-H(15)-I ( ), MS(100)-H(15)-II ( ), MS(100)-H(15)-III ( ),
MS(100)-H(25)-S ( ).

Chapter 6
- 90 -
6.2.9 Conclusions
In the present study, it was possible to prepare hybrid monolithic silica capillary columns
with an increased total silane concentration and lower MTMS concentration compared to
previous hybrid columns. It was also observed that the column permeability of a monolithic
silica column reflects the domain size and surface-to-volume ratio (S/V) of the skeletons
determined by using SEM, as described in the previous report [79].
The relationship between the column porosity shown by the SEC measurement and the
retention factors observed for hexylbenzene with the capillary columns in methanol/water
(V/V) = 80/20 demonstrated that the solute retention strongly depends on the content of
methyl groups on the silica surface. It was possible to increase the retention ability by
increasing MTMS concentrations in the feed solution. The steric selectivity α(T/O) for a
planar compound was also related to MTMS concentrations in the feed solution. In addition,
the results of the assessment of the monolithic silica rods, which are shown in Section 6.1,
supported the aforementioned interpretation obtained for the capillary columns in HPLC.
The column efficiency of hybrid monolithic silica columns, prepared with lower MTMS
content and with increased silane concentration, was superior to that of previous hybrid
columns. The investigation using SEM suggested that the increased structural homogeneity
for the new hybrid columns resulted in higher column efficiency than that of a previous
hybrid column. Comparing the kinetic plots showed that the column efficiency of these hybrid
columns is comparable with that of a particulate column packed with 2.0–2.5 μm particles,
generating more than 20000 theoretical plates with t0 = 25 s at a pressure of 20 MPa. However,
it should be noted that the column efficiency of the monolithic silica columns tends to be lower
with increasing the MTMS concentration. The performance of present hybrid monolithic silica
columns is slightly lower than that of the TMOS monolithic silica column [60], although much
higher than that of previous hybrid columns. It is essential to improve structural homogeneity
of monolithic silica with a smaller domain size than 2.5 μm, particularly for the hybrid
columns, if column efficiency comparable with that of a column packed with sub-2 μm
particles or 2.6 μm fused-core silica particles is desired.
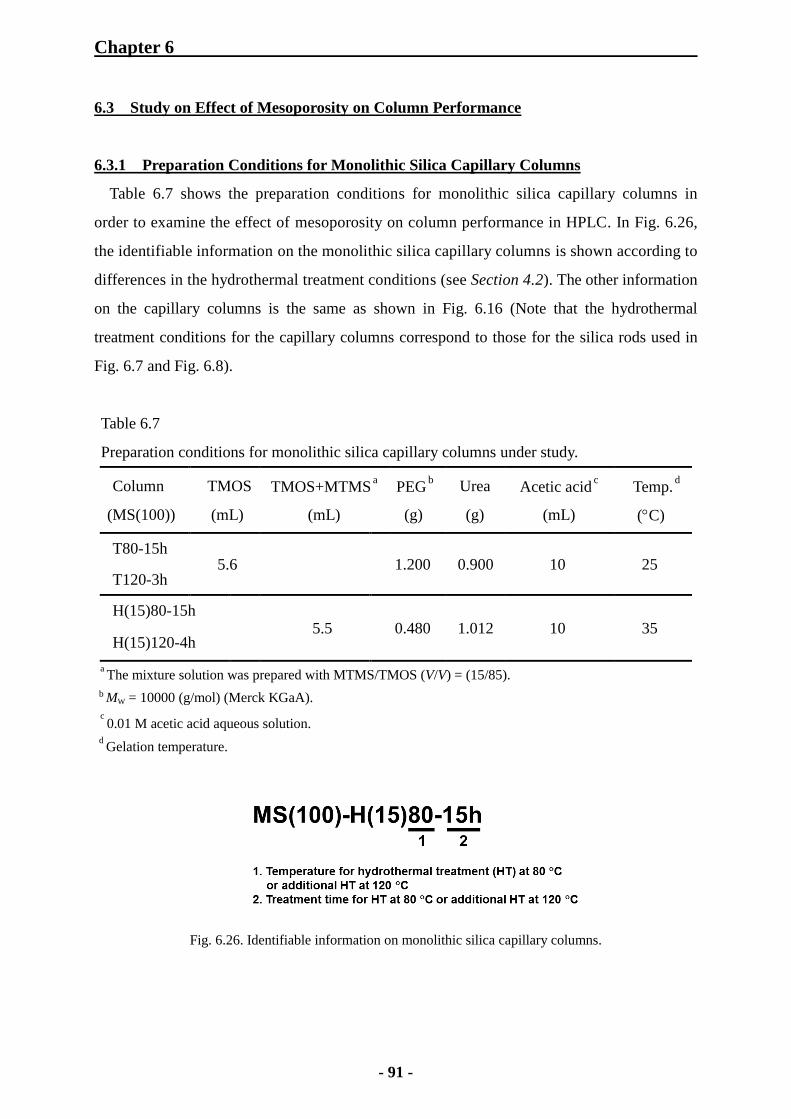
Chapter 6
- 91 -
6.3 Study on Effect of Mesoporosity on Column Performance
6.3.1 Preparation Conditions for Monolithic Silica Capillary Columns
Table 6.7 shows the preparation conditions for monolithic silica capillary columns in
order to examine the effect of mesoporosity on column performance in HPLC. In Fig. 6.26,
the identifiable information on the monolithic silica capillary columns is shown according to
differences in the hydrothermal treatment conditions (see Section 4.2). The other information
on the capillary columns is the same as shown in Fig. 6.16 (Note that the hydrothermal
treatment conditions for the capillary columns correspond to those for the silica rods used in
Fig. 6.7 and Fig. 6.8).
Table 6.7
Preparation conditions for monolithic silica capillary columns under study.
Column
(MS(100))
TMOS
(mL)
TMOS+MTMS a
(mL)
PEG b
(g)
Urea
(g)
Acetic acid c
(mL)
Temp. d
(C)
T80-15h
5.6
1.200
0.900
10 25
T120-3h
H(15)80-15h
5.5
0.480
1.012
10 35
H(15)120-4h
a The mixture solution was prepared with MTMS/TMOS (V/V) = (15/85).
b MW = 10000 (g/mol) (Merck KGaA).
c 0.01 M acetic acid aqueous solution.
d Gelation temperature.
Fig. 6.26. Identifiable information on monolithic silica capillary columns.

Chapter 6
- 92 -
6.3.2 Characterization of Monolithic Silica Capillary Columns by Inverse Size Exclusion
Chromatography
As shown in Fig. 6.27, the relationship between elution volume and molecular weight of
polystyrene standard (PSS) sample for bare monolithic silica capillary columns was examined
by SEC. The fraction of elution volume is estimated as the ratio of the elution volume of each
PSS sample to that of toluene which provides the total permeation volume of a column. The
elution curve, obtained by using PSS sample of varying molecular weight, correlates with the
corresponding column porosity, because a small molecule can penetrate into pores, but a large
molecule cannot, according to the principle of SEC. For example, SEC using a column packed
with silica particles possessing small pores can result in a large change of the elution volume in
a range of low molecular weight of PSS sample, but not in a range of the large molecular weight,
and vice versa [134]. The elution curves shown in Fig. 6.27(a) and 6.27(b) illustrate that the
hydrothermal treatments influence the column porosity corresponding to change of elution
volume for PSS samples and toluene with molecular weight spanning 92 to 100000 (g/mol).
Al-Bokari and co-workers have reported that the PSD of a monolithic silica column is
determined from the estimation by inverse size exclusion chromatography (ISEC) [96]. Pore
diameter of monolithic silica can be calculated according to the classical method introduced
by Hàlasz and Martin, as shown by Eq. (6.3) [92, 96]:
Dpore [Å] = 0.62 (MW)0.59
(6.3)
where Dpore is the pore diameter of silica and MW the molecular weight of PSS sample.
According to Eq. (6.3), the estimation of pore size of silica was carried out with the PSS
samples and toluene, which corresponds to 8 Å to 542 Å. Fig. 6.27 shows that the additional
hydrothermal treatment at 120 °C significantly affects the column porosity for both TMOS
and hybrid capillary columns. Consequently, these elution curves agree well with the isotherm
curves or cumulative curves obtained by nitrogen physisorption analysis of the corresponding
monolithic silica rods, as shown in Section 6.1 (see Fig. 6.7 and Fig. 6.8).
Fig. 6.28 shows the PSD of the monolithic silica capillary columns, obtained by ISEC
using toluene and PSS samples with molecular weight from 474 to 100000 (g/mol).
According to Eq. (6.3), the extension (minimal and maximum pore size) and increment in the
pore size (x-axis) is determined by the PSS samples available (cf. ref. [96]). Regarding the

Chapter 6
- 93 -
hydrothermal treatment applied to the monolithic silica capillaries, the important findings
obtained from the ISEC measurements are as follows:
Fig. 6.27. Selective permeation curves of polystyrene standard samples in THF with bare monolithic silica
capillary columns. (a) The curves obtained for TMOS columns (b) The curves obtained for hybrid(15)
columns. Column: MS(100)-T80-15h ( ), MS(100)-T120-3h ( ), MS(100)-H(15)80-15h ( ),
MS(100)-H(15)120-4h ( ). Temperature: 30 °C. Detection: 210 nm. Fraction of elution volume: Ve = VPSS/VToluene.
First, it is observed that the PSD determined for the monolithic silica capillary columns
depends strongly on the temperature of hydrothermal treatment, as reported in the previous
study [98]. Applying 120 °C as additional hydrothermal treatment leads to an enhanced
fraction of pore volume of larger mesopores, which is compatible with the result of the
nitrogen physisorption analysis performed on monolithic silica rods, as shown in Section 6.1
(see Fig. 6.8).
Second, the difference in silica precursor in the preparation feed solutions between TMOS
and hybrid columns influences the PSD. Especially, MS(100)-H(15)80-15h possesses the
highest content of small pores in comparison with other columns. Subsequently, it can be
confirmed that the change in the PSD observed for the monolithic silica capillary columns by
ISEC corresponds to that in the PSD obtained for silica rods by nitrogen physisorption
method, as shown in Section 6.1 (see Fig. 6.8).
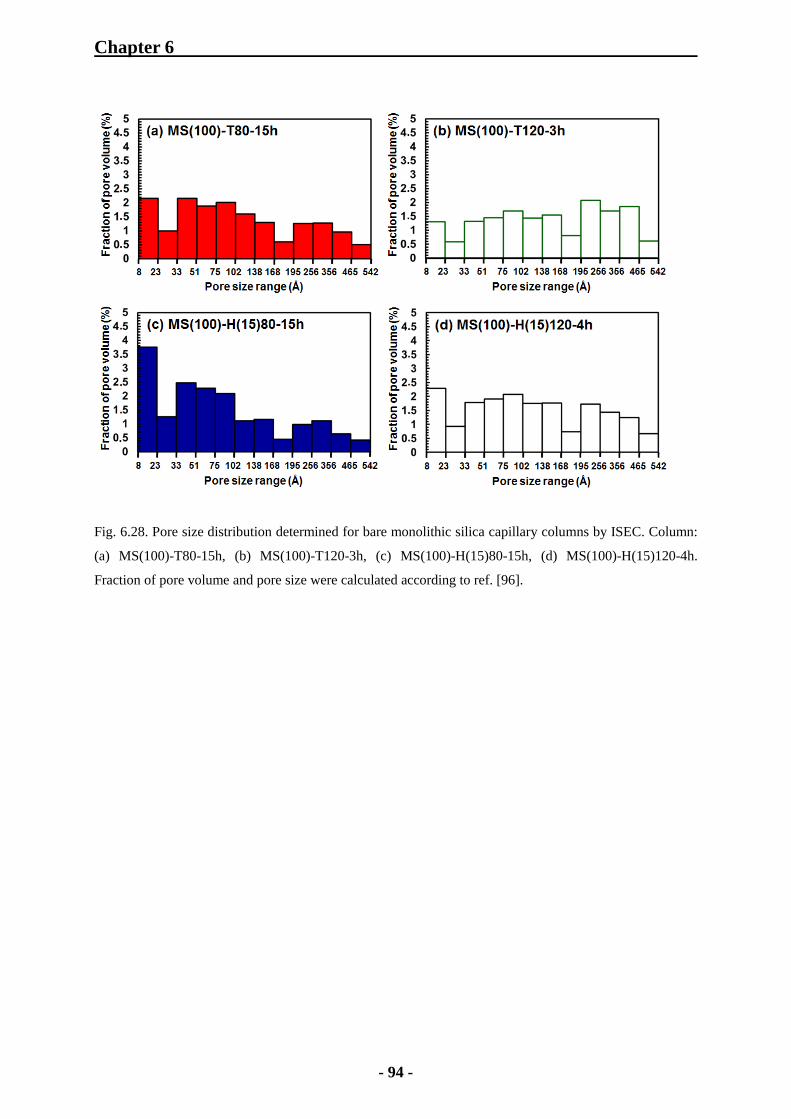
Chapter 6
- 94 -
Fig. 6.28. Pore size distribution determined for bare monolithic silica capillary columns by ISEC. Column:
(a) MS(100)-T80-15h, (b) MS(100)-T120-3h, (c) MS(100)-H(15)80-15h, (d) MS(100)-H(15)120-4h.
Fraction of pore volume and pore size were calculated according to ref. [96].

Chapter 6
- 95 -
6.3.3 Effect of Hydrothermal Treatment on Retention Factors for Alkylbenzenes
To examine the change of porosity of monolithic silica in a capillary, RPLC measurements
were also performed with ODS-modified monolithic silica capillary columns. Fig. 6.29 shows
the chromatograms observed for alkylbenzenes with ODS-modified monolithic silica capillary
columns in methanol/water (V/V) = 80/20 at 30 °C. Regarding the retention factors (k) for
hexylbenzene, k = 3.46 was obtained for MS(100)-T80-15h, and k = 2.16 for MS(100)-T120-3h.
For the hybrid silica columns, the retention factor for MS(100)-H(15)80-15h showed k = 5.31
and that for MS(100)-H(15)120-4h was k = 3.16. As expected, the retention factors for the
columns treated additionally at 120 °C were comparable with those obtained for the columns
shown in Section 6.2 (see Table 6.6). This shows that surface modification with ODS-DEA for
the monolithic silica columns was carried out properly (Note that a slight increase of 5‒11% in
the retention factor was detected in comparison with those of the corresponding columns used
in Section 6.2, which is presumably related to difference in hydrothermal treatment since a
different oven was employed). The difference in hydrothermal treatment of the capillary
column corresponds to that in the retention factor for hexylbenzene, as predicted from the
carbon content (%C) of ODS groups, determined by elemental analysis of the corresponding
silica rods shown in Section 6.1 (see Table 6.2). The capillary columns featuring a relatively
small retention factor are those possessing a larger mesopore size and an accordingly smaller
BET surface area, resulting in a smaller amount of ODS groups introduced by
octadecylsilylation, as determined by nitrogen physisorption method performed on the silica
rods and ISEC on the capillaries themselves.
On the other hand, when MS(100)-T80-15h is compared to MS(100)-H(15)80-15h or
MS(100)-T120-3h to MS(100)-H(15)120-4h, it can be recognized that the difference in the
retention factor for hexylbenzene is much larger than the prediction obtained from the carbon
contents (%C) of the ODS-modified corresponding silica rods (see Table 6.2). These results
support a significant effect of the methyl group provided by MTMS, contributing to
hydrophobic retention ability in RPLC, as described in Section 6.2.
The estimation of pore sizes of silica applying Eq. (6.3) is based on the straightforward
assumption that the pore size is 2.5 times larger than the rotational coil of polystyrene
molecules in THF or methylene chloride [92]. For a detailed interpretation, it is essential to
estimate a computationally simulated PSD with the result obtained from mercury intrusion
porosimetry or nitrogen physisorption method [97, 135‒137]. Considering accessibility of
molecules into pores indicates that the nitrogen physisorption method is more reliable than

Chapter 6
- 96 -
ISEC because of the small molecular size of nitrogen. However, it should be emphasized
that ISEC is useful to semi-quantitatively investigate mesoporosity of capillary column. The
present study reveals that the trends in porosity of the monolithic capillary columns, as a
function of hydrothermal treatment, correspond well to those obtained for the corresponding
monolithic silica rods which were treated similarly.
Fig. 6.29. Chromatograms obtained for alkylbenzenes with ODS-modified monolithic silica capillary
columns. Column: (a) MS(100)-T80-15h (column length: 23.0 cm), (b) MS(100)-T120-3h (23.2 cm), (c)
MS(100)-H(15)80-15h (22.9 cm), and (d) MS(100)-H(15)120-4h (22.7 cm). Solute: thiourea, alkylbenzenes
(C6H5(CH2)nH, n = 16). Mobile phase: methanol/water (V/V) = 80/20. Temperature: 30 °C. Detection: 210
nm. Pressure drop and linear velocity are shown. Retention factor, number of theoretical plates, and plate
height for hexylbenzene are also indicated. The numbers of alkyl chain length are expressed to identify
alkylbenzenes.

Chapter 6
- 97 -
6.3.4 SEM Observation and Examination of Permeability with Monolithic Silica Columns
As shown in Fig. 6.30(a) and 6.30(b), SEM photographs for monolithic silica capillary
columns were taken in order to qualitatively study the influence of the synthesis parameters
on the macroporosity. Fig. 6.30(a) shows that it is possible to prepare monolithic silica
capillary columns, in which the structures connect to the inner wall, without relation to the
difference in hydrothermal treatment. Comparing the photographs in Fig. 6.30(b) indicates
that TMOS capillary columns possess thinner skeletons and smaller through-pores than hybrid
capillary columns. The TMOS columns feature a domain size (a combined size of through-pore
and skeleton) of 2–3 μm, and the hybrid columns 3‒4 μm. In addition, the macropore
structures observed for the monolithic silica columns with the same silica support (TMOS or
H(15) series columns) show no significant variation due to the difference in hydrothermal
treatment, because the same feed solutions were employed for preparation, as shown in Table
6.7. This finding is consistent with the results obtained for monolithic silica rods reported by
Minakuchi and co-workers [25].
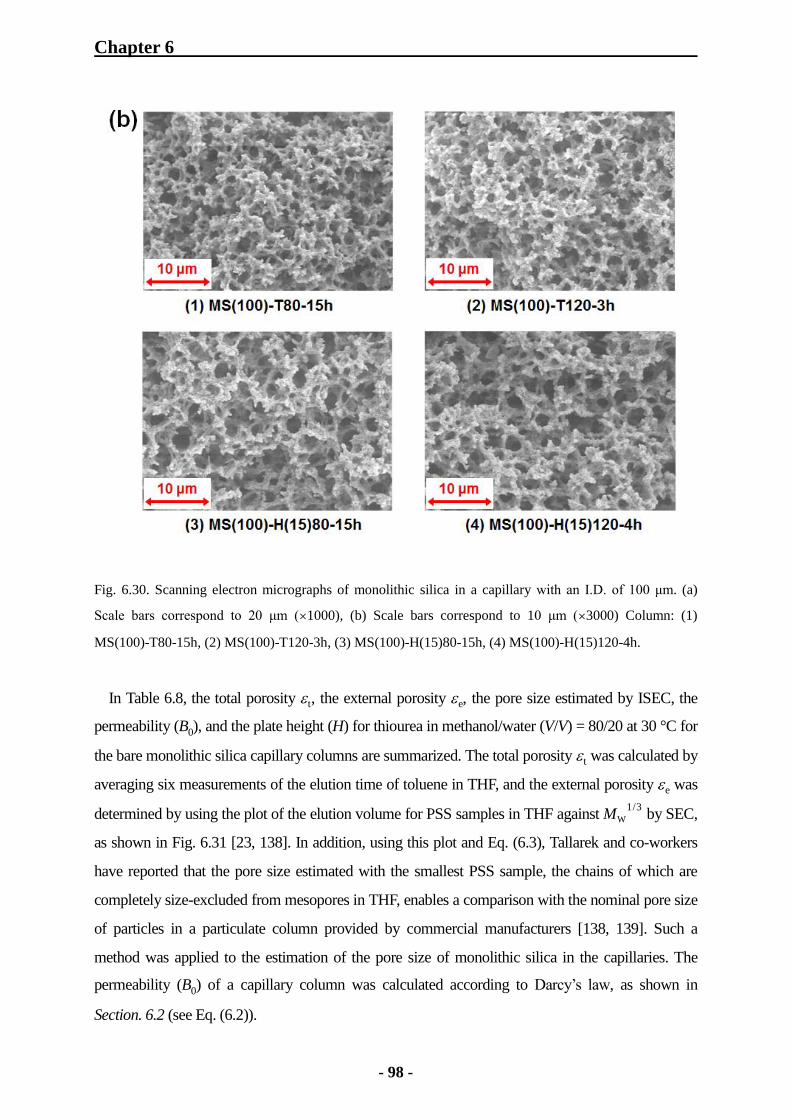
Chapter 6
- 98 -
Fig. 6.30. Scanning electron micrographs of monolithic silica in a capillary with an I.D. of 100 μm. (a)
Scale bars correspond to 20 μm (×1000), (b) Scale bars correspond to 10 μm (×3000) Column: (1)
MS(100)-T80-15h, (2) MS(100)-T120-3h, (3) MS(100)-H(15)80-15h, (4) MS(100)-H(15)120-4h.
In Table 6.8, the total porosity t, the external porosity e, the pore size estimated by ISEC, the
permeability (B0), and the plate height (H) for thiourea in methanol/water (V/V) = 80/20 at 30 °C for
the bare monolithic silica capillary columns are summarized. The total porosity t was calculated by
averaging six measurements of the elution time of toluene in THF, and the external porosity e was
determined by using the plot of the elution volume for PSS samples in THF against MW
1/3 by SEC,
as shown in Fig. 6.31 [23, 138]. In addition, using this plot and Eq. (6.3), Tallarek and co-workers
have reported that the pore size estimated with the smallest PSS sample, the chains of which are
completely size-excluded from mesopores in THF, enables a comparison with the nominal pore size
of particles in a particulate column provided by commercial manufacturers [138, 139]. Such a
method was applied to the estimation of the pore size of monolithic silica in the capillaries. The
permeability (B0) of a capillary column was calculated according to Darcy’s law, as shown in
Section. 6.2 (see Eq. (6.2)).
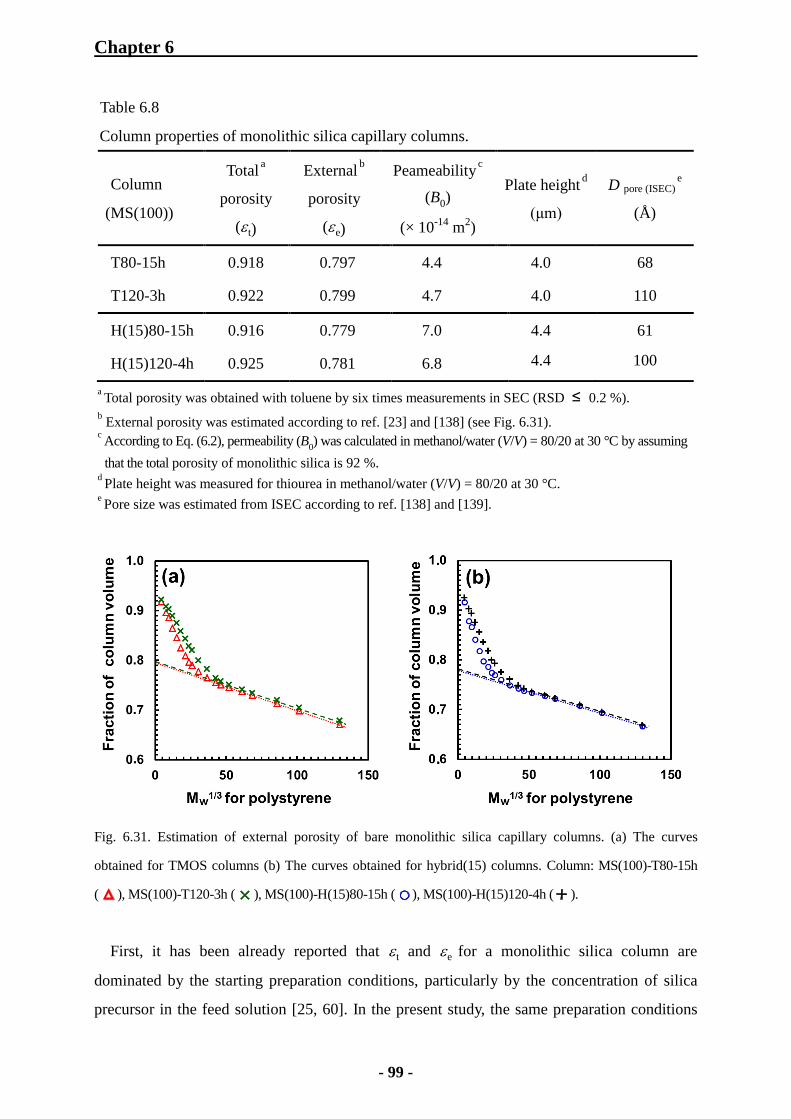
Chapter 6
- 99 -
Table 6.8
Column properties of monolithic silica capillary columns.
Column
(MS(100))
Total a
porosity
(t)
External b
porosity
(e)
Peameability c
(B0)
(× 10-14
m2)
Plate height d
(μm)
D pore (ISEC) e
(Å)
T80-15h
0.918 0.797 4.4 4.0 68
T120-3h 0.922 0.799 4.7 4.0 110
H(15)80-15h 0.916 0.779 7.0 4.4 61
H(15)120-4h 0.925 0.781 6.8 4.4 100
a Total porosity was obtained with toluene by six times measurements in SEC (RSD ≤ 0.2 %).
b External porosity was estimated according to ref. [23] and [138] (see Fig. 6.31).
c According to Eq. (6.2), permeability (B
0) was calculated in methanol/water (V/V) = 80/20 at 30 °C by assuming
that the total porosity of monolithic silica is 92 %. d
Plate height was measured for thiourea in methanol/water (V/V) = 80/20 at 30 °C. e
Pore size was estimated from ISEC according to ref. [138] and [139].
Fig. 6.31. Estimation of external porosity of bare monolithic silica capillary columns. (a) The curves
obtained for TMOS columns (b) The curves obtained for hybrid(15) columns. Column: MS(100)-T80-15h
(
), MS(100)-T120-3h (
), MS(100)-H(15)80-15h ( ), MS(100)-H(15)120-4h (
).
First, it has been already reported that t and e for a monolithic silica column are
dominated by the starting preparation conditions, particularly by the concentration of silica
precursor in the feed solution [25, 60]. In the present study, the same preparation conditions
Chapter 6
- 100 -
were applied to the preparation of the capillary columns with the same silica support except
for hydrothermal treatment, resulting in the observed similarities of t, e and internal porosity
i for micro- and mesopores (i = t – e), but influencing mesopore size and PSD, as shown in
Fig. 6.28. Interestingly, the estimated mesopore sizes of monolithic silica capillary columns
by ISEC correlate with the pore sizes of the silica rods, which are obtained by nitrogen
physisorption method (see Table 6.2).
Second, it was already demonstrated that the domain size for a monolithic silica capillary
column can be controlled by adjusting PEG amount in the feed solution [60, 140]. The
permeability reflects the domain size of monolithic silica in a capillary, as shown in Section 6.2
(see Table 6.4). It can be assumed that the difference in the permeability between TMOS and
hybrid columns corresponds to that in domain size observed by SEM (see Fig. 6.30(b)).
Furthermore, column efficiency strongly depends on the domain size of a monolithic silica
capillary column, as shown in Section 6.2 (see Fig. 6.24) [60, 140]. The column efficiency for
thiourea (non-retentive solute) in methanol/water (V/V) = 80/20 at 30 °C is quite similar
between the columns with the same silica support because of the similar domain sizes. In
contrast, the differences in column efficiency between TMOS and hybrid columns are
observable, which is attributed to different domain sizes (see Table 6.8). However, column
properties of monolithic silica capillary columns, produced by applying the same initial
preparation conditions, are quite similar except for the differences in mesopore size and PSD,
which is due to the different hydrothermal treatments (see Fig. 6.28 and Table 6.8). Thus, this
finding supports that the difference in column efficiency observed for the monolithic columns
with the same silica support is ascribed to that in the pore size and PSD, as demonstrated in
the following examination of column efficiency observed for the peptides (see Fig. 6.35).
Fig. 6.32 shows the relationship between column pressure drop obtained for
ODS-modified monolithic silica capillary columns and linear velocity (u) in three kinds of
mobile phase, acetonitrile/water (V/V) = 80/20, acetonitrile/water/trifluoroacetic acid
(TFA) (V/V/V) = 28/72/0.1, and acetonitrile/water/TFA (V/V/V) = 33/67/0.1 at 30 °C. The
hybrid columns provided similar values for column pressure drop. Even for TMOS
columns, the difference in column pressure drop could be calculated to be within 9 % at
same linear velocities, as expected from the values of the permeability in Table 6.8.
Therefore, these results agree well with the aforementioned interpretation: the domain size
is quite similar between the columns with the same silica support, but different between
TMOS and hybrid monolithic silica columns.

Chapter 6
- 101 -
Fig. 6.32. Plots of column pressure drop against linear velocity of mobile phase. Mobile phase: (a)
acetonitrile/water (V/V) = 80/20, (b) acetonitrile/water/TFA (V/V/V) = 28/72/0.1, (c) acetonitrile/water/TFA
(V/V/V) = 33/67/0.1. Column: MS(100)-T80-15h (
), MS(100)-T120-3h (
), MS(100)-H(15)80-15h ( ),
MS(100)-H(15)120-4h ( ). Temperature: 30
°C.
Chapter 6
- 102 -
6.3.5 Comparison of Column Efficiency with Alkylbenzenes
In Fig. 6.33(a) and 6.33(b), plate height (H) obtained for the ODS-modified columns is
plotted against linear velocity (u) in acetonitrile/water (V/V) = 80/20 at 30 °C. The
application of pentylbenzene and hexylbenzene to the examination could provide similar
retention factors obtained for the capillary columns with the same silica support (see the
information in Fig. 6.33). This allows for a reasonable comparison of column efficiency for
the capillary columns without relation to difference in retention factor, which is based on the
assumption that the diffusivity and the molecular sizes are similar, because the structural
difference between pentylbenzene and hexylbenzene is only one methylene group (CH2).
As shown in Fig. 6.33(a), it is observed that the curves are obviously similar between the
capillary columns with the same silica support, demonstrating that there is no effect of
mesoporosity on the column efficiency for the solutes. With respect to the evaluation of
monolithic silica column, this result reveals that the influence of mesoporosity on the column
efficiency for small molecules as alkylbenzenes is negligible, as reported previously by
Guiochon and co-workers [64].
In Fig. 6.33(b), the plots observed for pentylbenzene show that a plate height of H = 5.3 μm
was obtained for MS(100)-T80-15h (k = 1.23), and H = 5.2 μm for MS(100)-T120-3h (k = 0.82)
at u = 2.0 mm/s. This difference in column efficiency is presumably attributed to the different
values for the retention factors. It has been demonstrated by Tanaka and co-workers that the
column efficiency for a monolithic silica capillary column tends to become slightly lower
with an increase in retention factor in the split injection/flow system [76].
However, comparing the column efficiency even at u = 6.0 mm/s shows that a value of
H = 7.1 μm was obtained for MS(100)-T80-15h, and H = 6.8 μm for MS(100)-T120-3h.
In addition, for the hybrid columns, the column efficiency was similar between
MS(100)-H(15)80-15h (H = 9.6 μm, k = 1.65) and MS(100)-H(15)120-4h (H = 9.0 μm, k = 1.10).
Consequently, these results suggest that the additional hydrothermal treatments at 120 °C,
performed on both TMOS and hybrid columns, provides no significant influence on column
efficiency, but on retention factor, regarding the behavior of relatively small molecules. It is
assumed that the capillary columns exposed to the treatment at 80 °C result in a higher
resolution and a larger sample loading capacity on separation of small molecules in
comparison with the columns treated additionally at 120 °C, because the retention ability
due to higher surface area can be increased without significant loss of column efficiency.
Furthermore, this measurement allowed determining the difference in column efficiency

Chapter 6
- 103 -
between TMOS columns and hybrid columns. This result is directly related to the different
domain size which contributes to difference in mass transfer of solute, as described by the
aforementioned results (see Table 6.8 and Fig. 6.32).
Fig. 6.33. Van Deemter plots obtained for ODS-modified monolithic silica columns with alkylbenzenes. (a)
The Plots obtained for pentylbenzene and hexylbenzene. (b) The Plots obtained for pentylbenzene. Column:
MS(100)-T80-15h (
), MS(100)-T120-3h (
), MS(100)-H(15)80-15h ( ), MS(100)-H(15)120-4h (
).
Mobile phase: acetonitrile/water (V/V) = 80/20. Temperature: 30 °C. Detection: 210 nm. Retention factor (k)
for pentylbenzene: MS(100)-T80-15h (k = 1.23), MS(100)-T120-3h (k = 0.82), MS(100)-H(15)80-15h (k = 1.65),
and MS(100)-H(15)120-4h (k = 1.10). Retention factor for hexylbenzene: MS(100)-T120-3h (k = 1.16),
MS(100)-H(15)120-4h (k = 1.55).

Chapter 6
- 104 -
6.3.6 Comparison of Column Efficiency with Peptides
A series of further experiments were performed to address the question, if the changes in
porosity generated by hydrothermal treatment in both, TMOS and hybrid columns, affect
column performance for larger molecules. As probe molecules, leucine-enkephalin (MW = 555
(g/mol)), angiotensin II (MW = 1046 (g/mol)), and insulin (MW = 5770 (g/mol)) were utilized
for the examination.
Fig. 6.34 shows the relationship between plate height and linear velocity with pentylbenzene,
leucine-enkephalin, angiotensin II, and insulin (The information on the measurement conditions
is shown in Fig. 6.34). The last abbreviation “e” in a column name denotes “endcapping” with
TMSI (see Section 4.5). It is observed that column efficiency is lower with increasing molecular
weight for the solutes at relatively high linear velocity because of the contribution of slower
mass transfer inside pores, which is obvious when the plate height curve for insulin is compared
to those for the other solutes. In general, it has been known that diffusivity of solute decreases
with an increase in molecular weight. For an estimation of molecular diffusivity of the peptides,
Eq. (6.4) introduced by Young and co-workers was applied [23, 141]:
31
8m 103418
/Mη
T.D (6.4)
where Dm is the diffusion coefficient of solute in mobile phase and η the viscosity of mobile
phase, and M the molecular weight of solute, and T the measurement temperature, respectively.
According to Eq. (6.4) by applying 303 K and the viscosity of mobile phase η = 0.86 cP, Dm =
3.6 × 10⁻⁶
cm2/s was obtained for leucine-enkephalin, 2.9 × 10
-6 cm
2/s for angiotensin II, and 1.6
× 10-6
cm2/s for insulin. In addition, the diffusion coefficient of pentylbenzene in
acetonitrile/water (V/V) = 80/20 at 30 °C was determined as 1.7 × 10⁻⁵
cm2/s from the
experimental data reported by Carr and Li [142]. These data indicate that an increase in
molecular weight (molecular size) contributes to significantly lower column efficiency.
Moreover, interestingly the plate height curves are convex upward for the peptides in
comparison with the curve for pentylbenzene. This tendency was also observed for the other
capillary columns despite the differences in pore size or PSD. It supports that the phenomenon is
not dependent on intraskeleton mass transfer due to the mesoporosity in monolithic silica, but
may be related to eddy diffusion, represented by the coupling theory of Giddings [61, 143].

Chapter 6
- 105 -
Fig. 6.34. Van Deemter plots obtained for MS(100)-T120-3h-e with compounds of varying molecular
weight. Symbol: pentylbenzene in acetonitrile/water (V/V) = 80/20 ( ), leucine-enkephalin ( ) and
angiotensin II ( ) in acetonitrile/water/TFA (V/V/V) = 28/72/0.1, insulin ( ) in acetonitrile/water/TFA
(V/V/V) = 33/67/0.1. Temperature: 30 °C. Detection: 210 nm for pentylbenzene, 220 nm for the peptides.
The last abbreviation “e” in a column name stands for endcapping with TMSI.
To investigate the effect of mesoporosity on column efficiency for the peptides, the
comparison of MS(100)-T80-15h-e with MS(100)-T120-3h-e or MS(100)-H(15)80-15h-e
with MS(100)-H(15)120-4h-e is reasonable, as demonstrated by using the results in Fig. 6.28
and Table 6.8.
Fig. 6.35 shows Van Deemter plots obtained for the monolithic silica capillary columns with
leucine-enkephalin, angiotensin II, and insulin at similar retention factors. The comparison of
MS(100)-T80-15h-e and MS(100)-T120-3h-e shows that the column efficiency is quite similar for
leucine-enkephalin, angiotensin II, and slightly different for insulin at linear velocities between
0.08–5 mm/s. In contrast, there is significant difference in column efficiency between
MS(100)-H(15)80-15h-e and MS(100)-H(15)120-4h-e, in particular for insulin with increasing
linear velocity from 0.08 to 6 mm/s. The difference in column efficiency observed for the hybrid
columns tends to be larger with the gradual increase in molecular weight of the peptides.
Fig. 6.36 shows the chromatograms obtained for the ODS-modified monolithic silica
columns with insulin at u = 4.0 mm/s in acetonitrile/water/TFA (V/V/V) = 33/67/0.1 at 30 °C.
Comparing the difference in plate height between TMOS series columns with the difference
between hybrid series columns reveals that additional hydrothermal treatment at 120 °C for

Chapter 6
- 106 -
MS(100)-H(15)120-4h-e contributes to the variation of column efficiency. In contrast, for the
TMOS column, hydrothermal treatment at 120 °C does not significantly influence column
efficiency even for the insulin.
As shown in Fig. 6.28, the results obtained by ISEC demonstrate that there are more small
pores inside bare MS(100)-H(15)80-15h compared to bare MS(100)-T80-15h. Moreover, the
results obtained by nitrogen physisorption method for the corresponding silica rods indicate that
hybrid silica rod treated at 80 °C for 15 hours (hybrid(15)-80-15h) possesses a larger quantity of
small mesopores compared to TMOS rod exposed to 80 °C for 15 hours (TMOS-80-15h), as
shown in Section 6.1 (see Fig. 6.8). Regarding mesopore volume below 60 Å,
hybrid(15)-80-15h shows a 1.8 times larger pore volume than TMOS-80-15h, whereas the silica
rods treated additionally at 120 °C (TMOS-120-3h and hybrid(15)-120-4h) show much less
pore volume. Therefore, these results reveal that a larger volume of small pores below 60 Å for
bare MS(100)-H(15)80-15h contributes to the lower column efficiency for the peptides
compared to the pore volume of bare MS(100)-H(15)120-4h. It is concluded that application of
hydrothermal treatment at higher temperature to the hybrid column is mandatory in comparison
with the TMOS column, to provide higher column efficiency with an increase in molecular
weight (molecular size).
On the other hand, the presence of micropores might be considerable for the monolithic silica
material, especially for MS(100)-H(15)80-15h, according to the results of the nitrogen
physisorption analysis performed on the monolithic silica rods, as shown in Section 6.1 (see Fig.
6.8). In general, the presence of micropores is not favorable with respect to column efficiency
for small molecule in HPLC [2]. However, the results shown in Fig. 6.33 represent no influence
of microporosity on column efficiency for alkylbenzenes between the non-treated and treated
columns at 120 °C. Regarding the total porosity (t) of column, the bare monolithic silica
capillaries under study show about 92 % (see Table 6.8), whereas a column packed with bare
silica particles provides about 78 % [25]. This comparison means that the particulate column
possesses approximately 3 times more amount of silica than the monolithic silica capillaries. If
it is assumed that both silica particle and monolith possess identical micro- and mesoporosity,
this difference in silica amount in the column reflects that the monolithic silica capillary
columns show much less effect of micro- and mesoporosity on column efficiency than the
particulate column. This interpretation substantiates the aforementioned results obtained for
alkylbenzenes with both TMOS and hybrid columns as well as those for the peptides with
TMOS columns without relation to the influence of microporosity.

Chapter 6
- 107 -
Therefore, the results shown in the present study, dedicated to the elucidation of influence
of mesoporosity on column performance, support the conclusion introduced in Section 6.2:
the preparation method of the monolithic silica columns, exerting a drastic impact on
structural homogeneity regarding through-pores and silica skeletons, will lead to a significant
improvement of column efficiency [60, 63, 64, 71, 74, 140, 144].
Fig. 6.35. Van Deemter plots obtained for ODS-modified monolithic silica columns with three kinds of
peptides. (a)(c) The plots obtained for TMOS columns. (d)(f) Plots obtained for hybrid columns.
Column: MS(100)-T80-15h-e ( ), MS(100)-T120-3h-e ( ), MS(100)-H(15)80-15h-e ( ),
MS(100)-H(15)120-4h-e ( ). Solute and mobile phase: (a) and (d) leucine-enkephalin in
acetonitrile/water/TFA (V/V/V) = 28/72/0.1, (b) and (e) angiotensin II in acetonitrile/water/TFA (V/V/V) =
28/72/0.1, (c) and (f) insulin in acetonitrile/water/TFA (V/V/V) = 33/67/0.1. Temperature: 30 °C. Detection:
220 nm. k80 stand for retention factors observed for the columns treated at 80 °C, and k120 for those
observed for the columns treated additionally at 120 °C.
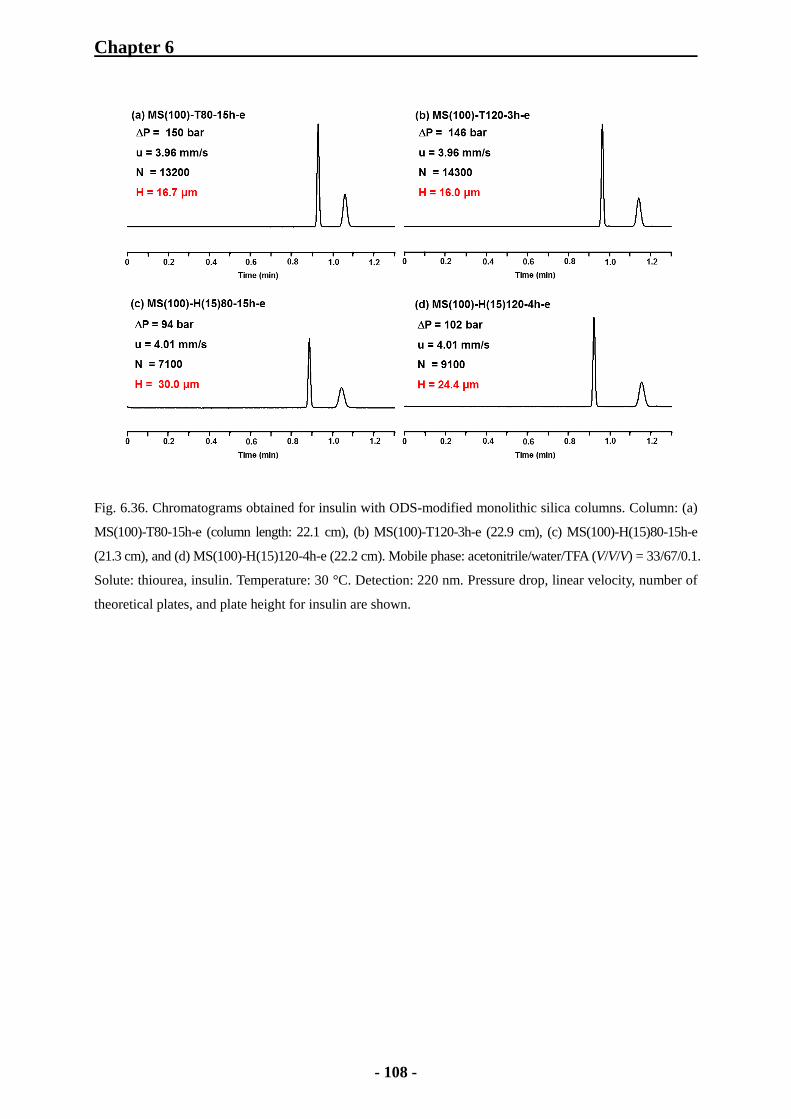
Chapter 6
- 108 -
Fig. 6.36. Chromatograms obtained for insulin with ODS-modified monolithic silica columns. Column: (a)
MS(100)-T80-15h-e (column length: 22.1 cm), (b) MS(100)-T120-3h-e (22.9 cm), (c) MS(100)-H(15)80-15h-e
(21.3 cm), and (d) MS(100)-H(15)120-4h-e (22.2 cm). Mobile phase: acetonitrile/water/TFA (V/V/V) = 33/67/0.1.
Solute: thiourea, insulin. Temperature: 30 °C. Detection: 220 nm. Pressure drop, linear velocity, number of
theoretical plates, and plate height for insulin are shown.

Chapter 6
- 109 -
6.3.7 Conclusions
In the present study, the influences of hydrothermal treatments at 80 °C and 120 °C on
mesoporosity of monolithic silica capillary column were examined. The change in PSD,
attributed to applying the additional hydrothermal treatment at 120 °C or different silica
precursor in the feed solution to the preparation, was detected for the capillary columns by using
ISEC. This result regarding PSD was in agreement with the result obtained by nitrogen
physisorption method for the corresponding monolithic silica rods, shown in Section 6.1. ISEC
performed on monolithic silica capillaries and nitrogen physisorption method on corresponding
monolithic rods allowed for a systematic comparison, enabling the estimation of mesopore sizes
even in capillaries with sub-millimeter diameter. The retention factors for hexylbenzene with
ODS-modified capillary columns in methanol/water (V/V) = 80/20 at 30 °C corresponded to the
results given by elemental analysis of ODS-modified monolithic silica rods. In addition, the
comparison of the retention factors between TMOS and hybrid columns, for which similar
hydrothermal treatment was carried out, indicated the significant contribution of methyl groups
to the increase in retention factor in RPLC, which is also demonstrated in Section 6.2.
The examination of column efficiency for small molecules as alkylbenzenes revealed that
there is no significant influence of mesoporosity on the column efficiency between non-treated
and treated monolithic silica columns at 120 °C. This supports that a monolithic silica column
treated at 80 °C for 15 hours is expected to provide a higher resolution and a larger sample
loading capacity on separation of small molecules in comparison with a column treated
additionally at 120 °C, because of a higher content of ODS groups, resulting in a larger
retention ability without significant loss of column efficiency. When leucine-enkephalin,
angiotensin II, and insulin were applied to the measurements in RPLC, lower column efficiency
was observed for the hybrid column treated at 80 °C with increasing molecular weight of the
peptides compared to that for the hybrid column treated at 120 °C. In contrast, the results
obtained for TMOS columns showed that there was no significant difference in column
efficiency for the aforementioned peptides. It was assumed that the high content of small pores
below 60 Å in the hybrid column treated at 80 °C contributed to the low column efficiency, as
predicted by nitrogen physisorption method and ISEC. Therefore, it is suggested that
hydrothermal treatment at higher temperature is mandatory for the hybrid column in
comparison with the TMOS column, to provide higher column efficiency with an increase in
molecular size of solute.
Chapter 7
- 110 -
7 Summary and Outlook
This thesis is dedicated to the preparation and characterization of monolithic silica capillary
columns using TMOS and MTMS as silica precursor. In summary, the author challenged an
approach to increase retention ability for a monolithic silica capillary column while
maintaining or improving the column efficiency, because this is a considerable concern for the
capillary columns to achieve high resolution in HPLC.
To attain the aforementioned objective, the monolithic silica capillary columns were
prepared by increasing the total silane concentration and reducing MTMS concentration in the
feed solution, as described in Section 6.2. MTMS/TMOS hybrid monolithic silica capillary
columns were successfully prepared, which can provide higher column efficiency while
maintaining a similar retention factor in RPLC compared to the MTMS/TMOS hybrid column
prepared previously [50].
As another approach, the effect of hydrothermal treatment with urea, contributing to change
of mesoporosity in monolithic silica, was examined, as shown in Section 6.3. Decreasing
mesopore size of monolithic silica leads to a larger surface area resulting in a larger amount of
ODS groups, as confirmed by elemental analysis, which is directly related to an increase in
retention factor in RPLC. Consequently, by applying the hydrothermal treatment at 80 °C for
15 hours, it was confirmed that the monolithic silica columns can provide a larger retention
factor for a small molecule without significant loss of column efficiency compared to the
columns prepared with additional hydrothermal treatment at 120 °C for 3‒4 hours, which has
been often carried out in the previous publications [46‒50, 60]. This hydrothermal treatment
at 80 °C for 15 hours will be expected to increase separation efficiency for small molecules
with respect to retention factors, as predicted in Section 2.2 (see Eq. (2.19)).
In addition, the contributions of methyl groups provided by MTMS to retention factors and
such a separation factor as α(T/O) were detected significantly in this thesis. The characterization
methods of monolithic silica rods, i.e. IR adsorption spectroscopy, elemental analysis were
useful to examine the hybrid monolithic silica, confirming that methyl groups can be inserted
into the hybrid materials quantitatively. These results demonstrate that retention ability and
selectivity for solutes in HPLC are not only derived from bonded stationary phase introduced by
surface modification, but also strongly correlate with the nature of a hybrid silica material. It
will be interesting to introduce a variety of silica precursors for preparing hybrid monolithic
silica materials, to result in the characteristic retention behaviours and separation selectivity.
Moreover, to enhance column performance regarding the separation selectivity and retention

Chapter 7
- 111 -
ability, developments of stationary phase with respect to surface modification method will be
necessary for monolithic silica columns.
As a further objective, it is to achieve the preparation of a monolithic silica column that
will provide higher column efficiency at a relatively low maximum pressure system (≤ 40
MPa) compared to a column packed with sub-3 μm fused-core shell silica particles or sub-2
μm silica particles used in UHPLC. To meet such a demand, it will be essential to improve
the structural homogeneity of monolithic silica with small domain size below 2.5 μm, which
is supposed to be due to the improvement of the preparation conditions, as suggested in this
thesis. Regarding the characterization of monolithic silica structure, it is fundamental to
employ SEM and mercury intrusion porosimety for examining the structural homogeneity of
monolithic silica materials, as shown in this thesis. Additionally, the characterization such as
CLSM and capillary flow porosimetry will be required to investigate the structural
homogeneity of monolithic silica capillary columns quantitatively [84, 120, 127, 128].
Furthermore, it is crucial to control the structural shrinkage of monolithic silica in a
capillary, as mentioned in Section 1.1. In general, column efficiency tends to become lower
with increasing the column diameter of monolithic silica capillary [54]. It is important to
prepare a monolithic silica capillary column with a large column diameter (e.g. an I.D. of
530 μm) without any significant loss of column efficiency in comparison with a monolithic
silica column with an I.D. of 100 μm or smaller. To attain the aforementioned objective, it
will be vital to investigate preparation conditions, including selection of silica precursors.

Chapter 8
- 112 -
8 Acknowledgements
The present investigations have been performed in the Institute of Physical Chemistry,
Justus-Liebig-Universität Giessen.
In particular, the author wishes to express his grateful and sincere gratitude to Prof. Dr. B.
M. Smarsly for his support, his patience and useful discussions. The author is grateful to Prof.
Dr. J. Janek for supporting the present study.
The author is sincerely grateful to Prof. Dr. U. Tallarek in Philipps-Universität Marburg for
helpful discussions and being reviewer of this thesis. Furthermore, the author is indebted to
Prof. Dr. N. Tanaka and co-workers in Kyoto institute of technology for their supports and
encouragements.
The author gratefully acknowledges Merck KGaA and Dr. K. Cabrera and co-workers for
financial assistance and supporting the present works.
The author gratefully thanks Mr. R. Meurer for the support by elemental analysis, Mrs. A.
Pospiech for help with IR adsorption spectroscopy, Mr. H. Wörner for performing Thermal
analysis, Dr. K. Peppler for the technical support of SEM measurement, and C. Weidmann for
the experimental assistance by nitrogen physisorption measurement.
The author wishes to express grateful thanks to C. Reiz, C. Suchomski, C. Weidmann, C.
Wessel, D. Stoeckel, K. Brezesinski, J. Haetage, L. Chuenchom, R. Ostermann, S. Mascotto,
S. Sallard, T. von Graberg, T. Brezesinski for supporting the present study. Thanks are offered
to all the other members in Prof. B. M. Smarsly’s laboratory for their kind corporation.

Chapter 9
- 113 -
9 Appendices
9.1 Chemicals and Instruments
9.1.1 Reagents for Preparation of Monolithic Silica
Silica precursor: Tetramethoxysilane (TMOS: MW = 152 (g/mol)) (Merck KGaA, Darmstadt,
Germany), methyltrimethoxysilane (MTMS: MW = 136 (g/mol)) (Dow Chemical, Midland,
Michigan, USA).
Polyethylene glycol (PEG): PEG (MW = 10000 (g/mol)) (Sigma-Aldrich, Taufkirchen, Germany),
PEG (MW = 10000 (g/mol)) (Merck KGaA).
Urea: Urea (MW = 60 (g/mol)) (Merck KGaA).
Acetic acid aqueous solution: A 0.01 M acetic acid aqueous solution was prepared with a 1 M
acetic acid aqueous solution (Sigma-Aldrich).
9.1.2 Reagents for Surface Modification
Octadecylsilylation: Octadecyldimethyl-N,N-diethylaminosilane (ODS-DEA: MW = 384 (g/mol))
(Merck KGaA)
Endcapping: N-(trimethylsilyl)imidazole (TMSI: MW = 140 (g/mol)) (Merck KGaA).
9.1.3 Solutes for Evaluation of Column Performance
(1) Standard smaples in RPLC: Thiourea (MW = 76 (g/mol)), uracil (MW = 112 (g/mol)), benzene
(MW = 78 (g/mol)), toluene (MW = 92 (g/mol)), ethylbenzene (MW = 106 (g/mol)), propylbenzene
(MW = 120 (g/mol)), butylbenzene (MW = 134 (g/mol)), pentylbenzene (MW = 148 (g/mol)),
hexylbenzene (MW = 162 (g/mol)), o-terphenyl (MW = 230 (g/mol)), triphenylene (MW = 228
(g/mol)) (≥ 98 %, Sigma-Aldrich).
(2) Peptides: Leucine-enkephalin acetate salt hydrate (MW = 555 (g/mol)), angiotensin II
human (MW = 1046 (g/mol)), insulin from bovine pancreas (MW = 5770 (g/mol)) (HPLC grade,
Sigma-Aldrich).
(3) Polystyrene standard samples for size exclusion chromatography : Polystyrene (MW = 580
(g/mol)), polystyrene (MW = 2000 (g/mol)), polystyrene (MW = 4000 (g/mol)) polystyrene
Chapter 9
- 114 -
(MW = 9000 (g/mol)), polystyrene (MW = 13000 (g/mol)), polystyrene (MW = 25000 (g/mol)),
polystyrene (MW = 35000 (g/mol)), polystyrene (MW = 50000 (g/mol)), polystyrene (MW = 100000
(g/mol)), polystyrene (MW = 170000 (g/mol)), polystyrene (MW = 233000 (g/mol)), polystyrene
(MW = 390000 (g/mol)), polystyrene (MW = 1600000 (g/mol)), polystyrene (MW = 2000000
(g/mol)), polystyrene (MW = 384000 (g/mol)) (GPC grade (GPC: Gel permeation chromatography),
Chemco, Osaka, Japan).
Polystyrene (MW = 474 (g/mol)), polystyrene (MW = 890 (g/mol)), polystyrene (MW = 1820
(g/mol)) polystyrene (MW = 3470 (g/mol)), polystyrene (MW = 9730 (g/mol)), polystyrene
(MW = 17600 (g/mol)), polystyrene (MW = 28000 (g/mol)), polystyrene (MW = 77000
(g/mol)), polystyrene (MW = 100000 (g/mol)), polystyrene (MW = 141000 (g/mol)), polystyrene
(MW = 229000 (g/mol)), polystyrene (MW = 321000 (g/mol)), polystyrene (MW = 633000
(g/mol)), polystyrene (MW = 1044000 (g/mol)), polystyrene (MW = 2190000 (g/mol)) (GPC
grade, Sigma-Aldrich).
Polystyrene (MW = 5858 (g/mol)), polystyrene (MW = 13648 (g/mol)), polystyrene (MW = 48900
(g/mol)) (GPC grade, Pressure Chemical Co., Pittsburgh, PA, USA).
9.1.4 Solvents for Measurement in HPLC
Pure water: Water purified by Milli-Q®
Advantage A 10 water purification systems (Merck
Millipore, Billerica, MA, USA).
Methanol: Methanol with HPLC grade (Roth GmbH, Karlsruhe, Germany).
Acetonitrile: Acetonitrile with HPLC grade (Roth GmbH).
Tetrahydrofuran (THF): THF with HPLC grade (Roth GmbH).
Trifluoroacetic acid (TFA): TFA (≥ 99 %, VWR international GmbH, Darmstadt, Germany).
9.1.5 Fused-Silica Capillary
Fused-silica capillary: Fused-silica capillaries with an I.D. of 100 μm in an outer diameter
(O.D.) of 360 μm, fused-silica capillaries with an I.D. of 30 μm in an outer diameter (O.D.) of
360 μm (Polymicro technologies, Phoenix, AZ, USA).

Chapter 9
- 115 -
9.1.6 Instruments for Preparation of Monolithic Silica
Thermo heater: Model ED (Julabo Labortechnik GmbH, Seelbach, Germany)
Oven: Nabertherm L9/11/S27, Nabertherm LT 15/13 (Nabertherm GmbH, Lilienthal, Germany).
9.1.7 HPLC Instruments
HPLC pump: L-7100 (Hitachi, Tokyo, Japan), LC-20AD (Simadzu, Kyoto, Japan).
Sample injector: Rheodyne 7125, Rheodyne 7725 (Rheodyne, Cotati, CA, USA).
UV detector: K-2501 (Knauer, Berlin, Germany), MU701 (GL Sciences, Tokyo, Japan),
CE-2075 (Jasco, Tokyo, Japan).
Data processor: EZChrom Elite (GL Sciences), D-7000 HSM (Hitachi).
9.1.8 Syringe Pump for Surface Modification
Syringe pump: KDS 100 syringe pump (KD Scientific, Holliston, MA, USA).
9.1.9 SEM Instruments
Scanning electron microcopy (SEM): Leo Gemini 982, MERIN FE-SEM (Carl Zeiss,
Oberkochen, Germany).
Sputtering coating: HHV Scancoat Six (Boc Edwards GmbH, Kirchheim, Germany).
9.1.10 Mercury Intrusion Porosimeter
Mercury intrusion porosimeter: PASCAL 140, PASCAL 400 (Thermo Fisher Scientific,
Waltham, MA, USA).
9.1.11 Nitrogen Physisorption Instruments
Nitrogen physisorption instrument: AUTOSORB-1, AUTOSORB-6 (Quantachrome,
Corporation, Boynton Beach, FL, USA).
9.1.12 Commission Analysis
IR adsorption spectrometer: IFS 25 (KBr tablet method), IFS 48 (ATR method) (Bruker
Optics GmbH, Ettlingen, Germany).
Thermal analysis instrument: STA 409 PC (Netzsch, Selb, Germany).
Elemental analyzer: Carlo Erba 1106 CHN-Analyzer (Thermo Fisher Scientific).
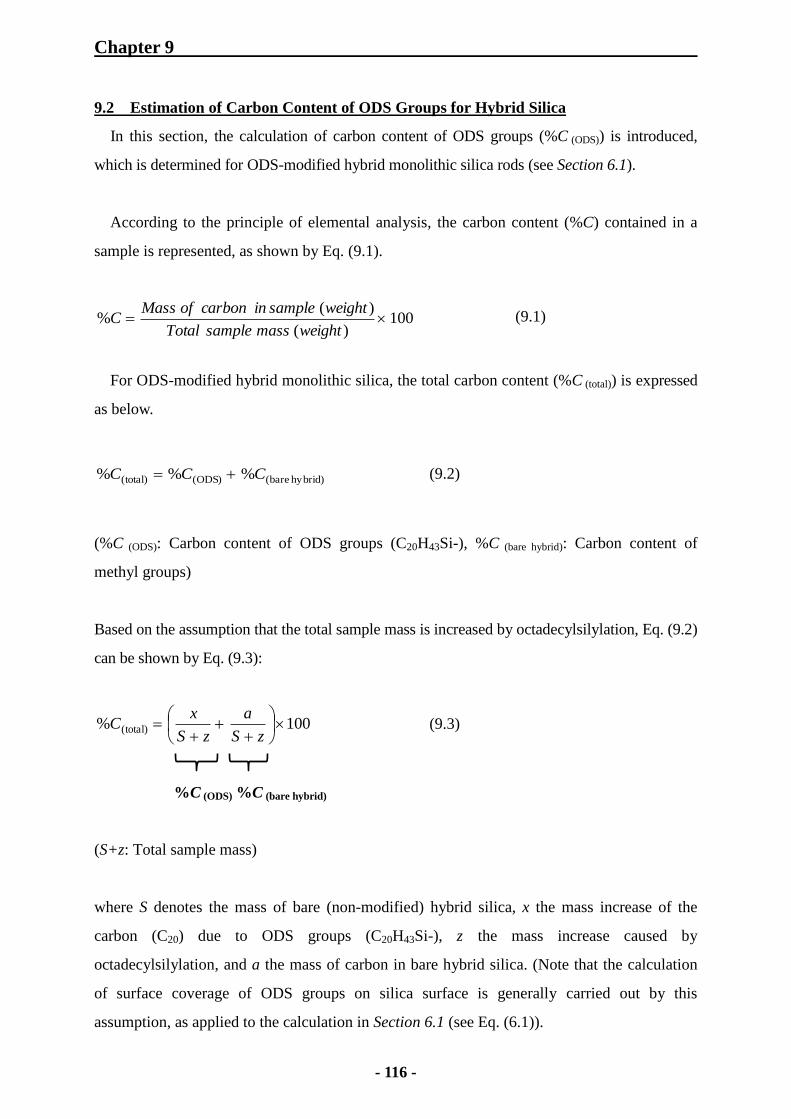
Chapter 9
- 116 -
9.2 Estimation of Carbon Content of ODS Groups for Hybrid Silica
In this section, the calculation of carbon content of ODS groups (%C (ODS)) is introduced,
which is determined for ODS-modified hybrid monolithic silica rods (see Section 6.1).
According to the principle of elemental analysis, the carbon content (%C) contained in a
sample is represented, as shown by Eq. (9.1).
(9.1)
For ODS-modified hybrid monolithic silica, the total carbon content (%C (total)) is expressed
as below.
hybrid)(bare(ODS)(total) %%% CCC (9.2)
(%C (ODS): Carbon content of ODS groups (C20H43Si-), %C (bare hybrid): Carbon content of
methyl groups)
Based on the assumption that the total sample mass is increased by octadecylsilylation, Eq. (9.2)
can be shown by Eq. (9.3):
100% (total)
zS
a
zS
xC
(9.3)
%C (ODS) %C (bare hybrid)
(S+z: Total sample mass)
where S denotes the mass of bare (non-modified) hybrid silica, x the mass increase of the
carbon (C20) due to ODS groups (C20H43Si-), z the mass increase caused by
octadecylsilylation, and a the mass of carbon in bare hybrid silica. (Note that the calculation
of surface coverage of ODS groups on silica surface is generally carried out by this
assumption, as applied to the calculation in Section 6.1 (see Eq. (6.1)).
100)(
)(%
weightmasssampleTotal
weightsampleincarbonofMassC
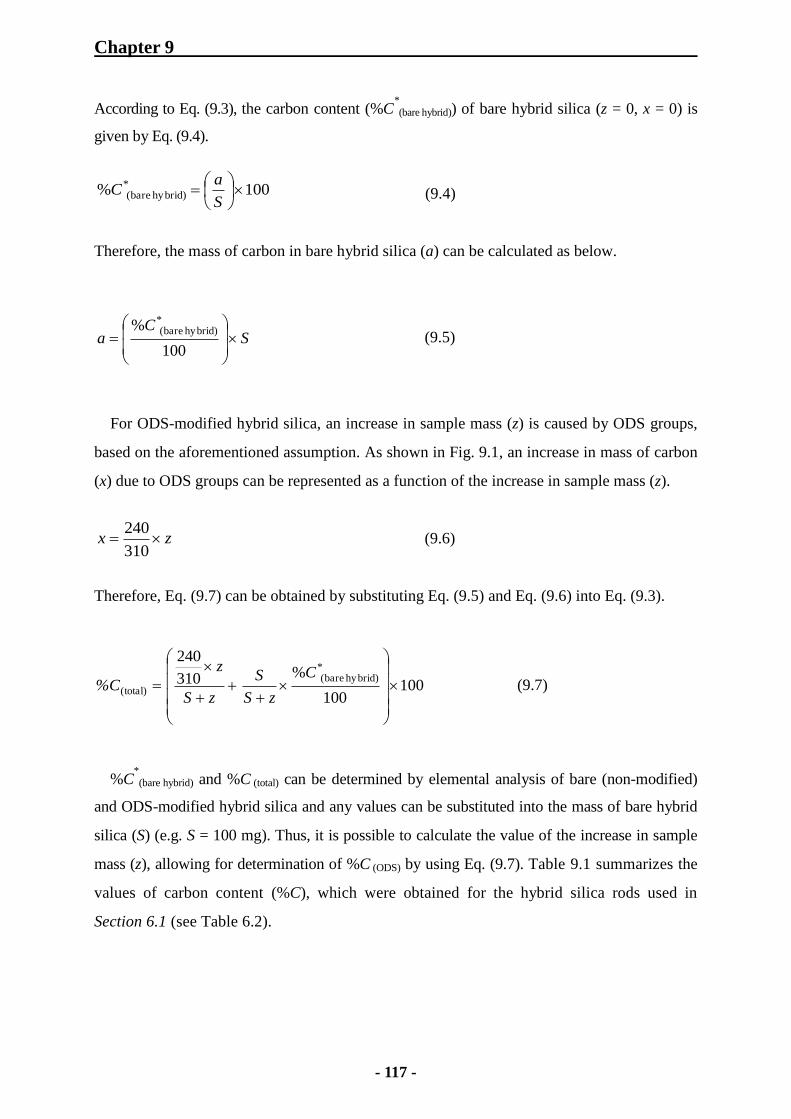
Chapter 9
- 117 -
According to Eq. (9.3), the carbon content (%C*(bare hybrid)) of bare hybrid silica (z = 0, x = 0) is
given by Eq. (9.4).
(9.4)
Therefore, the mass of carbon in bare hybrid silica (a) can be calculated as below.
(9.5)
For ODS-modified hybrid silica, an increase in sample mass (z) is caused by ODS groups,
based on the aforementioned assumption. As shown in Fig. 9.1, an increase in mass of carbon
(x) due to ODS groups can be represented as a function of the increase in sample mass (z).
(9.6)
Therefore, Eq. (9.7) can be obtained by substituting Eq. (9.5) and Eq. (9.6) into Eq. (9.3).
100100
%310
240
hybrid)(bare
(total)
*C
zS
S
zS
z
C% (9.7)
%C*(bare hybrid) and %C (total) can be determined by elemental analysis of bare (non-modified)
and ODS-modified hybrid silica and any values can be substituted into the mass of bare hybrid
silica (S) (e.g. S = 100 mg). Thus, it is possible to calculate the value of the increase in sample
mass (z), allowing for determination of %C (ODS) by using Eq. (9.7). Table 9.1 summarizes the
values of carbon content (%C), which were obtained for the hybrid silica rods used in
Section 6.1 (see Table 6.2).
zx 310
240
100% hybrid)(bare
S
aC*
SC
a
*
100
% hybrid)(bare

Chapter 9
- 118 -
Table 9.1
Carbon content determined for ODS-modified hybrid monolithic silica rods.
Silica rod %C*
(bare hybrid) a %C (total)
b %C (bare hybrid) %C (ODS)
Hybrid(15)-80-15h 2.4 25.5 1.7 23.8
Hybrid(15)-120-4h 2.3 17.6 1.8 15.8
Hybrid(25)-120-4h 4.0 20.8 3.1 17.7
a
Carbon content obtained for non-modified hybrid silica rods (experimental data).
b Carbon content obtained for ODS-modified hybrid silica rods (experimental data).
Fig. 9.1. Mass increase in monolithic silica by octadecylsilylation.

Chapter 9
- 119 -
9.3 References
[1] V. Smigol, F. Svec, Journal of Applied Polymer Science 46 (1992) 1439‒1448.
[2] U. D. Neue, HPLC Columns, Wiley-VCH, New York, 1997.
[3] M. Petro, F. Svec, J. M. J. Fréchet, Analytical Chemistry 69 (1997) 3131–3139.
[4] A. Ichida, T. Shibata, T. Okamoto, Y. Yuki, H. Namikoshi, Y. Toga, Chromatographia 19
(1984) 280‒284.
[5] Y. Okamoto, E. Yashima, Angewandte Chemie International. Edition 37 (1998) 1020–1043.
[6] C. Sulitzky, B. Rückert, A. J. Hall, F. Lanza, K. K. Unger, B. Sellergren, Macromolecules 35
(2002) 79‒91.
[7] O. Núňez, T. Ikegami, W. Kajiwara, K. Miyamoto, K. Horie, N. Tanaka, Journal of Chroma-
tography A 1156 (2007) 35–44.
[8] O. Shirota, Y. Ohtsu, O. Nakata, Journal of Chromatographic Science 28 (1990) 553‒558.
[9] http://hplc.shiseido.co.jp/e/, Homepage of Shiseido Company.
[10] J. J. Kirkland, Journal of Chromatography A 1060 (2004) 9‒21.
[11] C. R. Silva , S. Bachmann, R. R. Schefer , K. Albert , I. C. S. F. Jardim, C. Airoldi , Journal
of Chromatography A 948 (2002) 85‒95.
[12] A. Méndez, E. Bosch, M. Rosés , U. D. Neue, Journal of Chromatography A 986 (2003) 33–44.
[13] J. E. MacNair, K. C. Lewis, J. W. Jorgenson, Analytical Chemistry 69 (1997) 983–989.
[14] N. Wu, J. A. Lippert, M. L. Lee, Journal of Chromatography. A 911 (2001) 1‒12.
[15] J. S. Mellors, J. W. Jorgenson, Analytical Chemistry 76 (2004) 5441‒5450.
[16] www.waters.com/, Homepage of Waters Corporation.
[17] J. J. Kirkland, Analytical Chemistry 64 (1992) 1239–1245.
[18] J. J. Kirkland, F. A. Truszkowski, C. H. Dilks Jr., G. S. Engel, Journal of Chromatography A
890 (2000) 3–13.
[19] J. J. Kirkland, F. A. Truszkowski, R. D. Ricker, Journal of Chromatography A 965 (2002)
25‒34.
[20] J. J. Kirkland, T. J. Langlois, J. J. DeStefano, American Laboratory 39 (2007) 18‒21.
[21] http://www.sigmaaldrich.com, Homepage of Sigma-Aldrich.
[22] J. M. Cunliffe, T. D. Maloney, Journal of Separation Science 30 (2007) 3104–3109.
[23] F. Gritti, A. Cavazzini, N. Marchetti, G. Guiochon, Journal of Chromatography A 1157
(2007) 289–303.
[24] H. Minakuchi, K. Nakanishi, N. Soga, N. Ishizuka, N. Tanaka, Analytical Chemistry 68
(1996) 3498‒3501.

Chapter 9
- 120 -
[25] H. Minakuchi, K. Nakanishi, N. Soga, N. Ishizuka, N. Tanaka, Journal of Chromatography
A 762 (1997) 135‒146.
[26] H. Minakuchi, K. Nakanishi, N. Soga, N. Ishizuka, N. Tanaka, Journal of Chromatography
A 797 (1998) 121–131.
[27] K. Cabrera, D. Lubda, H. M. Eggenweiler, H. Minakuchi, K. Nakanishi, Journal of High
Resolution Chromatography 23 (2000) 93–99.
[28] K. Nakanishi, N. Tanaka, Accounts of Chemical Research 40 (2007) 863‒873.
[29] N. Tanaka, H. Kimura, D. Tokuda, K. Hosoya, T. Ikegami, N. Ishizuka, H. Minakuchi, K.
Nakanishi, Y. Shintani, M. Furuno, K. Cabrera, Analytical Chemistry 76 (2004) 1273–1281.
[30] P. Dugo, O. Favoino, R. Luppino, G. Dugo, L. Mondello, Analytical Chemistry 76 (2004)
2525‒2530.
[31] T. Ikegami, T. Hara, H. Kimura, H. Kobayashi, K. Hosoya, K. Cabrera, N. Tanaka, Journal
of Chromatography A 1106 (2006) 112–117.
[32] D. R. Stoll, X. Li, X. Wang, P. W. Carr, S. E. G. Porter, S. C. Rutan, Journal of Chromato-
graphy A 1168 (2007) 3‒43.
[33] K. Nakanishi, Journal of Porous Materials 4 (1997) 67–112.
[34] K. Morisato, S. Miyazaki, M. Ohira, M. Furuno, M. Nyudo, H. Terashima, K. Nakanishi,
Journal of Chromatography A 1216 (2009) 7384–7387.
[35] K. K. Unger, N. Tanaka, E. Machtejevas, Monolithic Silicas in Separation Science,Wiley-VCH,
Wienheim, 2011.
[36] http://www.merckmillipore.com, Homepage of Merck Millipore.
[37] K. Cabrera, LC GC: Magazine of Liquid and Gas Chromatography, April 1st, 2012.
[38] K. Hormann, T. Müller, S. Bruns, A. Hӧltzel, U. Tallarek, Journal of Chromatography A
1222 (2012) 46‒58.
[39] F. Gritti, G. Guiochon, Journal of Chromatography A 1225 (2012) 79–90.
[40] A. Maruska, C. Ericson, A. Vegvari, S. Hjerten, Journal of Chromatography A 837 (1999)
83‒91.
[41] I. Gusev, X. Huang, C. Horvath, Journal of Chromatography A 855 (1999) 273–290.
[42] E. C. Peters, F. Svec, J. M. J. Fréchet, Advanced Materials 11 (1999) 1169‒1181.
[43] K. Hosoya, N. Hira, K. Yamamoto, M. Nishimura, N. Tanaka, Analytical Chemistry 78
(2006) 5729–5735.
[44] G. Hasegawa, K. Kanamori, K. Nakanishi, S. Yamago, Polymer 52 (2011) 4644‒4647.
[45] S. D. Chambers, T. W. Holcombe, F. Svec, J. M. J. Fréchet, Analytical Chemistry 83 (2011)

Chapter 9
- 121 -
9478–9484.
[46] N. Ishizuka, H. Minakuchi, K. Nakanishi, N. Soga, K. Hosoya, N. Tanaka, Journal of High
Resolution Chromatography 21 (1998) 477‒479.
[47] N. Tanaka, H. Nagayama, H. Kobayahsi, T. Ikegami, K. Hosoya, N. Ishizuka, H. Minakuchi,
K. Nakanishi, K. Cabrera, D. Lubda, Journal of High Resolution Chromatography 23
(2000) 111–116.
[48] N. Ishizuka, H. Minakuchi, K. Nakanishi, N. Soga, H. Nagayama, K. Hosoya, N. Tanaka,
Analytical Chemistry 72 (2000) 1275‒1280.
[49] N. Tanaka, H. Kobayashi, K. Nakanishi, H. Minakuchi, N. Ishizuka, Analytical Chemistry
73 (2001) 420A–429A.
[50] M. Motokawa, H. Kobayashi, N. Ishizuka, H. Minakuchi, K. Nakanishi, H. Jinnai, K. Hosoya,
T. Ikegami, N. Tanaka, Journal of Chromatography A 961 (2002) 53‒63.
[51] K. Kanamori, K. Nakanishi, T. Hanada, Journal of Separation Science 29 (2006) 2463‒2470.
[52] H. Dong, R. Reidy, J. D. Brennan, Chemistry of Materials 17 (2005) 2807–2816.
[53] H. Dong, M. A. Brook, J. D. Brennan, Chemistry of Materials 17 (2005) 6012–6017.
[54] M. Motokawa, M. Ohira, H. Minakuchi, K. Nakanishi, N. Tanaka, Journal of Separation
Science 29 (2006) 2471‒2477.
[55] K. Miyamoto, T. Hara, H. Kobayashi, H. Morisaka, D. Tokuda, K. Horie, K. Koduki, S.
Makino, O. Núnez, C. Yang, T. Kawabe, T. Ikegami, H. Takubo, Y. Ishihama, N. Tanaka,
Analytical Chemistry 80 (2008) 8741–8750.
[56] H. Eghbali, K. Sandra, F. Detobel, F. Lynen, K. Nakanishi, P. Sandra, G. Desmet, Journal
of Chromatography A 1218 (2011) 3360–3366.
[57] K. Horie, Y. Sato, T. Kimura, T. Nakamura, Y. Ishihama,Y. Oda, T. Ikegami, N. Tanaka,
Journal of Chromatography A 1228 (2012) 283‒291.
[58] M. Iwasaki, S. Miwa, T. Ikegami, M. Tomita, N. Tanaka, Y. Ishihama, Analytical Chemistry
82 (2010) 2616‒2620.
[59] M. Iwasaki, N. Sugiyama, N. Tanaka, Y. Ishihama, Journal of Chromatography A 1228
(2012) 292–297.
[60] T. Hara, H. Kobayashi, T. Ikegami, K. Nakanishi, N. Tanaka, Analytical Chemistry 78
(2006) 7632–7642.
[61] J. C. Giddings, Dynamics of Chromatography, Marcel Dekker, New York, London, 1965.
[62] J. H. Knox, Journal of Chromatography A 831 (1999) 3‒15.
[63] A. M. Siouffi, Journal of Chromatography A 1126 (2006) 86–94.
[64] F. Gritti, G. Guiochon, Journal of Chromatography A 1216 (2009) 4752‒4767.
Chapter 9
- 122 -
[65] H. Poppe, Journal of Chromatography A 778 (1997) 3–21.
[66] D. V. McCalley, Journal of Chromatography A 1218 (2011) 2887‒2897.
[67] F. Gritti, T. Farkas, J. Heng, G. Guiochon, Journal of Chromatography A 1218 (2011)
8209–8821.
[68] F. C. Leinweber, U. Tallarek, Journal of Chromatography A 1006 (2003) 207‒228.
[69] P. Gzil, N. Vervoort, G. B. Baron, G. Desmet, Analytical Chemistry 76 (2004) 6707‒6718.
[70] G. Desmet, D. Clicq, P. Gzil, Analytical Chemistry 77 (2005) 4058–4070.
[71] J. Billen, P. Gzil, G. Desmet, Analytical Chemistry 78 (2006) 6191‒6201.
[72] K. Miyabe, A. Cavazzini, F. Gritti, M. Kele, G. Guiochon, Analytical Chemistry 75
(2003) 6975–6986.
[73] K. Miyabe, Journal of Separation Science 32 (2009) 6975‒6986.
[74] G. Guiochon, Journal of Chromatography A 1168 (2007) 101–168.
[75] P. Aggarwal, H. D. Tolley, M. L. Lee, Journal of Chromatography A 1219(2012) 1‒14.
[76] T. Ikegami, E. Dicks, H. Kobayashi, H. Minakuchi, D. Tokuda, K. Cabrera, K. Hosoya,
N. Tanaka, Journal of Separation of Science 27 (2004) 1292–1302.
[77] D. Lubda, W. Lindner, M. Quaglia, C. D. von Hohenesche, K. K. Unger, Journal of Chroma-
tography A 1083 (2005) 14–22.
[78] S. Altmaier, K. Cabrera, Journal of Separation of Science 31 (2008) 2551.
[79] R. Skudas, B. A. Grimes, M. Thommes, K. K. Unger, Journal of Chromatography A 1216
(2009) 2625‒2636.
[80] J. Courtois, M. Szumski, F. Georgsson, K. Irgum, Analytical Chemistry 79 (2007) 335‒344.
[81] K. Kanamori, K. Nakanishi, K. Hirao, H. Jinnai, Langmuir 19 (2003) 5581–5585.
[82] N. Vervoort, H. Saito, K. Nakanishi, G. Desmet, Analytical Chemistry 77 (2005) 3986‒3992.
[83] D. Hlushkou, S. Bruns, U. Tallarek, Journal of Chromatography A 1217 (2010) 3674–3682.
[84] S. Bruns, T. Müller, M. Kollmann, J. Schachtner, A. Höltzel, U. Tallarek, Analytical
Chemistry 82 (2010) 6569–6575.
[85] K. Nakanishi, R. Takahashi, T. Nagakane, K. Kitayama, N. Koheiya, H. Shikata, N.
Soga, Journal of Sol-Gel Science and Technology 17 (2000) 191‒210.
[86] A. Galarneau, J. Iapichella, D. Brunel, F. Fajula, Z. Bayram-Hahn, K. Unger, G. Puy, C.
Demesmay, J. Rocca, Journal of Separation Science 29 (2006) 844–855.
[87] R. Finsy, Langmuir 20 (2004) 2975‒2976.
[88] A. C. Pierre, Introduction to Sol-Gel Processing, Kluwer Academic Publishers Group,
Dordrecht, 1998.
[89] J. D. Wright, N. A. J. M. Sommerdijk, Sol-Gel Materials: Chemistry and applications, CRC

Chapter 9
- 123 -
Press, Boca Raton, 2001.
[90] H. Morisaka, K. Kobayashi, A. Kirino, M. Furuno, H. Minakuchi, M. Ueda, Journal of
Separation Science 32 (2009) 2747–2751.
[91] L. G. Aggebrandt, O. Samuelson, Journal of Applied Polymer Science 8 (1964) 2801‒2812.
[92] I. Halász, K. Martin, Angewandte Chemie International. Edition 17 (1978) 901–908.
[93] J. H. Knox, H. P. Scott, Journal of Chromatography 316 (1984) 311‒332.
[94] H. Guan, G. Guiochon, Journal of Chromatography A 731 (1996) 27–40.
[95] Y. Yao, A. M. Lenhoff, Journal of Chromatography A 1037 (2004) 273‒282.
[96] M. Al-Bokari, D. Cherrak. G. Guiochon, Journal of Chromatography A 975 (2002) 275–284.
[97] M. Thomas, R. Skudas, K. Unger, D. Lubda, Journal of Chromatography A 1191 (2008)
57‒66.
[98] G. Puy, R. Roux, C. Demesmay, J. Rocca, J. Iapichella, A. Galarneau, D. Brunel, Journal of
Chromatography A 1160 (2007) 150–159.
[99] J. Cases, R. P. W. Scott, Chromatography Theory, Marcel Dekker, New York, 2002.
[100] C. J. Brinker, G. W. Scherer, SOL-GEL SCIENCE, The Physics and Chemistry of Sol-Gel
Processing, Academic Press, New York.
[101] J. Konishi, K. Fujita, K. Nakanishi, K. Hirao, Chemistry of Materials 18 (2006) 6069‒6074.
[102] T. Tanaka, H. Yamashita, 固体表面キャラクタリゼーションの実際 (Japanese book),
Koudansha Scientific, Tokyo, 2005.
[103] http://www.an.shimadzu.co.jp, Homepage of Shimadzu Corporation.
[104] K. S. W. Sing, D. H. Everett, R. A. W. Haul, L. Moscou, R. A. Pierotti, J. Rouquerol, T.
Siemieniewska, Pure and Applied Chemistry 57 (1985) 603–619.
[105] J. Coates, Encyclopedia of Analytical Chemistry, Interpretation of Infrared Spectra, A
Practical Approach, John Wiley & Sons Ltd, Chichester, 2000.
[106] R. M. Silverstein, F. X. Webster, Spectrometric Identification of Organic Compounds Six
Edition (Japanese), Tokyo Kagaku Doujin, Tokyo, 1998.
[107] http://shop.perkinelmer.com, Homepage of Perkinelmer.
[108] http://www.siint.com, Homepage of Seiko Instruments Inc. Nanotechnology.
[109] P. Qian, Computer and Chemistry 24 (2000) 627‒633.
[110] G. Q. Lu, X. S. Zhao, M. Thommes, Nanoporous Materials: Science and Engineering,
Imperial College Press, Chapter 11, 2004.
[111] M. Thommes, Wiley-VCH, Characterization of Nanoporous Materials, Chemie Ingenieur
Technik, Weinheim, 2010.
[112] T. Hara, S. Mascotto, C. Weidmann, B. M. Smarsly, Journal of Chromatography A 1218
(2011) 3624‒3635.
[113] Y. Yan, Y. Hoshino, Z. Duan, S. R. Chaudhuri, A. Sarkar, Chemistry of Materials 9 (1997)
Chapter 9
- 124 -
2583–2587.
[114] D. Y. Nadargi, A. V. Rao, Journal of Alloys and Compounds 467 (2009) 397‒404.
[115] H. El Rassy, A. C. Pierre, Journal of Non-Crystalline Solids 351 (2005) 1603–1610.
[116] Z. Zhang, Y. Tanigami, R. Terai, H. Wakabayashi, Journal of Non-Crystalline Solids 189
(1995) 212‒217.
[117] M. Krihak, M. R. Shahriari, Optical Materials 5 (1996) 301–310.
[118] S. D. Bhagat, C. Oh, Y. Kim, Y. Ahn, J. Yeo, Microporous and Macroporous Materials
100 (2007) 350‒355.
[119] B. Buszewskib, D. Berek, J. Garaj, I. Novak, Z. Suprynowicz, Journal of Chromatography
446 (1988) 191–201.
[120] S. Burns, T. Hara, B. M. Smarsly, U. Tallarek, Journal of Chromatography A 1218 (2011)
5187‒5194.
[121] R. Endele, I. Halász, K. K. Unger, Journal of Chromatography A 99 (1974) 377–393.
[122] K. Kimata, K. Iwaguchi, S. Onishi, K. Jinno, R. Eksteen, K. Hosoya, M. Araki, N. Tanaka,
Journal of Chromatography Science 27 (1989) 721–728.
[123] K. Jinno, T. Nagoshi, N. Tanaka, M. Okamoto, J. C. Feetzer, W.R. Biggs, Journal of Chro-
matography 392 (1987) 75‒82.
[124] N. Tanaka, K. Sakagami, M. Araki, Journal of Chromatography 199 (1980) 327–337.
[125] H. Kobayashi, W. Kajiwara, Y. Inui, T. Hara, K. Hosoya, T. Ikegami, N. Tanaka, Chroma-
tographia 60 (2005) S19‒S24.
[126] S. Laschober, E. Rosenberg, Journal of Chromatography A 1191 (2008) 282–291.
[127] Y. Fang, H. D. Tolley, M. L. Lee, Journal of Chromatography A 1217 (2010) 6405‒6412.
[128] P. Aggarwal, H. D. Tolley, M. L. Lee, Analytical Chemistry 84 (2012) 247‒254.
[129] F. Gritti, G. Guiochon, Analttical Chemistry 78 (2006) 5329–5347.
[130] R. C. Chambers, W. E. Jones, Y. Haruvy, S. E. Webber, M. A. Fox, Chemistry of Materials
5 (1993) 1481‒1486.
[131] P. W. Carr, X. Wang, Analytical Chmeistry 81 (2009) 5342–5353.
[132] K. Broeckhoven, D. Cabooter, S. Eeltink, G. Desmet, Journal of Chromatography A 1228
(2012) 20–30.
[133] S. Miyazaki, M. Takahashi, M. Ohira, H. Terashima, K. Morisato, K. Nakanishi, T. Ikegami,
K. Miyabe, N. Tanaka, Journal of Chromatography A 1218 (2011) 1988‒1994.
[134] J. J. Kirkland, Journal of Chromatography 125 (1976) 231–250.
[135] Y. Yao, A.M. Lenhoff, Journal of Chromatography A 1037 (2004) 273‒282.
[136] J. H. Knox, H.J. Ritchie, Journal of Chromatography A 387 (1987) 65–84.

Chapter 9
- 125 -
[137] C. Dauwe, S. Marme, GIT Laboratory Journal 3 (2002) 106‒109.
[138] S. Jung, S. Ehlert, M. Pattky, U. Tallarek, Journal of Chromatography A 1217 (2010)
696‒704.
[139] S. Jung, S. Ehlert, J. Mora, K. Kraiczek, M. Dittmann, G.P. Rozing, U. Tallarek, Journal
of Chromatography A 1216 (2009) 264–273.
[140] T. Hara, S. Makino, Y. Watanabe, T. Ikegamia, K. Cabrera, B. Smarsly, N. Tanaka, Journal
of Chromatography A 1217 (2010) 89‒98.
[141] M. E. Young, P. A. Carroad, R. L. Bell, Biotechnology and Bioengineering 22 (1980)
947–955.
[142] J. Li, P. W. Carr, Analytical Chemistry 69 (1997) 2530‒2536.
[143] S. Khirevich, A. Holtzel, A. Seidel-Morgenstern, U. Tallarek, Analytical Chemistry 81
(2009) 7057–7066.
[144] H. Kobayashi, D. Tokuda, J. Ichimaru, T. Ikegami, K. Miyabe, N. Tanaka, Journal of
Chromatography A 1109 (2006) 2–9.
Chapter 9
- 126 -
9.4 Abbreviations
A O
ATR (Attenuated total reflection) method O.D. (Outer diameter)
B ODS (Octadecyldimethylsilyl) group
BET (Brunauer-Emmett-Teller) equation
ODS-DEA(Octadecyldimethyl-N,N-dieth-
BJH (Barett-Joyner-Halenda) method
ylaminosilane)
C P
CLSM (Confocal laser scanning microscopy) PAHs (Polynuclear aromatic hydrocarbons)
CRT (Cathode-ray tube) PEEK (Poly(ether ether ketone))
D PEG (Polyethylene glycol)
DSC (Differential scanning calorimetry) PSD (Pore size distribution)
DTA (Differential thermal analysis) PSS (Polystyrene standard) sample
G PTFE (Polytetrafluoroethylene)
GC (Gas chromatography) R
GPC (Gel permeation chromatography) RPLC (Reversed-phase liquid chromatogra-
H phy)
HPLC (High performance liquid chromatography) RSD (Relative standard deviation)
I S
ICTAC (International Confederation for Thermal SEC (Size exclusion chromatography)
Analysis and Calorimetry) SEM (Scanning electron microscopy)
I.D. (Inner diameter) T
IR (Infrared) adsorption spectroscopy TCD (Thermal conductivity detector)
ISEC (Inverse size exclusion chromatography) TEM (Transmission electron microscopy)
IUPAC (International Union of Pure and Applied TFA (Trifluoroacetic acid)
Chemistry) THF (Tetrahydrofuran)
K TG (Thermogravimetry)
KBr (Potassium bromide) tablet method TMS (Trimethylsilyl) group
M TMSI (N-(Trimethylsilyl)imidazole)
MS (Mass spectrometry) TMOS (Tetramethoxysilane)
MTMS (Methyltrimethoxysilane) U
N UHPLC (Ultra high performance liquid
NLDFT (Non-Local Density Functional Theory) chromatography)