
Working Papers in Economics and Statistics
26
University of Innsbruck Working Papers in Economics and Statistics An "almost-too-late" warning mechanism for currency crises Jesus Crespo Cuaresma and Tomas Slacik 2007-10
Transcript of Working Papers in Economics and Statistics
University of Innsbruck
Working Papers in
Economics and Statistics
An "almost-too-late" warning mechanism for
currency crises
Jesus Crespo Cuaresma and Tomas Slacik
2007-10

University of Innsbruck Working Papers in Economics and Statistics The series is jointly edited and published by
- Department of Economics (Institut für Wirtschaftstheorie, Wirtschaftspolitik und Wirtschaftsgeschichte)
- Department of Public Finance (Institut für Finanzwissenschaft) - Department of Statistics (Institut für Statistik)
Contact Address: University of Innsbruck Department of Public Finance Universitaetsstrasse 15 A-6020 Innsbruck Austria Tel: +43 512 507 7151 Fax: +43 512 507 2970 e-mail: [email protected] The most recent version of all working papers can be downloaded at http://www.uibk.ac.at/fakultaeten/volkswirtschaft_und_statistik/forschung/wopec For a list of recent papers see the backpages of this paper.
An “Almost-Too-Late” WarningMechanism For Currency Crises∗
Jesus Crespo Cuaresma†
Tomas Slacik‡
Abstract
We propose exploiting the term structure of relative interest ratesto obtain estimates of changes in the timing of a currency crisis asperceived by market participants. Our indicator can be used to evaluatethe relative probability of a crisis occurring in one week as comparedto a crisis happening after one week but in less than a month. We giveempirical evidence that the indicator performs well for two importantcurrency crises in Eastern Europe: the crisis in the Czech Republic in1997 and the Russian crisis in 1998.
Keywords: Currency crisis, term structure of interest rates, transitioneconomies.
JEL classification: F31, F34, E43.
∗We would like to thank Raimund Alt, Peter Backe, Balazs Egert, Marcel Fratzscher,Doris Ritzberger-Gruenwald, Robert Kunst, Michael Lamla, Peter Mooslechner and partici-pants in an internal seminar at the Oesterreichische Nationalbank, in the Emerging MarketsWorkshop at the Bank of Finland and in the 11th International Conference on Macroeco-nomic Theory and Policy at the University of Crete for very helpful comments. The viewsexpressed in this paper are those of the authors and do not necessarily represent the positionof the Oesterreichische Nationalbank.
†Department of Economics, University of Innsbruck. Universitatstrasse 15, 6020 Inns-bruck (Austria). E-mail address: [email protected]
‡Oesterreichische Nationalbank, Foreign Research Division, Otto-Wagner-Platz 3,POB61, 1011 Vienna, (Austria). [email protected]
1
1 Introduction
The abundance and severity of currency crises and speculative attacks over thepast 15 years has spawned a rebirth of interest among researchers, politiciansand central bankers in these events. Currency crises tend to be painful andcostly for the affected economy and usually afflict the population immediately.Two recent cases illustrate this. The Argentine financial turmoil of 2002, one ofthe most violent currency crises on record, induced an increase in the povertyrate of more than 50% and drove nearly two out of three Argentines belowthe poverty line. The Indonesian crisis in 1998 caused a drop in GDP of morethan 13% within a year.
Considering the spectrum of distinct exchange rate arrangements, ranging fromtotally flexible exchange rates to monetary unions and currency boards, thereseems to be ample evidence that intermediate regimes such as fixed and crawl-ing pegs or fluctuation bands are most prone to speculative attacks. For thisreason, countries have increasingly abandoned intermediate regimes for ar-rangements at the extremes (see e.g. Fischer, 2001).1 Yet today an unravelingof current global imbalances threatens even a large economy with a flexibleexchange rate regime like the United States with abrupt and significant cur-rency depreciation (see Roubini and Setser, 2005). Admittedly, experts whoconsider this possibility as remote likely outnumber proponents of the viewthat the Bretton Woods 2 system of exchange rates is unsustainable (see e.g.Dooley et al, 2004; or Hausmann and Sturzenegger, 2005). However, thereare undoubtedly countries whose fundamental macroeconomic and/or polit-ical conditions make them vulnerable to a speculative attack. Hungary, forexample, which still maintains an intermediate exchange rate arrangement,was running a current account and fiscal deficit in 2005 roughly 2.5 timesgreater than Argentina before its devastating crisis hit.
Motivated by the damaging potential effects of currency crises, both the theo-retical and empirical literature has received renewed attention from researchers.Not only have new generations of currency crisis models been developed in re-sponse to unsatisfactory theoretical instruments to describe and explain causesand frequency of crises in the 1990s, economists have also started ponderingways to predict the timing of such events (e.g. both the Mexican crisis in 1994
1Notwithstanding the fact that de jure exchange rate regimes need not coincide with defacto ones (see Calvo and Reinhart, 2002).
2
and the Asian crisis in 1997 essentially caught the international communityflat-footed). Unfortunately, the forecasting models proposed over the past fewyears have generally demonstrated only fair-to-middling predictive accuracy.
Kaminsky, Lizondo and Reinhart (KLR) pioneered quantitative currency cri-sis early-warning systems (EWS) with their “indicator” model developed in aseries of papers (see Kaminsky, Lizondo and Reinhart, 1998). The KLR ap-proach monitors the evolution of several economic variables (indicators) suchthat when a variable deviates from its “normal” level beyond a threshold value,a signal is said to be issued. The threshold value is chosen so as to minimizethe noise-to-signal ratio given the data available. Eventually, a composite in-dicator is constructed as an average of indicators, weighted by frequency ofcorrect predictions.
Following KLR, academics and economists working in the private sector pro-duced a wide range of currency crisis forecasting models. Unlike the indicatorapproach, most are variations of logit or probit regressions. It is noteworthythat the vast majority of such models, including the KLR model, use funda-mental data such as current account, exchange rate overvaluation or exportgrowth as explanatory variables. The variable choices are predominantly in-spired by the three generations of theories of balance-of-payment crises, butthey tend to be limited by availability of data. The academic models tend tobe long-sight approaches with forecasting horizons of up to two years, whiletheir private-sector counterparts usually focus on a brief windows of one tothree months.
Berg et al. (2004) not only give a very helpful overview of the abundant litera-ture on EWS, they also address the question of how much, if any, out-of-sampleforecasting value derives from EWS. They put particular emphasis on the po-tential performance of models in real time and reach rather disappointing con-clusions. Only one of the long-horizon forecasts under consideration (the KLRmodel forecast) provides better accuracy compared with pure guesswork andnon-model based predictions, while short-horizon private-sector approaches byand large perform poorly. In contrast, Anzuini and Gandolfo (2003), whentesting whether the KLR would have forecast the Thai crisis of 1997, concludethe indicator approach has strong ex-post explanatory power but quite limitedpredictive abilities.
3
In this paper, we propose exploiting the term structure of relative interest ratesto obtain estimates of changes in the timing of a currency crisis as perceivedby market participants. To our knowledge, only a handful of researchers haveused this approach. The essence of our model is based on the seminal work byCollins (1984), who applied her analysis to the March 1983 devaluation of theFrench franc relative to the German Deutsche mark. The Collins approachwas also used in Anzuini and Gandolfo (2003), who compare the predictivepower of the KLR approach and the Collins model. They conclude that theCollins non-structural approach forecasts well but does not explain, while theopposite is true for the structural KLR model. This approach does not relyon the estimation of thresholds (eventually common to a group of countries)based on fundamentals, but instead extracts expectations on the timing of thecrisis from country-specific interest rate data. Compared with the KLR andother EWS, this approach has several important advantages. First, it requiresno definition of a crisis in terms of percentage devaluation/depreciation, whichtends to be rather arbitrary in the literature. Moreover, no pooling of data isnecessary to obtain a sample of a usable size. For each country in question,only its own specific data may be used. In addition, as the model uses onlyvery basic data such as interest and exchange rates; it is not heavily limited bydata availability. We construct an early warning indicator that can be used toevaluate the relative probability of a crisis occurring in one week as comparedto a crisis happening after one week but in less than a month. Subsequently,we provide empirical evidence that the indicator performs well for the currencycrises in the Czech Republic in 1997 and in Russia in 1998.
The paper is structured as follows. In the next section the theoretical modelis developed. In sections three and four, we apply the indicator to the crisis ofthe koruna and ruble crises in 1997 and 1998, respectively. Section 5 concludesand sets up paths of further research.
2 Uncovered interest rate parity and currency
crises
Recent research on the predictive power of markets suggests that markets arecapable to aggregate disperse information and that market-based forecasts areusually fairly accurate. Moreover, such forecasts typically outperform alterna-tive forecasting tools, including highly sophisticated forecasting models, polls
4
or expert surveys (see e.g. Wolfers and Zitzewitz, 2004). The basic objectiveof our analysis is to examine the ability of foreign exchange markets to foreseeexceptional exchange rate devaluations in fixed exchange rate arrangements.In substance, the following model is based on the work by Collins (1984) (seealso Anzuini and Gandolfo, 2003), designed to study the behavior of specu-lators prior to the French franc realignment in 1983. Our theoretical settingextends and generalizes the original one in several aspects.
The aim of our study is to construct an indicator based on basic economictheory (the uncovered interest rate parity, henceforth UIP) to proxy the changein the time structure of the underlying expected probabilities of devaluationimplied by the relative term structure of interest rates. Assuming perfectcapital mobility, risk neutrality and arbitrage, the UIP can be written as
(1 + it,k)
(1 + i∗t,k)=
E(et+k|Ωt)
et
+ ρt,k (1)
where et is the spot exchange rate at time t, defined as the price of foreigncurrency in domestic currency units, it,k and i∗t,k are, respectively, the domesticand foreign interest rates at time t on deposits with maturity k. E(et+k|Ωt)stands for the expected exchange rate in period t + k given the informationavailable at time t (the information set Ωt) and ρt,k represents a premium forrisks not immediately related to the exchange rate movements (e.g. countrydefault risk).2
Equation (1) states that the relative yield on domestic deposits of a givenmaturity is equal to the expected exchange rate movement and some welldefined country risk premium. Rewriting (1), we obtain
2In our specification the risk premium is assumed to be unrelated to the exchange rate.In certain cases, it may be reasonable to assume that the exchange rate level has an effecton the risk premium. For instance, if domestic debt is denominated mostly in the currencyof the foreign country, one might expect that after a substantial devaluation the probabilityof default and thus the risk premium in the domestic country would rise. This effect can beeasily incorporated in the model by specifying a functional form linking the exchange rateto the risk premium. If the relationship is assumed to be linear in the exchange rate with aslope that is not maturity-dependent, the results presented in this section remain unchanged.For a general functional specification of this relationship, the model could still be appliedafter calibrating some extra parameters. We do not follow this avenue in the present study,although this generalization is proposed as an interesting future path of research.
5
E(et+k|Ωt) =
[(1 + it,k)
(1 + i∗t,k)− ρt,k
]et . (2)
From the perspective of the market agent forming expectations in time t theexchange rate can either remain stable, appreciate or depreciate. Therefore,the exchange rate expected as of t for the period t + k is a weighted averageof these scenarios, where the weight assigned to each possible exchange ratemovement is the subjectively perceived probability of these events. Formally,this implies that
E(et+k|Ωt) = (1− πt,k)st,k + πt,kzt,k (3)
where zt,k is the expected exchange rate in period t + k in case of devaluation,zt,k = γt,ket, where γt,k > 1, and st,k is the expected exchange rate conditionalon no devaluation (in other words, the exchange rate remains stable or appre-ciates), st,k = δt,ket, where δt,k ≤ 1. The subjective probability of devaluationhaving occurred after k periods is therefore πt,k. In addition, along the lines ofCollins (1984), we shall assume that the rate of depreciation or appreciationdoes not depend on the temporal horizon, so that δt,k = δt and γt,k = γt. Itfollows that
E(et+k|Ωt) = [δt + (γt − δt)πt,k] et, (4)
which can be substituted in (2) so as to establish the link between relativeyields and the subjective devaluation probability:
αt,k = δt + (γt − δt)πt,k + ρt,k, (5)
where αt,k = (1 + it,k)/(1 + i∗t,k). The essential term in equation (5) is theperceived probability of a devaluation between time t and t + k, πt,k. Antic-ipating the empirical application of the method, we will restrict ourselves todevaluations occurring within each of the time intervals corresponding to thematurities of the available time deposits. If there are J−1 different maturitiesof deposits ordered from the shortest to the longest, there are J possible statesof the world at time t. An exceptional devaluation might occur before the timeimplied by the shortest maturity available, between maturities of deposits kand k + 1 or, finally, there might be a devaluation after the longest depositmatures. Defining as ηt,j the probability of a devaluation happening betweenperiod t + j − 1 and t + j,
6
πt,k =k∑
i=1
ηt,i, (6)
which implies that
αt,k − (δt + ρt,k)
(γt − δt)=
k∑
j=1
ηt,j. (7)
For the sake of illustration let us suppose that there are two maturities k = 7and k = 30 days (this will be the case in the empirical illustration in thefollowing section). Then, it can be easily shown that
ηt,7 =αt,7 − (δt + ρt,7)
(γt − δt), (8)
ηt,30 =αt,30 − αt,7 − (ρt,30 − ρt,7)
(γt − δt). (9)
By taking ratios or log-ratios of the expressions above, we can identify changesin the time structure of subjective probabilities of a devaluation implied bythe term structure of interest rates. Furthermore, the ratios are independentof the assumed size of the devaluation, γt. Assume an ordering of maturities,where the shortest one is normalized to one, the second shortest is two, andso on. In particular, the indicator proposed, Ij,s,t, aimed at comparing theprobabilities of devaluation at horizons j and s (j < s), corresponding to twoobserved maturities, is
Ij,s,t =
log(
αt,j−αt,j−1−(ρt,j−ρt,j−1)
αt,s−αt,s−1−(ρt,s−ρt,s−1)
)for j, s > 1,
log(
αt,j−(δt+ρt,j)
αt,s−αt,s−1−(ρt,s−ρt,s−1)
)for j = 1, s > 1.
(10)
In order to make (10) operational, the expected appreciation parameter, δt
and the respective risk premia for each maturity need to be imputed. If weassume that δt = 1 and ρt,i = 0 ∀i, (10) boils down to the expression putforward in Collins (1984). The problem with this setting is that it can lead tonegative probability estimates for empirical applications, and thus log-ratioswhich are not defined. The inclusion of risk premia and potential appreciationexpectations in (10) allows us to elaborate corrections of the basic indicator inorder to avoid negative probability ratios.
7
The problem of negative probability ratios is particularly important when deal-ing with data from Eastern European transition economies. Taking the simplecase without risk premium (i.e., setting ρt,s = 0 ∀s above) and δt = 1, it can beeasily seen that for a relatively flat yield curve in the domestic economy, if it,7tends to be higher than it,30, negative values can be obtained in the numeratorof (9). This constellation, caused by a downward-sloping yield curve in thedomestic economy, is not unusual in the recent history of Eastern Europeaneconomies, where sustained disinflationary experiences rendered a term struc-ture of interest rates with lower nominal interest rates in longer maturities.
A simple correction to the simple setting based on future expected inflationcan be put forward to link the setting including risk premium to a yield curvewhich is potentially negatively sloped. In a disinflationary framework, withE(∆pt,30|Ωt) < E(∆pt,7|Ωt), where ∆pt,g is the inflation rate for the periodt to t + g, we can correct the interest rate with longer maturity (we denotethe corrected rate by icorr.
t,30 ) by substracting (E(∆pt,30|Ωt)−E(∆pt,7|Ωt)) fromthe original rate, so that the corrected numerator of equation (9) for the casewithout risk premium is given by
αcorr.t,30 − αt,7 =
1 + icorr.t,30
1 + i∗t,30
− 1 + it,71 + i∗t,7
=
=1 + it,30 + E(∆pt,7|Ωt)− E(∆pt,30|Ωt)
1 + i∗t,30
− 1 + it,71 + i∗t,7
=
=1 + it,30
1 + i∗t,30
− 1 + it,71 + i∗t,7
+E(∆pt,7|Ωt)− E(∆pt,30|Ωt)
1 + i∗t,30
=
= αt,30 − αt,7 +E(∆pt,7|Ωt)− E(∆pt,30|Ωt)
1 + i∗t,30
.
In other words, ρt,7 and ρt,30 in equation (9) may be interpreted as, respectively,E(∆pt,7|Ωt)
1+i∗t,30and E(∆pt,30|Ωt)
1+i∗t,30if the basic setting is employed and long-maturity
interest rates are corrected for expected disinflation. In practice, this correctioncould be carried out for maturities of 7 and 30 days , for instance, by replacingE(∆pt,7|Ωt) with the realized inflation level at time t and using a time seriesmodel in order to obtain forecasts for ∆pt,30. In our empirical application wereport the results of such a correction based on inflation forecasts.
8
3 The warning mechanism in action in the Czech
and Russian currency crises
In this section, we apply the indicator put forward above to data from tworecent currency crises in Eastern Europe: the Czech Republic crisis in May1997 and the Russian crisis in 1998.3 In both cases, we describe the economicframework in which the currency crises took place and present the real-timeestimates of our indicator for both economies during the crisis period.
3.1 The 1997 crisis in the Czech Republic
In the early 1990s, the Czech Republic introduced a tight peg of the korunato the Deutsche mark (DM) and the US dollar (USD). The currency basketused was made up of 65% DM and 35% USD from May 1993. The peg hadfluctuation bands of ± 0.5% up to February 1996 and ± 7.5% from February1996 until the May 1997 crisis, which materialized with the abandonment ofthe peg on May 26, 1997 for a managed float regime. The trade balance inthe Czech Republic, which had been systematically positive since the break-upof Czechoslovakia, turned negative in 1996, with a corresponding slowing ofeconomic growth. Horvath (1999) interprets the current account deficit in theCzech Republic as a reflection of insufficient private savings, which, coupledwith the institutional framework of the Czech banking sector at that time,made the deficit unsustainable. Furthermore, the real exchange rate appreci-ated persistently and continuously in the period 1992-1997. Although trendappreciation is a common phenomenon in transition economies, which can be(at least partly) explained through the Balassa-Samuelson effect by differen-tial productivity increases, Begg (1998) and Horvath (1999) argue that thereal exchange rate dynamics implied a loss of competitiveness of the Czecheconomy. The adverse macroeconomic framework, together with an unstablepolitical environment, led to a speculative attack on the koruna and a changein the exchange rate regime in May 1997.
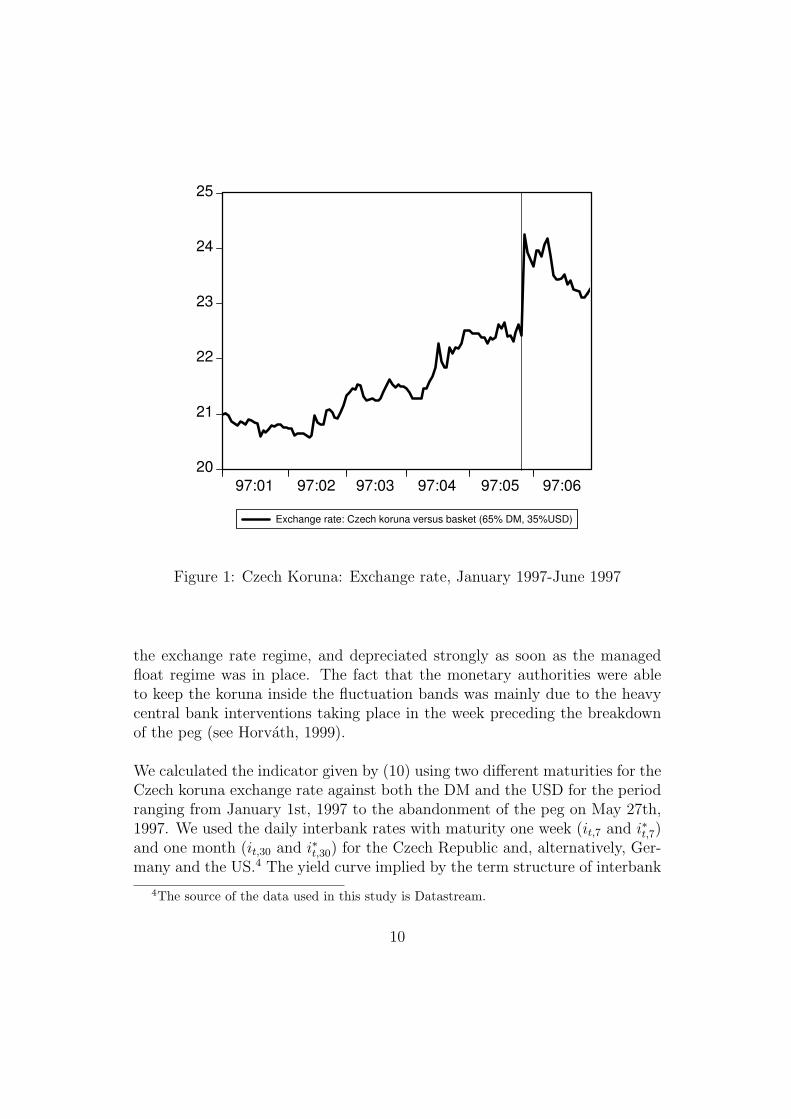
Figure 1 shows the daily exchange rate of the Czech koruna against the bas-ket in the period January-June 1997. The vertical line corresponds to theabandonment of the peg. As it can be seen in Figure 1, the exchange rateremained inside the ± 7.5% bands during the turmoil preceding the change in
3The choice of the crises is exclusively based on data availability.
9
20
21
22
23
24
25
97:01 97:02 97:03 97:04 97:05 97:06
Exchange rate: Czech koruna versus basket (65% DM, 35%USD)
Figure 1: Czech Koruna: Exchange rate, January 1997-June 1997
the exchange rate regime, and depreciated strongly as soon as the managedfloat regime was in place. The fact that the monetary authorities were ableto keep the koruna inside the fluctuation bands was mainly due to the heavycentral bank interventions taking place in the week preceding the breakdownof the peg (see Horvath, 1999).
We calculated the indicator given by (10) using two different maturities for theCzech koruna exchange rate against both the DM and the USD for the periodranging from January 1st, 1997 to the abandonment of the peg on May 27th,1997. We used the daily interbank rates with maturity one week (it,7 and i∗t,7)and one month (it,30 and i∗t,30) for the Czech Republic and, alternatively, Ger-many and the US.4 The yield curve implied by the term structure of interbank
4The source of the data used in this study is Datastream.
10
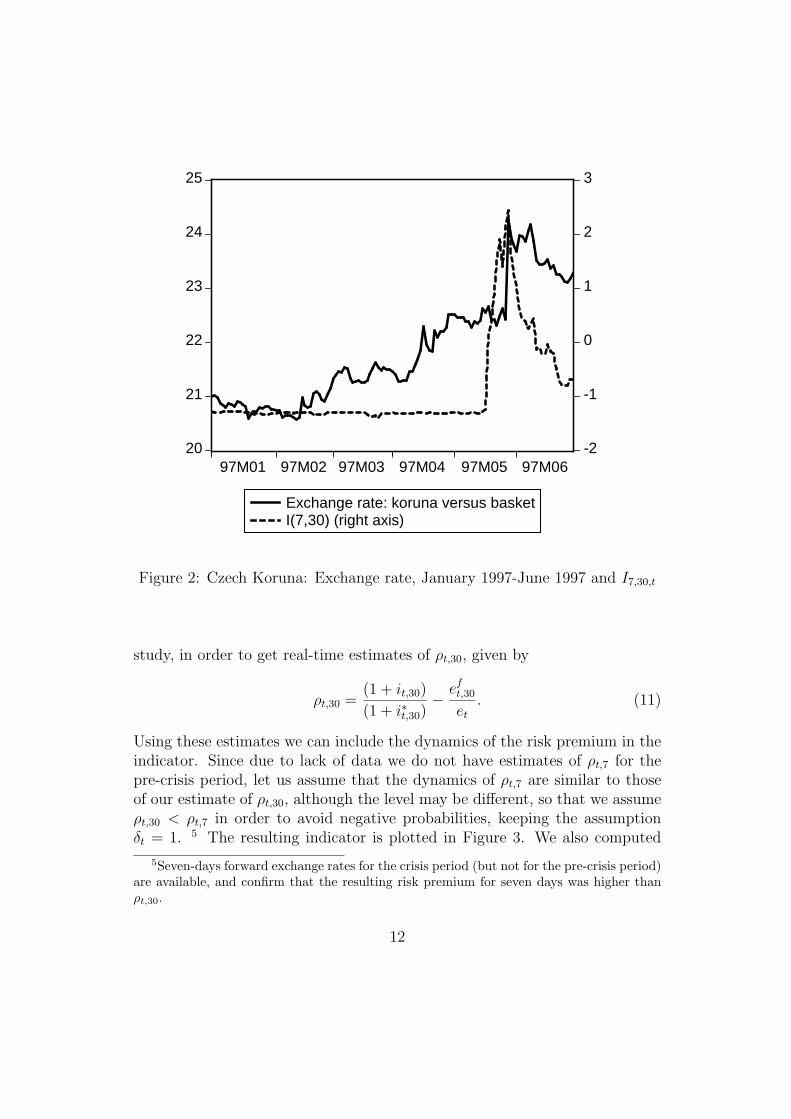
rates in the Czech Republic is downward-sloping for most of the sample. Ifwe were to obtain an indicator based on the assumptions imposed in Collins(1984) (that is, imposing δt = 1 and ρj = 0 ∀j in (10)), the results wouldimply negative values in the argument of the log-ratio corresponding to ηt,30,since αt,30 tends to be systematically smaller than αt,7 for the sample at hand.A possible way to overcome this problem would be to redesign the log-ratio ofprobabilities by adding a constant to the numerator and denominator of theexpressions in the log of (10) after setting ρt,i = 0 for all i. In our setting,this can be reconciled with the existence of a certain maturity structure inthe risk premium, such that, for example, ρt,j − ρt,j−1 = ρt,s − ρt,s−1 = c < 0∀j > 1, j < s. For the indicator related to the shortest maturity, appreciationexpectations (so that δ < 1) can also lead to the same type of correction. InFigure 2 we show the resulting indicator after adding 0.3 to the denomina-tor of the expression for I7,30,t in (10), so as to keep the structure of relativechanges in the original estimates of ηt,7 and ηt,30 but avoid negative relativeprobabilities. The results presented in Figure 2 correspond to using the USas the foreign economy, but are identical to those using Germany. The resultsare also qualitatively identical for constants different from 0.3, as long as theyavoid negative values in the argument of the log ratio. Furthermore, the re-sults are also similar if the indicator is constructed under the assumption thatk = 7 is not the shortest maturity.
Changes in the indicator can be interpreted as changes in the perceived proba-bility of a crisis occurring in the following week as compared to a crisis happen-ing in the period delimited by day seven and day thirty. The indicator remainspractically constant from January to mid-May, and starts increasing dramat-ically on May 16th, reflecting a strong change in the perceptions of investorson the potential timing of a devaluation. The increase is strong and sustaineduntil May 28th, and from that day onwards the indicator slowly decreases to alow level, comparable with the pre-crisis period. The indicator performs there-fore extraordinarily as a (very-)short-term indicator of the crisis, and could beused ex-post as a device for dating the de facto occurrence of the crisis (since,de jure, the change of the exchange rate regime would be the correspondingindicator).
Alternatively, we also made use of the daily one month forward rates (eft,30)
for the koruna/USD exchange rate, which are available for the period under
11
20
21
22
23
24
25
-2
-1
0
1
2
3
97M01 97M02 97M03 97M04 97M05 97M06
Exchange rate: koruna versus basketI(7,30) (right axis)
Figure 2: Czech Koruna: Exchange rate, January 1997-June 1997 and I7,30,t
study, in order to get real-time estimates of ρt,30, given by
ρt,30 =(1 + it,30)
(1 + i∗t,30)− ef
t,30
et
. (11)
Using these estimates we can include the dynamics of the risk premium in theindicator. Since due to lack of data we do not have estimates of ρt,7 for thepre-crisis period, let us assume that the dynamics of ρt,7 are similar to thoseof our estimate of ρt,30, although the level may be different, so that we assumeρt,30 < ρt,7 in order to avoid negative probabilities, keeping the assumptionδt = 1. 5 The resulting indicator is plotted in Figure 3. We also computed
5Seven-days forward exchange rates for the crisis period (but not for the pre-crisis period)are available, and confirm that the resulting risk premium for seven days was higher thanρt,30.
12
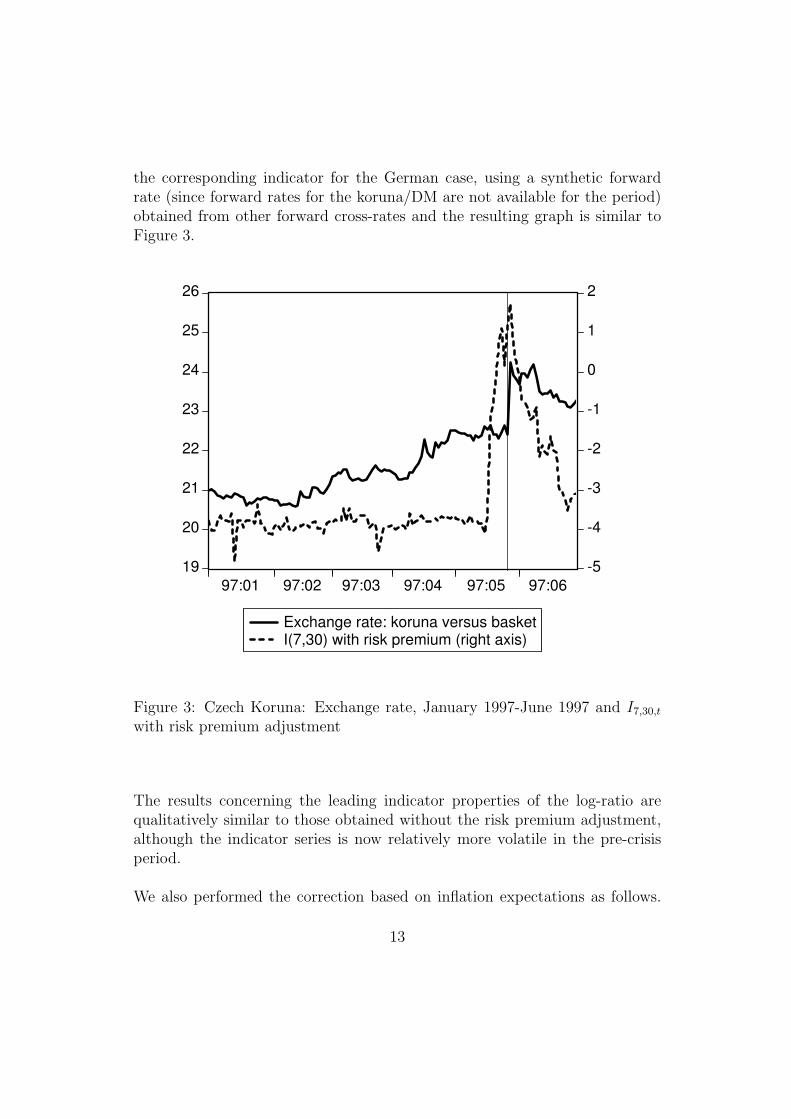
the corresponding indicator for the German case, using a synthetic forwardrate (since forward rates for the koruna/DM are not available for the period)obtained from other forward cross-rates and the resulting graph is similar toFigure 3.
19
20
21
22
23
24
25
26
-5
-4
-3
-2
-1
0
1
2
97:01 97:02 97:03 97:04 97:05 97:06
Exchange rate: koruna versus basketI(7,30) with risk premium (right axis)
Figure 3: Czech Koruna: Exchange rate, January 1997-June 1997 and I7,30,t
with risk premium adjustment
The results concerning the leading indicator properties of the log-ratio arequalitatively similar to those obtained without the risk premium adjustment,although the indicator series is now relatively more volatile in the pre-crisisperiod.
We also performed the correction based on inflation expectations as follows.
13
-20
0
20
40
60
80
100
120
1997:04 1997:05 1997:06
Standarized changes in the indicator (real time) and 5% critical value
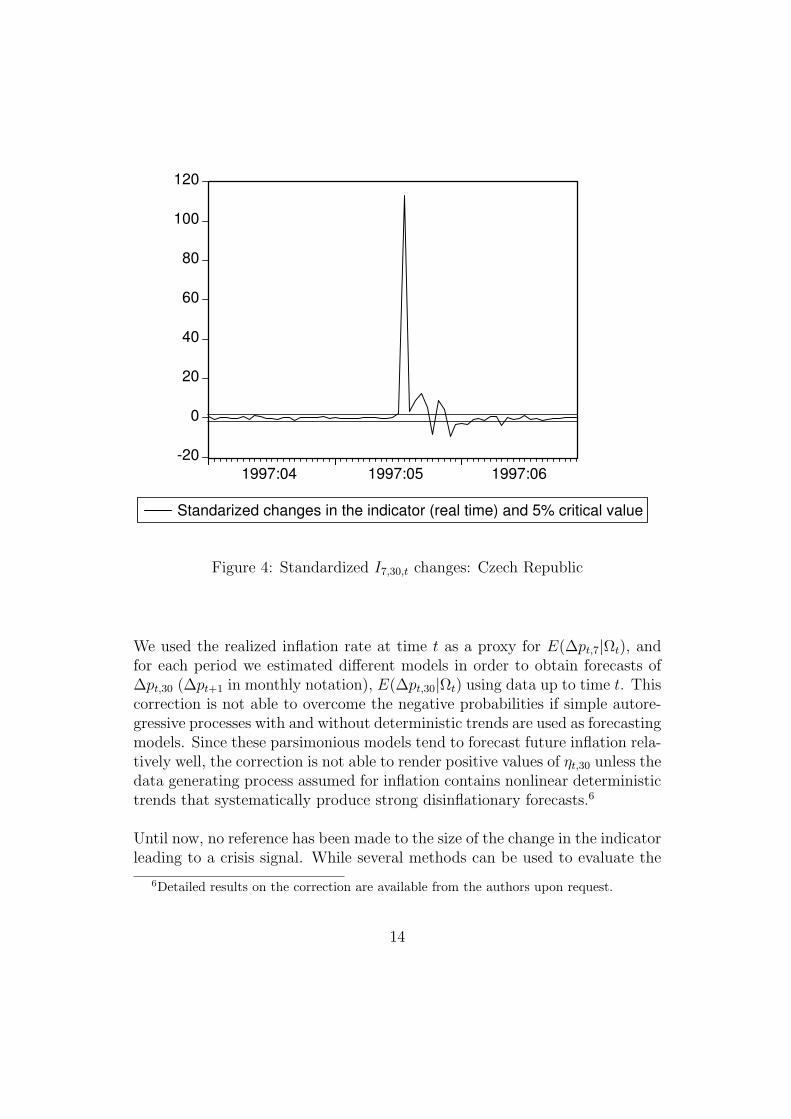
Figure 4: Standardized I7,30,t changes: Czech Republic
We used the realized inflation rate at time t as a proxy for E(∆pt,7|Ωt), andfor each period we estimated different models in order to obtain forecasts of∆pt,30 (∆pt+1 in monthly notation), E(∆pt,30|Ωt) using data up to time t. Thiscorrection is not able to overcome the negative probabilities if simple autore-gressive processes with and without deterministic trends are used as forecastingmodels. Since these parsimonious models tend to forecast future inflation rela-tively well, the correction is not able to render positive values of ηt,30 unless thedata generating process assumed for inflation contains nonlinear deterministictrends that systematically produce strong disinflationary forecasts.6
Until now, no reference has been made to the size of the change in the indicatorleading to a crisis signal. While several methods can be used to evaluate the
6Detailed results on the correction are available from the authors upon request.
14
threshold leading to significant signals, an extremely simple one based on thestandardization of changes in the indicator seems to perform well. In Figure 4we present the changes in the indicator at each period t standardized using theaverage change and standard deviation realized up to period t − 1. We startthe exercise in April 1997 based on indicator changes ranging from January1997 and we also plot the 5% critical values corresponding to a standard nor-mal distribution. The first significant change takes place on April 16th, andno false signal is sent before the crisis.
While the aim of the indicator proposed is to serve as a short-term leadingindicator for exchange rate crises, we study whether also in tranquil timesrelative changes of the indicator contain information about future changes inthe exchange rate. This will be done by performing a simple out-of-sampleforecasting exercise for the pre-crisis sample. The forecasting abilities of anautoregressive model on the first difference of the (log) exchange rate of theCzech koruna against the USD and the DM will be compared to those of asimple vector autoregressive (VAR) model including changes in the exchangerate and the indicator with risk premium adjustment.
The forecasting exercise is carried out as follows. Using data from January 1stto April 1st, 1997, an autoregressive model is estimated for the log changes inthe exchange rate, together with a VAR for the vector of log changes in theexchange rate and the first difference of the indicator. In both cases, the laglength of the model is chosen so as to minimize AIC for the sample. Usingthe estimated models, out-of-sample forecasts are obtained for 1 to 30 (work-ing) days ahead, and the forecasting errors are computed by comparing theforecasts with the real data. The observation corresponding to April 2nd isadded to the sample, the models are estimated again and new out-of-sampleforecasts are obtained. This procedure is repeated until all available observa-tions have been used. In our case, since we are interested in the informationalcontent of the indicator in the pre-crisis period, the full sample used rangesfrom January 1st to May 20th. With the forecasts, we compute the rootmean square forecasting error (RMSFE) for each forecasting horizon, defined
as RMSEh =√∑Nh
n=1(en − en)2/Nh, where Nh is the number of h-steps aheadforecasts computed, en is the actual value of the exchange rate and en is thecorresponding forecast.
Table 1 presents the results of the forecasting exercise. For each exchange
15
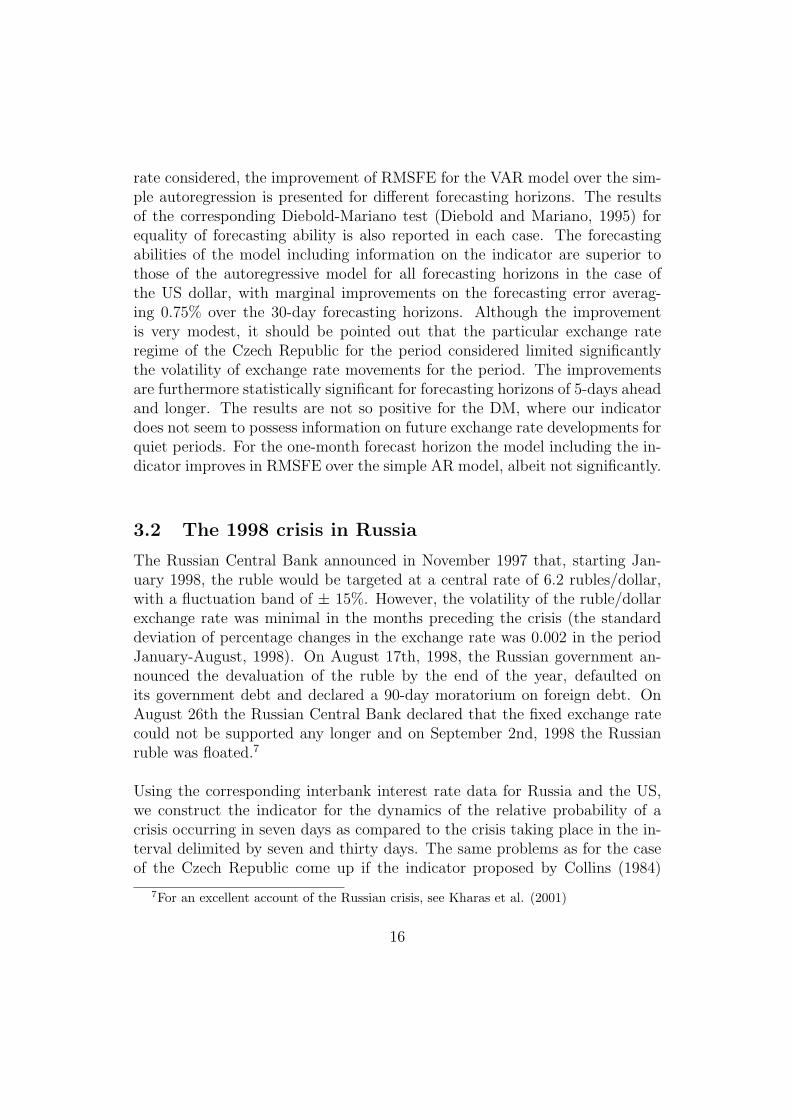
rate considered, the improvement of RMSFE for the VAR model over the sim-ple autoregression is presented for different forecasting horizons. The resultsof the corresponding Diebold-Mariano test (Diebold and Mariano, 1995) forequality of forecasting ability is also reported in each case. The forecastingabilities of the model including information on the indicator are superior tothose of the autoregressive model for all forecasting horizons in the case ofthe US dollar, with marginal improvements on the forecasting error averag-ing 0.75% over the 30-day forecasting horizons. Although the improvementis very modest, it should be pointed out that the particular exchange rateregime of the Czech Republic for the period considered limited significantlythe volatility of exchange rate movements for the period. The improvementsare furthermore statistically significant for forecasting horizons of 5-days aheadand longer. The results are not so positive for the DM, where our indicatordoes not seem to possess information on future exchange rate developments forquiet periods. For the one-month forecast horizon the model including the in-dicator improves in RMSFE over the simple AR model, albeit not significantly.
3.2 The 1998 crisis in Russia
The Russian Central Bank announced in November 1997 that, starting Jan-uary 1998, the ruble would be targeted at a central rate of 6.2 rubles/dollar,with a fluctuation band of ± 15%. However, the volatility of the ruble/dollarexchange rate was minimal in the months preceding the crisis (the standarddeviation of percentage changes in the exchange rate was 0.002 in the periodJanuary-August, 1998). On August 17th, 1998, the Russian government an-nounced the devaluation of the ruble by the end of the year, defaulted onits government debt and declared a 90-day moratorium on foreign debt. OnAugust 26th the Russian Central Bank declared that the fixed exchange ratecould not be supported any longer and on September 2nd, 1998 the Russianruble was floated.7
Using the corresponding interbank interest rate data for Russia and the US,we construct the indicator for the dynamics of the relative probability of acrisis occurring in seven days as compared to the crisis taking place in the in-terval delimited by seven and thirty days. The same problems as for the caseof the Czech Republic come up if the indicator proposed by Collins (1984)
7For an excellent account of the Russian crisis, see Kharas et al. (2001)
16
Exchange rate: Czech koruna/USDSteps ahead RMSFE difference Diebold-Mariano test Observ.
1 -1.271 % -0.705 345 -0.998 % -1.845∗∗ 3010 -0.408 % -1.687∗∗ 2515 -0.686 % -1.955∗∗ 2020 -0.757 % -2.496∗∗∗ 1525 -0.773 % -1.370∗ 1030 -1.267 % -3.474∗∗∗ 5
Exchange rate: Czech koruna/DMSteps ahead RMSFE difference Diebold-Mariano test Observ.
1 0.156 % 1.053 345 0.062 % 0.866 3010 0.052 % 0.679 2515 0.050 % 0.787 2020 0.027 % 0.509 1525 0.066 % 0.867 1030 -0.044 % -0.967 5
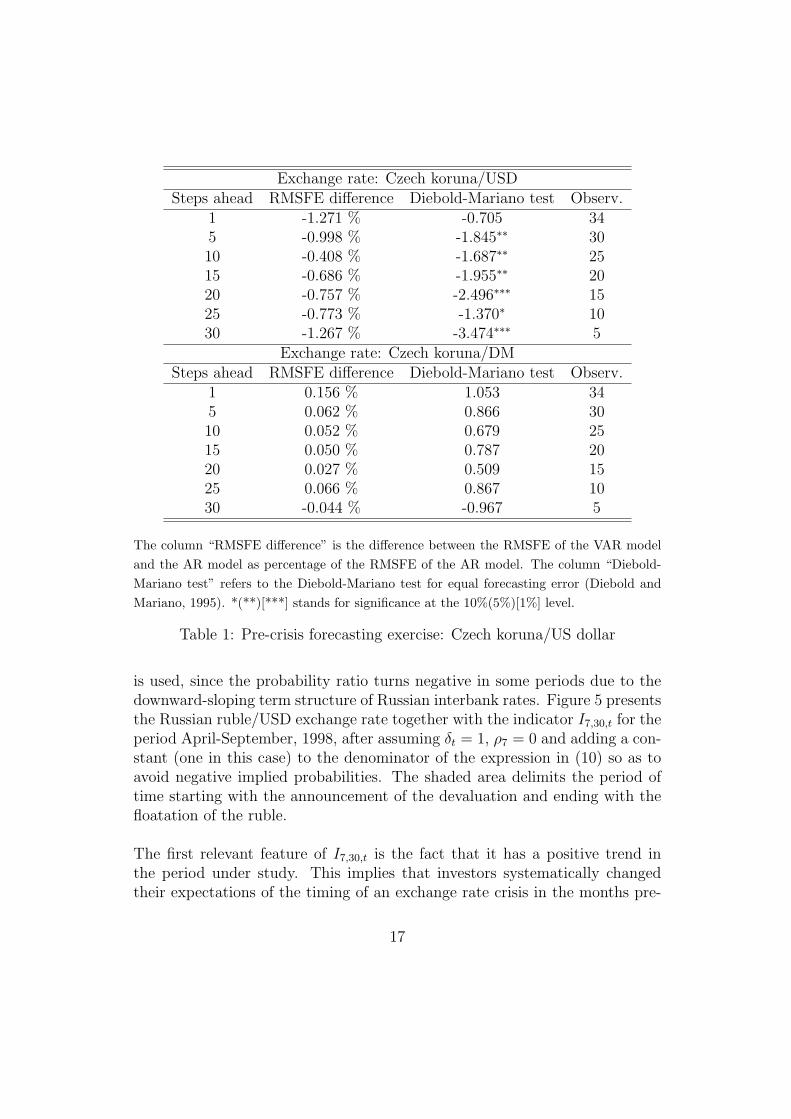
The column “RMSFE difference” is the difference between the RMSFE of the VAR modeland the AR model as percentage of the RMSFE of the AR model. The column “Diebold-Mariano test” refers to the Diebold-Mariano test for equal forecasting error (Diebold andMariano, 1995). *(**)[***] stands for significance at the 10%(5%)[1%] level.
Table 1: Pre-crisis forecasting exercise: Czech koruna/US dollar
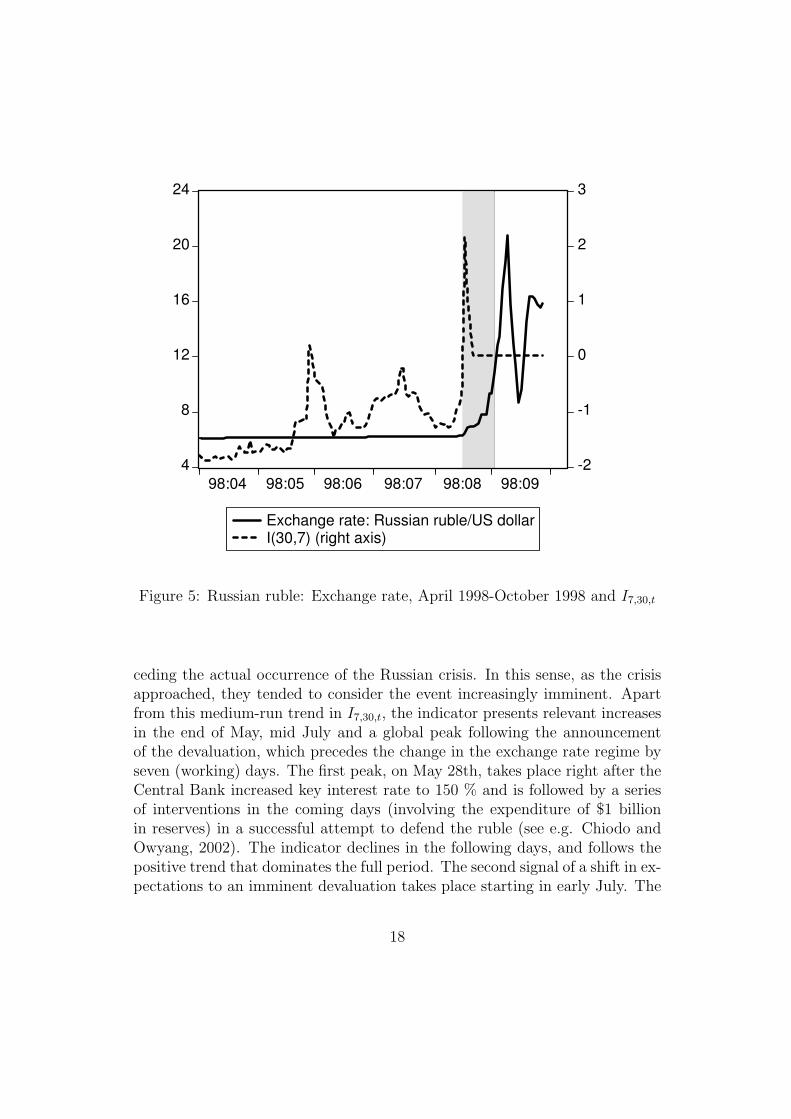
is used, since the probability ratio turns negative in some periods due to thedownward-sloping term structure of Russian interbank rates. Figure 5 presentsthe Russian ruble/USD exchange rate together with the indicator I7,30,t for theperiod April-September, 1998, after assuming δt = 1, ρ7 = 0 and adding a con-stant (one in this case) to the denominator of the expression in (10) so as toavoid negative implied probabilities. The shaded area delimits the period oftime starting with the announcement of the devaluation and ending with thefloatation of the ruble.
The first relevant feature of I7,30,t is the fact that it has a positive trend inthe period under study. This implies that investors systematically changedtheir expectations of the timing of an exchange rate crisis in the months pre-
17
4
8
12
16
20
24
-2
-1
0
1
2
3
98:04 98:05 98:06 98:07 98:08 98:09
Exchange rate: Russian ruble/US dollarI(30,7) (right axis)
Figure 5: Russian ruble: Exchange rate, April 1998-October 1998 and I7,30,t
ceding the actual occurrence of the Russian crisis. In this sense, as the crisisapproached, they tended to consider the event increasingly imminent. Apartfrom this medium-run trend in I7,30,t, the indicator presents relevant increasesin the end of May, mid July and a global peak following the announcementof the devaluation, which precedes the change in the exchange rate regime byseven (working) days. The first peak, on May 28th, takes place right after theCentral Bank increased key interest rate to 150 % and is followed by a seriesof interventions in the coming days (involving the expenditure of $1 billionin reserves) in a successful attempt to defend the ruble (see e.g. Chiodo andOwyang, 2002). The indicator declines in the following days, and follows thepositive trend that dominates the full period. The second signal of a shift in ex-pectations to an imminent devaluation takes place starting in early July. The
18
start of the increase coincides with the Russian parliament’s postponementof the policy reforms needed to qualify for IMF loans. Expectations of crisistiming shift away from one week with the final approval of an IMF emergencyloan to Russia in mid-July. Finally, our indicator increases dramatically in theperiod August 10-18 in parallel to the collapse of the stock and bond markets(August 13) and in spite of Boris Yeltsin’s declarations that “there will beno devaluation” of the ruble following an emergency parliamentary session onAugust 14. Our indicator only stabilizes on August 21, when the Russian crisiscan already be felt in markets all around the world. Although our indicatorpeaks when the crisis is already being felt, the increase in I7,30,t is strong upto seven days before the devaluation announcement. The dynamics of the in-dicator remain unchanged if the inflation expectation correction is carried out.8
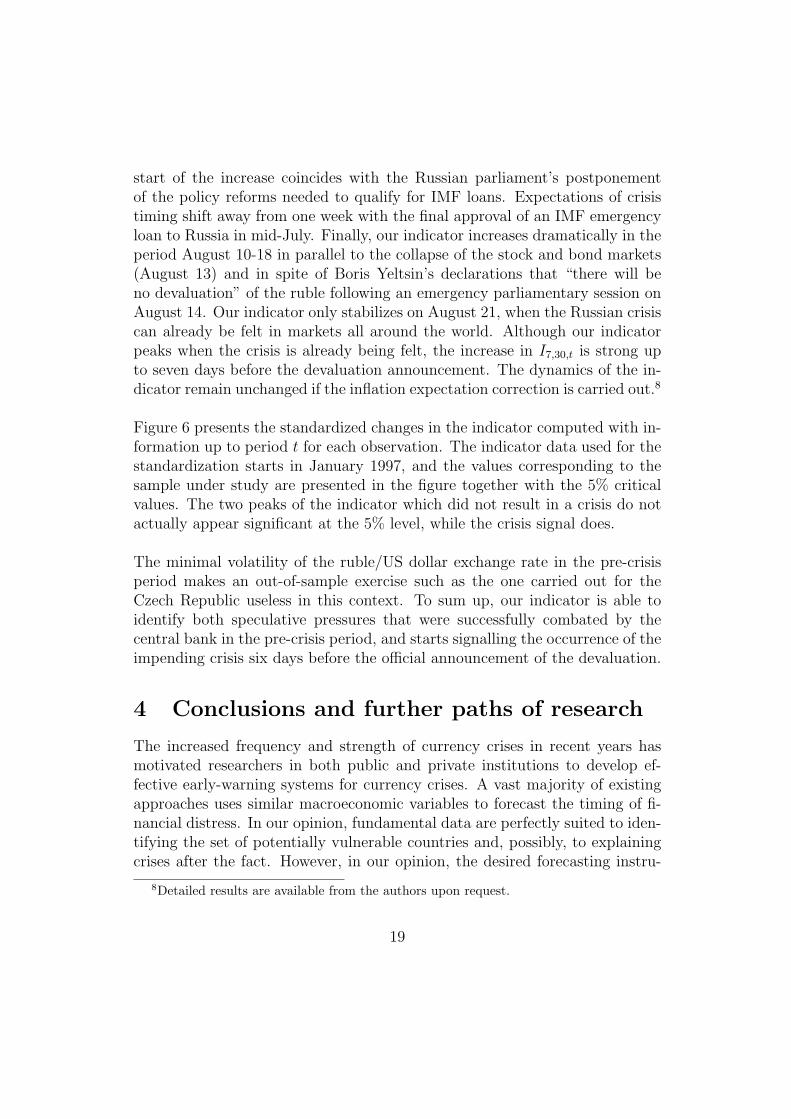
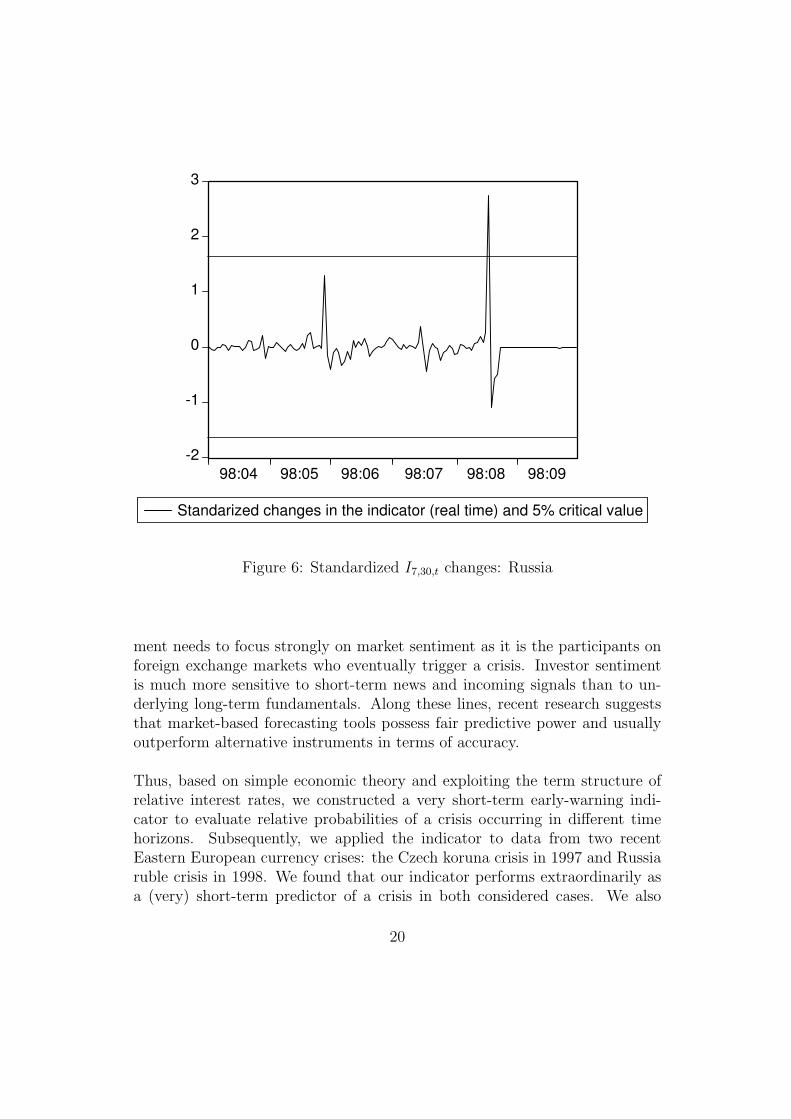
Figure 6 presents the standardized changes in the indicator computed with in-formation up to period t for each observation. The indicator data used for thestandardization starts in January 1997, and the values corresponding to thesample under study are presented in the figure together with the 5% criticalvalues. The two peaks of the indicator which did not result in a crisis do notactually appear significant at the 5% level, while the crisis signal does.
The minimal volatility of the ruble/US dollar exchange rate in the pre-crisisperiod makes an out-of-sample exercise such as the one carried out for theCzech Republic useless in this context. To sum up, our indicator is able toidentify both speculative pressures that were successfully combated by thecentral bank in the pre-crisis period, and starts signalling the occurrence of theimpending crisis six days before the official announcement of the devaluation.
4 Conclusions and further paths of research
The increased frequency and strength of currency crises in recent years hasmotivated researchers in both public and private institutions to develop ef-fective early-warning systems for currency crises. A vast majority of existingapproaches uses similar macroeconomic variables to forecast the timing of fi-nancial distress. In our opinion, fundamental data are perfectly suited to iden-tifying the set of potentially vulnerable countries and, possibly, to explainingcrises after the fact. However, in our opinion, the desired forecasting instru-
8Detailed results are available from the authors upon request.
19
-2
-1
0
1
2
3
98:04 98:05 98:06 98:07 98:08 98:09
Standarized changes in the indicator (real time) and 5% critical value
Figure 6: Standardized I7,30,t changes: Russia
ment needs to focus strongly on market sentiment as it is the participants onforeign exchange markets who eventually trigger a crisis. Investor sentimentis much more sensitive to short-term news and incoming signals than to un-derlying long-term fundamentals. Along these lines, recent research suggeststhat market-based forecasting tools possess fair predictive power and usuallyoutperform alternative instruments in terms of accuracy.
Thus, based on simple economic theory and exploiting the term structure ofrelative interest rates, we constructed a very short-term early-warning indi-cator to evaluate relative probabilities of a crisis occurring in different timehorizons. Subsequently, we applied the indicator to data from two recentEastern European currency crises: the Czech koruna crisis in 1997 and Russiaruble crisis in 1998. We found that our indicator performs extraordinarily asa (very) short-term predictor of a crisis in both considered cases. We also
20
provided evidence that the indicator contains extra information about futureshort-run exchange rate changes.
As seen in the Russian case study, even false alarms from the market needto be taken seriously by central bankers and governments and all availableshort-term measures should be implemented. Likening our indicator to a ther-mometer, a high body temperature does not necessarily imply serious illness,but is always a reason for concern. In that sense, our indicator is useful formonetary policy institutions as an extra signalling instrument to complementlong-run warning mechanisms. Several improvements to the methodology usedin this piece of research can be implemented to refine the indicator. Amongpossible avenues of research, using information on the time-varying nature ofinterest rate volatility to proxy for developments in the risk premium may leadto improvements in the signalling properties of the estimator.
References
[1] Anzuini, A. and G. Gandolfo (2003), Can currency crises be forecast?, inInternational Economic Flows, Currency Crises, Investment and EconomicDevelopment: Essays in Memory of Vittorio Marrama (G. Gandolfo andF. Marzano, eds.), Roma, EUROMA, 2003.
[2] Begg, D. (1998), Pegging out: Lessons from the Czech exchange rate crisis,Journal of Comparative Economics, 26, 669-690.
[3] Berg, A., Borensztein, E. and C. Patillo (2004), Assessing Early WarningSystems: How Have They Worked in Practice?, IMF WP/04/52.
[4] Calvo, G. and C.M. Reinhart (2002), Fear of floating, Quarterly Journalof Economics, CXVII, 379-408.
[5] Chiodo, A.J. and M. T. Owyang (2002), A case study of a currency cri-sis: The Russian default of 1998, Federal Reserve of St. Louis Review,Nov./Dec. 2002, 7-18.
[6] Dooley, M., Folkerts-Landau, D. and P. Garber (2004), The Revived Bret-ton Woods System: The Effect of Periphery Intervention and Reserve Man-agement on Interest Rates and Exchange Rates in Center Countries, NBERWorking Paper No. 10332.
21
[7] Collins, S. (1984), Exchange rate expectations and interest parity duringcredibility crises - The French franc, March 1983, Harvard Institute ofEconomic Research, Discussion Paper 1080.
[8] Diebold, F. X and R.S. Mariano (1995), Comparing Predictive Accuracy,Journal of Business and Economic Statistics, 13, 253-63.
[9] Fischer, S. (2001), Exchange Rate Regimes: Is the Bipolar View Correct?,Finance & Development, 38, 1-8.
[10] Hausmann, R. and F. Sturzenegger (2005), Global imbalances or badaccounting? The missing dark matter in the wealth of nations. Mimeo,Harvard University.
[11] Horvath, J. (1999), Currency Crisis in the Czech Republic in May 1997,Post-Communist Economies, 11, 277-298.
[12] Kaminsky, G., Lizondo, S. and C. M. Reinhart (1998), Leading Indicatorsof Currency Crises, International Monetary Fund Staff Papers, 45, 1-48
[13] Kharas, H., Pinto, B. and S. Ulatov (2001), An analysis of Russia’s 1998meltdown: Fundamentals and market signals, Brookings Papers on Eco-nomic Activity, 2001, 1, 1-50.
[14] Roubini, N. and B. Setser (2005), Will the Bretton Woods 2 RegimeUnravel Soon? The Risk of a Hard Lending in 2005-2006?, presented at theSymposium Revived Bretton Woods System: A New Paradigm for AsianDevelopment? organized by the Federal Reserve Bank of San Franciscoand UC Berkeley, San Francisco, February 4th, 2005.
[15] Wolfers, J. and E. Zitzewitz (2004), Prediction markets, NBER WorkingPaper No. 10504.
22

University of Innsbruck – Working Papers in Economics and Statistics Recent papers 2007-13 James B. Davies, Martin Kocher and Matthias Sutter: Economics research
in Canada: A long-run assessment of journal publications. Revised version forthcoming in: Canadian Journal of Economics.
2007-12 Wolfgang Luhan, Martin Kocher and Matthias Sutter: Group polarization in the team dictator game reconsidered. Revised version forthcoming in: Experimental Economics.
2007-11 Onno Hoffmeister and Reimund Schwarze: The winding road to industrial safety. Evidence on the effects of environmental liability on accident prevention in Germany.
2007-10 Jesus Crespo Cuaresma and Tomas Slacik: An “almost-too-late” warning mechanism for currency crises.
2007-09 Jesus Crespo Cuaresma, Neil Foster and Johann Scharler: Barriers to technology adoption, international R&D spillovers and growth.
2007-08 Andreas Brezger and Stefan Lang: Simultaneous probability statements for Bayesian P-splines.
2007-07 Georg Meran and Reimund Schwarze: Can minimum prices assure the quality of professional services?.
2007-06 Michal Brzoza-Brzezina and Jesus Crespo Cuaresma: Mr. Wicksell and the global economy: What drives real interest rates?.
2007-05 Paul Raschky: Estimating the effects of risk transfer mechanisms against floods in Europe and U.S.A.: A dynamic panel approach.
2007-04 Paul Raschky and Hannelore Weck-Hannemann: Charity hazard - A real hazard to natural disaster insurance.
2007-03 Paul Raschky: The overprotective parent - Bureaucratic agencies and natural hazard management.
2007-02 Martin Kocher, Todd Cherry, Stephan Kroll, Robert J. Netzer and Matthias Sutter: Conditional cooperation on three continents.
2007-01 Martin Kocher, Matthias Sutter and Florian Wakolbinger: The impact of naïve advice and observational learning in beauty-contest games.

University of Innsbruck Working Papers in Economics and Statistics 2007-10 Jesus Crespo Cuaresma and Tomas Slacik An "Almost-Too-Late" Warning Mechanism For Currency Crises Abstract We propose exploiting the term structure of relative interest rates to obtain estimates of changes in the timing of a currency crisis as perceived by market participants. Our indicator can be used to evaluate the relative probability of a crisis occurring in one week as compared to a crisis happening after one week but in less than a month. We give empirical evidence that the indicator performs well for two important currency crises in Eastern Europe: the crisis in the Czech Republic in 1997 and the Russian crisis in 1998. ISSN 1993-4378 (Print) ISSN 1993-6885 (Online)